As the number of parameters increases, so does the complexity of spectral panel design. Key considerations include managing fluorochrome compatibility, optimizing signal-to-noise ratios, and minimizing spectral overlap. Like CFC, SFC requires a careful handling of autofluorescence, which can significantly impact data interpretation. The absence of standardized workflows for panel optimization further complicates assay development.
Rigorous assay validation is essential for clinical deployment of SFC. Current gaps in regulatory alignment include the absence of protocols tailored to the spectral platform. Sensitivity thresholds, reproducibility across platforms, and rare-event detection remain areas in need of refinement. Validation must also encompass software tools used for spectral unmixing and data analysis, which are not yet uniformly regulated. To support clinical adoption, protocols must align with key regulatory standards such as ISO 15189, CLSI guidelines (e.g., EP17-A2, EP05-A3, H62), and CE-IVD or U.S. Food and Drug Administration (FDA) requirements [
32,
33,
34,
35,
36,
37,
38,
39]. For clinical flow cytometry laboratories that participate in the College of American Pathologists (CAP) accreditation programs, a specific flow cytometry checklist, including sections on proficiency testing, quality management and quality control, and procedures and test systems, is used in conjunction with the ‘All Common and Laboratory General Checklists’ during regular on-site inspections for laboratory compliance.
Instrument setup and ongoing performance monitoring are critical for ensuring data quality in SFC. Unlike CFC, spectral instruments require precise calibration for accurate unmixing and signal detection. Long-term standardization efforts are lacking, making it difficult to compare results across instruments with different laser configurations or from different manufacturers, sites, or time points. Development of harmonized protocols and multicenter reproducibility studies are urgently needed.
3.2. Regulatory Requirements
SFC is a powerful clinical diagnostic tool that faces significant regulatory challenges due to stringent compliance requirements imposed by bodies such as the U.S. FDA and the European Medicines Agency (EMA). To ensure safety, efficacy, and quality, the FDA in the United States mandates that any diagnostic device—including those based on SFC—undergo a thorough pre-market approval process involving extensive clinical validation studies that demonstrate reliable detection and quantification of specific cellular markers, particularly in complex applications like MRD detection [
34,
42,
43]. Devices must meet performance standards for sensitivity, specificity, and reproducibility across various conditions. The recent FDA ‘Final Rule’ has clarified that lab-developed tests (LDTs), previously subject to enforcement discretion, are now classified as medical devices under 21 CFR Part 809, initiating a five-stage phaseout policy over the next four years [
43]. While a recent summary judgement from the United States District Court, Eastern District of Texas, concluding “that the final rule exceeds FDAs statutory authority” has overturned the ‘Final Rule’ in its current state, it remains to be seen what the regulatory framework will look like for LDTs moving forward.
In Europe, the EMA enforces compliance via the In Vitro Diagnostic Medical Device Regulation (IVDR), fully applicable since May 2022. Like the FDA, the IVDR requires manufacturers to provide clinical evidence supporting a device’s analytical and clinical validity, as well as its risk–benefit profile. However, the IVDR’s emphasis on post-market surveillance—continuous monitoring and reporting of a device’s performance—presents additional challenges.
Meeting these regulatory demands is resource-intensive, requiring large datasets that demonstrate a consistent performance across diverse patient populations and conditions—a particular burden for smaller companies or research institutions. Moreover, as for conventional flow cytometry, the complexity of SFC, including variability in instrument settings, sample preparation, unmixing strategies, and data analysis protocols, can lead to significant outcome differences if not tightly controlled across laboratories. As regulatory frameworks evolve to address emerging risks, manufacturers and clinical laboratories must continuously update their practices to remain compliant. As of 2025, only the Cytek Northern Lights system has been cleared for diagnostic in vitro use in China. No SFC instruments have yet received FDA or IVDR approval for clinical diagnostics in the U.S. or EU.
Improving reproducibility and regulatory compliance in SFC requires standardizing protocols, advancing validation techniques, and fostering collaboration among regulators, academia, and the industry. Enhanced training, sharing best practices, and artificial intelligence (AI) integration for data analysis and error detection can streamline validation processes, though these advances also introduce new regulatory challenges that demand clear guidelines and algorithm validation (
Figure 2).
3.3. Panel Design Complexity
Spectral technology has greatly enhanced flow cytometry multiplexing by capturing the full spectral fingerprint of each dye across all detectors, rather than relying solely on peak signals. This expanded capability allows for larger panels and increased flexibility in reagent selection; however, it demands meticulous fluorochrome selection to avoid spectral overlap and avoid a loss in resolution due to spectral overlap not due to the choice of fluorochromes, but rather due to inadequate reference controls, as proper controls are needed for accurate unmixing (for a detailed discussion, see
Section 3.12 on proper controls). Metrics such as similarity and complexity indices help ensure that unique fluorochromes are chosen. Moreover, dye chemistry plays a critical role: tandem dye can have emission variation across lots, requiring re-titration when a new lot is purchased [
44,
45,
46]. Similarly, the use of polymer-based dyes like Brilliant Violet™ (Brilliant Violet™; BioLegend, San Diego, CA, USA) and RealBlue™ (RealBlue™; BD Biosciences, San Jose, CA, USA) requires specific blocking buffers to prevent non-specific interactions and ensure accurate staining [
47].
In high-parameter panels, the limited availability of antibodies conjugated to diverse fluorochromes often forces trade-offs in design. Understanding and managing spectral overlap is essential for a clear marker resolution. For example, Futamura et al. (2015) highlighted challenges with spectrally adjacent fluorochromes such as AcGFP and FITC, where high intensity ratios complicate signal separation [
48]. Similarly, one-way spillover between pairs like APC and APC-Cy7 can produce elongated, elliptical data distributions, further complicating analysis. To mitigate these issues, spectral unmixing algorithms have been developed to leverage unique spectral profiles for an enhanced wavelength resolution and more accurate analysis, particularly in immunology and cancer research [
49].
After selecting fluorochromes, assigning them to markers is crucial—brighter fluorochromes should be matched with low-expression markers to maximize the resolution and based on co-expression. Incorporating metrics like the stain index reduction or spillover spreading value can allow for assessing the potential data distortion. Additionally, considering co-expression patterns during panel design minimizes spillover among frequently co-expressed markers, ensuring optimal data quality. A detailed marker-by-marker review, leveraging tools such as the single stain index (SSI) equation, followed by antibody titration, helps reduce non-specific binding and background noise, thereby enhancing the target signal [
3].
Following fluorochrome assignment and titration, gating controls—optimized using fluorescence-minus-one (FMO) or fluorescence-minus-multiple (FMM/FM-X) controls—are essential to account for signal spread. Spectral reference controls (SRCs) further aid in reliable unmixing and evaluating the impact of signal spread and fluorochrome overlap [
14]. If problems arise, adjustments such as modifying antibody concentrations, sequential reagent addition, or reassigning fluorochromes can help mitigate false positives and negatives, ensuring robust data across both spectral and conventional flow cytometry platforms. Ultimately, each marker requires a unique fluorochrome with minimal overlap, a principle that underpins effective panel design, as highlighted by Park LM et al. (2024) [
30,
50].
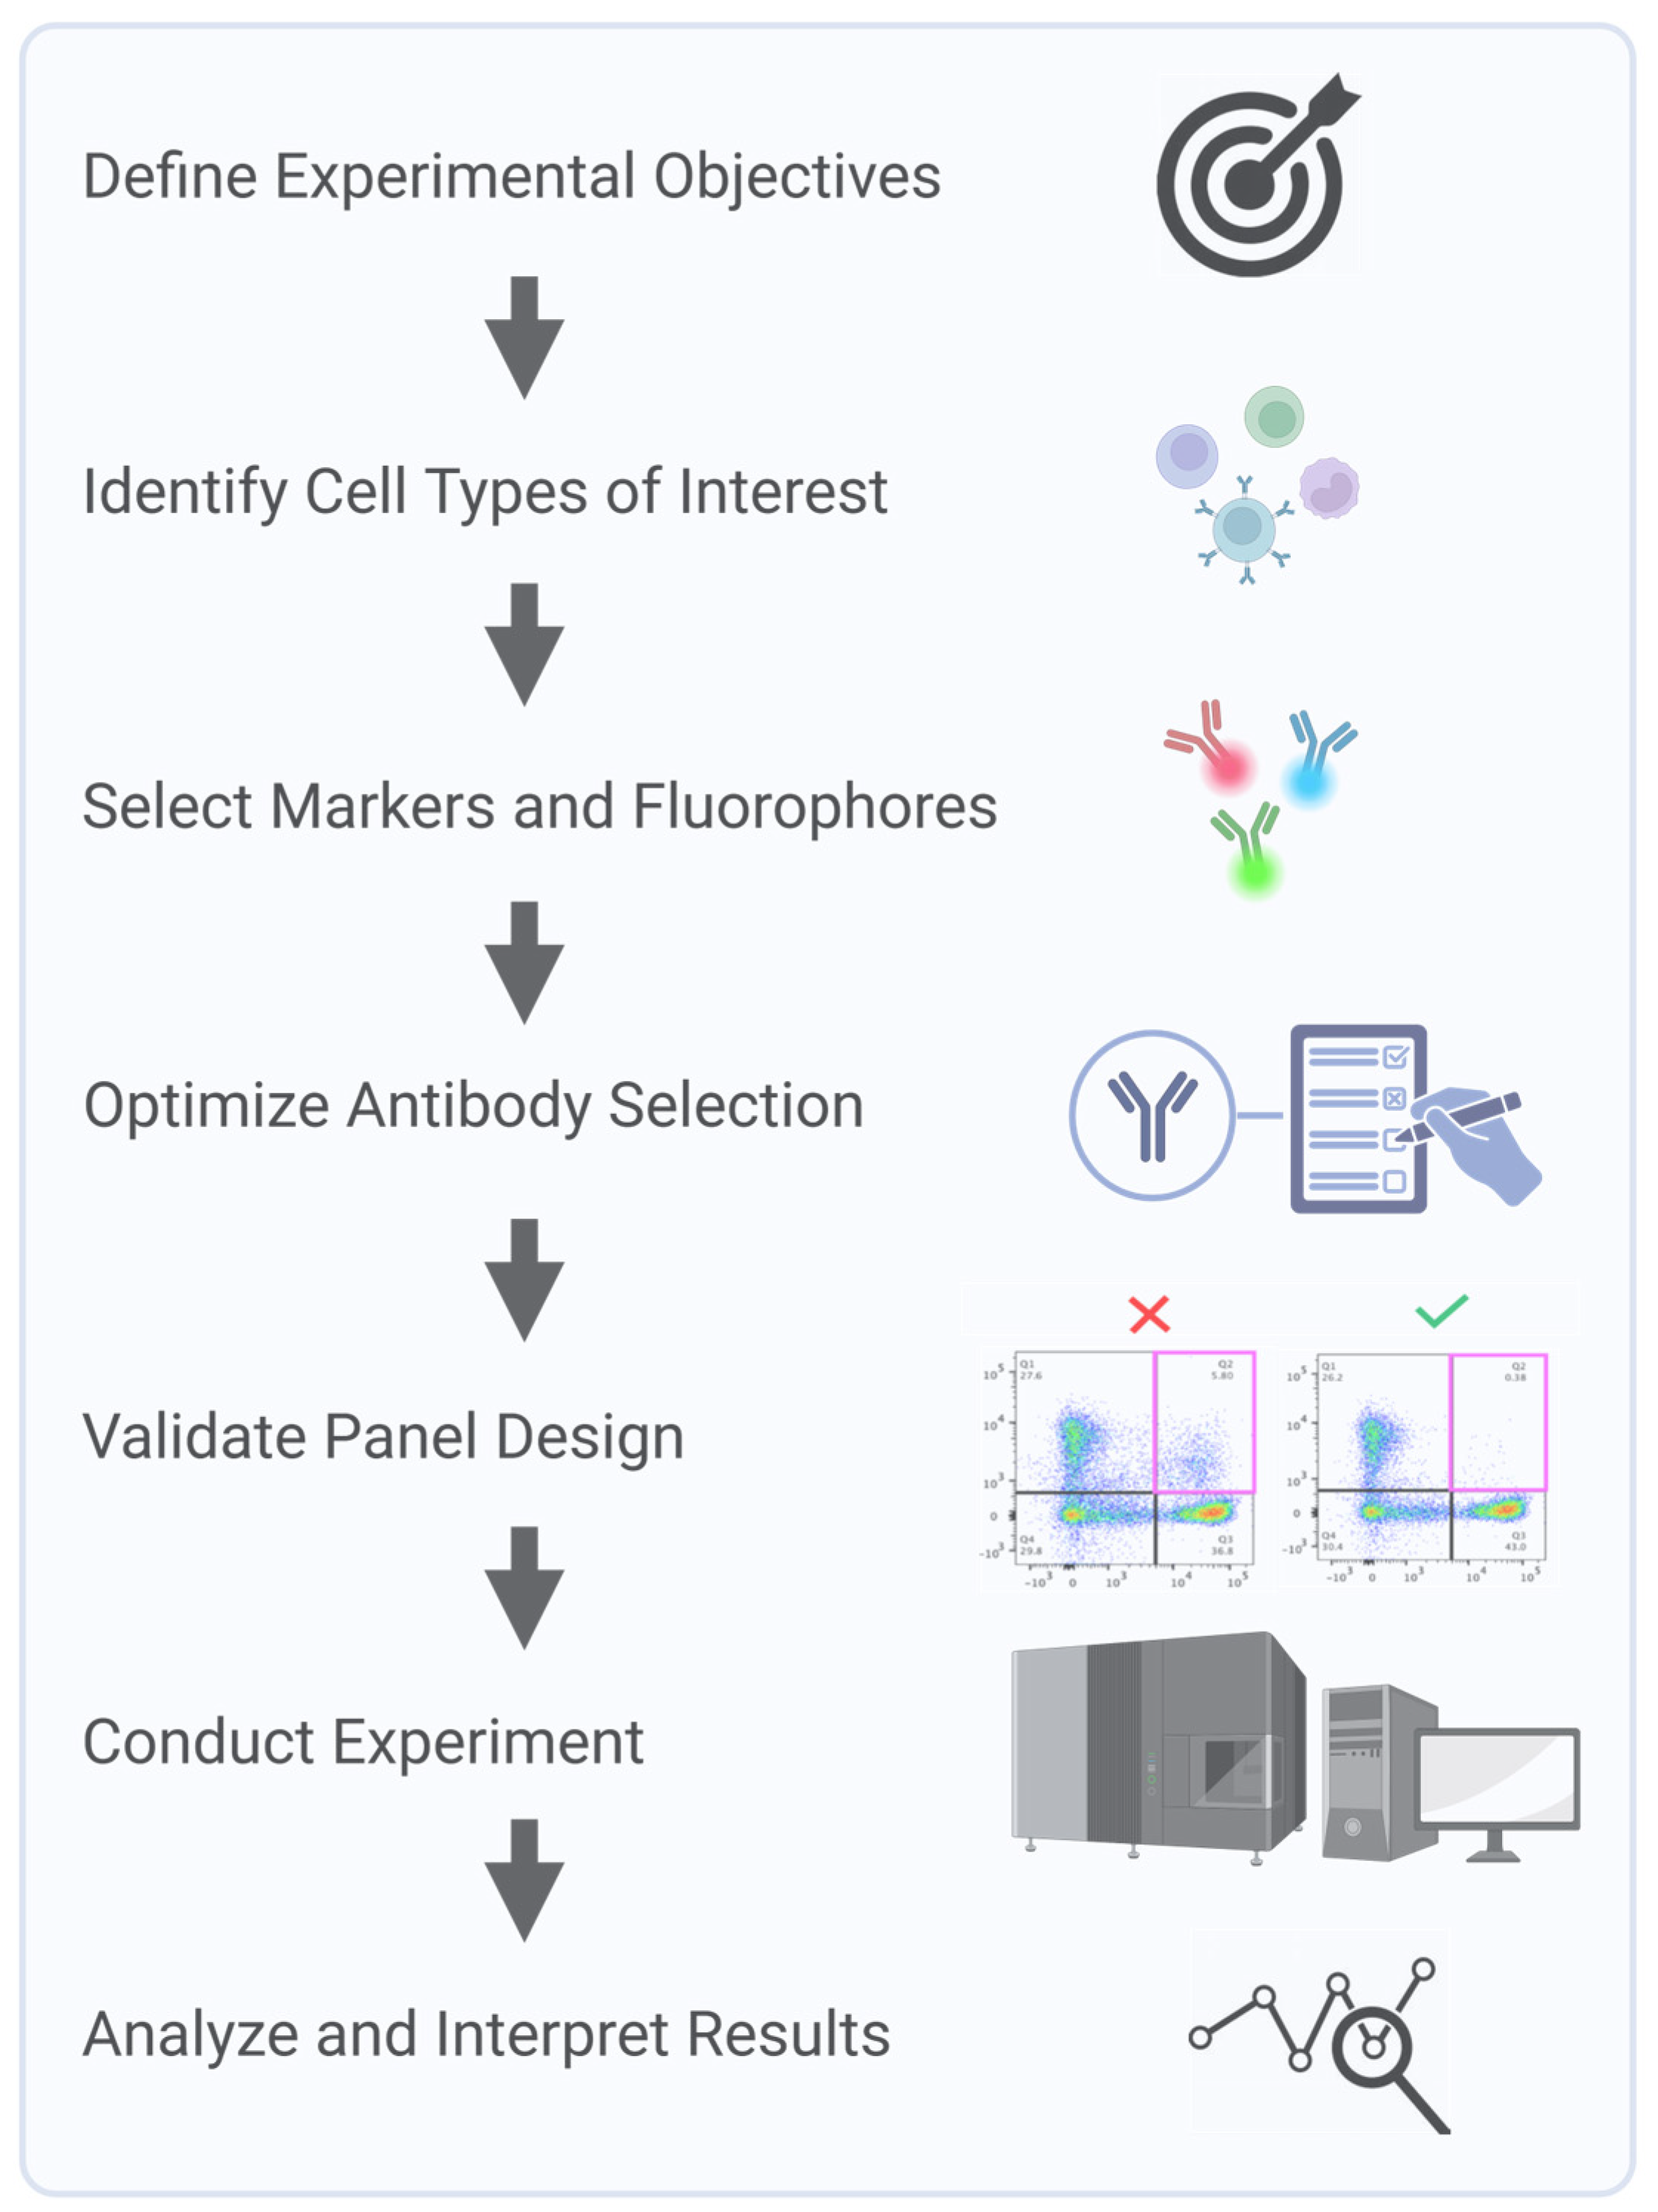
Clinical flow panels for spectral cytometry can incorporate up to dozens of markers. Successful design of these high-dimensional panels requires iterative testing and validation to account for inter-individual variability in marker expression and to ensure a consistent performance across patient populations [
22]. Furthermore, the investigator must understand the biology of the samples being interrogated. For example, in leukemia, expression levels and co-expression patterns of markers can be observed that would never be encountered in normal blood cells. Consequently, during panel design and validation steps, clinically relevant samples representative of the range, and a combination of marker expressions that will be encountered, must be used. Panel design using only healthy donor samples will not recapitulate potential problems arising with ectopic or a co-expression of markers not seen in the normal population. Key steps in multicolor panel design and assay optimization for SCF accounts start with a process of defining the experimental question and identifying critical metrics, such as fluorescence intensity, marker frequency, or cell counts, to ensure the design focuses on collecting the most relevant data. Next, markers are carefully selected to accurately define the cell populations of interest, with details recorded in a cell identification table that includes key populations, markers, and co-expressions. Due to variability in marker expression across individuals and disease states, validation is critical to ensure a reliable detection across diverse samples. Key considerations, including target density, fluorochrome brightness, and antibody optimization, are integral to creating a successful and reproducible panel (
Figure 3).
3.4. Panel Optimization for Clinical Use
Optimizing multi-parameter panels for clinical use presents some challenges. In addition to basic challenges discussed in the preceding section, clinical assays must also account for operational and biological variability, the need for iterative testing, and the requirement for platform and assay standardization across laboratories.
Rigorous validation of unmixing algorithms is essential for ensuring reliability and reproducibility in SFC, not only in clinical applications, where accurate biomarker identification is crucial, but also in any context requiring standardized results across multiple sites or studies [
51]. Such validation typically involves cross-referencing unmixing outputs with known reference standards and evaluating algorithm performance under diverse experimental conditions to ensure consistent accuracy [
20,
52,
53]. In parallel, ongoing advances in fluorochrome panel design and SFC instrumentation aim to minimize spectral overlap, thereby reducing unmixing complexity and improving overall analytical reliability [
54]. Furthermore, integrating machine learning techniques into unmixing workflows is emerging as a promising strategy to further enhance accuracy in complex, high-dimensional analyses [
55,
56]. Ultimately, effectively resolving spectral overlap and continuously refining unmixing methods are critical for achieving reproducible SFC results across laboratories, enabling consistent multi-site studies and trials, and thereby advancing the technology’s broader applicability in both research and clinical domains.
3.5. Spectral Flow Cytometry Unmixing Is Enhanced by AI and Machine Learning
Machine learning (ML) and AI are addressing key challenges in SFC, including spectral overlap, noise, and variability across experiments. Traditional compensation methods often fail in high-dimensional panels, introducing artifacts and obscuring rare populations [
57]. Recently, a variety of computational tools and algorithms have been developed to improve spectral unmixing and data quality [
20,
58,
59]. AutoSpill is an algorithm that automates spillover matrix calculation using robust regression, and autofluorescence extraction simplifies the analysis of multicolor flow data and has been demonstrated to reduce iterative manual adjustments [
57], while blind unmixing approaches such as NMF-RI bypass the need for reference controls by employing non-negative matrix factorization rank initialization [
59]. This method can unmix highly complex, overlapping spectra without user-provided reference spectra, although it cannot be used in every scenario. Statistical models like Poisson regression improves accuracy for low-signal populations by explicitly modeling photon-counting noise. By treating the signal as a Poisson process, this approach accounts for the fact that measurement variance increases with signal intensity [
1]. AI methods such as genetic algorithms and autoencoders explore the high-dimensional parameter space to optimize unmixing. For example, genetic algorithms can iteratively evolve a population of unmixing solutions toward an optimal solution, and autoencoder neural networks can learn complex non-linear unmixing transformations [
58,
60]. Several supporting platforms have been developed to improve data quality prior to or during unmixing. FlowAI (FlowAI v1.8.4,
https://bioconductor.org/packages/flowAI, accessed on 14 June 2025) detects and removes anomalous events from flow data [
61] to ensure clean inputs. CytoNorm (v1.1.0,
https://github.com/saeyslab/CytoNorm, accessed on 14 June 2025) performs batch effect normalization [
62] to make fluorescence intensity distributions comparable across runs. Spectracular (Spectracular v1.0,
https://biosurf.org/spectracular, accessed on 14 June 2025) is an open-source tool that assists in optimized panel design and unmixing analysis [
63]. These advances improve unmixing accuracy, support reproducible high-dimensional analysis, and facilitate reliable diagnostics across clinical sites [
22,
63,
64].
3.6. Biological Variability
Genetic, environmental, and physiological factors can impact marker expression in biological samples such as blood and tissue, resulting in significant variability across individuals [
65,
66]. For example, in studies involving immune cell profiling, Odak et al. (2022) and Edwards et al. (2023) have found substantial variability in the expression of surface markers like CD4 and CD8 among healthy individuals, which can complicate the interpretation of immune responses [
12,
21]. Even within the same individual, different cell populations can express markers at varying levels. Biological samples are subject to dynamic changes due to factors such as disease progression, treatment responses, and circadian rhythms. These fluctuations can lead to inconsistent results when measuring marker expression over time [
6,
67]. For example, the expression of activation markers on T cells may vary during different phases of an immune response [
21,
68].
This intra-individual variability can be particularly pronounced in conditions such as cancer, where tumor microenvironments can influence the expression of immune checkpoint markers [
69]. For instance, the expression of programmed cell death protein 1 (PD-1/CD279) and check-point blockade of cytotoxic T lymphocyte antigen 4 (CTLA-4/CD152) may differ among tumor-infiltrating lymphocytes compared to circulating T cells [
70]. Intra-individual variability can be reflected in metabolic profiles. In the study of Heieis, G.A., et al., the authors demonstrate the impact of tissue-specific environments on macrophage metabolic profiles and adaptation [
71]. They reveal distinct metabolic phenotypes in macrophages across various tissues, where liver macrophages (Kupffer cells) display high levels of GLUT1, PKM, and CD98, while alveolar macrophages in lipid-rich environments exhibit high CD36 but low GLUT1 [
71].
Biological variability cannot be eliminated, but it can be characterized and taken into account. This can be achieved by careful panel design, selecting fluorochromes, markers, and clones that have demonstrated robustness across different populations [
21,
30,
72]. Implementing standardized protocols for sample collection, processing, and storage can reduce variability introduced by technical factors. For example, consistent methods for isolating peripheral blood mononuclear cells (PBMCs) help to minimize variations due to processing differences, or establishment of robust pipelines for high-throughput sample processing help reduce technical variability between batches [
18,
73]. Jensen and Wnek (2021) explored how different sample types—whole blood, fresh PBMCs, and cryopreserved PBMCs—affect the variability of immune cell populations using a standardized immunophenotyping panel designed for spectral cytometry [
14]. Their 25-marker panel, developed for the Cytek Aurora platform, was designed to identify a wide range of immune cell types (T cells, B cells, NK cells, monocytes, dendritic cells, myeloid-derived suppressor cells (MDSCs), etc.). The study evaluated how consistent the panel’s results were across these sample types and found that over 95% of the immune populations analyzed showed high precision, with variability under 20% for repeated measurements. However, certain markers (e.g., CXCR3 on memory CD4 T cells), were highly sensitive to storage conditions. This population increased dramatically—several fold—when blood samples were stored for 24 h before processing, highlighting the importance of storage conditions. Similarly, PBMC isolation and cryopreservation caused noticeable changes in some markers and rare cell populations compared to donor-matched fresh blood samples. Specifically, significant changes were observed in the ratio of CD14hiCD16lo/CD14loCD16hi monocytes, the CD4/CD8 T cell ratio, a shift from naïve CD45RA + regulatory T cells to memory CD45RA−Tregs, disruption of CD38 expression on CD4 T cells, and increased M-MDSCs and Th1 cells. This research emphasizes the reliability of the panel for immune monitoring in clinical studies while underscoring the need to carefully manage sample handling and storage to ensure accurate results [
14].
Biological variability poses key challenges in spectral flow cytometry, especially when applying panels optimized on healthy donors to disease samples like chronic lymphocytic leukemia (CLL). CLL samples typically contain extremely high B-cell frequencies and altered antigen expression, such as dim CD20, CD22, and Ig light chains, and aberrant CD5 expression on B cells [
74,
75]. These deviations can impair marker resolution, particularly when gating strategies rely on internal negative populations that may be absent.
High B-cell counts can also saturate antibody reagents or detectors, reducing quantitative reliability. If antibodies optimized for healthy samples are underdosed, target sites may be incompletely stained; if overdosed, detector saturation and spillover may occur, particularly with bright fluorochromes [
76]. Reagent titrations must account for these shifts, and optimal fluorochrome pairing (e.g., bright dyes for dim markers) is essential [
77].
Autofluorescence and unmixing accuracy can vary due to shifts in cellular composition. Spectral panels may require adjusted controls or unmixing algorithms when applied to CLL-dominant samples. Dim marker detection also suffers if panel assumptions about antigen brightness do not hold, as seen in clonal light chain restriction or dim CD20 staining [
75].
Panel misinterpretation is a clinical risk. For example, a follicular lymphoma case was initially misclassified as CLL due to overlapping marker expression [
78]. The EuroFlow consortium (Groningen, The Netherlands) recommends validating panels on both healthy and malignant samples to avoid such pitfalls [
79].
3.7. Examples of Complex Panels and Their Clinical Applications
A complex SFC panel used for deep immunophenotyping in hematological malignancies such as acute lymphoblastic leukemia (ALL) or acute myeloblastic leukemia (AML), that includes markers for various cell surface proteins, differentiation antigens, and intracellular signaling molecules, allows for the comprehensive analysis of different leukocyte subsets, including rare populations that may indicate MRD [
22,
23]. The complexity of these panels lies not only in the large number of markers but also in the need to accurately detect and quantify these rare populations against a background of normal cells [
2,
22,
23,
63,
80,
81]. Another example is the use of SFC panels in immune monitoring during cancer immunotherapy. These panels often include markers for T-cell activation, exhaustion, and memory status, as well as markers for other immune cell types such as natural killer (NK) cells and dendritic cells [
82]. The goal is to monitor the immune response to therapy and identify biomarkers that can predict treatment outcomes. The complexity here arises from the need to track multiple immune cell subsets simultaneously while ensuring that the panel is sensitive enough to detect subtle changes in marker expression that may be clinically significant.
The high-dimensional capabilities of SFC offer significant advantages over CFC in detecting rare leukemic phenotypes that could have diagnostic or prognostic significance. For example, SFC can simultaneously track co-expression patterns across 20+ markers, enabling the identification of aberrant combinations that would be impossible to detect with conventional 8–10-color panels. This is particularly valuable in cases where leukemic blasts display only subtle deviations from normal differentiation pathways or express unusual marker combinations. Even when leukemic cells comprise < 0.01% of the total population, SFC’s enhanced resolution can distinguish these cells based on their unique spectral signatures [
2,
22,
23,
80]. This capability could potentially improve MRD detection thresholds and reveal previously uncharacterized leukemic stem cell populations with distinct treatment response profiles [
48,
81]. While continued research is needed to fully document specific immunophenotypes that are exclusively detectable by SFC, the technology’s ability to capture the full complexity of the leukemic landscape represents a significant advancement in hematological diagnostics.
To address the challenges of panel complexity in SFC, future efforts should focus on developing more sophisticated dyes, advanced software tools for spectral unmixing, and standardized panel design practices. While many traditional fluorochromes used in CFC—such as FITC, PE, and APC—are also compatible with SFC, several proprietary dye families have been developed to exploit the unique capabilities of SFC and overcome key limitations of legacy dyes. Proprietary fluorochromes such as BD RealYellow™ and RealBlue™ (BD Biosciences, San Jose, CA, USA), BioLegend Spark™ and Fire™ (BioLegend, San Diego, CA, USA), Bio-Rad StarBright™ (Bio-Rad Laboratories, Hercules, CA, USA), Thermo Fisher NovaFluor™ (Thermo Fisher Scientific, Waltham, MA, USA), and Biotium CF
® (Biotium, Inc., Fremont, CA, USA) dyes offer enhanced brightness, reduced spillover, minimal cross-laser excitation, and spectral uniqueness, all of which improve resolution and enable higher-dimensional panel design [
83,
84,
85,
86]. For example, RealYellow 586 matches the brightness of PE but with significantly less cross-laser excitation, reducing background in blue-laser channels and allowing PE and RY586 to be used together—an advantage unique to SFC [
84]. NovaFluor dyes offer narrow, clean emission profiles and low spectral spread, which lowers error propagation during unmixing and improves the separation of dim populations [
85]. BioLegend’s Fire™ tandems, like APC/Fire 810, exploit far-red and near-infrared ranges largely unused in CFC, thus expanding the number of usable parameters in a single panel [
83]. StarBright dyes, based on nanoparticle technology, provide exceptional brightness and spectral distinctiveness but are not yet validated for intracellular staining (Bio-Rad, 2023). Meanwhile, Biotium’s CF
® dyes, PEGylated for high solubility and low non-specific binding, contribute to cleaner staining profiles in complex tissues [
87]. These dyes also address CFC limitations like tandem dye instability, autofluorescence sensitivity, and limited laser channel utilization. Nevertheless, proprietary dyes may require additional considerations—such as Fc-blocking buffers or spectral reference updates—and availability for some targets remains limited. Overall, their engineered spectral and chemical properties offer tangible advantages in high-parameter SFC, supporting more flexible and accurate panel design than conventional fluorochromes allow [
86,
88].
Automated panel design algorithms have been developed to support researchers in creating optimized panels for SFC. For example, EasyPanel (Version 2.0) is an intelligent tool that suggests panel configurations based on user-defined inputs, helping to streamline the design process for both traditional and spectral cytometers (flow-cytometry.net). Similarly, Cytek
® Biosciences (Cytek Biosciences; Fremont, CA, USA) offers the SpectroPanel tool (Version 1.0), which automates fluorochrome-marker assignments (based on reagent brightness, emission profile, and spread, as well as antigen density and co-expression patterns), reducing the manual effort required to initiate panel development (
cytekbio.com). While these tools can facilitate initial design steps and manage the complexity of high-parameter SFC, it is important to note that their effectiveness depends on underlying assumptions. Many current algorithms do not fully account for critical biological variables such as marker co-expression, antigen density, or expression modulation following treatment. Therefore, expert review and empirical validation remain essential to ensure robust and biologically relevant panel performance.
New dyes like Real Yellow™ and Real Blue™, APC/Fire™, PE/Fire™, and PerCP/Fire™ have unique emission profiles which enable greater flexibility in panel design, when paired with widely used fluorochromes. Spark Dyes provide reliable results with their narrow profiles and resistance to quenching from fixation buffers. Bio-Rad’s StarBright Dyes excel with unique spectral signatures and the absence of cross-laser excitation, delivering exceptional brightness for resolving rare populations and low-density antigens. Biotium’s CF
® dyes and Cytek cFluor dyes address issues such as non-specific binding and aggregation through pegylation, ensuring consistent performance across visible, far-red, and near-IR spectra. NovaFluors™, developed with the Phiton™ platform, (Thermo Fisher Scientific., Waltham, MA, USA) eliminates cross-laser excitation, offers clean emission profiles to reduce signal spread, and features digital brightness for precise tuning to antigen density, supporting deeper phenotyping and panel expansion. It is also important to highlight potential limitations of some of these fluorochromes, including tandem stability, as shown by Park et al. for PE/Fire™ 810 and PerCP-eFluor™ 710 [
30]. The summary of fluorochrome families for SFC applications is presented in
Table 2. Issues with Novafluor performance have also been reported [
30].
In addition to dye development, a distinct category of advanced analytical software tools incorporating machine learning algorithms is essential for managing high-parameter panels. Unlike the previously mentioned panel design tools that focus on initial fluorochrome-marker assignments, these more sophisticated analytical platforms address the downstream challenges of complex spectral data. These advanced tools can predict spectral overlap with greater precision than traditional compensation matrices, dynamically optimize fluorochrome selection based on instrument-specific configurations, and provide real-time assistance for panel troubleshooting and refinement. Examples include SpectroFlo® software (SpectroFlo® version 2.2) with its automated unmixing algorithms, FlowJo™ (FlowJo, LLC., Ashland, OR, USA) Spectral Unmixing Wizard for post-acquisition analysis, and emerging AI-based platforms that can adapt to instrument-specific variations and predict optimal panel configurations based on continuously updated spectral libraries.
Standardization efforts should also be prioritized, including the creation of universal guidelines and reference panels that enable cross-laboratory comparisons and benchmarking.
Table 3 provides an updated overview (as of January 2025) of published optimized multicolor immunophenotyping (OMIP) panels that employ spectral flow cytometry for human cellular subset analysis (
Table 3). Collaboration between academic researchers and industry partners will be key to accelerating the development, validation, and implementation of complex panels. By leveraging the strengths of both sectors, these partnerships can address the technical and logistical challenges of panel complexity, ensuring the continued advancement of spectral cytometry.
3.8. Validation of Spectral Flow Cytometry Assays Is a Critical Step in Clinical Biomarker Measurement and Monitoring
The validation of SFC-based assays is fundamental, as it is for any other flow cytometry assay, to ensure the reliability and reproducibility of data, particularly in clinical applications where biomarker detection plays a pivotal role in diagnosis, prognosis, and therapeutic monitoring. Assays must be validated to confirm they measure the intended analytes with accuracy, precision (repeatability and reproducibility), sensitivity (limit of detection), and specificity, to ensure that any observed variation can be attributed to biology, as outlined by the International Conference on Harmonization (ICH) guidelines [
34]. This validation process becomes even more stringent when translated into regulatory settings, where compliance with guidelines from agencies such as the U.S. FDA or EMA is required. These regulatory frameworks mandate robust validation to prevent false positives or negatives, which could have direct clinical consequences. However, to date, the CAP flow cytometry checklist is not updated for spectral cytometry [
7].
Only after the assay is properly developed should the validation process begin. The complexity of the validation protocol depends on several factors, which include the number of instruments, laboratories, operators, and the context of use (COU) of the assay. These factors will determine which parameters, such as precision (repeatability and reproducibility—intermediate precision, inter-operator and inter-instrument variability), detection capability (limit of blank—LoB and lower limit of quantification—LLoQ), stability, and carry-over, should be included for evaluation [
35].
Advanced computational approaches are also being integrated into validation pipelines to account for the high-dimensional data generated by spectral cytometry [
20,
30,
73,
77].
In clinical settings, validated assays are crucial for producing reliable data that guide patient management. Without thorough validation, clinicians cannot confidently interpret complex datasets, risking misclassification of cell populations, misdiagnosis, or making inappropriate treatment decisions [
91]. Recently, Jensen and Wnek (2021) outlined the validation of a 25-marker spectral cytometry immune monitoring assay, incorporating key steps to ensure its reliability and reproducibility [
14]. Their process included antibody validation to confirm specificity, sensitivity, and cross-reactivity, ensuring antibodies’ performance in the assay; standardized sample preparation protocols to minimize variability in blood collection, PBMC isolation, and cryopreservation; and data analysis, where a standardized hierarchical gating strategy was developed within the study parameters. While traditional manual gating approaches (including hierarchical strategies) are inherently subject to operator variability, the authors implemented specific controls like gating templates and consensus review to maintain consistency across operators. Importantly, they also compared these manual approaches with FlowSOM (Bioconductor (R package), typically v1.24.0) analysis (an automated clustering tool) to validate the complementary strengths of both methods [
92]. This comparison highlights the emerging best practice of leveraging both human expertise and computational approaches for high-dimensional data analysis. Manual gating provided interpretable biological insights while automated methods offered enhanced objectivity and reproducibility, particularly valuable for the complex spectral signatures in high-parameter cytometry. They assessed intra-assay precision by analyzing healthy donor samples in replicates, calculating % coefficient of variation (CV) for measurement consistency. Stability testing evaluated sample durability through blood storage, PBMC isolation, and cryopreservation to maintain population consistency. Finally, performance characterization assessed analytical robustness. In their validation, the authors found that over 95% of gated populations showed high precision across experimental replicates. However, the phenotypic E-MDSC (myeloid-derived suppressor cell) population did not meet this standard, as it exhibited poor repeatability in blood samples, with a %CV exceeding 20%, or was unmeasurable in PBMCs due to a cell count below 100 with the acquisition settings used. After PBMC isolation, 42 out of 49 gated immune cell populations (86% after 24 h) remained stable, indicating minimal changes in cell numbers for most populations. Plasmacytoid dendritic cells (pDCs) and CD15 + CD11b + low-density granulocytes (LDGs) exhibited statistically significant differences in cell counts between blood samples and isolated PBMCs, suggesting some variability in these subsets due to isolation. In terms of cryopreservation, the authors reported that 36 out of 49 gated populations (73%) did not exhibit significant changes after storage at −80 °C for 7 or more days. However, there were notable changes in specific populations, including shifts in the CD4/CD8 ratio and an increase in M-MDSCs.
Given the increasing importance of cytometry in personalized medicine, it is necessary to adhere to guidelines (CLSI H62) for a more standardized approach to flow cytometry assay validation across clinical laboratories globally [
93]. Consideration must also be given to expanding current guidelines, creating requirements for proper reference controls, and establishing reference testing programs, as well as tools and workflows for fast and robust data analysis. As spectral cytometry continues to evolve, the integration of AI/ML approaches with traditional validation methods will likely become standard practice, offering solutions to the inherent limitations of manual analysis while preserving the biological insights that come from expert interpretation.
3.9. The Critical Role of Standardization in Spectral Clinical Flow Cytometry: Addressing Variability Across Laboratories
Standardization of instrument setup, laboratory procedures, and analysis protocols is essential when a flow cytometry assay is repeatedly employed, especially for clinical applications, such as immunophenotyping or cancer diagnostics, where incorrect results, due to technical variability, can have deleterious implications for patient care.
Performance reproducibility and the ability to compare results over time and across different laboratories are crucial in clinical trials and assessed during validation. To ensure success in passing validation criteria, when introducing a new instrument in the lab, installation should start with initial characterization to establish the baseline performance, to enable inter-instrument/inter-site comparisons. Tools like stain index reduction (SIR), the cross-stain index (CSI), and the spillover spread matrix (SSM) identify performance issues and optimize panel design by highlighting the marker resolution and spillover. Long-term tracking of CSI and SSM metrics, along with advanced QC and NIST-traceable standards, ensures a consistent performance and reliable data, enhancing the quantitative capabilities of spectral cytometry in complex panel analysis [
51]. Flow cytometry settings can vary across laboratories, with differences in instrument configurations, target values, and calibration practices. These inconsistencies can lead to divergent data, even when analyzing identical sample types or cell populations. To ensure meaningful comparisons across instruments—especially those with different optical configurations—fluorochrome-specific standardization is essential. Unlike hard-dyed calibration beads, which do not fully reflect the performance characteristics of individual fluorochromes, fluorochrome-specific controls help account for differences in detector sensitivity and spectral overlap. Even among identical instruments, such standardization enhances data reliability and reproducibility [
91]. During instrument daily QC, fluorescent beads are used, based on the manufacturer’s recommendations, to assess instrument performance and monitor cytometer stability across time. For the optimal marker resolution in each assay, the acquisition settings need to be optimized to find the detector gain or voltage values that ensure the highest signal-to-noise separation. This universal instrument setup standardization is not just a technical goal but a clinical necessity.
Sony and Cytek Biosciences have developed distinct approaches to instrument setup standardization to ensure data consistency and reproducibility across different days, instruments, and sites. For example, Sony incorporates a standardization mode that calibrates each detector channel to an optimized master specification, normalizing scatter and fluorescence sensitivity across instruments of the same model. This global specification refers to a master reference configuration to which each detector voltage is adjusted for matching fluorescence intensities across units. During daily QC, the system recalculates voltage scaling factors to restore alignment to the global standard, compensating for detector drift and ensuring consistent target values across lasers and detectors. Cytek Biosciences offers cytometers equipped with a similar feature designed to reduce instrument-to-instrument variability, thereby enhancing data reproducibility. Their instruments use acquisition settings optimized using biological human samples to find the sweet spot for a high resolution, minimal spread, and preserved spectral signatures. These optimized settings are named CytekAssaySetting (CAS) and define the target fluorescence intensity values for each detector. If the intensities deviate from the target during daily QC, detector gains are automatically adjusted to match, compensating for detector drift and inconsistencies in target values. This approach maintains the resolution and signal stability over time and supports harmonization across instruments, including sorters and analyzers, as shown by Park et al. (2024) [
30]. These features minimize signal variability within and between instruments, yielding consistent fluorescence intensity measurements and highly reproducible results in longitudinal studies and multi-site collaborations. By normalizing detector gains or voltages to achieve uniform target intensity values, the standardization also enables the reuse of single-color reference controls from a spectral library without the need for fresh controls in each new experiment. BD’s Cytometer Setup and Tracking (CS&T) system establishes a baseline instrument performance using multi-level fluorescent calibration beads. It records median fluorescence targets for dim, mid, and bright beads during the initial setup and adjusts detector voltages daily to restore these values. This ensures that the system’s sensitivity and compensation parameters remain stable over time. However, voltration might be needed to define the optimal acquisition settings for a specific sample or panel to achieve the highest data resolution.
Developing and implementing SOP for instrument calibration, sample preparation, acquisition, unmixing adjustment, and data analysis can help minimize variability. SOPs should be detailed and specific, ensuring that all laboratories follow the same protocols. This approach has been advocated in the literature to enhance reproducibility [
94]. Incorporating rigorous quality control (QC) measures, such as the use of standardized reference samples and regular calibration checks of instruments, can ensure a consistent performance. Regular QC checks can help identify and rectify discrepancies in instrument settings or sample preparation methods [
95,
96]. Discrepancies in sample handling, such as the method of cell staining or the timing of analyses post-staining, can lead to variability in results. A review by Mair and Tyznik (2019) highlighted that inconsistent staining protocols could affect the fluorescence intensity and, consequently, the accuracy of marker detection in multi-parameter panels [
97]. Different laboratories may employ distinct algorithms or thresholds for data analysis, leading to variations in how results are interpreted [
97]. For example, a study by Fan, et al., 2022 found that using different unmixing algorithms resulted in markedly different estimates of rare cell populations in hematological malignancies [
58].
Conducting inter-laboratory studies can facilitate the identification of sources of variability and help refine standardization efforts. Collaborative studies where multiple laboratories analyze the same samples using standardized acquisition settings can provide valuable insights into differences and promote uniformity [
98]. Implementing training programs for personnel involved in flow cytometry can ensure that staff are knowledgeable about standardized practices. Certification programs may help maintain consistency in how assays are performed and analyzed across different sites [
99]. Creating universal multi-parameter panels that are optimized for use across different instruments and laboratories can help streamline workflows and reduce variability. Such panels would be validated across multiple platforms to ensure consistency in results, regardless of where the testing is performed. To date, few clinical trials are completed using spectral flow; however, the adoption of the technology in this space is increasing every day, making standardization ever more important [
100,
101].
3.11. Role of International Standards and Guidelines
International guidelines play a crucial role in harmonizing practices across different laboratories. Organizations such as the CLSI and the World Health Organization (WHO) are working toward establishing universal standards for flow cytometry that can be applied globally. Efforts to standardize flow cytometry across research and clinical settings have been driven by several key consortia and projects, each addressing unique challenges in reproducibility and data harmonization. These groups have focused on areas such as MRD detection, immune profiling, and interlaboratory variability. The table below summarizes the major groups involved in standardization, highlighting their specific focus areas and the contributions they have made to advance the field. By developing comprehensive protocols, uniform reagent panels, and automated tools, these initiatives have significantly improved the consistency and reliability of flow cytometry applications across diverse settings [
101] (
Table 4). These guidelines are critical for ensuring that data are comparable across clinical studies, thereby facilitating the broader adoption of this technology in research and diagnostics.
One promising area of focus is the implementation of standardized instrument calibration procedures, which ensure that data collected on different instruments is comparable. For instance, calibration beads with known fluorescence intensities are increasingly being used to standardize fluorescence measurements across different cytometers.
Additionally, the introduction of proficiency testing programs allows laboratories to evaluate their performance relative to standardized benchmarks, promoting continuous improvement and adherence to best practices. Programs like CAP provide standardized wet and dry challenges. Wet challenges use cell lines, either undiluted or diluted in preserved whole blood, to mimic clinical samples. Dry challenges include case summaries, clinical data, and flow cytometry plots for interpretation [
102]. External quality assessment programs such as UK NEQAS for Leucocyte Immunophenotyping (UKNEQAS LI, External Quality Assessment Program for Flow Cytometry.
https://www.ukneqasli.co.uk/ (accessed on 14 June 2025)). are also instrumental in standardization efforts. However, the path to universal adoption of these guidelines is not without obstacles. Laboratories may lack the resources or expertise to implement complex calibration standards or/and may resist changes to established workflows. That being said, standardization is essential for improving data reliability and reproducibility across laboratories. International guidelines and standards will play an increasingly important role in this process, but ensuring consistent implementation across different laboratories requires further collaboration, technological innovation, and regulatory oversight.
3.12. Reference/Quality Controls in Spectral Flow Cytometry: Critical for Data Integrity and Reproducibility
Proper controls in spectral flow cytometry are essential at multiple levels to ensure data quality, reproducibility, and accurate interpretation. Broadly, these controls fall into three categories: (1) single-color reference controls for spectral unmixing, (2) daily instrument quality control (QC) and standardization measures, and (3) experiment-specific or panel-level controls (e.g., FMO tubes, positive/negative sample controls). In a spectral flow cytometry experiment, all three types of controls work in tandem to verify that the instrument is performing optimally, that fluorescence spectra are unmixed correctly, and that the biological results are trustworthy. Setting up single-color reference materials (SCRMs) is widely recognized as one of the most labor-intensive aspects of SFC, particularly when establishing new panels with many fluorochromes. Unlike CFC, where fewer compensation controls are needed, SFC often requires 20–40+ well-matched SCRMs, each capturing a fluorochrome’s full emission spectrum for accurate unmixing—a process that is sensitive to changes in reagent lot, cell type, and instrument conditions [
7]. To reduce this burden, spectral cytometry platforms such as Sony and Cytek allow users to store and reuse spectral signatures in reference libraries, enabling a faster setup for recurring panels [
88]. However, these libraries have limitations: they require regular validation, may not apply across lot changes or cell types (especially with tandem dyes), and are not suitable for novel fluorochromes without freshly acquired reference data. Thus, while libraries can streamline routine workflows, new or evolving panels still demand fresh SCRMs for accurate spectral unmixing [
7]. Below, we discuss each category, highlighting their distinct roles and best practices, and we summarize them in
Table 5.
Spectral flow cytometry requires reference controls (single-color controls) for each fluorochrome in the panel to accurately unmix overlapping emission spectra [
72]. These are analogous to compensation controls in conventional flow but even more critical: the unmixing algorithm uses them to define the unique emission profile of each fluorophore. Each fluorophore–antibody conjugate in the experiment must have a corresponding reference sample with that single marker positive and a clear negative population of the same material [
103].
Single-Color Reference Materials: In practice, single-color reference controls can be prepared on either cells or specialized beads that bind antibodies. Antibody capture beads (e.g., BD™ CompBeads; BD Biosciences, San Jose, CA, USA or UltraComp eBeads™; Thermo Fisher Scientific, Waltham, MA, USA) are commonly used because they reliably yield a bright positive signal and a negative population in the same tube. However, an important caveat is that the spectral signature of a fluorophore on beads can sometimes differ from that on actual cells, especially for tandem dyes or fluorophores sensitive to environmental conditions. Such differences, if unrecognized, can lead to unmixing errors [
72]. The best practice is to verify each single-color control on the same cell type used in the experiment whenever possible. In cases where suitable positive cells are available, a cell-derived reference may provide the most representative spectrum. Setting up single-color reference controls is one of the most labor-intensive steps in SFC. While reference libraries (e.g., Cytek’s spectral library) offer some relief, their use requires caution due to instrument-specific variability and dye stability.
Negative and Autofluorescence Controls: Each reference control must include a well-defined negative population. When using capture beads, the beads typically come in a mixture of positive and negative beads, so an unstained (autofluorescence-only) population is inherently present. With cell-based controls, one can either use a sample that contains both stained and unstained cells or mix unstained cells of the same type. A special consideration in spectral cytometry is autofluorescence—the inherent fluorescence of cells can vary significantly. Spectral unmixing systems allow explicit subtraction of autofluorescence by treating it as an additional “fluorophore” with its own reference spectrum. To enable this, an unstained sample from the same tissue or cell type is run as a reference for autofluorescence. The use of antibody capture beads is particularly helpful when markers of interest are present in a low abundance or expression is conditional, as is often the case with activation markers. However, bead performance may vary between instruments due to differences in optical configurations or unmixing algorithms [
104]. It is essential to determine unmixing requirements early and maintain them throughout the study.
3.14. Experiment-Level Controls and Panel Validation
Experiment-level controls validate the staining process and assist in data interpretation. These include fluorescence-minus-one (FMO) controls, synthetic or spiked positive controls, and reference samples.
FMO Controls: An FMO control contains all antibodies in the panel except one, helping define gating thresholds. FMOs reveal combined background fluorescence and spillover into the channel of interest. Although spectral unmixing reduces signal overlap, FMOs remain valuable for setting gates, especially in dimly expressed markers [
105].
Synthetic Positive Controls and Biological Reference Samples: Synthetic controls such as TruCytes™ (Slingshot Biosciences, Emeryville, CA, USA) mimic defined cellular phenotypes, offering a consistent readout for validating assay sensitivity. Commercial biological controls like CD-Chex® Plus (Streck, La Vista, NE, USA) and ClearLLab™ Control Cells (Beckman Coulter, Brea, CA, USA) provide stabilized populations for quality assurance in clinical diagnostics. These controls serve as external benchmarks and help detect reagent failures or day-to-day variability.
Advanced Data Quality Monitoring: Tools such as flowAI can detect acquisition anomalies. Other computational methods and machine learning can assist with unmixing or background correction and provide real-time quality control during acquisition [
61].
Panel development and optimization require iterative testing. Tools such as cross-stain index (CSI) matrices and NxN plots help visualize resolution, spread, and marker separation. For instance, Jensen and Kim (2023) described the use of these QC tools to refine their 30-color iCoreDrop panel through multiple fluorochrome reassignments and resolution optimization [
106].
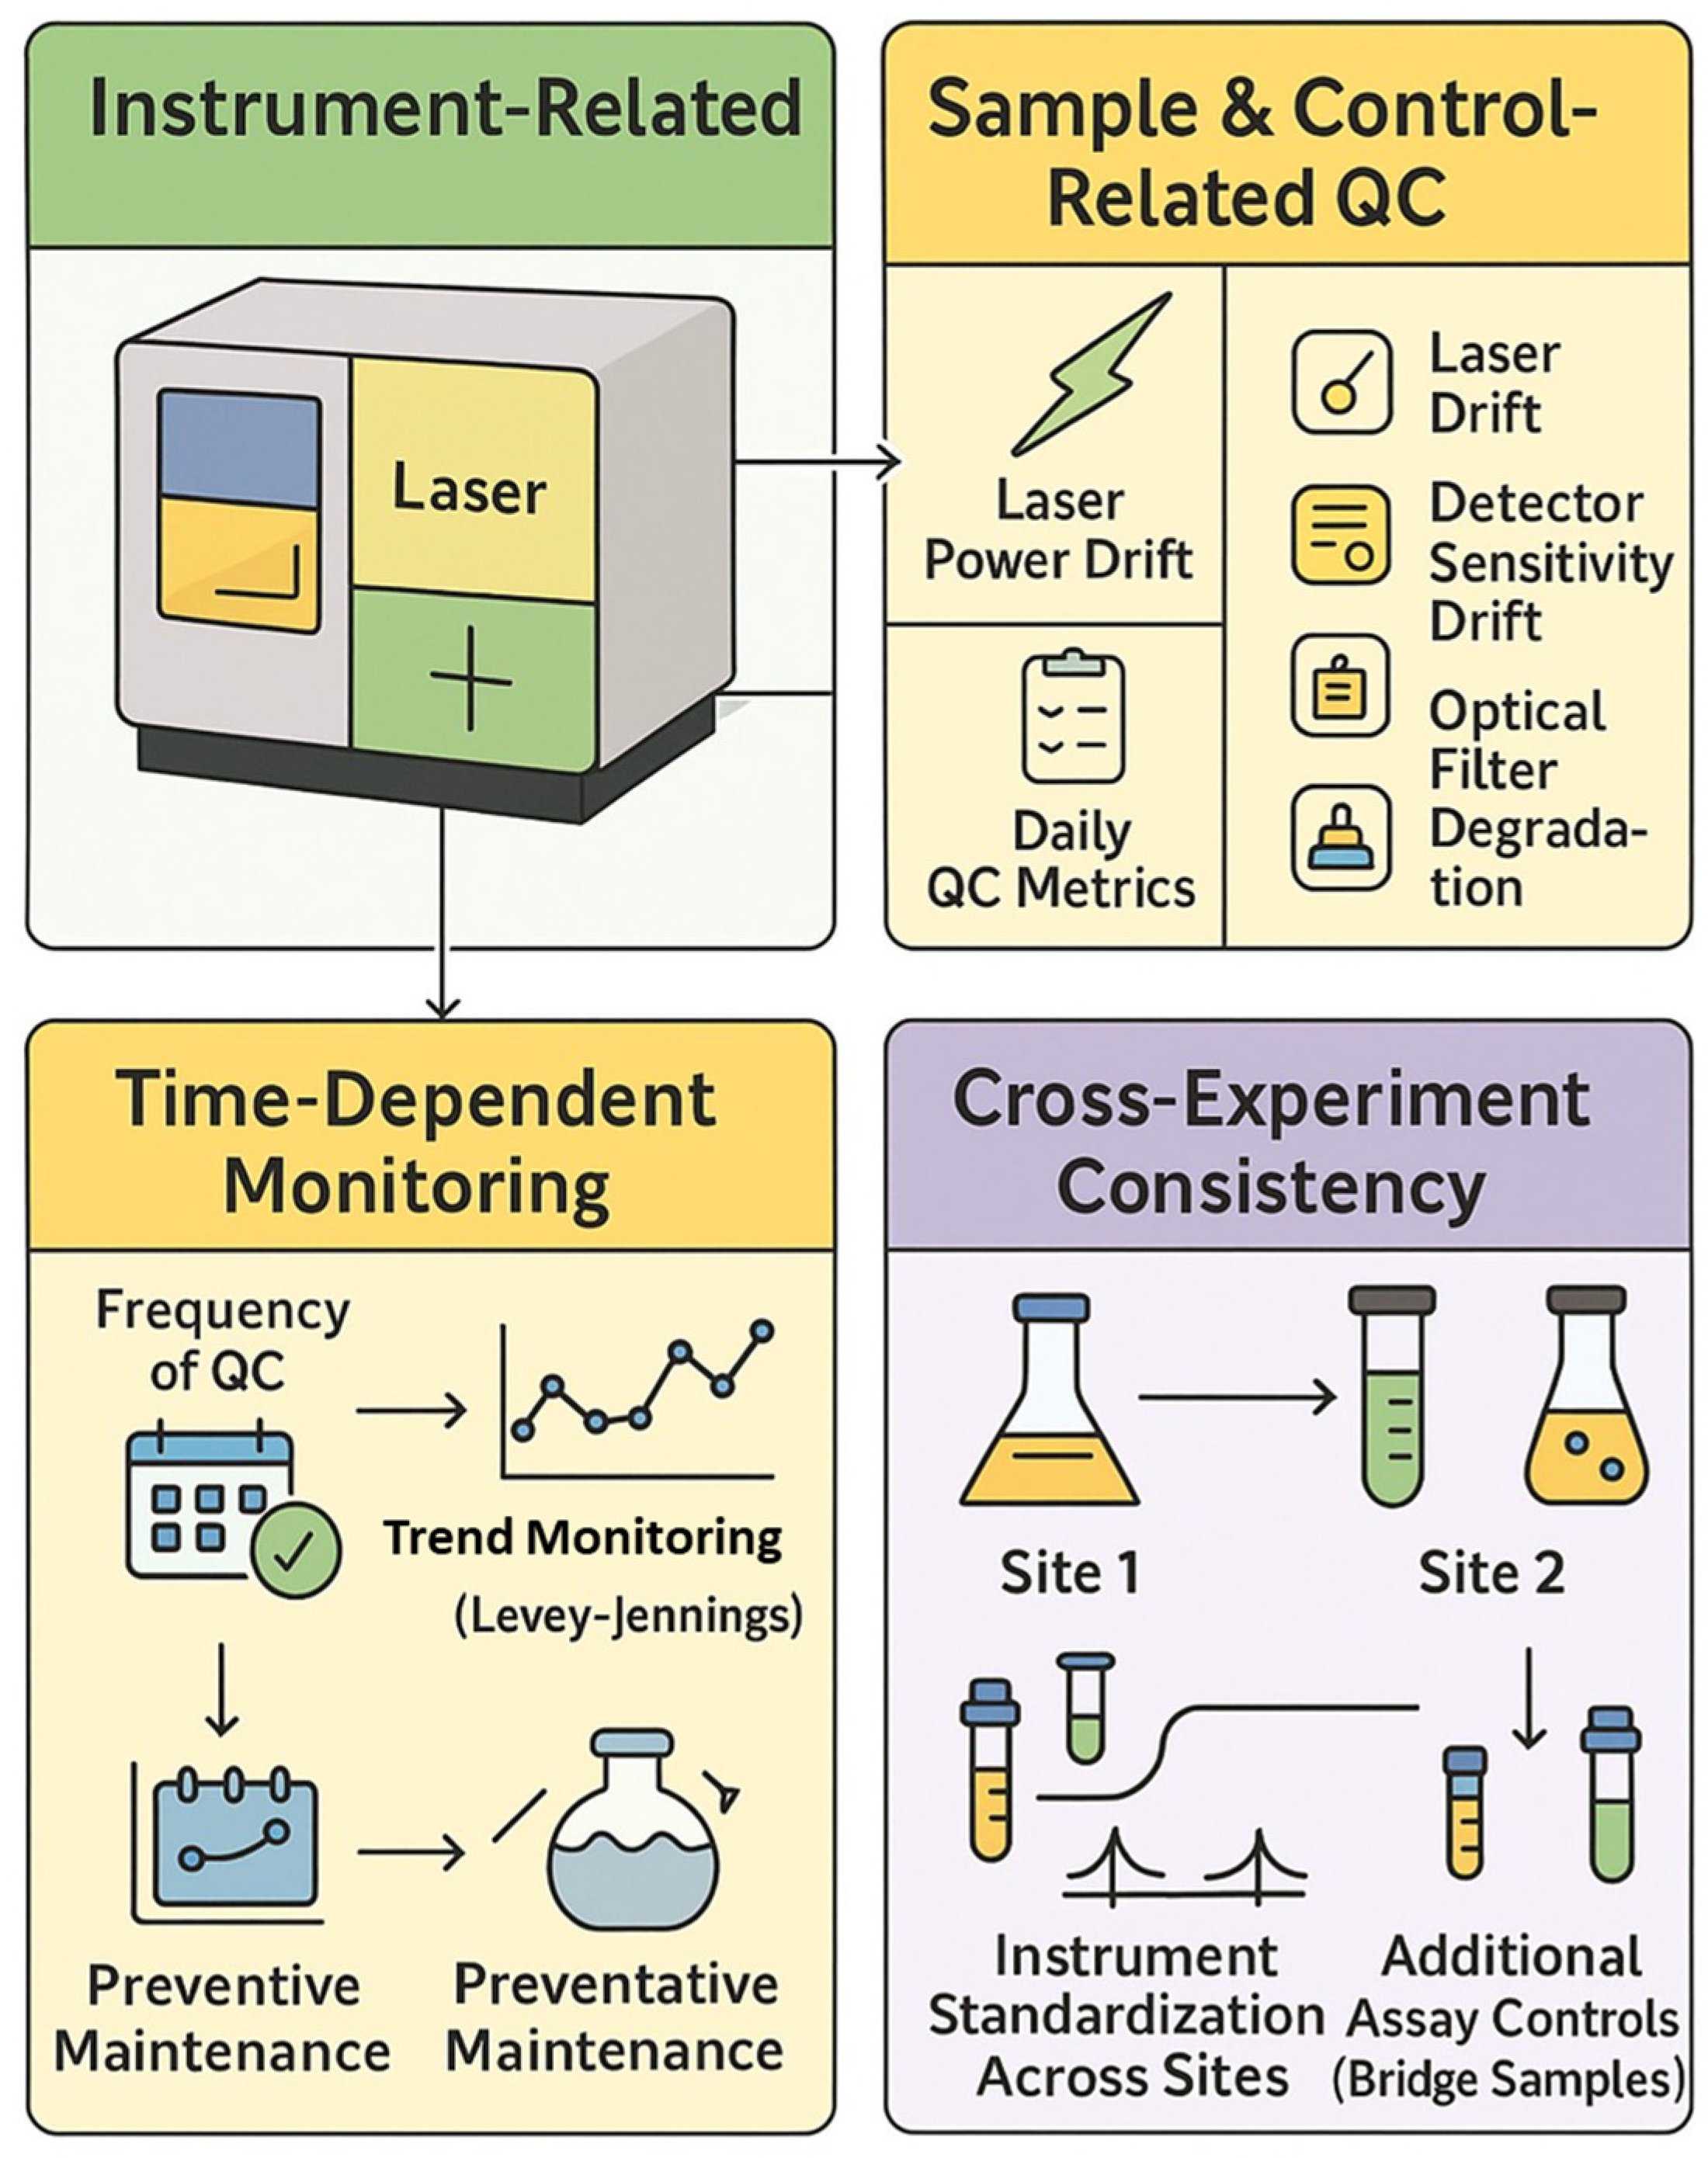
Rigorous application of reference controls, daily instrument QC, and experiment-level controls are essential for generating reproducible, high-quality data in spectral flow cytometry (
Figure 4).
3.15. Spectral Data Files and Unmixing Models
Spectral unmixing in flow cytometry offers a sophisticated yet not fully standardized approach to quantifying fluorochrome abundance by resolving overlapping signals captured by multiple detectors [
107]. Unlike traditional compensation, which adjusts for spillover between detectors, unmixing treats detector readings as mixtures of all fluorochrome signals. This enables improved separation of individual spectra compared to traditional spillover subtraction [
108]. Various mathematical models can resolve mixtures of fluorochrome spectra (
Table 6). Unmixing algorithms excel in managing noise, particularly noise arising from the randomness of photon emission. By using all detectors collectively, unmixing better separates noise from the true fluorescence signal [
108]. However, noise correction via unmixing is not foolproof. Autofluorescence (AF) from biological samples can obscure true fluorescence and reduce signal resolution. Severe cases may impair population differentiation by introducing artifacts and false positives [
4,
16].
By modeling AF explicitly, unmixing provides more reliable and accurate fluorochrome quantification, particularly in complex biological samples where AF is prevalent. This results in more robust data interpretation, essential for high-precision experiments [
1].
Table 7 compares the autofluorescence handling strategies implemented in leading spectral cytometry instruments and analysis platforms.
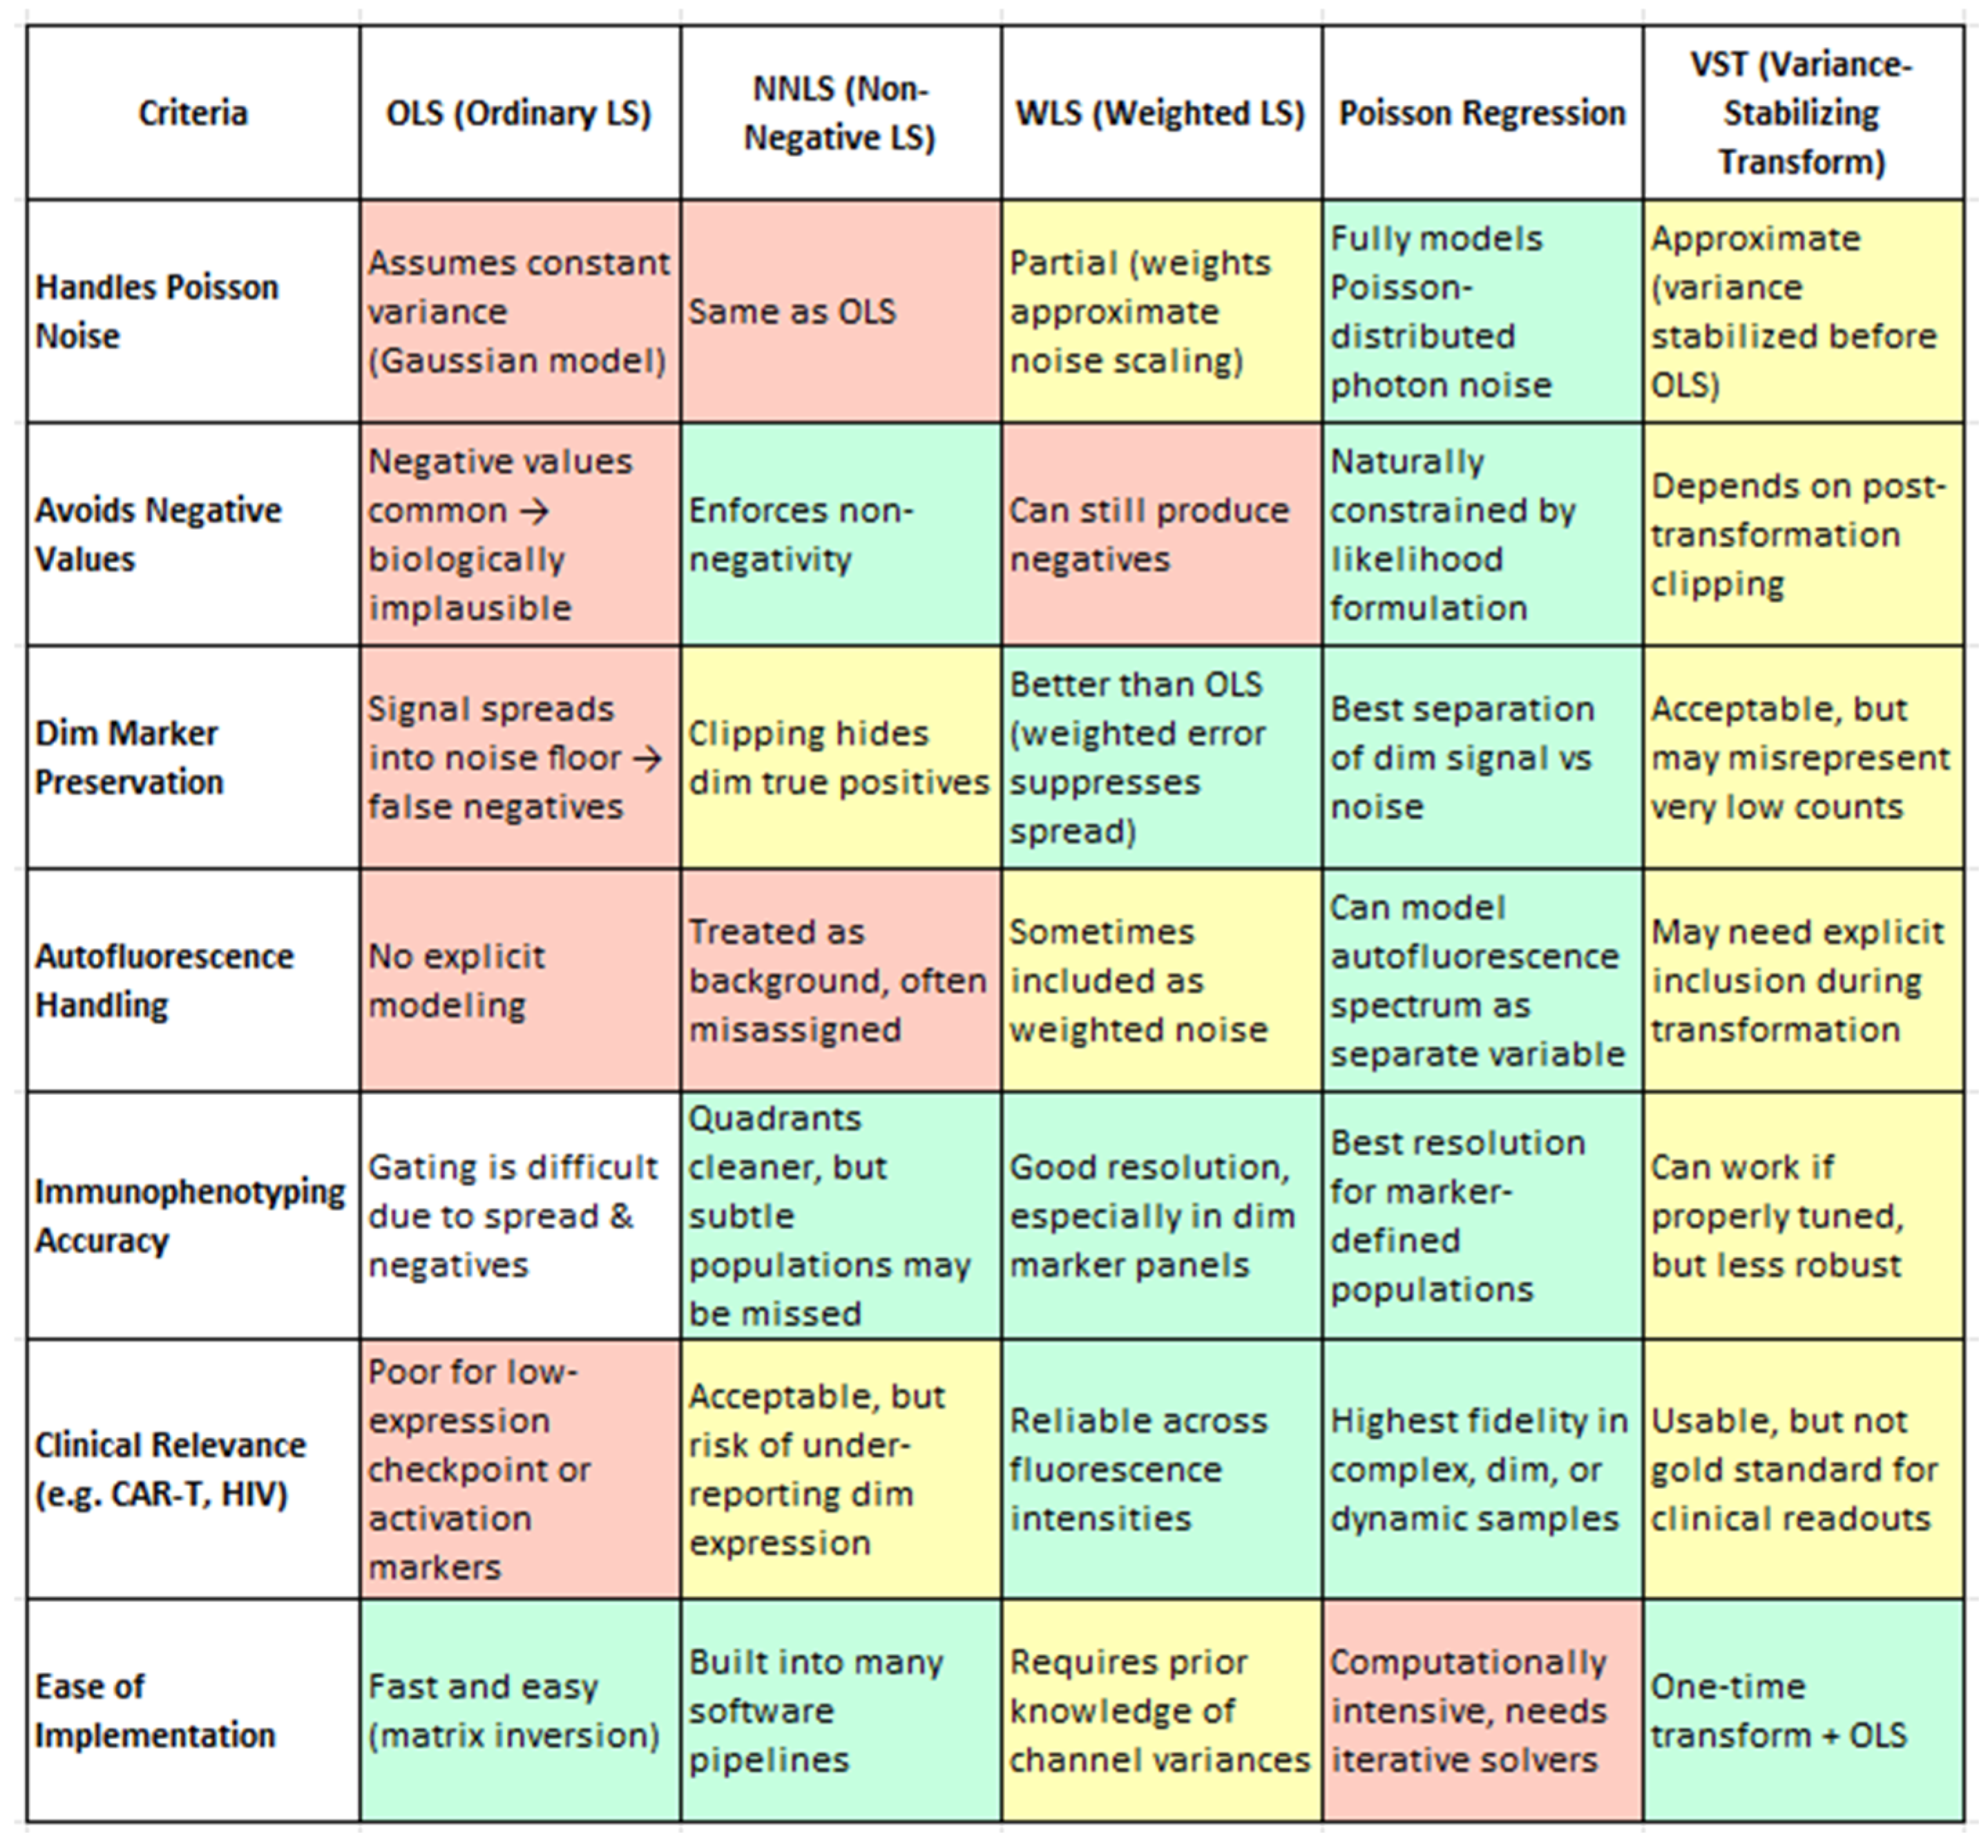
From a biological standpoint, the method chosen for spectral unmixing has far-reaching consequences for data fidelity, especially when analyzing subtle marker expression or rare immune subsets. Ordinary Least Squares (OLS), while computationally efficient and widely used, has limitations in its baseline implementation—most notably, it can produce unphysical negative values and exhibit signal spread that compromises the resolution of dim markers and subset boundaries. However, as shown by Spasic et al. (2024), these limitations can be mitigated through enhanced spectral modeling, such as the inclusion of autofluorescence endmembers in the mixing matrix [
20]. Their study demonstrates that even with OLS, careful construction of the unmixing matrix significantly improves the resolution, particularly for low-abundance markers, without requiring a change in the underlying algorithm. Non-Negative Least Squares (NNLS) resolves negatives but may artificially zero out weak true signals [
4]. Weighted Least Squares (WLS) improves on both by accounting for channel-specific noise, preserving dim marker distinctions without introducing negatives [
1,
110]. However, Poisson regression clearly outperforms all others, offering the most biologically accurate representation by modeling photon noise directly. It is uniquely capable of preserving dim marker fidelity (e.g., CD25, PD-1) (4), enabling accurate immune subset identification (e.g., memory B cells, CD56 bright NK cells), and effectively handling autofluorescence as an independent spectral component. Though computationally more demanding, Poisson-based unmixing provides the highest analytical precision and consistency—essential for clinical-grade immunophenotyping, high-dimensional datasets, and translational biomarker discovery. Variance-Stabilizing Transformation (VST), while computationally efficient, functions best as an approximation and may require tuning for stability. This nuance is important for understanding the broader landscape of spectral unmixing: while standard OLS may fall short, enhanced implementations—like that used in Spasic et al. (2024) illustrate how OLS can be extended to achieve high-quality results [
20]. Therefore, the earlier critique of OLS refers to its unoptimized form and not to optimized workflows. Thus, while OLS remains the underlying algorithm, the improved resolution is attributed to optimized spectral modeling rather than algorithm replacement.


 ,
, 

