Article

Human Extravillous Trophoblasts Require SRC-2 for Sustained Viability, Migration, and Invasion

1
Department of Molecular and Cellular Biology, Baylor College of Medicine, Houston, TX 77030, USA
2
Department of Pathology and Immunology, Baylor College of Medicine, Houston, TX 77030, USA
*
Author to whom correspondence should be addressed.
Cells 2025, 14(13), 1024; https://doi.org/10.3390/cells14131024
Submission received: 29 April 2025 / Revised: 26 June 2025 / Accepted: 1 July 2025 / Published: 4 July 2025

Abstract

Defective placentation is a recognized etiology for several gestational complications that include early pregnancy loss, preeclampsia, and intrauterine growth restriction. Sustained viability, migration, and invasion are essential cellular properties for embryonic extravillous trophoblasts to execute their roles in placental development and function, while derailment of these cellular processes is linked to placental disorders. Although the cellular functions of extravillous trophoblasts are well recognized, our understanding of the pivotal molecular determinants of these functions is incomplete. Using the HTR-8/SVneo immortalized human extravillous trophoblast cell line, we report that steroid receptor coactivator-2 (SRC-2), a coregulator of transcription factor-mediated gene expression, is essential for extravillous trophoblast cell viability, motility, and invasion. Genome-scale transcriptomics identified an SRC-2-dependent transcriptome in HTR-8/SVneo cells that encodes a diverse spectrum of proteins involved in placental tissue development and function. Underscoring the utility of this transcriptomic dataset, we demonstrate that WNT family member 9A (WNT 9A) is not only regulated by SRC-2 but is also crucial for maintaining many of the above SRC-2-dependent cellular functions of human extravillous trophoblasts.

1. Introduction

A temporary fetomaternal organ, the human placenta is essential for intrauterine fetal development and protection [1,2]. Following the histiotrophic-to-hemotrophic switch that occurs toward the end of the first pregnancy trimester [3], the placenta is solely responsible for providing gas exchange, nourishment, and immunoprotection to the developing fetus. Apart from serving as a diffusion barrier, separating the maternal and fetal circulations, the placenta promotes adaptive changes in maternal physiology and metabolism, including hormone production and hemodynamic adaptations [4,5,6].
During early hemochorial placentation, the trophoblast cell lineage of the placenta expands and differentiates into villous and extravillous trophoblast cell types, each with specialized functions [6]. Through cell fusion, a primary function of villous trophoblasts is to provide an outer multinucleated epithelial cell layer of syncytiotrophoblasts, which cover floating chorionic villi and directly contact the maternal arterial blood [7,8,9]. Extravillous trophoblasts migrate from anchoring chorionic villi to invade the maternal decidual basalis to the proximal third of the uterine myometrium [10]. Apart from anchoring the embryonic-derived placenta to the maternal uterine compartment, extravillous trophoblasts transform into endovascular trophoblasts, which, together with local endometrial immune cells [11,12], remodel decidual spiral arterioles into large diameter uteroplacental arteries. With high-conductance and low-pressure, uteroplacental arteries serve to route maternal blood flow to the intervillous space. This placental remodeling of maternal vasodilation is commonly impaired in preeclampsia and related pregnancy disorders [9,13,14,15,16,17,18,19,20,21]. Although normal migratory and invasive properties of extravillous trophoblast cells are a prerequisite to preventing these placental disorders, the key signals that control these specialized cellular functions remain poorly understood.
Steroid receptor coactivator-2 (SRC-2), also known as nuclear receptor coactivator 2 (NCOA2), is a member of the p160/SRC family of transcriptional coregulators, which also includes SRC-1 and SRC-3 [22]. Interacting with either nuclear receptor or non-nuclear receptor transcription factors, individual members of the p160/SRC family exert distinct contributions to a broad spectrum of physiologies and pathophysiologies [22], including male and female reproductive processes [23,24]. We previously demonstrated that SRC-2 is essential for decidualization of stromal cells of the maternal endometrium [25,26,27,28], a crucial stage of the embryo implantation process. Although these studies provide important insights into our understanding of SRC-2 in the maternal endometrium during the earliest stages of pregnancy, the role of embryonic-derived SRC-2 during this implantation period is unclear. This knowledge gap is conspicuous in light of previous reports indicating that other members of the p160/SRC family serve important functions in a number of extraembryonic cell types, which are essential for the development and function of the placenta [29,30,31].
To address this issue, we report here that SRC-2 is expressed in multiple cell types of term placenta tissue from healthy women, and that SRC-2 expression in the commonly used HTR-8/SVneo human trophoblast cell line is essential for trophoblastic cell viability, migration, and invasion. In addition to significant changes in expression of previously reported genes in extravillous trophoblasts and/or the HTR-8/SVneo cell line, genome-wide RNA sequencing (RNA-seq) revealed that the expression levels of WNT-related factors are markedly reduced in HTR-8/SVneo cells with decreased expression levels of SRC-2. Importantly, we identified WNT family member 9A (WNT 9A) as a critical SRC-2-responsive molecular target that is required for optimum execution of many of these key cellular processes, which are known to occur during hemochorial placentation.

2. Materials and Methods

2.1. Human Placenta Tissue

Placental specimens were obtained from Dr. Ramkumar Menon at the University of Texas Medical Branch (UTMB) in Galveston, Texas. Dr. Menon’s human protocol was prospectively approved by the Institutional Review Board (IRB, approval number IRB16.0058, acceptance date: 7 January 2020) at UTMB. Patient consent was exempted as placentae were non-identifiable and were to be discarded. Placentae were obtained from not-in-labor repeat elective Cesareans. For immunohistochemistry, placental samples were washed in phosphate-buffered saline (PBS) to remove blood clots before fixation in 10% neutral buffered formalin (NBF) for 24 h at 4 °C. Following graded alcohol washes, tissues were embedded in paraffin blocks, which in turn were sectioned to a thickness of 5 μm prior to placement onto microscope glass slides for immunohistochemical and dual immunofluorescence staining. For immunohistochemical staining for SRC-2, SRC-3, and WNT9A, the following primary antibodies were used, respectively: a rabbit polyclonal anti-human SRC-2 (#A300-345A; 1:500 dilution, Bethyl Laboratories, Montgomery, TX, USA); a rabbit monoclonal anti-human SRC-3 (#2126; 1:200 dilution Cell Signaling Technologies, Inc. Danvers, MA, USA), and a rabbit polyclonal anti-human WNT9A (#AB176973 1:100 dilution Abcam Inc., Waltham, MA, USA). For dual immunofluorescence staining for SRC-2 and the beta subunit of human chorionic gonadotropin (hCG), the following primary antibodies were used, respectively: a rabbit anti-SRC-2 primary antibody ((#96687s) Cell Signaling Technology Inc.) and a mouse anti-hCG beta-subunit primary antibody ((#ab9582) Abcam Inc.). For dual immunofluorescence staining, the following secondary antibodies were used: donkey anti-rabbit IgG conjugated with Alexa Fluor PLUS 594 (#A21207) and donkey anti-mouse IgG conjugated with Alexa Fluor PLUS 488 (#A21202), both purchased from ThermoFisher Scientific Inc., Waltham, MA, USA. Following staining, slides were coverslipped with Vectashield mounting medium containing 4′,6-diamidino-2-phenylindole (DAPI; (H-1200) Vector Laboratories, Inc., Burlingame, CA, USA).

2.2. Immortalized Human Extravillous Trophoblast Cell Line

Previously described [32,33,34,35,36], the HTR-8/SVneo immortalized human trophoblast cell line was purchased from the American Type Culture Collection (ATCC (#CRL-3271)), Manassas, VA, USA. Briefly, the HTR-8/SVneo cell line was originally derived from first-trimester human trophoblasts and immortalized by transfection with a gene encoding the Simian virus 40 large T antigen [32]. For studies described here, the HTR-8/SVneo cell line was cultured in phenol red-free RPMI-1640 medium, supplemented with 5% fetal bovine serum (FBS; Sigma-Aldrich, St. Louis, MO, USA) and a 1% penicillin–streptomycin antibiotic solution (ThermoFisher Scientific Inc., Waltham, MA, USA); medium was changed every other day.

2.3. Transfection of Small Interfering RNAs

For siRNA-mediated knockdown of gene expression, HTR-8/SVneo cells were cultured in six-well plates before transfection with 60 picomoles of one of the following siRNAs: non-targeting (NT (control)) siRNA ((D-001810-10-05) Dharmacon Inc., Lafayette, CO, USA), siRNAs targeting SRC-2 ((L-020159-00-0005) Dharmacon Inc.) or Wnt 9A ((L-008392-00-0005) Dharmacon Inc.). Under serum-starved conditions, transfections were performed using the Lipofectamine RNAi MAX transfection reagent (Invitrogen Corporation, Carlsbad, CA, USA). Forty-eight hours post-transfection, cells were harvested for quantitative real-time PCR (qRT-PCR), RNA-sequencing (RNA-seq), or Western analysis. Alternatively, transfected HTR-8/SVneo cells were trypsinized and re-plated for assays of cell viability, clonogenic survival, migration, or invasion competency.

2.4. Quantitative Real-Time PCR

Cells were lysed in RNA lysis buffer before total RNA was isolated with the RNAeasy Plus Mini Kit (#74134, Qiagen Inc., Germantown, MD, USA) or the Purelink RNA Mini Kit (#12183020, ThermoFisher Scientific Inc.). A NanoDrop 2000 UV/Vis spectrophotometer (ThermoFisher Scientific Inc.) was used for RNA quantification. Total RNA (1 µg) was reverse transcribed using the High-Capacity cDNA Reverse Transcription Kit (#4368814, ThermoFisher Scientific Inc.). Synthesized cDNA was diluted to 10 ng/µL before qRT-PCR was performed using Fast TaqMan 2× Mastermix (Applied Biosystems/Life Technologies, Grand Island, NY, USA); TaqMan assays used in this study are listed in Table 1. All qRT-PCR experiments were performed using the 7500 Fast Real-time PCR system (Applied Biosystems/Life Technologies, Grand Island, NY, USA). For quantitation of gene expression changes, five replicate samples per treatment group (i.e., NT siRNA or SRC-2 siRNA) were used. To normalize for sample-to-sample variation, the ΔCt value was calculated using the formula: Ct (gene-of-interest)-Ct (Hypoxanthine guanine phosphoribosyl transferase (HPRT), a housekeeping gene). For each replicate, the ΔΔCt value for a gene-of-interest was calculated using the formula: ΔCt (the experimental sample (i.e., NT siRNA or SRC-2 siRNA))-ΔCt (the corresponding reference sample (i.e., NT siRNA)). Per replicate, the gene expression fold change (FC) was calculated from the ΔΔCt value using the formula 2Λ−ΔΔCt. The average gene expression FC for a gene-of-interest from the five replicates per treatment was the value plotted on the Y-axis of the resultant histograms. Values from the 2Λ−ΔΔCt formula were log transformed in Excel to enable follow-up statistical analysis.

2.5. Genome-Scale RNA Expression Profiling

Genome-wide RNA-seq analysis was performed as previously described [37,38]. Briefly, total RNA purity and integrity were measured using a NanoDrop spectrophotometer (ThermoFisher Scientific Inc.) and a 2100 Bioanalyzer with RNA chips (Agilent Technologies, Santa Clara, CA, USA), respectively. Only RNA samples with an RNA integrity score greater than 9 were included; three replicate RNA samples were used for each experimental group. Sequencing libraries were prepared from 250 ng of RNA using the TruSeq Stranded mRNA kit (Illumina Inc., San Diego, CA, USA) and amplified by PCR. Quality analysis of resultant libraries was performed on a 4200 TapeStation with D1000 ScreenTape assays (Illumina Inc.). The adapter-ligated fragment concentration was estimated by qRT-PCR with a KAPA Library Quantification Kit (KAPA Biosystems, Wilmington, MA, USA). After equimolar pooling, libraries were quantified using a 2100 Bioanalyzer (with a High Sensitivity DNA Kit and DNA chips); libraries were sequenced on the NovaSeq 6000 platform (Illumina Inc.). Paired-end 100 base-pair sequencing reads were generated at mid-output, and filtered reads (in FASTQ file format) were aligned to the human genome (Genome Reference Consortium Human Build hg38; National Center for Biotechnology Information (NCBI)) using the universal RNA-seq aligner HISAT2 [39]. The Python-based software package HTSeq was used to determine the number of reads that aligned to known genes (http://www-huber.embl.de/users/anders/HTSeq, accessed on 7 May 2024) [40]. To reduce possible PCR bias, read duplicates were removed with Picard Tools (https://broadinstitute.github.io/picard, accessed on 7 May 2024).
To identify genes that were differentially expressed between the two treatment groups, the R package DESeq was applied to the gene expression data [41]. The false discovery rate (FDR) of differentially expressed genes (DEGs) was estimated using the Benjamini and Hochberg method [42]. Gene expression comparisons with an FDR ≤ 0.05 and an absolute fold change (IFCI) ≥ 1.3 were considered significant [43]. Fragments per kilobase of transcript per million (FPKM) values of transcripts were used for hierarchical clustering. Clustered heatmaps were generated with the pheatmap package in R. With raw gene count data, principal component analysis (PCA) was performed with the R function prcomp package (https://cran.r-project.org). All raw data files were deposited in the Gene Expression Omnibus (GEO) repository at NCBI (www.ncbi.nlm.nih.gov/geo (GSE: 278677)). Gene ontology enrichment analysis was performed using the Database for Annotation, Visualization, and Integrated Discovery (DAVID) functional annotation clustering tool (https://david.ncifcrf.gov/) [44]. Biological pathways involving genes that are overrepresented in datasets of DEGs were identified using the Kyoto Encyclopedia of Genes and Genomes (KEGG; https://www.genome.jp/kegg/) [45]. For KEGG pathway enrichment analysis, the KEGG Orthology-Based Annotation System (KOBAS 2.0) was used [46]; CD Genomics (Shirley, New York, NY, USA) performed the majority of the bioinformatics analysis.

2.6. Immunoblotting

Proteins (20 μg) from cell lysates were resolved on 4–15% and 10% sodium dodecyl sulfate polyacrylamide gels and transferred to polyvinylidene difluoride (PVDF) membranes. Following protein transfer, the PVDF membranes were blocked for 1 h with 5% non-fat dry milk (sc-2324 (Blotto), Santa Cruz Biotechnology Inc., Dallas, TX, USA) in Tris-buffered saline with Tween 20 (TBS-T) and incubated overnight at 4 °C with the following primary antibodies diluted in 5% non-fat milk in TBS-T: anti-SRC-2 (1:2000; #610984, BD Transduction Laboratories, Inc., East Rutherford, NJ, USA), anti-SRC-1 (1:1000; #2191 Cell Signaling Technology, Inc., Danvers, MA, USA); anti-SRC-3 (1:1000, #2126 Cell Signaling Technology Inc.); anti-HLA-G (1:1000; #NBP3-20480, Novus Biologicals LLC, Centennial, CO, USA; anti-WNT 9A (1:1000; #ab176973, Abcam, Eugene, OR, USA), and anti-β-actin (1:10,000; ##4970, Cell Signaling Technology, Inc.). The blots were then probed for 1 h at room temperature with horseradish peroxidase (HRP)-conjugated anti-rabbit (1:5000; A27036, ThermoFisher Scientific Inc.) or anti-mouse IgG secondary antibodies (1:10,000; #7076, Cell Signaling Technology, Inc.) diluted in 5% non-fat milk in TBS-T. Chemiluminescence was detected with the SuperSignal West Pico PLUS Chemiluminescent Substrate (#1863097, ThermoFisher Scientific, Inc.) and digitally imaged using the Bio-Rad ChemiDoc imaging system (Bio-Rad Laboratories, Hercules, CA, USA).

2.7. Cell Viability Assay

Cells were seeded in triplicate wells in 96-well culture plates at a density of 5 × 10³ cells per well. Cells transfected with siRNAs for 48 h were further cultured for 0, 24, 48, 72, or 96 h before the number of viable cells was assessed using the CellTiter 96® Non-Radioactive Cell Proliferation Assay kit (#G4000, Promega Inc., Madison, WI, USA). Briefly, after a specific time in culture, 15 mL of 3-(4, 5-dimethylthiazol-2-yl)-2, 5-diphenyltetrazolium bromide (MTT; Promega, Madison, WI, USA) was added to each well for a final concentration of 0.5 mg/mL. Cells were then incubated at 37 °C for an additional three hours in the dark. After the three-hour incubation period, the supernatant was removed, and the stop/solubilizing solution (dimethyl sulfoxide (100 µL)/well) was added to dissolve the formazan crystals. Cells were then incubated further for 15 min at 37 °C with gentle agitation. The absorbance of the final mixture was recorded at 570 nm (formazan absorbance maximum) using a 96-well microplate ELISA reader. Relative number of viable cells was calculated using the mean absorbance at the “N” time point divided by the mean absorbance at 0 h, where N = 24, 48, 72, or 96 h. Each experiment was repeated three times with three to five technical replicates for each treatment group.

2.8. Clonogenic Survival Assay

Forty-eight hours after siRNA transfection, cells were cultured in triplicate wells in six-well culture plates for 10 days (3 × 10³ cells per well), with the medium replaced every other day. After the 10-day culture period, cells were fixed with 4% paraformaldehyde for 15 min and washed with PBS for 10 min before colonies were stained with crystal violet solution (0.5%) for 15 min [26]. Stained colonies were photographed following de-staining in tap water and air-drying. The bound crystal violet was eluted by the addition of 30% acetic acid (300 μL) to each insert, followed by shaking for 10 min. The eluent from the wells was transferred to a 96-well clear microplate, and the absorbance at 590 nm was measured using a plate reader (Tecan Infinite M200 PRO, AG, Zurich, Switzerland). Each experiment was repeated three times with triplicate wells for each treatment group.

2.9. Transwell Cell Migration Assay

Cell migration was assessed using Corning transwell chambers (#3422, Corning Inc., Glendale, AZ, USA). Briefly, cells were seeded in six-well culture plates and cultured until reaching 70–80% confluency before siRNA transfection. Forty-eight hours after transfection under serum-starved conditions, the cells were trypsinized and resuspended in culture medium without fetal bovine serum (FBS). Cells were counted and then diluted at a density of 1 × 10⁵ cells/250 μL in Opti-MEM medium. Subsequently, the cell suspension was seeded into the upper chamber of each transwell. In the lower chamber, 600 μL culture medium with 10% FBS was used as a chemoattractant. The cells were cultured in a humidified incubator at 37 °C with 5% CO2 for 24 h. After 24 h, the transwell inserts were washed twice with phosphate-buffered saline (PBS); cells were fixed with 4% paraformaldehyde in PBS for 15 min. Cells on the inside of transwell inserts were gently removed using moistened cotton swabs, while cells retained on the lower surface of the membrane were stained with crystal violet for 10 min. The transwell inserts were washed twice with PBS to remove unbound crystal violet and then air-dried. The migrated cells were observed and imaged with an inverted phase-contrast microscope (EVOSTM XL Core Imaging System, #AMEX1000, ThermoFisher Scientific Inc.). The bound crystal violet was eluted by adding 30% acetic acid (300 μL) onto each insert with shaking for 10 min. The eluent from the lower chamber was transferred to a 96-well clear microplate, and the absorbance at 590 nm was measured using a plate reader (Tecan Infinite M200 PRO). For each treatment group, experiments were performed three times with triplicate samples.

2.10. Transwell Cell Invasion Assay

The Corning BioCoat Matrigel Invasion Chamber Kit ((#354480) Corning Inc.) was used to quantitate cell invasion. Following siRNA transfection for 48 h under serum-starved conditions, cells were trypsinized and resuspended in culture medium without FBS. Cells were counted and then diluted at a density of 1 × 10⁵ cells/250 μL in Opti-MEM medium. Serving as a chemoattractant, culture medium with 10% FBS was added (600 μL) to the bottom of each transwell of the invasion chamber plate. Suspended cells (1 × 10⁵ cells/250 µL) were then added to each transwell insert and allowed to migrate. After 24 h, cells were removed from the top surface of the transwell using a cotton swab. Migrated cells were fixed with 4% paraformaldehyde in PBS for 15 min and stained with crystal violet solution for 10 min [37]. To remove unbound crystal violet stain, the transwell inserts were washed twice with PBS, air-dried, and then digitally imaged using a Zeiss stereomicroscope with an attached AxioCam MRC-5 digital camera (Zeiss, Jena, Germany). Bound crystal violet was eluted by adding 30% acetic acid (300 μL) into each insert with shaking on an orbital shaker for 10 min. The eluent from the lower chamber was transferred to a 96-well clear microplate; the absorbance at 590 nm was measured using a plate reader (Tecan Infinite M200 PRO). Each experiment was repeated three times with triplicate samples for each treatment group.

2.11. Statistical Analysis

To estimate the statistical significance of differences between the two treatment groups, two-tailed unpaired Student t-tests were used. Unless otherwise stated, data were graphically presented as the mean ± standard deviation. Differences with a p-value < 0.05 were considered statistically significant; asterisks represent the level of significance: * p < 0.05, ** p < 0.01, *** p < 0.001, and **** p < 0.0001. Prism software version 9 (GraphPad Software Inc., San Diego, CA, USA) was used for many of the reported statistical analyses.

3. Results

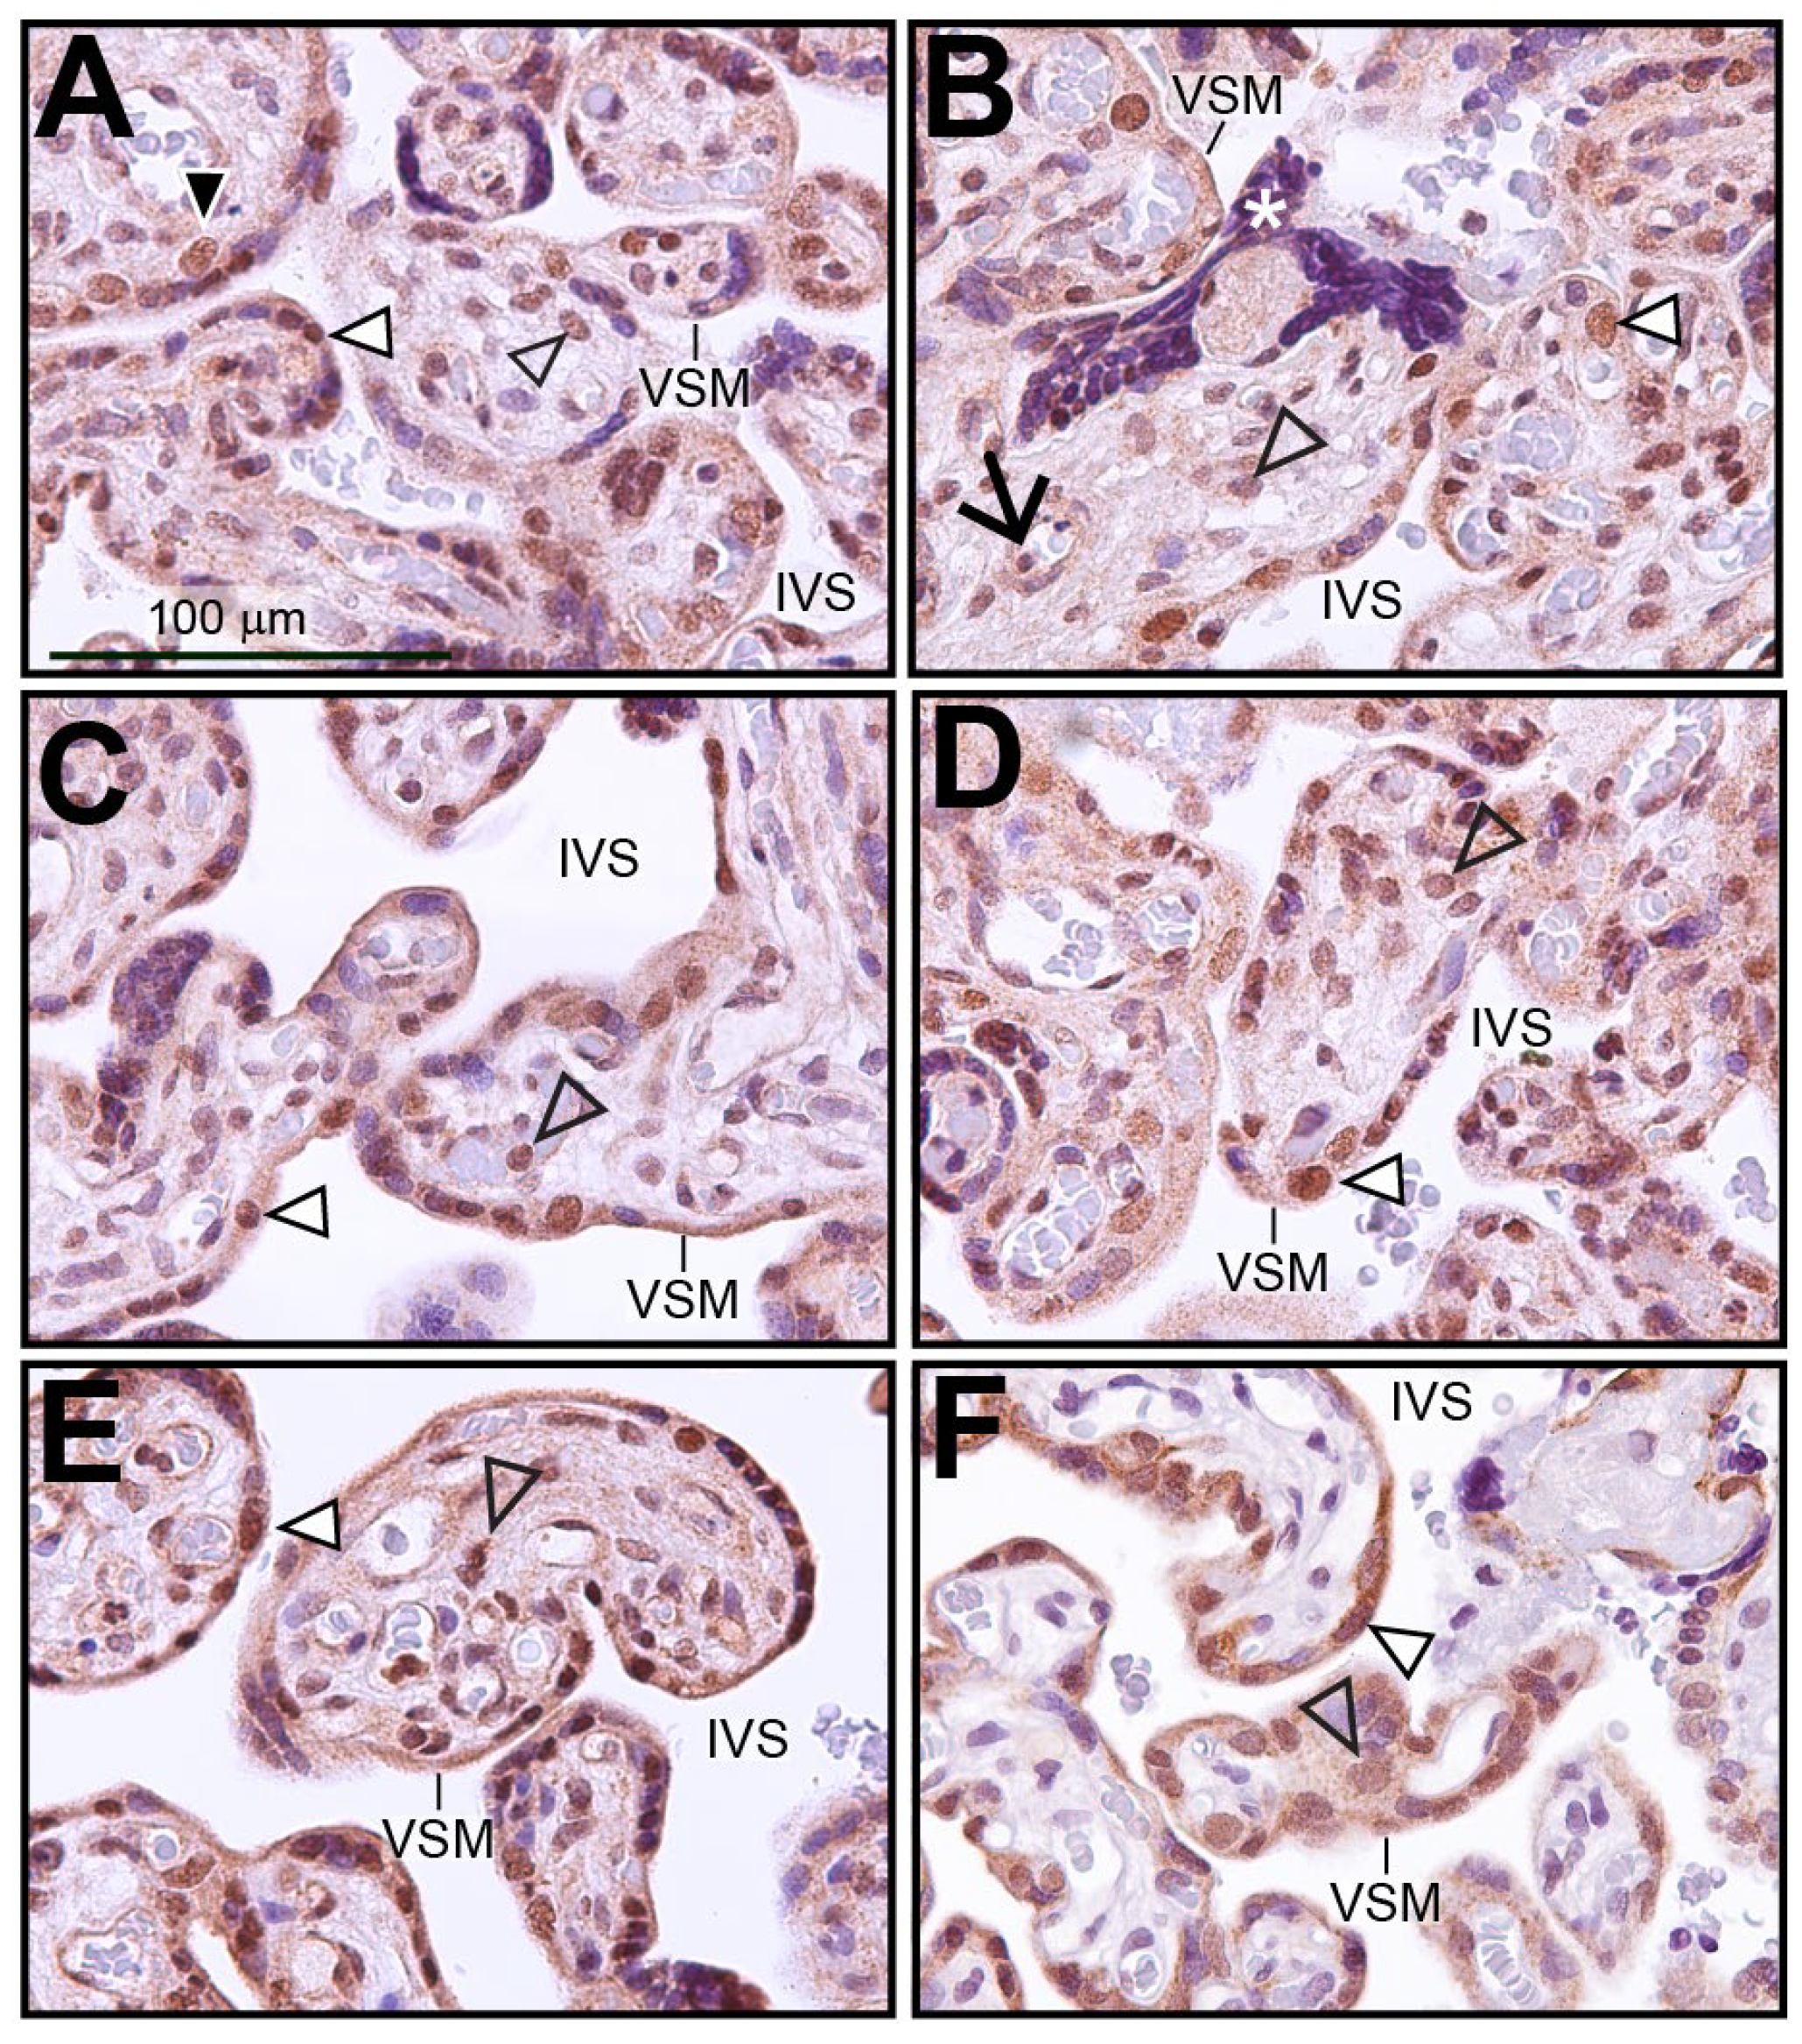
3.1. Human Term-Placenta Expresses SRC-2

Immunohistochemistry was performed on human term-placental tissue to identify the cell types within the chorionic villus that express SRC-2 (Figure 1A–E). Immunopositivity for SRC-2 was detected in the majority of syncytiotrophoblasts, which form the outer cell layer of the chorionic villus and are in direct contact with the maternal arterial blood in the intervillous space (IVS). This expression pattern was confirmed by dual immunofluorescence staining for SRC-2 and the syncytiotrophoblast marker, hCG (Figure S1). A smaller population of inner cytotrophoblast cells also exhibit SRC-2 immunopositivity (Figure 1A). Expression of SRC-2 was also observed in stromal cells within chorionic villi as well as in perivascular fibroblasts juxtaposed to fetal blood vessels (Figure 1A–E). Immunohistochemical staining for SRC-3 in human term-placental tissue shows a similar spatial expression pattern in the chorionic villi as SRC-2 (compare Figure 1A–E with Figure 1F).

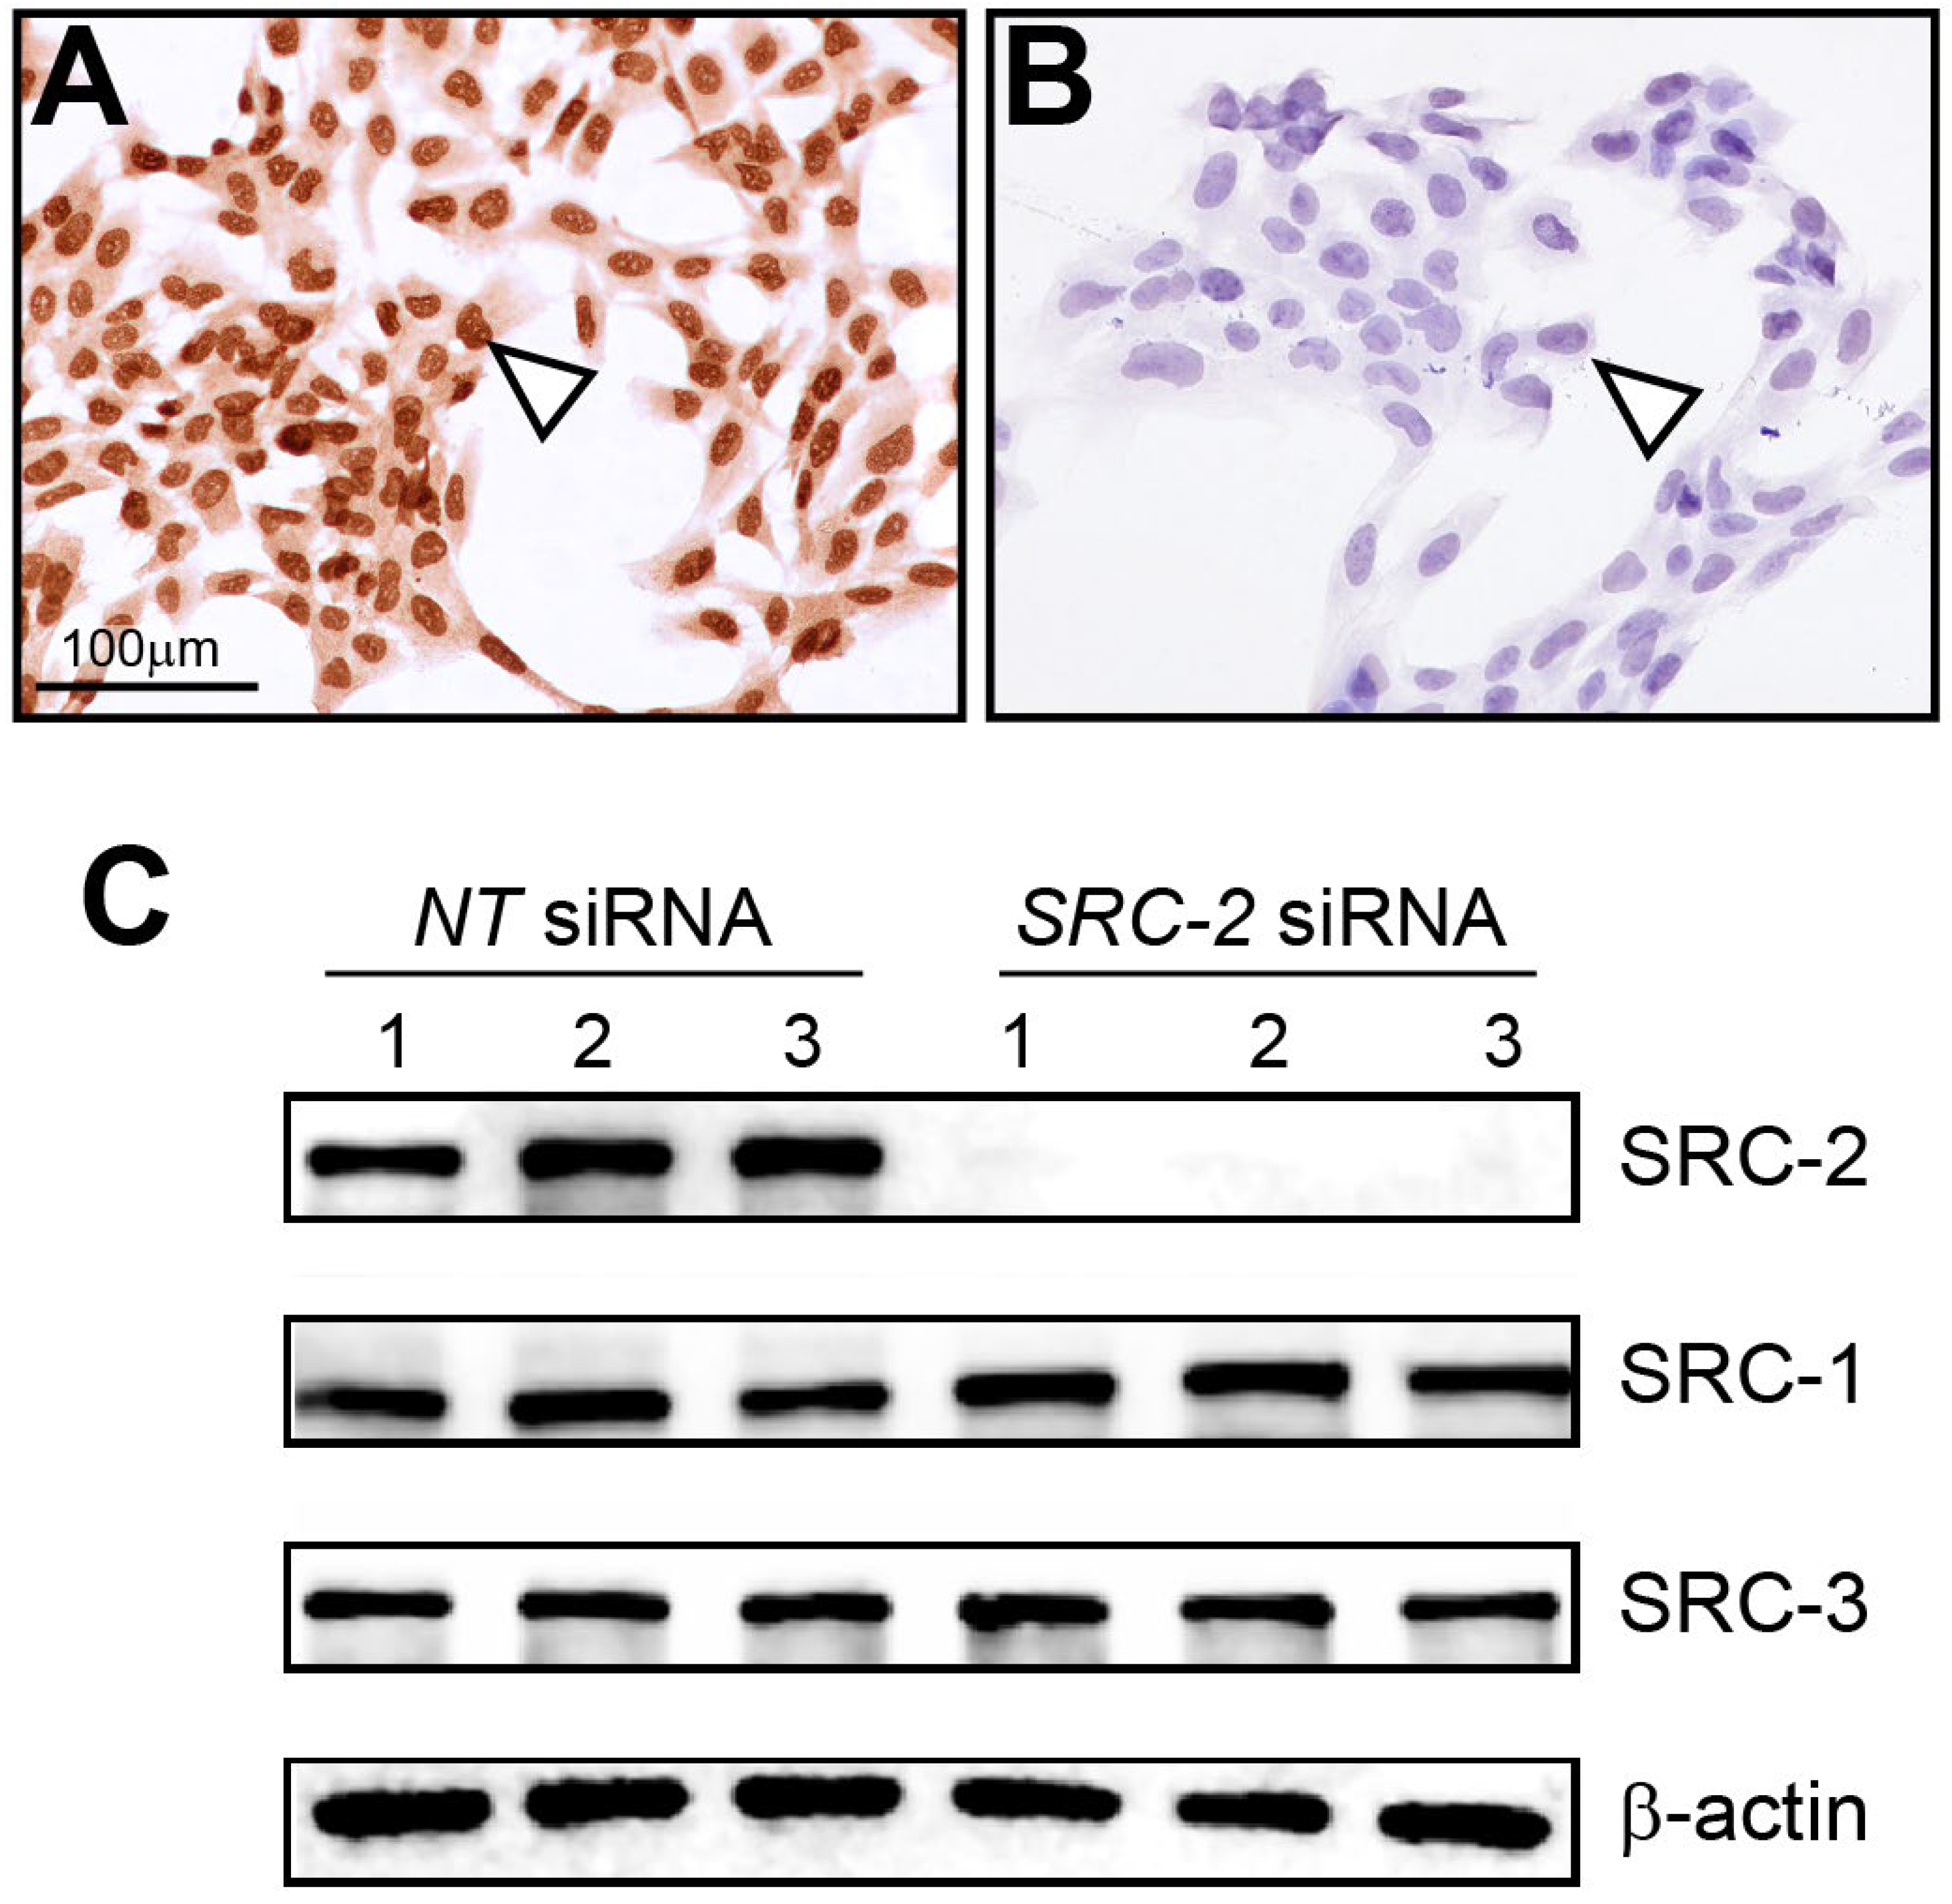
3.2. The HTR-8/SVneo Cell Line Expresses SRC-2

Immunocytochemistry detected strong nuclear staining for SRC-2 expression in HTR-8/SVneo cells (Figure 2A). As validation for the above cell expression data, immunocytochemistry detected negligible SRC-2 expression in HTR-8/SVneo cells following siRNA-mediated knockdown of SRC-2 (Figure 2B), which was further confirmed at the molecular level by immunoblot analysis (Figure 2C). Importantly, the expression levels of SRC-1 and SRC-3 are not affected by SRC-2 knockdown. Together, these results show that SRC-2 is expressed in HTR-8/SVneo cells, which model extravillous trophoblasts, an important extra-embryonic cell type in early placenta development.

3.3. Sustained Viability, Motility, and Invasiveness of HTR-8/SVneo Cells Require Normal SRC-2 Expression Levels

Because extravillous trophoblasts rely on sustained viability as well as motile and invasive functions to establish and expand the utero-placental interface [1,2], and because SRC-2 is essential for these cellular functions in other cell types [48,49,50,51], we used a siRNA-mediated knockdown approach in conjunction with established viability/proliferation, clonogenic survival, and migration and invasion assays to determine whether SRC-2 is required for any or all of these cellular properties in HTR-8/SVneo cells (Figure 3).
The standard MTT-based cell viability/proliferation assay, a colorimetric assay that measures viable cell number, demonstrated that the number of viable HTR-8/SVneo cells is markedly reduced at each pre-determined time point in culture when SRC-2 levels are reduced (Figure 3A). In clonogenic survival assays, the number and size of colonies arising from single HTR-8/SVneo cells were also significantly decreased following SRC-2 knockdown (Figure 3B–D). Furthermore, transwell assays for cell migration and invasion revealed that SRC-2 is essential for both cellular processes in HTR-8/SVneo cells (Figure 3E–J). These results underscore the importance of SRC-2 in several critical cellular functions that are known to be required by extravillous trophoblasts during early development of the placenta [2].

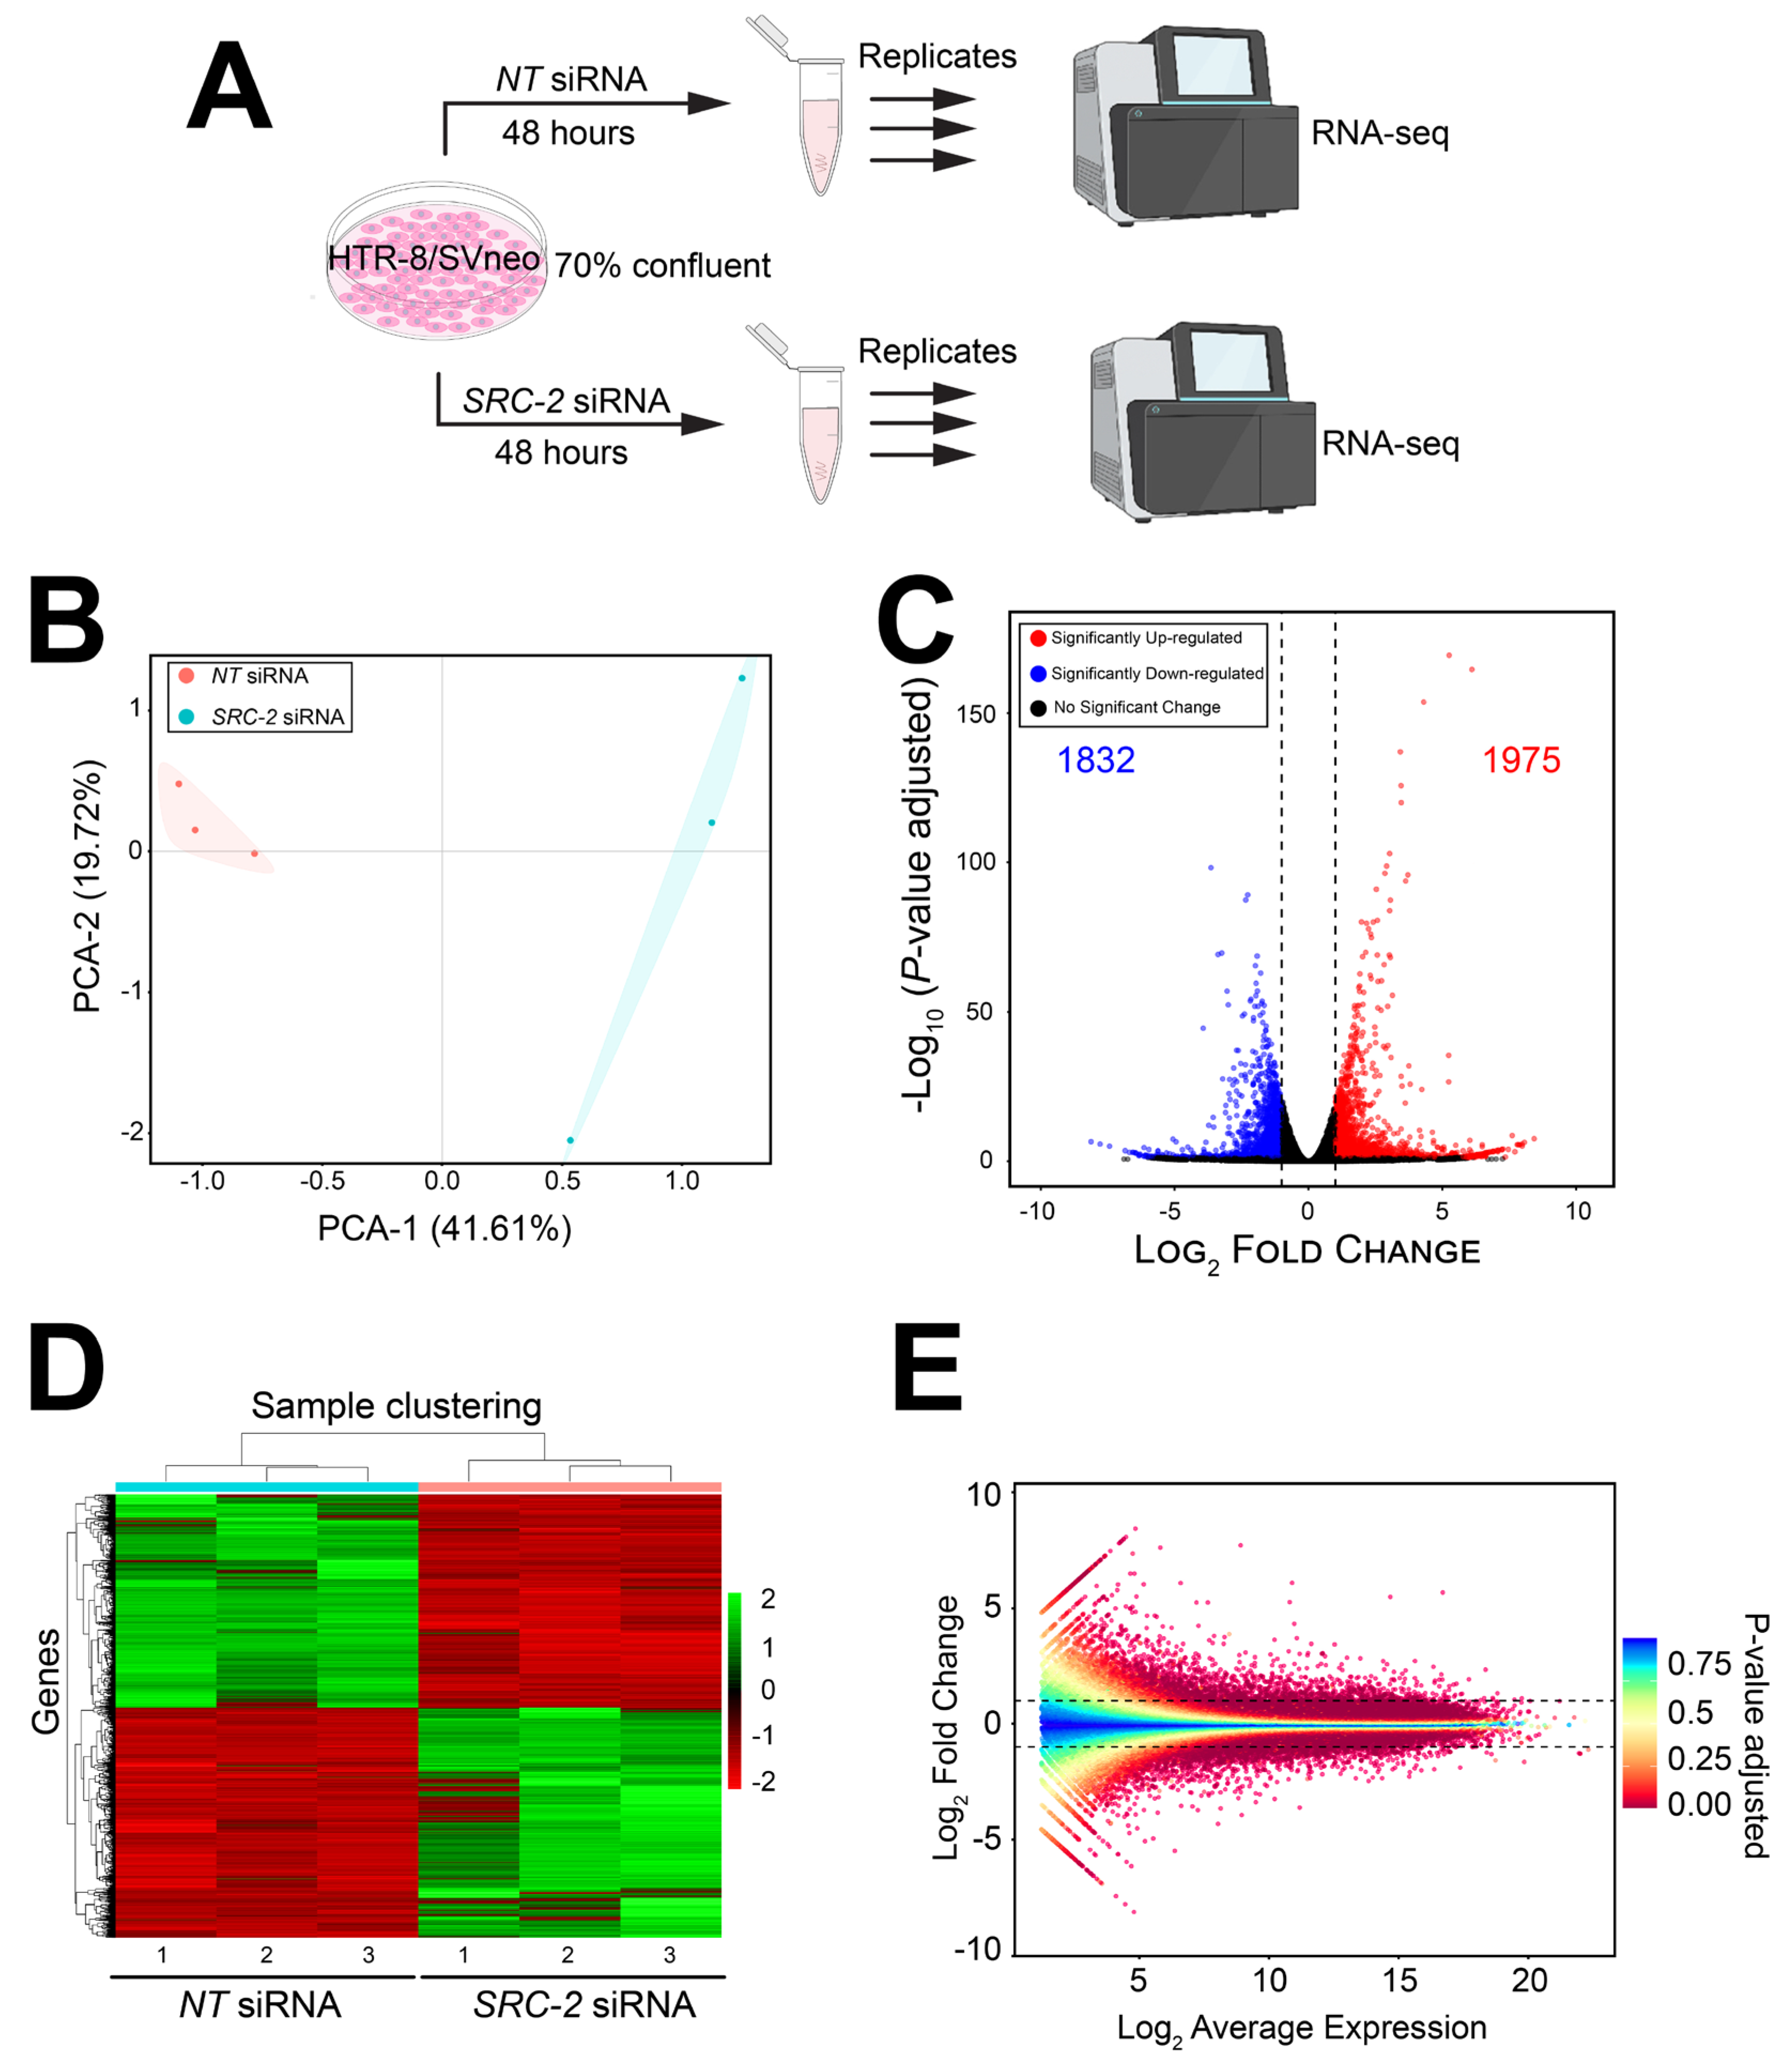
3.4. Genome-Wide Changes in the HTR-8/SVneo Cell Transcriptome Following SRC-2 Depletion

Since SRC-2 is a transcriptional coregulator that controls transcriptome integrity in other cell types and tissues [25,27,38], coupled with the finding that SRC-2 is essential for a number of extravillous trophoblastic cellular functions required for placentation (Figure 2), we used RNA-seq analysis to identify the trophoblastic transcriptome in HTR-8/SVneo cells that is dependent on SRC-2 (Figure 3).
The experimental design for the RNA-seq study is schematically shown in Figure 4A. Briefly, HTR-8/SVneo cells cultured to 70% confluency in triplicate wells of six-well plates were transfected with NT or SRC-2 siRNAs forty-eight hours prior to RNA isolation and sequencing (Figure 4A). Differentially expressed genes between the NT siRNA and SRC-2 siRNA-transfected groups are listed in Table S1, which also includes the results of the gene ontology (GO) analyses. As expected, the expression of SRC-2 was significantly downregulated (log2 fold change: −1.95) in the HTR-8/SVneo cell group that was transfected with SRC-2 siRNAs (yellow highlighted row).
The FPKM values for all genes were analyzed by principal component analysis (PCA; (Figure 4B)). The PCA demonstrates a significant separation between the cell triplicates that were transfected with either NT siRNAs or SRC-2 siRNAs (Figure 4B). Both a volcano plot and an expression heatmap provide a genome-wide perspective of the transcriptional changes that follow SRC-2 knockdown (Figure 4C and Figure 3D, respectively). Attaining the predetermined FDR (≤0.05) and IFCI (≥1.3) cutoffs, the RNA-seq analysis identified 3807 DEGs (1832 upregulated and 1975 downregulated) in HTR-8/SVneo cells following SRC-2 knockdown. The relationship between the log2 fold change and the mean normalized count of the DEG dataset is also graphically displayed in the MA plot (Figure 4E).
Initial gene ontology analysis revealed an enrichment for genes in the DEG dataset that is associated with general biological pathways involved in wound healing, extracellular signal-activated kinase 1 (ERK1) and ERK2 signaling, cytokine activity, and G-protein coupled receptor activity (Figure S2). In addition, KEGG pathway analysis of the DEGs showed an overrepresentation of pathways involved in phosphoinositide 3-kinase (PI3K)/AKT signaling, cell adhesion, and extracellular matrix (ECM)–receptor interactions (Figure S2). Interestingly, many of these enriched pathways are known to govern trophoblast cell physiology [52,53,54,55]. Together, these findings indicate that SRC-2 regulates biological responses that are in line with cellular phenotypes that underpin trophoblast functions.

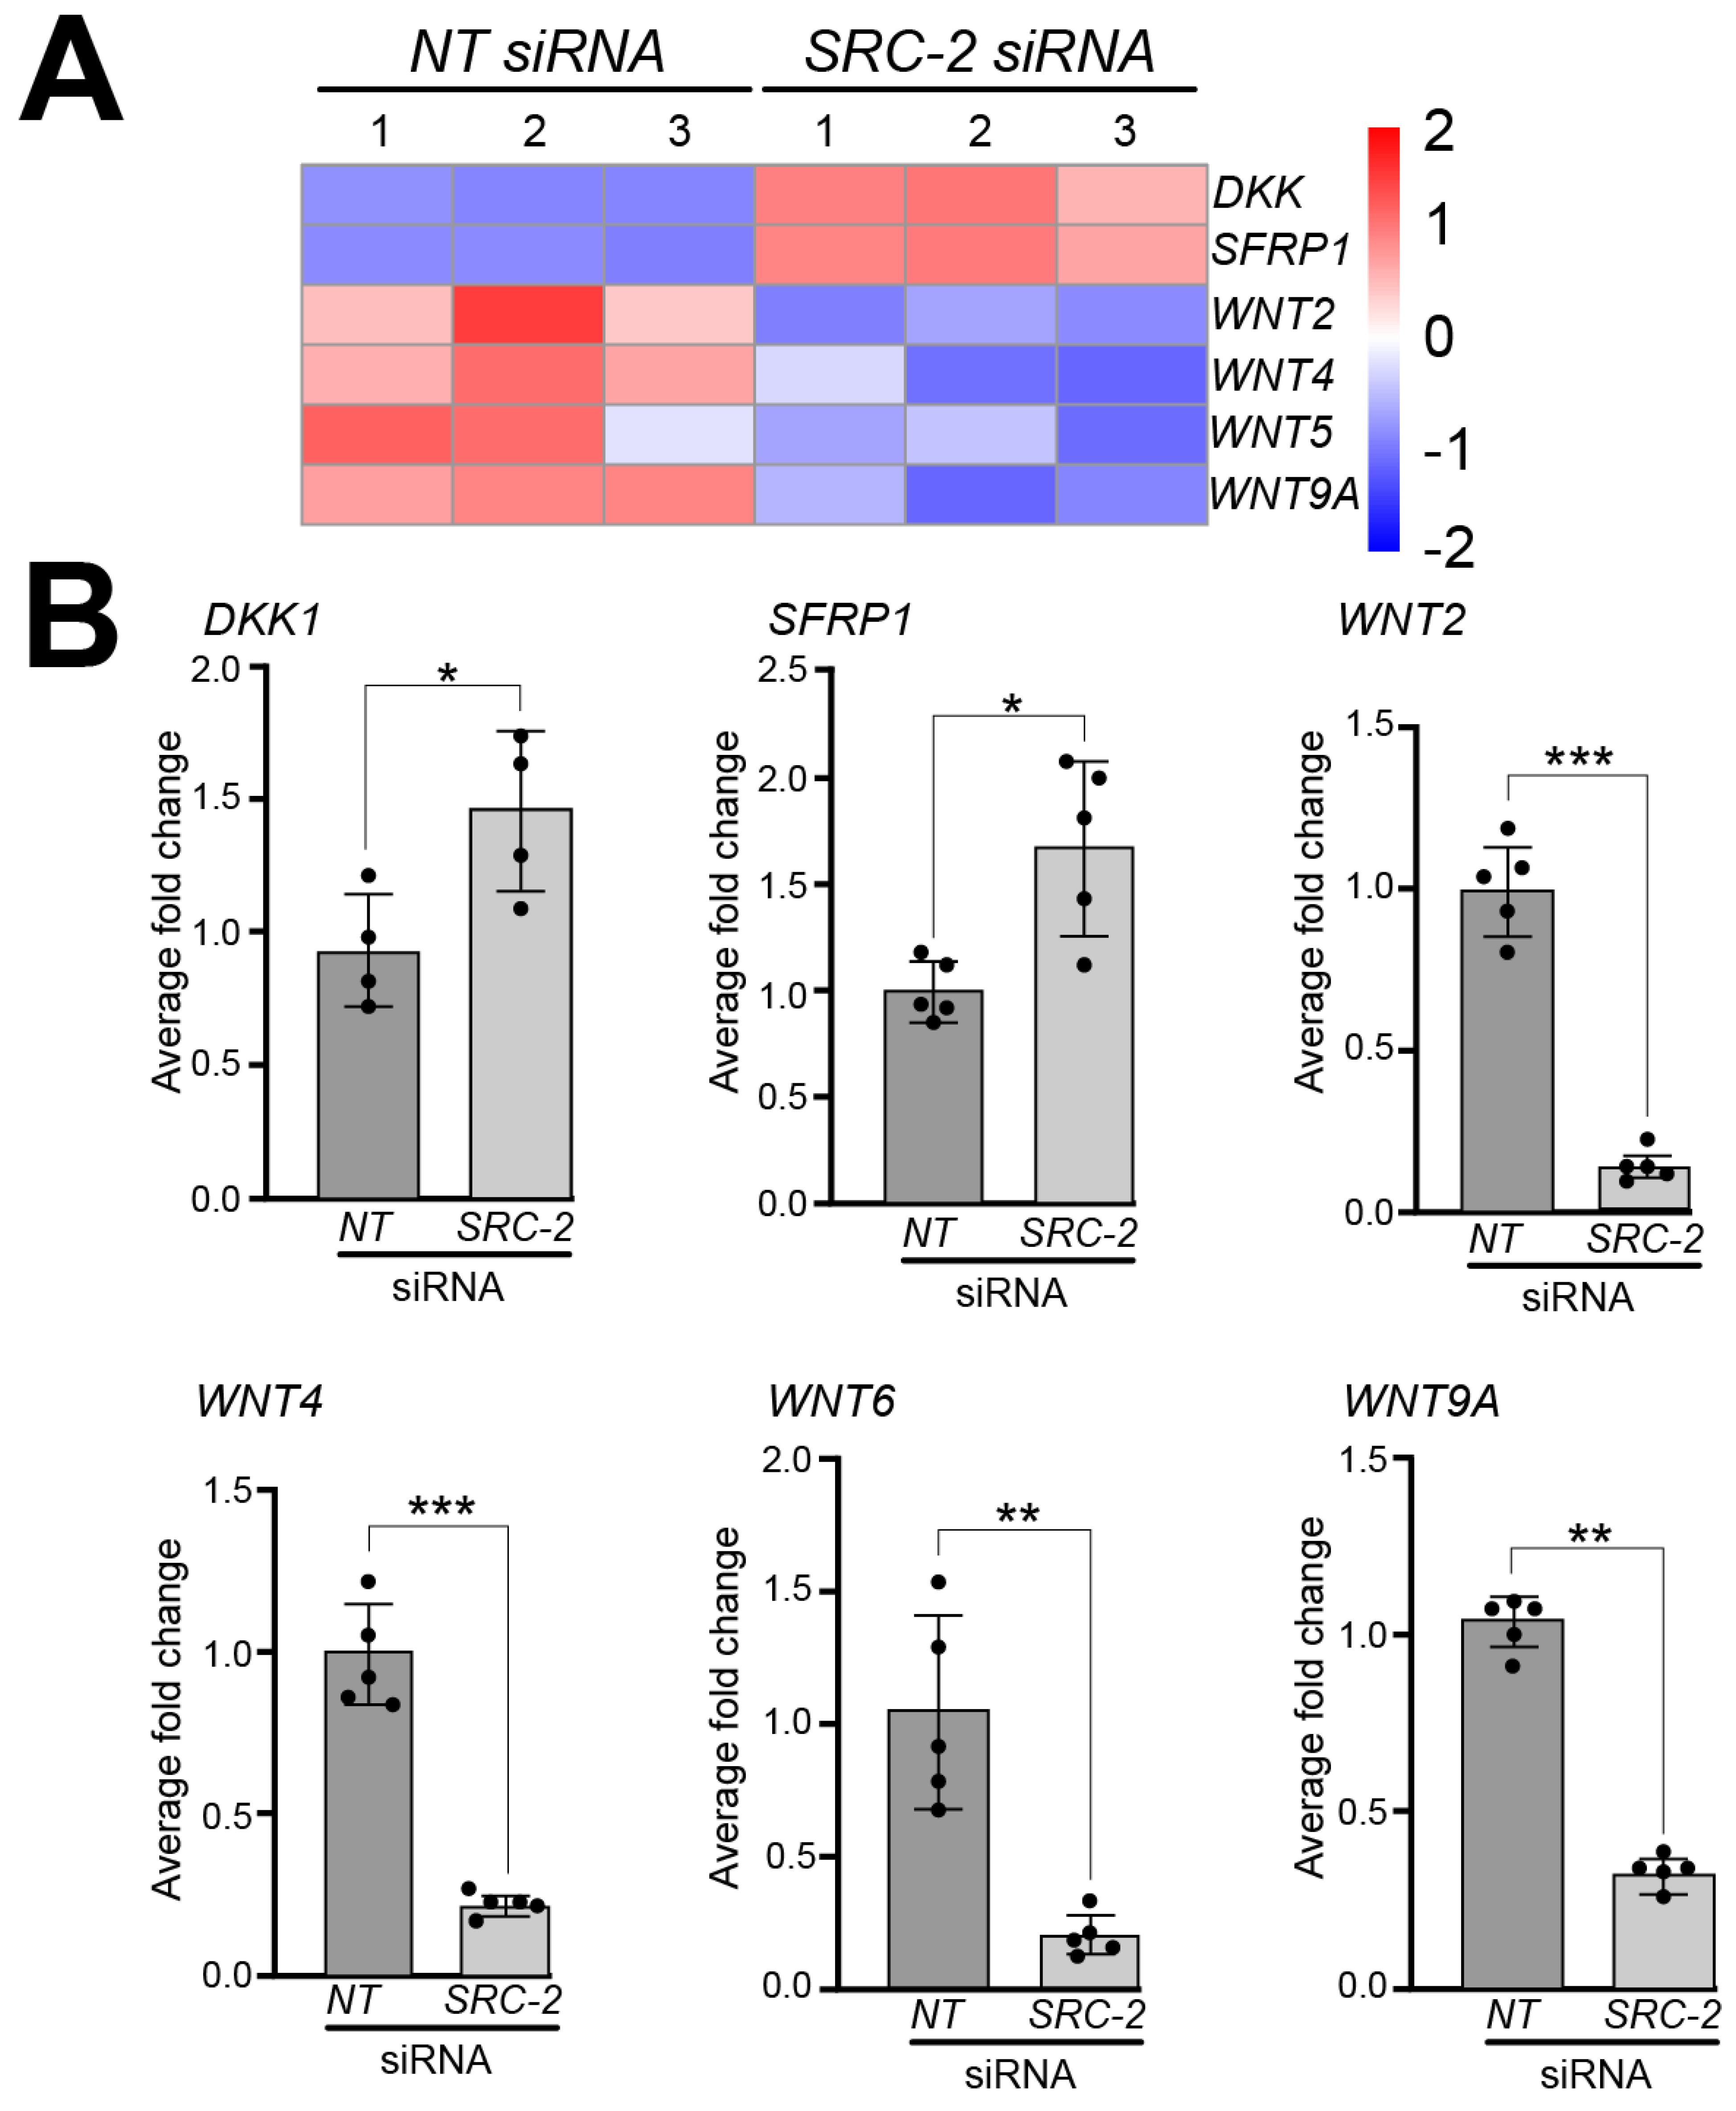
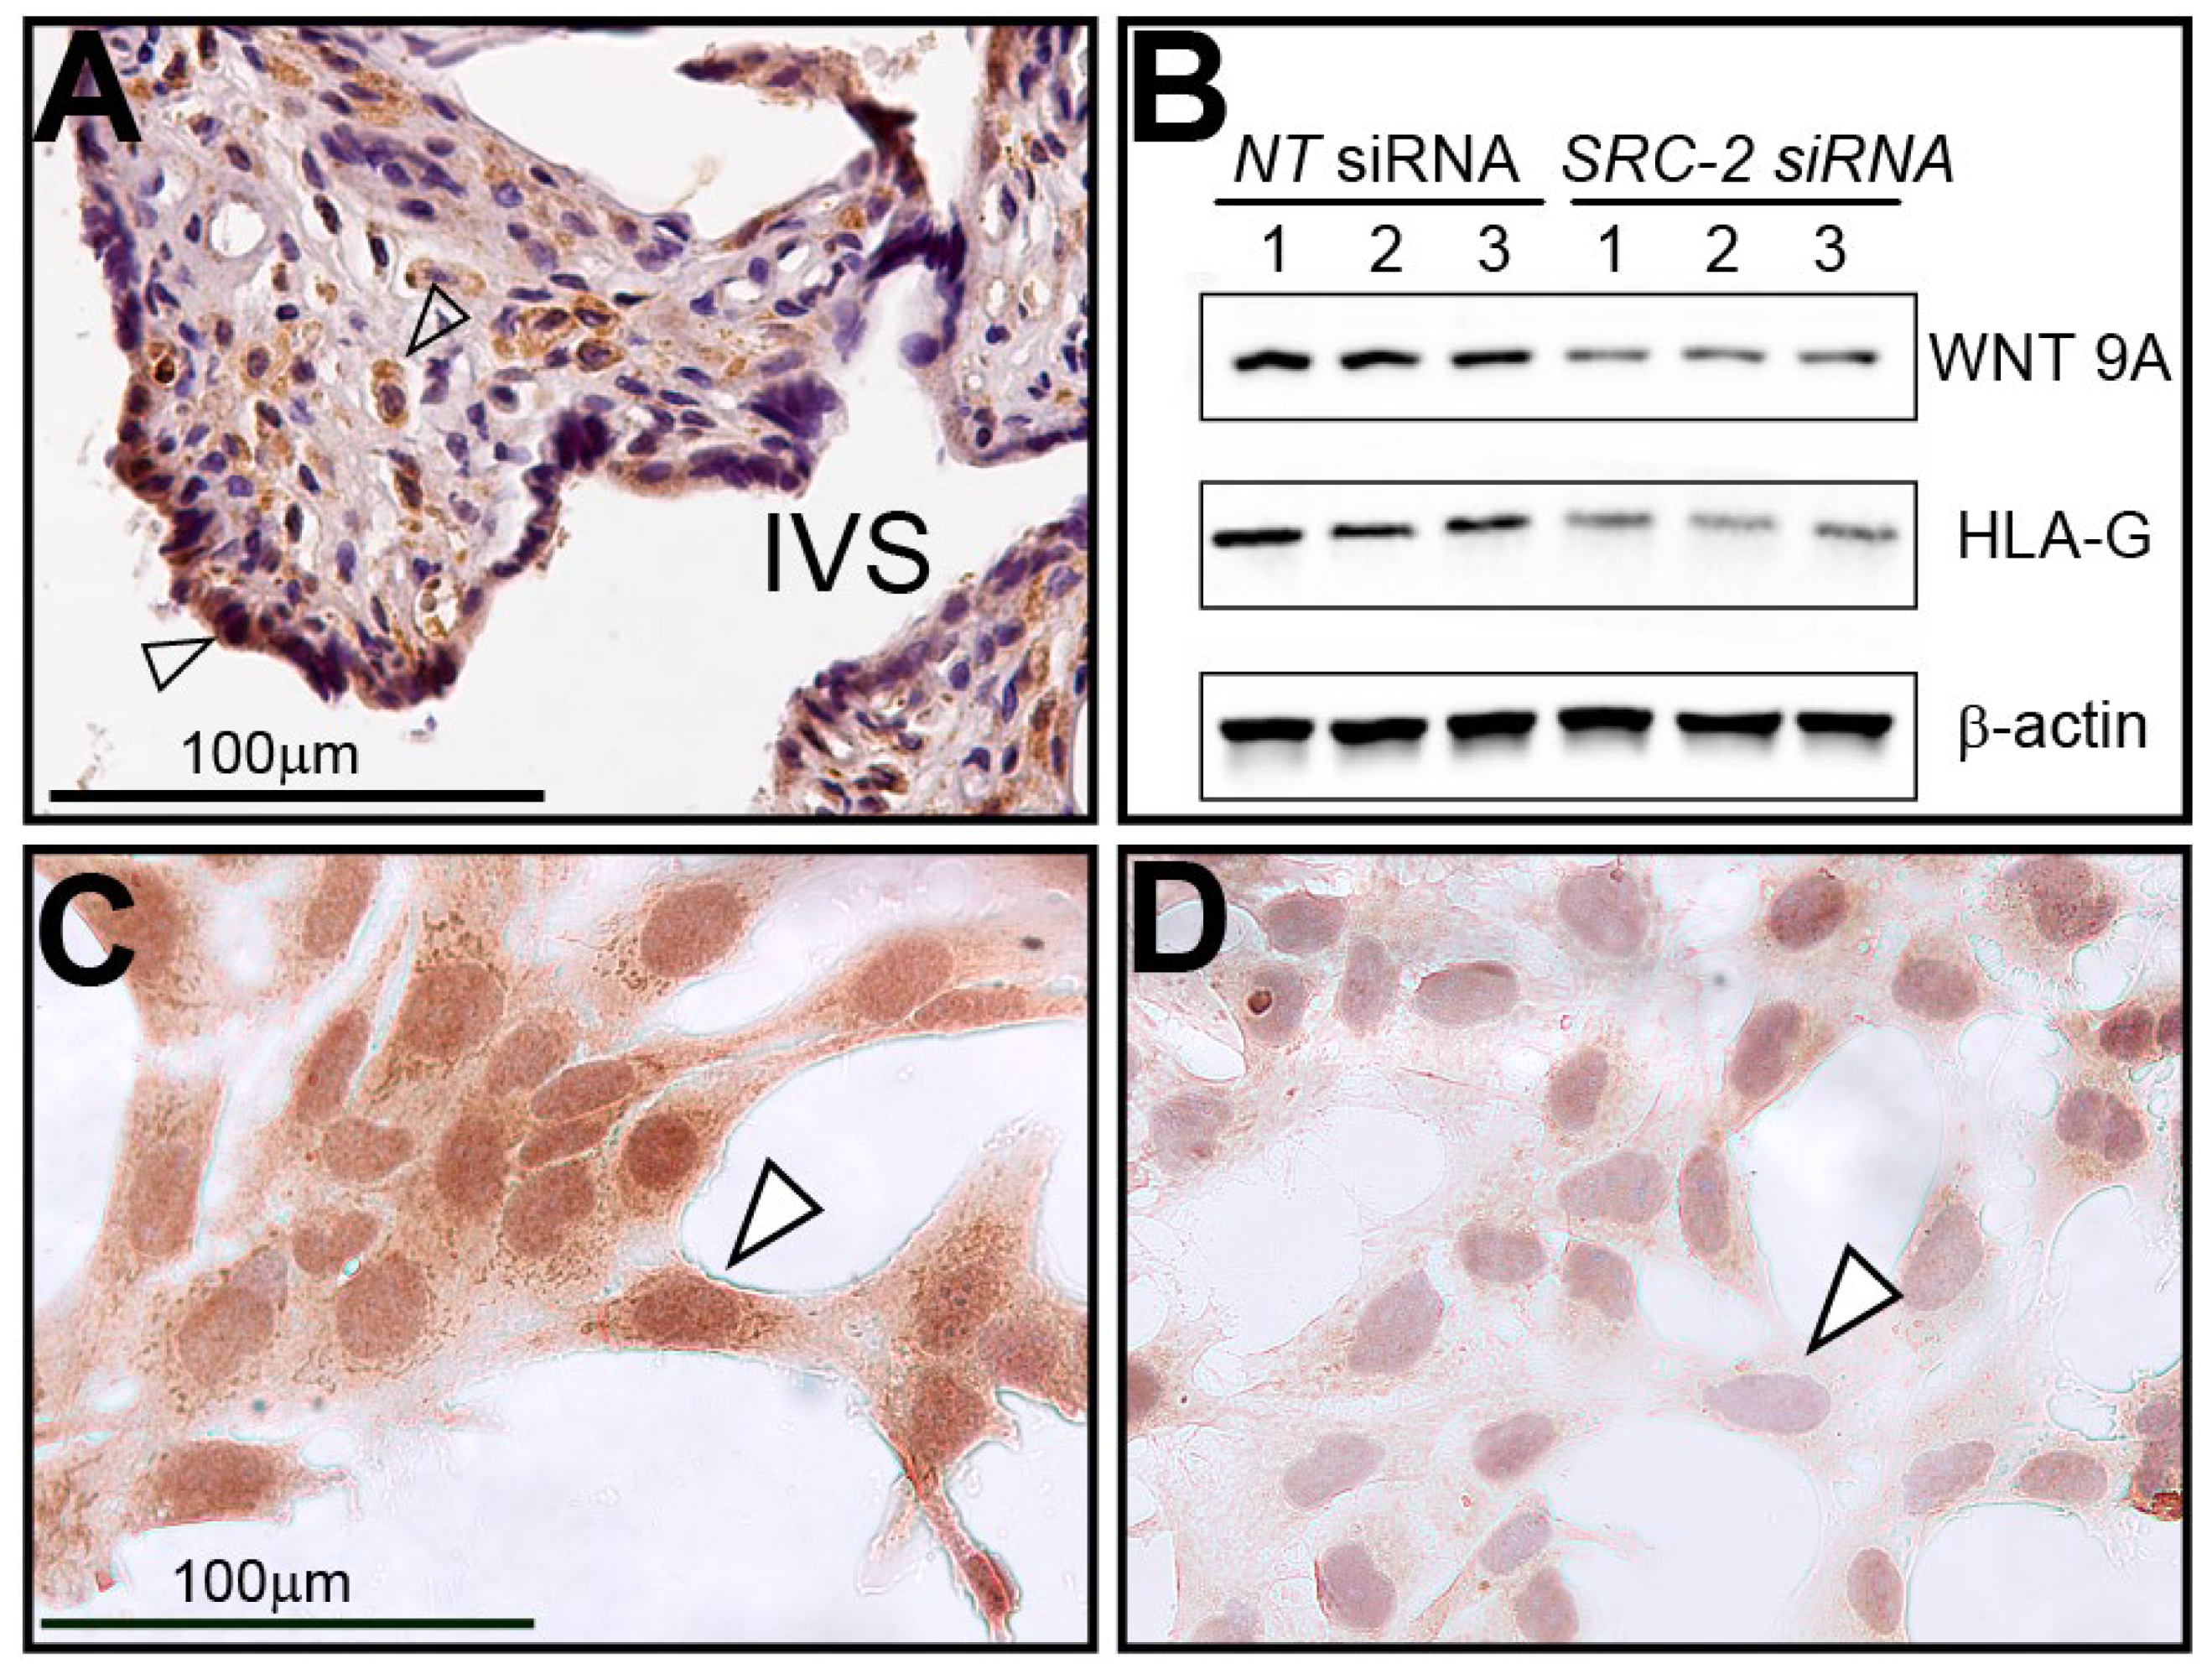
3.5. Gene Expression Associated with Trophoblastic Biology and WNT Signaling Are Significantly Reduced in HTR-8/SVneo Cells Following SRC-2 Depletion

Analyses of the HTR-8/SVneo cell DEG dataset also showed a significant reduction in the expression levels of the following genes that have previously been shown to be expressed in extravillous trophoblasts and/or HTR-8/SVneo cells; these include Calpain 6 (CAPN6) [56], Cyclin-dependent kinase inhibitor 1C (CDKN1C) [57], deiodinase type 2 (DIO2) [58], follistatin-like 3 (FSTL3) [59,60,61], forkhead box 4 (FOXO4) [62,63], and human leukocyte antigen-G (HLA-G) [64,65,66,67] (Figure 5A); expression validation of these genes by qRT-PCR is displayed in Figure 5B.
In addition, the dysregulated expression of the following trophoblast stem cell markers: Aldehyde dehydrogenase 1 family member A1 (ALDH1A1) [68], C-C motif chemokine receptor 7 (CCR7) [69], and laminin subunit beta-3 (LAMB3) [70] in HTR-8/SVneo cells following SRC-2 knockdown is shown in Figure S3A,B.
A significant number of studies implicate different components of the wingless-type MMTV integration site (WNT) family member signaling pathway in the regulation of human placental development and trophoblast differentiation [71,72]. In our RNA-seq analyses, we found that the expression of a number of WNT signaling members is dysregulated in HTR-8/SVneo cells following SRC-2 knockdown. For example, our analysis revealed significant decreased expression for the following WNT genes: WNT2, WNT4, WNT6, WNT8B, and WNT9A, and increased expression of the WNT inhibitors: Dickkopf WNT signaling pathway inhibitor 1 (DKK1) and secreted frizzled related protein 1 (SFRP1 (Figure 6A)). At the RNA level, the expression of these genes was validated by qRT-PCR (Figure 6B).

3.6. Human Term-Placental Tissue and HTR-8/SVneo Cells Express WNT9A

Immunohistochemical analysis reveals that WNT9A is expressed in human chorionic villi in term placental tissue and in cell types that are similar to cells (i.e., syncytiotrophoblasts and stromal cells) that express SRC-2 (Figure 7A). Both Western immunoblotting and immunocytochemistry demonstrate that WNT9A is not only expressed in HTR-8/SVneo cells but that its full expression is dependent on SRC-2 (Figure 7B–D).

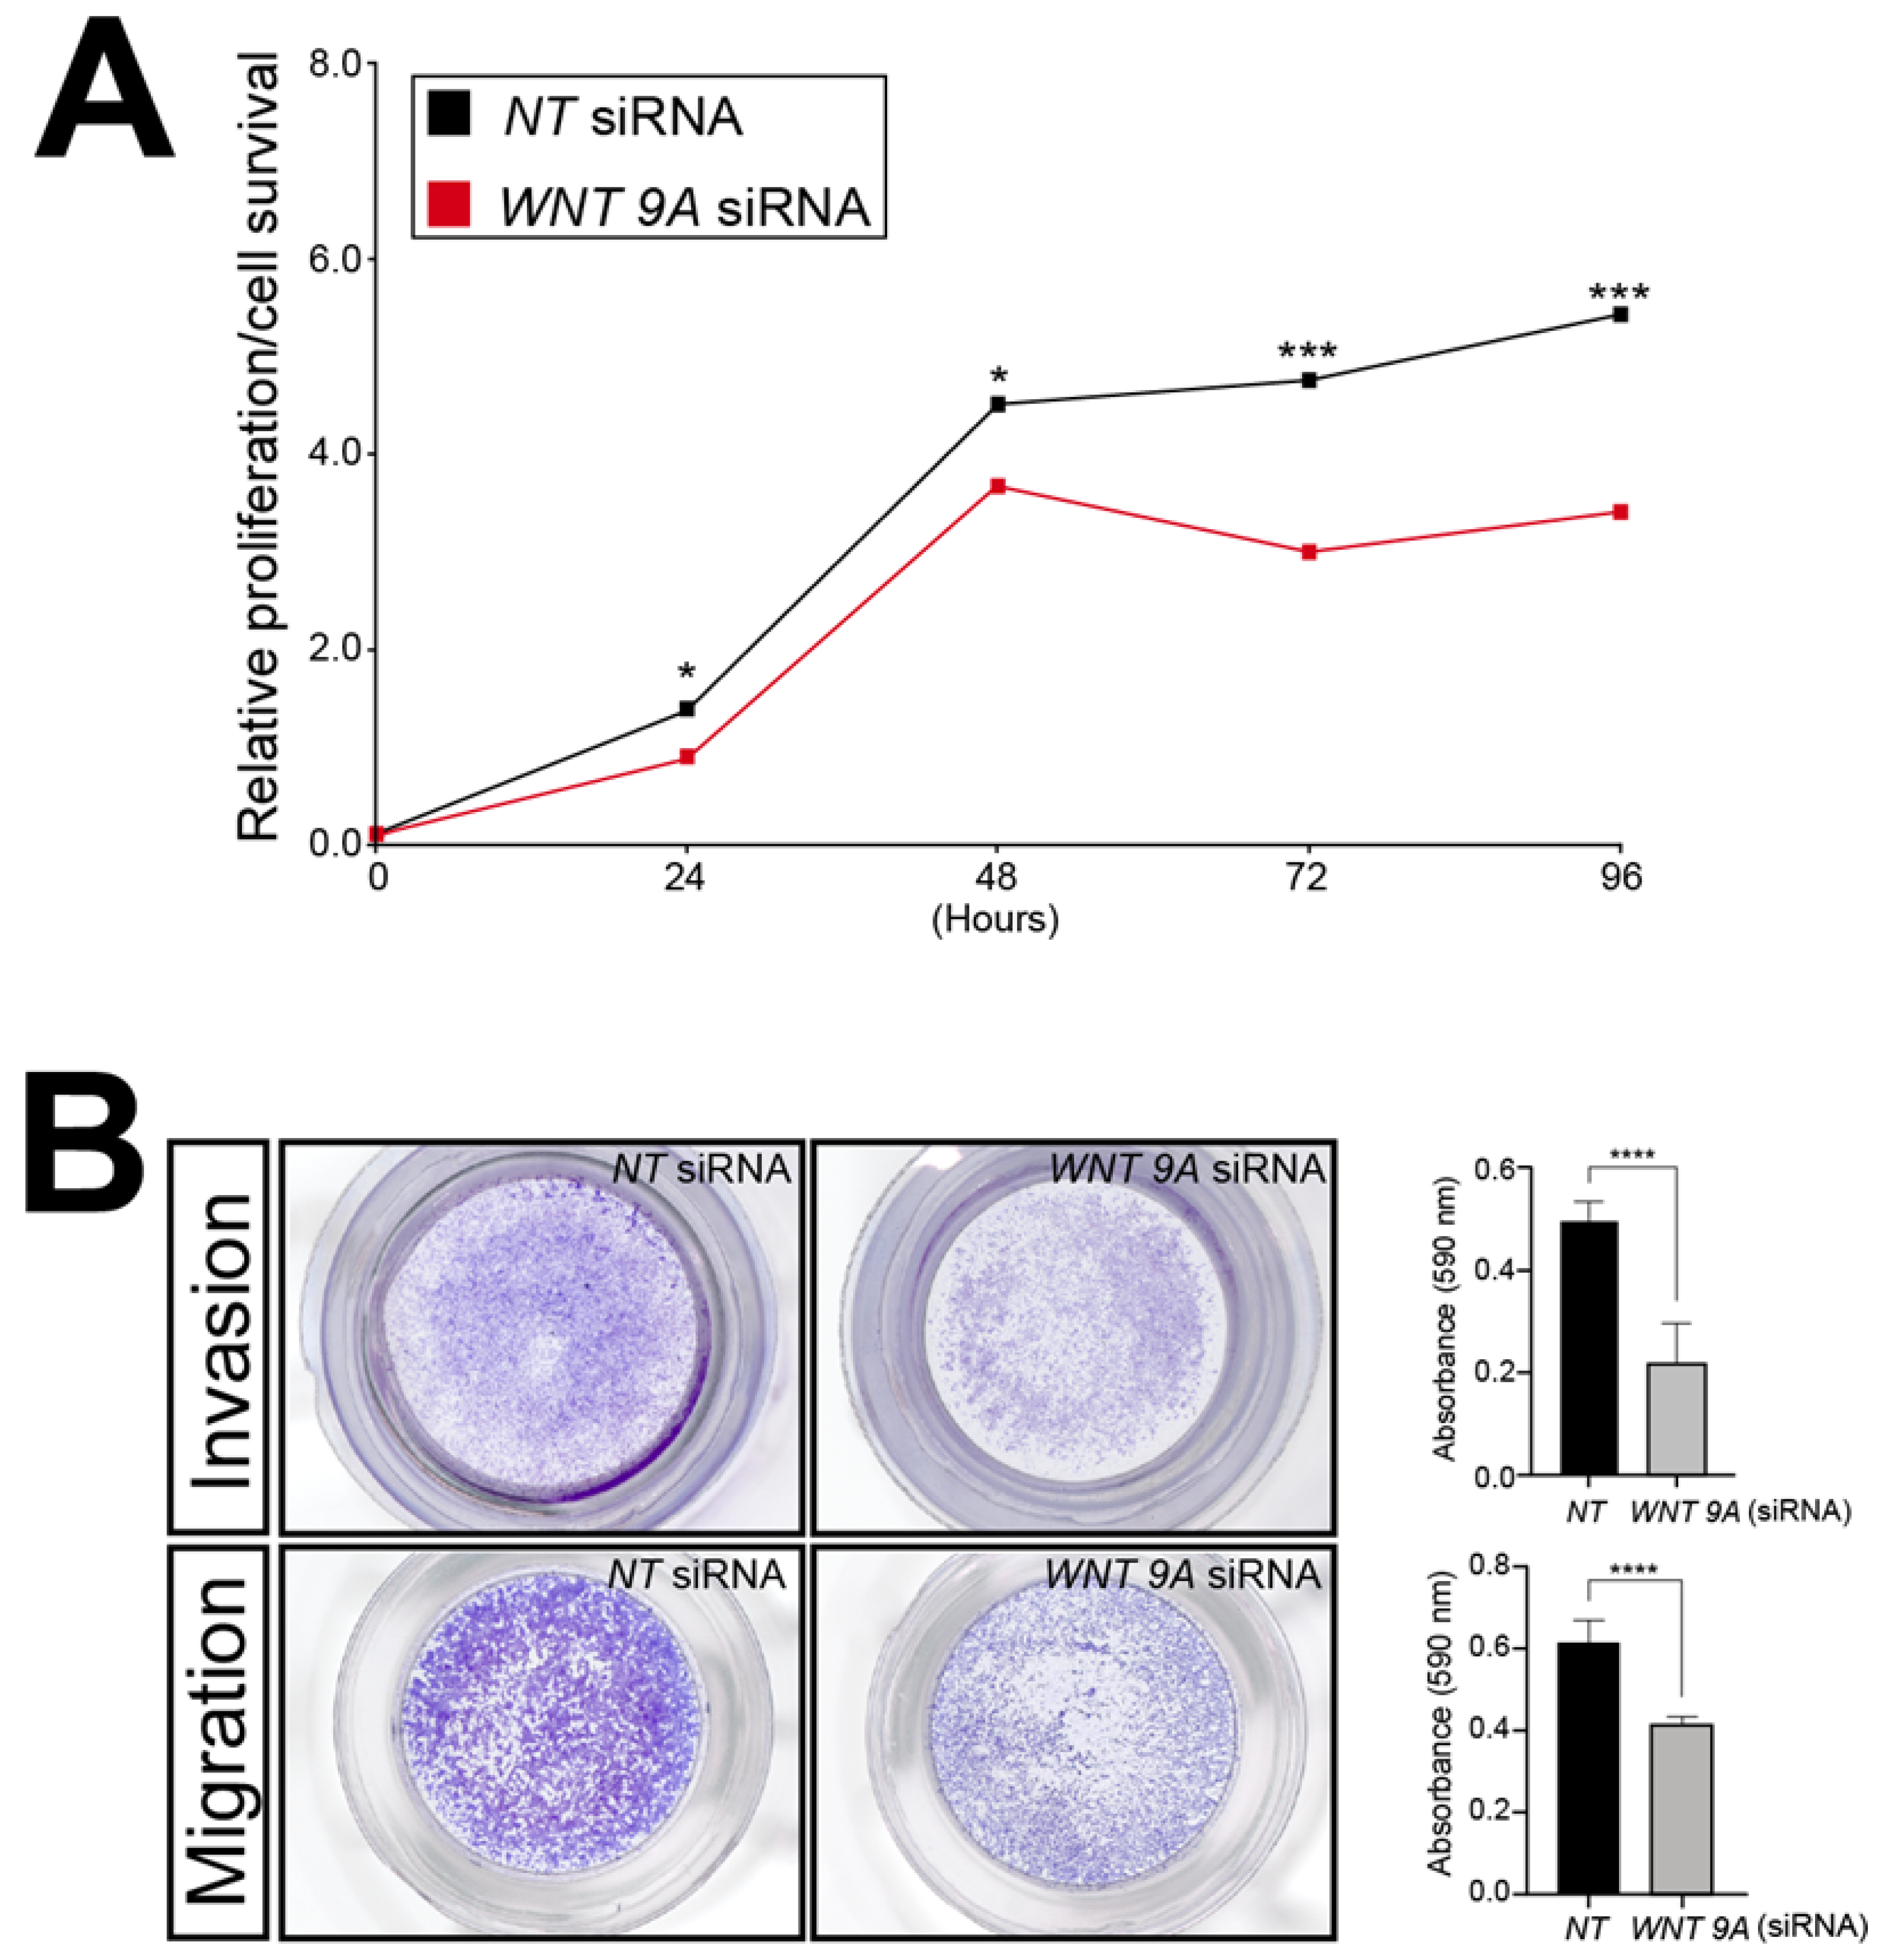
3.7. Attenuation of WNT9A Expression Significantly Reduces the Sustained Viability, Motility, and Invasiveness of HTR-8/SVneo Trophoblast Cells

To showcase the utility of this RNA-seq dataset, WNT9A was chosen further for analyses because this Wnt ligand has not been previously associated with trophoblast biology. Accordingly, the functional importance of WNT9A expression to the viability, invasion, and migration properties of the HTR-8/SVneo cells following WNT9A siRNA-mediated knockdown was assessed by in vitro assays described above. Similar to SRC-2 (Figure 3), these assays revealed that WNT9A expression is essential for optimum HTR-8/SVneo cellular viability, invasion, and migration (Figure 8).
Collectively, these assays provide functional support for the proposal that WNT9A expression, which is dependent on SRC-2, is essential for trophoblastic functions linked with the development and expansion of the embryonic placenta.

4. Discussion

From endometrial receptivity to decidualization, uterine-derived SRC-2 is essential for pregnancy establishment [23]. Studies here are the first to support a possible role for embryonic-derived SRC-2 in pregnancy initiation, suggesting distinct roles for SRC-2 in the maternal and fetal compartments of the placenta during the peri-implantation period. Further underscoring SRC-2’s possible multifunctionality in placental biology, SRC-2 is expressed in many placental cell types—syncytiotrophoblasts, cytotrophoblasts, perivascular fibroblasts, and stromal cells—of the chorionic villus, each known to exhibit specialized roles in ensuring normal placental development and/or function [6].
Using the immortalized first-trimester trophoblast HTR-8/SVneo cell line, established in vitro assays demonstrated an indispensable role for SRC-2 in sustaining HTR-8/SVneo cell viability and in maintaining this cell type’s optimum migratory and invasive properties. From a physiological perspective, these findings are significant as extravillous trophoblasts migrate from the anchoring chorionic villus to invade the maternal decidual basalis to ensure a strong uteroplacental interface [9]. Apart from remodeling the endometrial stromal environment, extravillous trophoblasts transform into endovascular trophoblasts, which convert maternal spiral arterioles into large dilated uteroplacental arteries, essential for normal functioning of the fetomaternal nutrient and gas exchange interface. Impairments in this vasodilation enhancement are attributable to obstetrical complications, such as preeclampsia, fetal growth restriction, and preterm birth [1,16,19,20,73,74,75].
In support of SRC-2 as a potent transcriptional coregulator in the HTR-8/SVneo cell, transcriptomic analyses revealed that the expression levels of a significant number of genes, previously ascribed to the placental phenotype in general or to the trophoblast phenotype specifically, are markedly changed as a consequence of SRC-2 depletion. Interestingly, the expression levels of select members of the WNT signaling pathway are significantly altered when SRC-2 levels are reduced. As a result of this SRC-2 deficit, the net transcriptional changes in WNT signaling components in the HTR-8/SVneo cell result in a reduction in WNT signaling activity. In the context of placental development, canonical WNT-activated signal transduction is known to be pivotal for the renewal of the trophoblast stem cell and its differentiation into syncytiotrophoblasts and extravillous trophoblast cell lineages [72,76,77,78,79]. These studies underscore the proposal that tight coordination between the maintenance of trophoblast stemness and trophoblast stem cell differentiation is critical to the development of a healthy placenta.
Apart from maintaining trophoblastic stemness or specifying a program of trophoblast differentiation, WNT signaling is essential for the functioning—migration and invasion—of the extravillous trophoblast once formed [80,81,82,83,84]. Along with established WNT factors in trophoblast function (WNT2, WNT4, WNT6, WNT8B, DKK1, SFRP1 [81,85,86,87,88,89,90,91], we reveal that the expression of WNT 9A is reduced with SRC-2 knockdown. A paralog of WNT 9B, WNT9A (initially named WNT 14), is a secreted WNT ligand driving both canonical and non-canonical WNT signaling pathways [92]. Zebrafish and mouse model studies have shown that WNT 9A activity is linked to a broad spectrum of physiologies, ranging from specification of hematopoietic stem cells from embryonic stem cells, embryonic patterning, to organogenesis [92]. Although there is a limited understanding of WNT 9A in the trophoblast cell lineage, early studies document WNT9A expression in the trophectoderm of the murine embryo [93]. Interestingly, analysis of recent transcriptomic datasets derived from placental tissue biopsied from pregnancies of healthy normotensive women (n = 147) and women diagnosed with preeclampsia (n = 91) [94] show that WNT 9A along with SRC-2 are significantly reduced in placenta tissue from preeclampsia patients (WNT 9A: (Log2FC(DESeq2) = −0.22; adjusted p-value 0.032); SRC-2: (Log2FC(DESeq2) = −0.09; adjusted p-value: 0.029) https://www.obgyn.cam.ac.uk/placentome [94]; accessed 4 October 2024). Given that the activities of SRC family members and WNT signaling intersect in other physiological systems [95,96,97] along with our cell-based results here, it is not unreasonable to propose that WNT 9A may represent one of a number of WNT activation transduction pathways through which SRC-2 controls extravillous trophoblast cell migration and invasion.
Using the HTR-8/SVneo cell model, previous studies have shown that SRC-3, a close relative of SRC-2, is critical for HTR-8/SVneo cell invasive and migratory functions, whereas, unlike SRC-2 (Figure 2A), SRC-3 is not required for HTR-8/SVneo cell viability [30]. These studies also showed that SRC-3 directly interacts with AKT as a mechanism by which SRC-3 regulates HTR-8/SVneo cell migration and invasion. Interestingly, our transcriptomic studies predict that the PI3K/AKT signaling pathway may also be adversely affected with SRC-2 depletion in the HTR-8/SVneo cell. Future studies will address this proposal along with addressing whether SRC-2 is critical for the development of the syncytiotrophoblast and/or extravillous trophoblast cell lineages from the cytotrophoblastic stem cell through use of the human trophoblast stem cell model [98,99].

5. Conclusions

Our investigations highlight an unsuspected role for SRC-2 in trophoblastic cell functions that are known to drive mammalian placentation. Cell-based assays paired with transcriptomic analysis reveal that select components of the WNT signaling pathway can mediate SRC-2’s role in maintaining the sustained viability, motility, and invasion of the extravillous trophoblast. Together, these findings support an indispensable role for SRC-2 and its WNT effectors in maintaining optimum functioning of the extravillous trophoblast, a placental cell type that is essential for early pregnancy establishment.

Supplementary Materials

The following supporting information can be downloaded at: https://www.mdpi.com/article/10.3390/cells14131024/s1, Figure S1. Human pregnancy-term placental tissue co-express hCG and SRC-2. (A) Human chorionic villi stained for DAPI (open triangle). (B) Same section immunofluorescently stained for hCG (green; open triangle). (C) Same section immunofluorescently stained for SRC-2 (red; open triangle). (D) Merged image of images in (B) and (C); note the colocalization of hCG and SRC-2 (open triangle). Scale bar in (A) applies to all panels. Figure S2. (A–C) Dot plots of enriched genes within the DEG dataset between the NT siRNA and SRC-2 siRNA transfected HTR-8/SVneo groups are categorized according to biological processes, cellular components, and molecular functions respectively. (D) Analysis by KEGG reveals top enrichment for proteins involved in PI3K-AKT signaling, cell adhesion, protein digestion and absorption, and extracellular matrix-receptor interactions. Figure S3. (A) Heat map showing the difference in expression of ALDH1A1, CCR7, and LAMB3 in HTR-8/SVneo cells following NT siRNA or SRC-2 siRNA knockdown. (B) Histograms show the quantitative differences in expression of ALDH1A1, CCR7, and LAMB3 between the NT siRNA and SRC-2 siRNA treated HTR-8/SVneo groups. Results in histograms are indicated as the mean ± standard deviation and are representative of three independent experiments; ** p-value < 0.01; *** p-value < 0.001; **** p-value < 0.0001. Table S1. Differentially expressed genes between the NT siRNA and SRC-2 siRNA-transfected groups.

Author Contributions

V.K.M., P.P. and J.P.L. designed the experimental approaches used in these studies. V.K.M. and P.P. conducted the experiments. V.K.M., R.K., B.C.N., D.M.L., B.W.O. and J.P.L. formulated the conceptual ideas for the experimental studies as well as analyzed and interpreted the downstream results. Studies were supervised by J.P.L., while the manuscript and figures were prepared by V.K.M., P.P., R.K. and J.P.L. All authors have read and agreed to the published version of the manuscript.

Funding

This project was supported in part by funding from the National Institutes of Health/National Cancer Institute (NIH/NCI grant: P30CA125123) and from the Cancer Prevention and Research Institute of Texas (CPRIT grant: RP200504), awarded to the Genomic and RNA Profiling (GARP) Core at Baylor College of Medicine. This research was also funded by the NIH/Eunice Kennedy Shriver National Institute of Child Health and Human Development (NICHD) grants: (R01 HD-104813) to RK, (R24 HD113024) to RM, (R01 HD-07857, HD-08188) to BWO, and (R01 HD-042311) to JPL.

Institutional Review Board Statement

The study was conducted according to the guidelines of the Declaration of Helsinki and approved by the Institutional Review Board of The University of Texas Medical Branch, Galveston, TX, USA (IRB16.0058, 7 January 2020).

Informed Consent Statement

Patient consent was exempted as the placentae were non-identifiable and were to be discarded.

Data Availability Statement

The data from these studies are available following a reasonable request to the corresponding author.

Acknowledgments

We thank Yan Ying for her invaluable technical assistance. We also thank CD Genomics Inc., Shirley, New York for assistance in the bioinformatic analyses.

Conflicts of Interest

The authors declare that there are no conflicts of interest that could be perceived as prejudicing the impartiality of the research reported.

References

  1. Maltepe, E.; Fisher, S.J. Placenta: The forgotten organ. Annu. Rev. Cell Dev. Biol. 2015, 31, 523–552. [Google Scholar] [CrossRef] [PubMed]
  2. Soares, M.J.; Varberg, K.M.; Iqbal, K. Hemochorial placentation: Development, function, and adaptations. Biol. Reprod. 2018, 99, 196–211. [Google Scholar] [CrossRef] [PubMed]
  3. Burton, G.J.; Watson, A.L.; Hempstock, J.; Skepper, J.N.; Jauniaux, E. Uterine glands provide histiotrophic nutrition for the human fetus during the first trimester of pregnancy. J. Clin. Endocrinol. Metab. 2002, 87, 2954–2959. [Google Scholar] [CrossRef] [PubMed]
  4. Soares, M.J. Embryo implantation-coordination of maternal and embryonic adaptations. Int. J. Dev. Biol. 2014, 58, 71–74. [Google Scholar] [CrossRef]
  5. Kojima, J.; Ono, M.; Kuji, N.; Nishi, H. Human Chorionic Villous Differentiation and Placental Development. Int. J. Mol. Sci. 2022, 23, 8003. [Google Scholar] [CrossRef]
  6. Hemberger, M.; Hanna, C.W.; Dean, W. Mechanisms of early placental development in mouse and humans. Nat. Rev. Genet. 2020, 21, 27–43. [Google Scholar] [CrossRef]
  7. Soares, M.J.; Vivian, J.L. Tipping the balance toward trophoblast development. Proc. Natl. Acad. Sci. USA 2016, 113, 5144–5146. [Google Scholar] [CrossRef]
  8. Ruane, P.T.; Garner, T.; Parsons, L.; Babbington, P.A.; Wangsaputra, I.; Kimber, S.J.; Stevens, A.; Westwood, M.; Brison, D.R.; Aplin, J.D. Trophectoderm differentiation to invasive syncytiotrophoblast is promoted by endometrial epithelial cells during human embryo implantation. Hum. Reprod. 2022, 37, 777–792. [Google Scholar] [CrossRef]
  9. Knofler, M.; Haider, S.; Saleh, L.; Pollheimer, J.; Gamage, T.; James, J. Human placenta and trophoblast development: Key molecular mechanisms and model systems. Cell Mol. Life Sci. 2019, 76, 3479–3496. [Google Scholar] [CrossRef]
  10. Burton, G.J.; Moffett, A. Trophoblast remodeling of the uterine veins and maternal placental blood flow. Am. J. Obstet. Gynecol. 2023, 229, 704–705. [Google Scholar] [CrossRef]
  11. Li, Q.; Sharkey, A.; Sheridan, M.; Magistrati, E.; Arutyunyan, A.; Huhn, O.; Sancho-Serra, C.; Anderson, H.; McGovern, N.; Esposito, L.; et al. Human uterine natural killer cells regulate differentiation of extravillous trophoblast early in pregnancy. Cell Stem Cell 2024, 31, 181–195.e189. [Google Scholar] [CrossRef] [PubMed]
  12. Moffett, A.; Shreeve, N. Local immune recognition of trophoblast in early human pregnancy: Controversies and questions. Nat. Rev. Immunol. 2023, 23, 222–235. [Google Scholar] [CrossRef] [PubMed]
  13. Brosens, I.; Pijnenborg, R.; Vercruysse, L.; Romero, R. The “Great Obstetrical Syndromes” are associated with disorders of deep placentation. Am. J. Obstet. Gynecol. 2011, 204, 193–201. [Google Scholar] [CrossRef]
  14. Burton, G.J.; Fowden, A.L.; Thornburg, K.L. Placental Origins of Chronic Disease. Physiol. Rev. 2016, 96, 1509–1565. [Google Scholar] [CrossRef]
  15. Fisher, S.J. Why is placentation abnormal in preeclampsia? Am. J. Obstet. Gynecol. 2015, 213, S115–S122. [Google Scholar] [CrossRef]
  16. Ilekis, J.V.; Tsilou, E.; Fisher, S.; Abrahams, V.M.; Soares, M.J.; Cross, J.C.; Zamudio, S.; Illsley, N.P.; Myatt, L.; Colvis, C.; et al. Placental origins of adverse pregnancy outcomes: Potential molecular targets: An Executive Workshop Summary of the Eunice Kennedy Shriver National Institute of Child Health and Human Development. Am. J. Obstet. Gynecol. 2016, 215, S1–S46. [Google Scholar] [CrossRef]
  17. Kadyrov, M.; Kingdom, J.C.; Huppertz, B. Divergent trophoblast invasion and apoptosis in placental bed spiral arteries from pregnancies complicated by maternal anemia and early-onset preeclampsia/intrauterine growth restriction. Am. J. Obstet. Gynecol. 2006, 194, 557–563. [Google Scholar] [CrossRef]
  18. Kaufmann, P.; Black, S.; Huppertz, B. Endovascular trophoblast invasion: Implications for the pathogenesis of intrauterine growth retardation and preeclampsia. Biol. Reprod. 2003, 69, 1–7. [Google Scholar] [CrossRef]
  19. Khong, T.Y.; De Wolf, F.; Robertson, W.B.; Brosens, I. Inadequate maternal vascular response to placentation in pregnancies complicated by pre-eclampsia and by small-for-gestational age infants. Br. J. Obstet. Gynaecol. 1986, 93, 1049–1059. [Google Scholar] [CrossRef]
  20. Romero, R.; Kusanovic, J.P.; Chaiworapongsa, T.; Hassan, S.S. Placental bed disorders in preterm labor, preterm PROM, spontaneous abortion and abruptio placentae. Best Pract. Res. Clin. Obstet. Gynaecol. 2011, 25, 313–327. [Google Scholar] [CrossRef]
  21. Schoots, M.H.; Gordijn, S.J.; Scherjon, S.A.; van Goor, H.; Hillebrands, J.L. Oxidative stress in placental pathology. Placenta 2018, 69, 153–161. [Google Scholar] [CrossRef] [PubMed]
  22. Xu, J.; Wu, R.C.; O’Malley, B.W. Normal and cancer-related functions of the p160 steroid receptor co-activator (SRC) family. Nat. Rev. Cancer 2009, 9, 615–630. [Google Scholar] [CrossRef] [PubMed]
  23. Szwarc, M.M.; Kommagani, R.; Lessey, B.A.; Lydon, J.P. The p160/steroid receptor coactivator family: Potent arbiters of uterine physiology and dysfunction. Biol. Reprod. 2014, 91, 122. [Google Scholar] [CrossRef] [PubMed]
  24. Szwarc, M.M.; Lydon, J.P.; O’Malley, B.W. Steroid receptor coactivators as therapeutic targets in the female reproductive system. J. Steroid Biochem. Mol. Biol. 2015, 154, 32–38. [Google Scholar] [CrossRef]
  25. Kommagani, R.; Szwarc, M.M.; Kovanci, E.; Creighton, C.J.; O’Malley, B.W.; Demayo, F.J.; Lydon, J.P. A murine uterine transcriptome, responsive to steroid receptor coactivator-2, reveals transcription factor 23 as essential for decidualization of human endometrial stromal cells. Biol. Reprod. 2014, 90, 75. [Google Scholar] [CrossRef]
  26. Kommagani, R.; Szwarc, M.M.; Kovanci, E.; Gibbons, W.E.; Putluri, N.; Maity, S.; Creighton, C.J.; Sreekumar, A.; DeMayo, F.J.; Lydon, J.P.; et al. Acceleration of the glycolytic flux by steroid receptor coactivator-2 is essential for endometrial decidualization. PLoS Genet. 2013, 9, e1003900. [Google Scholar] [CrossRef]
  27. Szwarc, M.M.; Hai, L.; Gibbons, W.E.; White, L.D.; Mo, Q.; Kommagani, R.; Lanz, R.B.; DeMayo, F.J.; O’Malley, B.W.; Lydon, J.P. Retinoid signaling controlled by SRC-2 in decidualization revealed by transcriptomics. Reproduction 2018, 156, 387–395. [Google Scholar] [CrossRef]
  28. Szwarc, M.M.; Kommagani, R.; Jeong, J.W.; Wu, S.P.; Tsai, S.Y.; Tsai, M.J.; O’Malley, B.W.; DeMayo, F.J.; Lydon, J.P. Perturbing the cellular levels of steroid receptor coactivator-2 impairs murine endometrial function. PLoS ONE 2014, 9, e98664. [Google Scholar] [CrossRef]
  29. Chen, X.; Liu, Z.; Xu, J. The cooperative function of nuclear receptor coactivator 1 (NCOA1) and NCOA3 in placental development and embryo survival. Mol. Endocrinol. 2010, 24, 1917–1934. [Google Scholar] [CrossRef]
  30. He, C.; Shan, N.; Xu, P.; Ge, H.; Yuan, Y.; Liu, Y.; Zhang, P.; Wen, L.; Zhang, F.; Xiong, L.; et al. Hypoxia-induced Downregulation of SRC-3 Suppresses Trophoblastic Invasion and Migration Through Inhibition of the AKT/mTOR Pathway: Implications for the Pathogenesis of Preeclampsia. Sci. Rep. 2019, 9, 10349. [Google Scholar] [CrossRef]
  31. Yuan, Y.; Shan, N.; Tan, B.; Deng, Q.; Liu, Y.; Wang, H.; Luo, X.; He, C.; Luo, X.; Zhang, H.; et al. SRC-3 Plays a Critical Role in Human Umbilical Vein Endothelial Cells by Regulating the PI3K/Akt/mTOR Pathway in Preeclampsia. Reprod. Sci. 2018, 25, 748–758. [Google Scholar] [CrossRef] [PubMed]
  32. Graham, C.H.; Hawley, T.S.; Hawley, R.G.; MacDougall, J.R.; Kerbel, R.S.; Khoo, N.; Lala, P.K. Establishment and characterization of first trimester human trophoblast cells with extended lifespan. Exp. Cell Res. 1993, 206, 204–211. [Google Scholar] [CrossRef] [PubMed]
  33. Cheng, J.C.; Fang, L.; Li, Y.; Thakur, A.; Hoodless, P.A.; Guo, Y.; Wang, Z.; Wu, Z.; Yan, Y.; Jia, Q.; et al. G protein-coupled estrogen receptor stimulates human trophoblast cell invasion via YAP-mediated ANGPTL4 expression. Commun. Biol. 2021, 4, 1285. [Google Scholar] [CrossRef] [PubMed]
  34. Song, G.; Zhang, D.; Zhu, J.; Wang, A.; Zhou, X.; Han, T.L.; Zhang, H. The metabolic role of the CD73/adenosine signaling pathway in HTR-8/SVneo cells: A Double-Edged Sword? Heliyon 2024, 10, e25252. [Google Scholar] [CrossRef]
  35. Liu, Y.; Du, L.; Gu, S.; Liang, J.; Huang, M.; Huang, L.; Lai, S.; Zhang, S.; Tu, Z.; Sun, W.; et al. Identification of the role of DAB2 and CXCL8 in uterine spiral artery remodeling in early-onset preeclampsia. Cell Mol. Life Sci. 2024, 81, 180. [Google Scholar] [CrossRef]
  36. Van Buren, E.; Azzara, D.; Rangel-Moreno, J.; Garcia-Hernandez, M.L.; Murphy, S.P.; Cohen, E.D.; Lewis, E.; Lin, X.; Park, H.R. Single-cell RNA sequencing reveals placental response under environmental stress. Nat. Commun. 2024, 15, 6549. [Google Scholar] [CrossRef]
  37. Maurya, V.K.; Szwarc, M.M.; Fernandez-Valdivia, R.; Lonard, D.M.; Yong, S.; Joshi, N.; Fazleabas, A.T.; Lydon, J.P. Early growth response 1 transcription factor is essential for the pathogenic properties of human endometriotic epithelial cells. Reproduction 2022, 164, 41–54. [Google Scholar] [CrossRef]
  38. Maurya, V.K.; Szwarc, M.M.; Lonard, D.M.; Kommagani, R.; Wu, S.P.; O’Malley, B.W.; DeMayo, F.J.; Lydon, J.P. Steroid receptor coactivator-2 drives epithelial reprogramming that enables murine embryo implantation. FASEB J. 2023, 37, e23313. [Google Scholar] [CrossRef]
  39. Kim, D.; Paggi, J.M.; Park, C.; Bennett, C.; Salzberg, S.L. Graph-based genome alignment and genotyping with HISAT2 and HISAT-genotype. Nat. Biotechnol. 2019, 37, 907–915. [Google Scholar] [CrossRef]
  40. Anders, S.; Pyl, P.T.; Huber, W. HTSeq—A Python framework to work with high-throughput sequencing data. Bioinformatics 2015, 31, 166–169. [Google Scholar] [CrossRef]
  41. Wang, L.; Feng, Z.; Wang, X.; Wang, X.; Zhang, X. DEGseq: An R package for identifying differentially expressed genes from RNA-seq data. Bioinformatics 2010, 26, 136–138. [Google Scholar] [CrossRef] [PubMed]
  42. Benjamini, Y.; Hochberg, Y. Controlling the false discovery rate: A practical and powerful approach to multiple testing. J. R. Soc. Ser. B 1995, 57, 289–300. [Google Scholar] [CrossRef]
  43. Huang, D.W.; Sherman, B.T.; Lempicki, R.A. Systematic and integrative analysis of large gene lists using DAVID bioinformatics resources. Nat. Protoc. 2009, 4, 44–57. [Google Scholar] [CrossRef]
  44. Huang, D.W.; Sherman, B.T.; Tan, Q.; Collins, J.R.; Alvord, W.G.; Roayaei, J.; Stephens, R.; Baseler, M.W.; Lane, H.C.; Lempicki, R.A. The DAVID Gene Functional Classification Tool: A novel biological module-centric algorithm to functionally analyze large gene lists. Genome Biol. 2007, 8, R183. [Google Scholar] [CrossRef]
  45. Kanehisa, M.; Sato, Y.; Kawashima, M.; Furumichi, M.; Tanabe, M. KEGG as a reference resource for gene and protein annotation. Nucleic Acids Res. 2016, 44, D457–D462. [Google Scholar] [CrossRef]
  46. Xie, C.; Mao, X.; Huang, J.; Ding, Y.; Wu, J.; Dong, S.; Kong, L.; Gao, G.; Li, C.Y.; Wei, L. KOBAS 2.0: A web server for annotation and identification of enriched pathways and diseases. Nucleic Acids Res. 2011, 39, W316–W322. [Google Scholar] [CrossRef]
  47. Loukeris, K.; Sela, R.; Baergen, R.N. Syncytial knots as a reflection of placental maturity: Reference values for 20 to 40 weeks’ gestational age. Pediatr. Dev. Pathol. 2010, 13, 305–309. [Google Scholar] [CrossRef]
  48. Bozickovic, O.; Skartveit, L.; Engelsen, A.S.T.; Helland, T.; Jonsdottir, K.; Flageng, M.H.; Fenne, I.S.; Janssen, E.; Lorens, J.B.; Bjorkhaug, L.; et al. A novel SRC-2-dependent regulation of epithelial-mesenchymal transition in breast cancer cells. J. Steroid Biochem. Mol. Biol. 2019, 185, 57–70. [Google Scholar] [CrossRef]
  49. Cai, M.; Liang, X.; Sun, X.; Chen, H.; Dong, Y.; Wu, L.; Gu, S.; Han, S. Nuclear Receptor Coactivator 2 Promotes Human Breast Cancer Cell Growth by Positively Regulating the MAPK/ERK Pathway. Front. Oncol. 2019, 9, 164. [Google Scholar] [CrossRef]
  50. Lin, Z.; Yang, F.; Lu, D.; Sun, W.; Zhu, G.; Lan, B. Knockdown of NCOA2 Inhibits the Growth and Progression of Gastric Cancer by Affecting the Wnt Signaling Pathway-Related Protein Expression. Technol. Cancer Res. Treat. 2020, 19, 1533033820928072. [Google Scholar] [CrossRef]
  51. Szwarc, M.M.; Kommagani, R.; Putluri, V.; Dubrulle, J.; Stossi, F.; Mancini, M.A.; Coarfa, C.; Lanz, R.B.; Putluri, N.; DeMayo, F.J.; et al. Steroid Receptor Coactivator-2 Controls the Pentose Phosphate Pathway through RPIA in Human Endometrial Cancer Cells. Sci. Rep. 2018, 8, 13134. [Google Scholar] [CrossRef] [PubMed]
  52. Gan, X.; Liu, H.; Chen, D.; Liu, Z.; Lu, Q.; Lai, X.; Hou, H.; Zhang, M.; Zhang, J.Y.; Duan, Y.; et al. Interleukin-1 beta signals through the ERK signalling pathway to modulate human placental trophoblast migration and invasion in the first trimester of pregnancy. Placenta 2024, 151, 67–78. [Google Scholar] [CrossRef]
  53. Kamei, T.; Jones, S.R.; Chapman, B.M.; McGonigle, K.L.; Dai, G.; Soares, M.J. The phosphatidylinositol 3-kinase/Akt signaling pathway modulates the endocrine differentiation of trophoblast cells. Mol. Endocrinol. 2002, 16, 1469–1481. [Google Scholar] [CrossRef] [PubMed]
  54. Pollheimer, J.; Knofler, M. Signalling pathways regulating the invasive differentiation of human trophoblasts: A review. Placenta 2005, 26 (Suppl. A), S21–S30. [Google Scholar] [CrossRef] [PubMed]
  55. Yang, W.; Klaman, L.D.; Chen, B.; Araki, T.; Harada, H.; Thomas, S.M.; George, E.L.; Neel, B.G. An Shp2/SFK/Ras/Erk signaling pathway controls trophoblast stem cell survival. Dev. Cell 2006, 10, 317–327. [Google Scholar] [CrossRef]
  56. Chen, L.; Xiao, D.; Tang, F.; Gao, H.; Li, X. CAPN6 in disease: An emerging therapeutic target (Review). Int. J. Mol. Med. 2020, 46, 1644–1652. [Google Scholar] [CrossRef]
  57. Saunders, A.C.; McGonnigal, B.; Uzun, A.; Padbury, J. The developmental expression of the CDK inhibitor p57(kip2) (Cdkn1c) in the early mouse placenta. Mol. Reprod. Dev. 2016, 83, 405–412. [Google Scholar] [CrossRef]
  58. Adu-Gyamfi, E.A.; Lamptey, J.; Chen, X.M.; Li, F.F.; Li, C.; Ruan, L.L.; Yang, X.N.; Liu, T.H.; Wang, Y.X.; Ding, Y.B. Iodothyronine deiodinase 2 (DiO(2)) regulates trophoblast cell line cycle, invasion and apoptosis; and its downregulation is associated with early recurrent miscarriage. Placenta 2021, 111, 54–68. [Google Scholar] [CrossRef]
  59. Biron-Shental, T.; Schaiff, W.T.; Rimon, E.; Shim, T.L.; Nelson, D.M.; Sadovsky, Y. Hypoxia enhances the expression of follistatin-like 3 in term human trophoblasts. Placenta 2008, 29, 51–57. [Google Scholar] [CrossRef]
  60. Guo, J.; Tian, T.; Lu, D.; Xia, G.; Wang, H.; Dong, M. Alterations of maternal serum and placental follistatin-like 3 and myostatin in pre-eclampsia. J. Obstet. Gynaecol. Res. 2012, 38, 988–996. [Google Scholar] [CrossRef]
  61. Peiris, H.N.; Ponnampalam, A.P.; Osepchook, C.C.; Mitchell, M.D.; Green, M.P. Placental expression of myostatin and follistatin-like-3 protein in a model of developmental programming. Am. J. Physiol. Endocrinol. Metab. 2010, 298, E854–E861. [Google Scholar] [CrossRef]
  62. Kozai, K.; Moreno-Irusta, A.; Iqbal, K.; Winchester, M.L.; Scott, R.L.; Simon, M.E.; Muto, M.; Parrish, M.R.; Soares, M.J. The AKT1-FOXO4 axis reciprocally regulates hemochorial placentation. Development 2023, 150, dev201095. [Google Scholar] [CrossRef] [PubMed]
  63. Lappas, M.; Lim, R.; Riley, C.; Menon, R.; Permezel, M. Expression and localisation of FoxO3 and FoxO4 in human placenta and fetal membranes. Placenta 2010, 31, 1043–1050. [Google Scholar] [CrossRef] [PubMed]
  64. Bora, M.; Singha, S.; Madan, T.; Deka, G.; Hazarika, S.G.; Baruah, S. HLA-G isoforms, HLA-C allotype and their expressions differ between early abortus and placenta in relation to spontaneous abortions. Placenta 2024, 149, 44–53. [Google Scholar] [CrossRef] [PubMed]
  65. Dunk, C.E.; Bucher, M.; Zhang, J.; Hayder, H.; Geraghty, D.E.; Lye, S.J.; Myatt, L.; Hackmon, R. Human leukocyte antigen HLA-C, HLA-G, HLA-F, and HLA-E placental profiles are altered in early severe preeclampsia and preterm birth with chorioamnionitis. Am. J. Obstet. Gynecol. 2022, 227, 641.e641–641.e613. [Google Scholar] [CrossRef]
  66. Ferreira, L.M.; Meissner, T.B.; Mikkelsen, T.S.; Mallard, W.; O’Donnell, C.W.; Tilburgs, T.; Gomes, H.A.; Camahort, R.; Sherwood, R.I.; Gifford, D.K.; et al. A distant trophoblast-specific enhancer controls HLA-G expression at the maternal-fetal interface. Proc. Natl. Acad. Sci. USA 2016, 113, 5364–5369. [Google Scholar] [CrossRef]
  67. Kovats, S.; Main, E.K.; Librach, C.; Stubblebine, M.; Fisher, S.J.; DeMars, R. A class I antigen, HLA-G, expressed in human trophoblasts. Science 1990, 248, 220–223. [Google Scholar] [CrossRef]
  68. Chu, A.; Najafzadeh, P.; Sullivan, P.; Cone, B.; Elshimali, R.; Shakeri, H.; Janzen, C.; Mah, V.; Wadehra, M. Aldehyde dehydrogenase isoforms and inflammatory cell populations are differentially expressed in term human placentas affected by intrauterine growth restriction. Placenta 2019, 81, 9–17. [Google Scholar] [CrossRef]
  69. Luan, X.; Li, S.; Zhao, J.; Zhai, J.; Liu, X.; Chen, Z.J.; Li, W.; Du, Y. Down-regulation of CCR7 via AKT pathway and GATA2 inactivation suppressed trophoblast migration and invasion in recurrent spontaneous abortiondagger. Biol. Reprod. 2020, 102, 424–433. [Google Scholar] [CrossRef]
  70. Karakis, V.; Jabeen, M.; Britt, J.W.; Cordiner, A.; Mischler, A.; Li, F.; San Miguel, A.; Rao, B.M. Laminin switches terminal differentiation fate of human trophoblast stem cells under chemically defined culture conditions. J. Biol. Chem. 2023, 299, 104650. [Google Scholar] [CrossRef]
  71. Nayeem, S.B.; Arfuso, F.; Dharmarajan, A.; Keelan, J.A. Role of Wnt signalling in early pregnancy. Reprod. Fertil. Dev. 2016, 28, 525–544. [Google Scholar] [CrossRef] [PubMed]
  72. Sonderegger, S.; Husslein, H.; Leisser, C.; Knofler, M. Complex expression pattern of Wnt ligands and frizzled receptors in human placenta and its trophoblast subtypes. Placenta 2007, 28 (Suppl. A), S97–S102. [Google Scholar] [CrossRef] [PubMed]
  73. Khong, Y.; Brosens, I. Defective deep placentation. Best Pract. Res. Clin. Obstet. Gynaecol. 2011, 25, 301–311. [Google Scholar] [CrossRef]
  74. Jauniaux, E.; Moffett, A.; Burton, G.J. Placental Implantation Disorders. Obstet. Gynecol. Clin. North. Am. 2020, 47, 117–132. [Google Scholar] [CrossRef]
  75. Burton, G.J.; Redman, C.W.; Roberts, J.M.; Moffett, A. Pre-eclampsia: Pathophysiology and clinical implications. BMJ 2019, 366, l2381. [Google Scholar] [CrossRef]
  76. Dietrich, B.; Haider, S.; Meinhardt, G.; Pollheimer, J.; Knofler, M. WNT and NOTCH signaling in human trophoblast development and differentiation. Cell Mol. Life Sci. 2022, 79, 292. [Google Scholar] [CrossRef]
  77. Knofler, M.; Pollheimer, J. Human placental trophoblast invasion and differentiation: A particular focus on Wnt signaling. Front. Genet. 2013, 4, 190. [Google Scholar] [CrossRef]
  78. Matsumoto, S.; Tanaka, S. Wnt signaling activation confers a syncytiotrophoblast progenitor state on trophoblast stem cells of cynomolgus monkeydagger. Biol. Reprod. 2024, 111, 1262–1281. [Google Scholar] [CrossRef]
  79. Shukla, V.; Moreno-Irusta, A.; Varberg, K.M.; Kuna, M.; Iqbal, K.; Galligos, A.M.; Aplin, J.D.; Choudhury, R.H.; Okae, H.; Arima, T.; et al. NOTUM-mediated WNT silencing drives extravillous trophoblast cell lineage development. Proc. Natl. Acad. Sci. USA 2024, 121, e2403003121. [Google Scholar] [CrossRef]
  80. Jiang, L.L.; Yang, D.L.; Han, Q.; Zhang, H.L.; Pan, M.; Yan, J.Y. LncRNA-NEAT1 blocks the Wnt/beta-catenin signaling pathway by targeting miR-217 to inhibit trophoblast cell migration and invasion. J. Assist. Reprod. Genet. 2024, 41, 2107–2115. [Google Scholar] [CrossRef]
  81. Lan, R.; Yu, Y.; Song, J.; Xue, M.; Gong, H. SFRP2 suppresses trophoblast cell migration by inhibiting the Wnt/beta-catenin pathway. Mol. Med. Rep. 2024, 29, 66. [Google Scholar] [CrossRef] [PubMed]
  82. Sonderegger, S.; Haslinger, P.; Sabri, A.; Leisser, C.; Otten, J.V.; Fiala, C.; Knofler, M. Wingless (Wnt)-3A induces trophoblast migration and matrix metalloproteinase-2 secretion through canonical Wnt signaling and protein kinase B/AKT activation. Endocrinology 2010, 151, 211–220. [Google Scholar] [CrossRef] [PubMed]
  83. Zhang, Y.; Ran, Y.; Ma, Y.; Huang, H.; Chen, Y.; Qi, H. Elevated Serum SFRP5 Levels During Preeclampsia and Its Potential Association with Trophoblast Dysfunction via Wnt/beta-Catenin Suppression. Reprod. Sci. 2022, 29, 163–172. [Google Scholar] [CrossRef] [PubMed]
  84. Zhou, M.; Gao, Y.; Wu, S.; Chen, J.; Ding, J.; Wang, Y.; Yang, J. Ubiquitin-specific protease 7 prevents recurrent spontaneous abortion by targeting enhancer of zeste homolog 2 to regulate trophoblast proliferation, apoptosis, migration, and invasion through the Wnt/beta-catenin pathwaydagger. Biol. Reprod. 2023, 109, 204–214. [Google Scholar] [CrossRef]
  85. Bao, H.; Liu, D.; Xu, Y.; Sun, Y.; Mu, C.; Yu, Y.; Wang, C.; Han, Q.; Liu, S.; Cai, H.; et al. Hyperactivated Wnt-beta-catenin signaling in the absence of sFRP1 and sFRP5 disrupts trophoblast differentiation through repression of Ascl2. BMC Biol. 2020, 18, 151. [Google Scholar] [CrossRef]
  86. Chronopoulou, E.; Koika, V.; Tsiveriotis, K.; Stefanidis, K.; Kalogeropoulos, S.; Georgopoulos, N.; Adonakis, G.; Kaponis, A. Wnt4, Wnt6 and beta-catenin expression in human placental tissue—Is there a link with first trimester miscarriage? Results from a pilot study. Reprod. Biol. Endocrinol. 2022, 20, 51. [Google Scholar] [CrossRef]
  87. Huang, L.; Ying, H.; Chen, Z.; Zhu, Y.L.; Gu, Y.; Hu, L.; Chen, D.; Zhong, N. Down-regulation of DKK1 and Wnt1/beta-catenin pathway by increased homeobox B7 resulted in cell differentiation suppression of intrauterine fetal growth retardation in human placenta. Placenta 2019, 80, 27–35. [Google Scholar] [CrossRef]
  88. Li, N.; Li, S.; Wang, Y.; Wang, J.; Wang, K.; Liu, X.; Li, Y.; Liu, J. Decreased expression of WNT2 in villi of unexplained recurrent spontaneous abortion patients may cause trophoblast cell dysfunction via downregulated Wnt/beta-catenin signaling pathway. Cell Biol. Int. 2017, 41, 898–907. [Google Scholar] [CrossRef]
  89. Liu, Y.; Huang, J.; Yu, N.; Wei, S.; Liu, Z. Involvement of WNT2 in trophoblast cell behavior in preeclampsia development. Cell Cycle 2020, 19, 2207–2215. [Google Scholar] [CrossRef]
  90. Monkley, S.J.; Delaney, S.J.; Pennisi, D.J.; Christiansen, J.H.; Wainwright, B.J. Targeted disruption of the Wnt2 gene results in placentation defects. Development 1996, 122, 3343–3353. [Google Scholar] [CrossRef]
  91. Zhang, Z.; Zhang, L.; Zhang, L.; Jia, L.; Wang, P.; Gao, Y. Association of Wnt2 and sFRP4 expression in the third trimester placenta in women with severe preeclampsia. Reprod. Sci. 2013, 20, 981–989. [Google Scholar] [CrossRef] [PubMed]
  92. Ide, A.D.; Grainger, S. WNT9A and WNT9B in Development and Disease. Differentiation 2024, 142, 100820. [Google Scholar] [CrossRef] [PubMed]
  93. Kemp, C.; Willems, E.; Abdo, S.; Lambiv, L.; Leyns, L. Expression of all Wnt genes and their secreted antagonists during mouse blastocyst and postimplantation development. Dev. Dyn. 2005, 233, 1064–1075. [Google Scholar] [CrossRef] [PubMed]
  94. Gong, S.; Gaccioli, F.; Dopierala, J.; Sovio, U.; Cook, E.; Volders, P.J.; Martens, L.; Kirk, P.D.W.; Richardson, S.; Smith, G.C.S.; et al. The RNA landscape of the human placenta in health and disease. Nat. Commun. 2021, 12, 2639. [Google Scholar] [CrossRef]
  95. Bei, Y.; Hogan, J.; Berkowitz, L.A.; Soto, M.; Rocheleau, C.E.; Pang, K.M.; Collins, J.; Mello, C.C. SRC-1 and Wnt signaling act together to specify endoderm and to control cleavage orientation in early C. elegans embryos. Dev. Cell 2002, 3, 113–125. [Google Scholar] [CrossRef]
  96. Tong, Z.; Zhang, Y.; Guo, P.; Wang, W.; Chen, Q.; Jin, J.; Liu, S.; Yu, C.; Mo, P.; Zhang, L.; et al. Steroid receptor coactivator 1 promotes human hepatocellular carcinoma invasiveness through enhancing MMP-9. J. Cell Mol. Med. 2024, 28, e18171. [Google Scholar] [CrossRef]
  97. Triki, M.; Lapierre, M.; Cavailles, V.; Mokdad-Gargouri, R. Expression and role of nuclear receptor coregulators in colorectal cancer. World J. Gastroenterol. 2017, 23, 4480–4490. [Google Scholar] [CrossRef]
  98. Haider, S.; Meinhardt, G.; Saleh, L.; Kunihs, V.; Gamperl, M.; Kaindl, U.; Ellinger, A.; Burkard, T.R.; Fiala, C.; Pollheimer, J.; et al. Self-Renewing Trophoblast Organoids Recapitulate the Developmental Program of the Early Human Placenta. Stem Cell Rep. 2018, 11, 537–551. [Google Scholar] [CrossRef]
  99. Okae, H.; Toh, H.; Sato, T.; Hiura, H.; Takahashi, S.; Shirane, K.; Kabayama, Y.; Suyama, M.; Sasaki, H.; Arima, T. Derivation of Human Trophoblast Stem Cells. Cell Stem Cell 2018, 22, 50–63.e56. [Google Scholar] [CrossRef]
Figure 1. Expression of SRC-2 in human term-placental tissue: (AE) Immunohistochemical staining shows the location of SRC-2 protein expression in chorionic villi of human term (39 weeks)-placental tissue from five subjects. The intervillous space (IVS) and the vasculosyntial membrane (VSM) demarcating maternal blood sinusoids are indicated. White triangle indicates a nucleus of the syncytiotrophoblast cell layer that is positive for SRC-2 expression. White asterisk highlights a syncytial knot, which is a prominent feature in the term placenta [47]. Expression of SRC-2 is also evident in sparsely distributed cytotrophoblasts ((A) (black triangle)), in perivascular fibroblasts of fetal blood vessels ((B) black arrow), stromal cells of the chorionic villus (open arrowhead), and in syncytiotrophoblasts (white triangle). (F) Immunohistochemical staining reveals a similar expression pattern for SRC-3. Scale bar in (A) applies to all panels.
Cells 14 01024 g001
Figure 2. Expression of SRC-2 in HTR-8/SVneo cells: (A) Immunocytochemistry shows strong nuclear staining for SRC-2 expression in HTR-8/SVneo cells (white triangle). (B) Knockdown of SRC-2 results in negligible SRC-2 expression in HTR-8/SVneo cells (white triangle), demonstrating the specificity and efficacy of this siRNA-mediated gene knockdown approach. (C) Western immunoblot confirms both strong SRC-2 expression in HTR-8/SVneo cells (NT (control) siRNA group) and negligible SRC-2 expression (SRC-2 siRNA group); lanes 1–3 represent replicates for HTR-8/SVneo cells transfected with either NT siRNA or siRNA targeting SRC-2. The expression levels of SRC-1 and SRC-3 are not altered in HTR-8/SVneo cells following SRC-2 knockdown; β-actin is a loading control. Scale bar in panel (A) applies to panel (B).
Cells 14 01024 g002
Figure 3. Sustained viability/proliferation, invasion, and migration of HTR-8/SVneo cells require SRC-2: (A) The MTT assay shows HTR-8/SVneo cells with an SRC-2 deficit (SRC-2 siRNA transfected group) score for a significantly lower number of viable cells at each predetermined time point (24, 48, 72, and 96 h) in culture. (B) Crystal violet staining reveals numerous large colonies from HTR-8/SVneo cells previously transfected with NT siRNAs. The image is a representative result after the NT or SRC-2 siRNA transfection period of 48 h and a post-transfection period of 12 h in culture. (C) Crystal violet staining shows a significant decrease in the number of colonies; colonies are also markedly smaller in size. (D) Histogram quantitatively displays the differences between the treatment groups in panels (B,C) based on the crystal violet dye absorbance reading at 590 nm. (E) Transwell migration assay shows the migration of numerous HTR-8/SVneo cells following NT siRNA transfection. (F) Transwell migration assay reveals a significant attenuation of the migratory ability of HTR-8/SVneo cells following SRC-2 siRNA transfection. (G) Histogram represents the quantitation of the migratory differences between treatment groups shown in (E,F). (H) Transwell invasion assay shows significant invasive capability of HTR-8/SVneo cells following NT siRNA transfection. (I) Transwell invasion assay shows the striking reduction in invasive capability of the HTR-8/SVneo cell line following SRC-2 siRNA transfection. (J) Histogram displays the quantitative differences between the treatment groups shown in panels (H,I). Results are indicated as the mean ± standard deviation and are representative of three independent experiments; ** p-value < 0.01; and *** p-value < 0.001.
Cells 14 01024 g003
Figure 4. The HTR-8/SVneo cellular transcriptome is significantly changed following SRC-2 knockdown: (A) Schematic showing the key stages of the RNA-seq workflow; triplicate samples for the NT siRNA and SRC-2 siRNA treatment groups were used. (B) Principal component analysis (PCA) shows a clear separation between the triplicate NT siRNA and SRC-2 siRNA groups. (C) The volcano plot graphically displays the total number of genes differentially expressed between the NT siRNA and SRC-2 siRNA treatment groups; 1832 downregulated and 1975 upregulated genes are shown in blue and red, respectively. Significance (p-value) versus log2 fold change is plotted on the y- and x-axis, respectively. (D) The heatmap represents an unsupervised hierarchical clustergram of the total number of genes differentially expressed between the NT siRNA and SRC-2 siRNA groups that reached the FDR and IFCI thresholds of ≤0.05 and ≥1.3, respectively. Each row represents a gene, while each column denotes a sample replicate in each treatment group; the dendrogram on both axes shows the arrangement of the clusters following analysis. The intensity of the color indicates the level of expression for each gene in the sample replicate. The intensity in terms of the normalized expression values is indicated by the vertical color key on the right. (E) The MA plot shows the relationship between the log2 fold change and the mean normalized counts of DEGs in HTR-8/SVneo cells treated with NT siRNA or SRC-2 siRNA.
Cells 14 01024 g004
Figure 5. Knockdown of SRC-2 in the HTR-8/SVneo cell line attenuates the expression levels of genes previously reported to be expressed in extravillous trophoblast cells: (A) The heat map displays the alterations in gene expression between NT siRNA and SRC-2 siRNA replicates. The expression levels of calpain 6 (CAPN6); cyclin-dependent kinase inhibitor 1C (CDKN1C); iodothyronine deiodinase 2 (DIO2); follistatin-like 3 (FSTL3); forkhead box O4 (FOXO4); and human leukocyte antigen G (HLA-G) are significantly reduced in the SRC-2 siRNA-treated group compared with the NT siRNA group. (B) Quantitative real-time PCR confirms the above-predicted trophoblast cell marker gene expression changes between the NT siRNA and SRC-2 siRNA-treated groups. Results are indicated as the average fold change (±standard deviation) in expression of the gene of interest for each experimental condition (NT or SRC-2 siRNA knockdown). The average fold change (FC) calculation is detailed in the Section 2. All results presented are representative of three independent experiments; * p-value < 0.05; ** p-value < 0.01.
Cells 14 01024 g005
Figure 6. Dysregulated expression of WNT signaling factors in HTR-8/SVneo cells following SRC-2 knockdown: (A) Heat map displays marked changes in the expression of genes associated with WNT signaling between the NT siRNA and SRC-2 siRNA replicate groups. While WNT signaling inhibitors, Dickkopf WNT signaling pathway inhibitor 1 (DKK1) and secreted frizzled related protein 1 (SFRP1), are upregulated in the SRC-2 siRNA-treated group, the expression levels of Wnt family member 2 (WNT2), WNT4, WNT6, WNT8B, and WNT9A are significantly reduced. (B) Confirmation by qRT-PCR of the above-described gene expression changes between the NT siRNA and SRC-2 siRNA-treated groups is shown. An explanation of the average fold change (FC ± standard deviation) calculation is described in the Section 2. Results are representative of three independent experiments; * p-value < 0.05; ** p-value < 0.01, and *** p value < 0.001.
Cells 14 01024 g006
Figure 7. Human term-placental tissue and HTR-8/SVneo cells express WNT9A: (A) Immunohistochemistry shows WNT9A is expressed in syncytiotrophoblast cells (white triangle) and stromal cells (open arrow) of chorionic villi; IVS indicates intervillous space. (B) Western analysis shows that WNT9A is expressed in HTR-8/SVneo cells previously transfected with NT siRNAs. However, WNT9A expression is significantly reduced following SRC-2 siRNA-mediated knockdown. HLA-G, an established marker in extravillous trophoblast cells and HTR-8/SVneo cells, is also markedly reduced following SRC-2 knockdown. (C) Similar to SRC-2 (see Figure 2), immunocytochemistry shows WNT9A is expressed in the HTR-8/SVneo cells (white triangle). (D) Following SRC-2 knockdown, WNT9A expression is significantly attenuated following SRC-2 knockdown (white triangle). Scale bar in panel (C) applies to panel (D).
Cells 14 01024 g007
Figure 8. Sustained viability/proliferation, migration, and invasion of the HTR-8/SVneo cell line is compromised following WNT9A knockdown: (A) The MTT-based assay shows that the number of HTR-8/SVneo viable cells in culture is markedly reduced following WNT9A knockdown. (B) Top panel row: The transwell invasion assay shows that WNT 9A siRNA knockdown results in a significant reduction in the invasive capacity of HTR-8/SVneo cells. Bottom panel row: The transwell migration assay reveals a marked reduction in the migratory capabilities HTR-8/SVneo cells following WNT 9A siRNA knockdown. Results in histograms are indicated as the mean ± standard deviation and are representative of three independent experiments; * p-value<0.05; *** p-value < 0.001; **** p-value < 0.0001.
Cells 14 01024 g008
Table 1. List of human TaqMan expression assays used in these studies.
Gene NameGene IDCatalog Number
ALDH1A1216Hs00946916_m1
CAPN6827Hs00560073_m1
CCR71236Hs01013469_m1
CDKN1C1028Hs00175938_m1
DIO21734Hs05050546_s1
DKK122943Hs00183740_m1
FSTL310272Hs00610505_m1
FOXO44303Hs00172973_m1
HLA-G3135Hs00365950_g1
LAMB33914Hs00165078_m1
NCOA210499Hs00896109_m1
SFRP16422Hs00610060_m1
WNT27472Hs00608224_m1
WNT454361Hs01573505_m1
WNT67475Hs00362452_m1
WNT 9A7483Hs01573829_m1
HPRTThermoFisher Scientific Inc.4333768T
Disclaimer/Publisher’s Note: The statements, opinions and data contained in all publications are solely those of the individual author(s) and contributor(s) and not of MDPI and/or the editor(s). MDPI and/or the editor(s) disclaim responsibility for any injury to people or property resulting from any ideas, methods, instructions or products referred to in the content.

