
Understanding Atherosclerotic Plaque Cellular Composition: Recent Advances Driven by Single Cell Omics


Abstract
1. Introduction
2. Overview of Atherosclerotic Plaque Cellular Composition
3. Main Atherosclerotic Cell Populations: Transcriptomic, Phenotypic, and Functional Heterogeneity
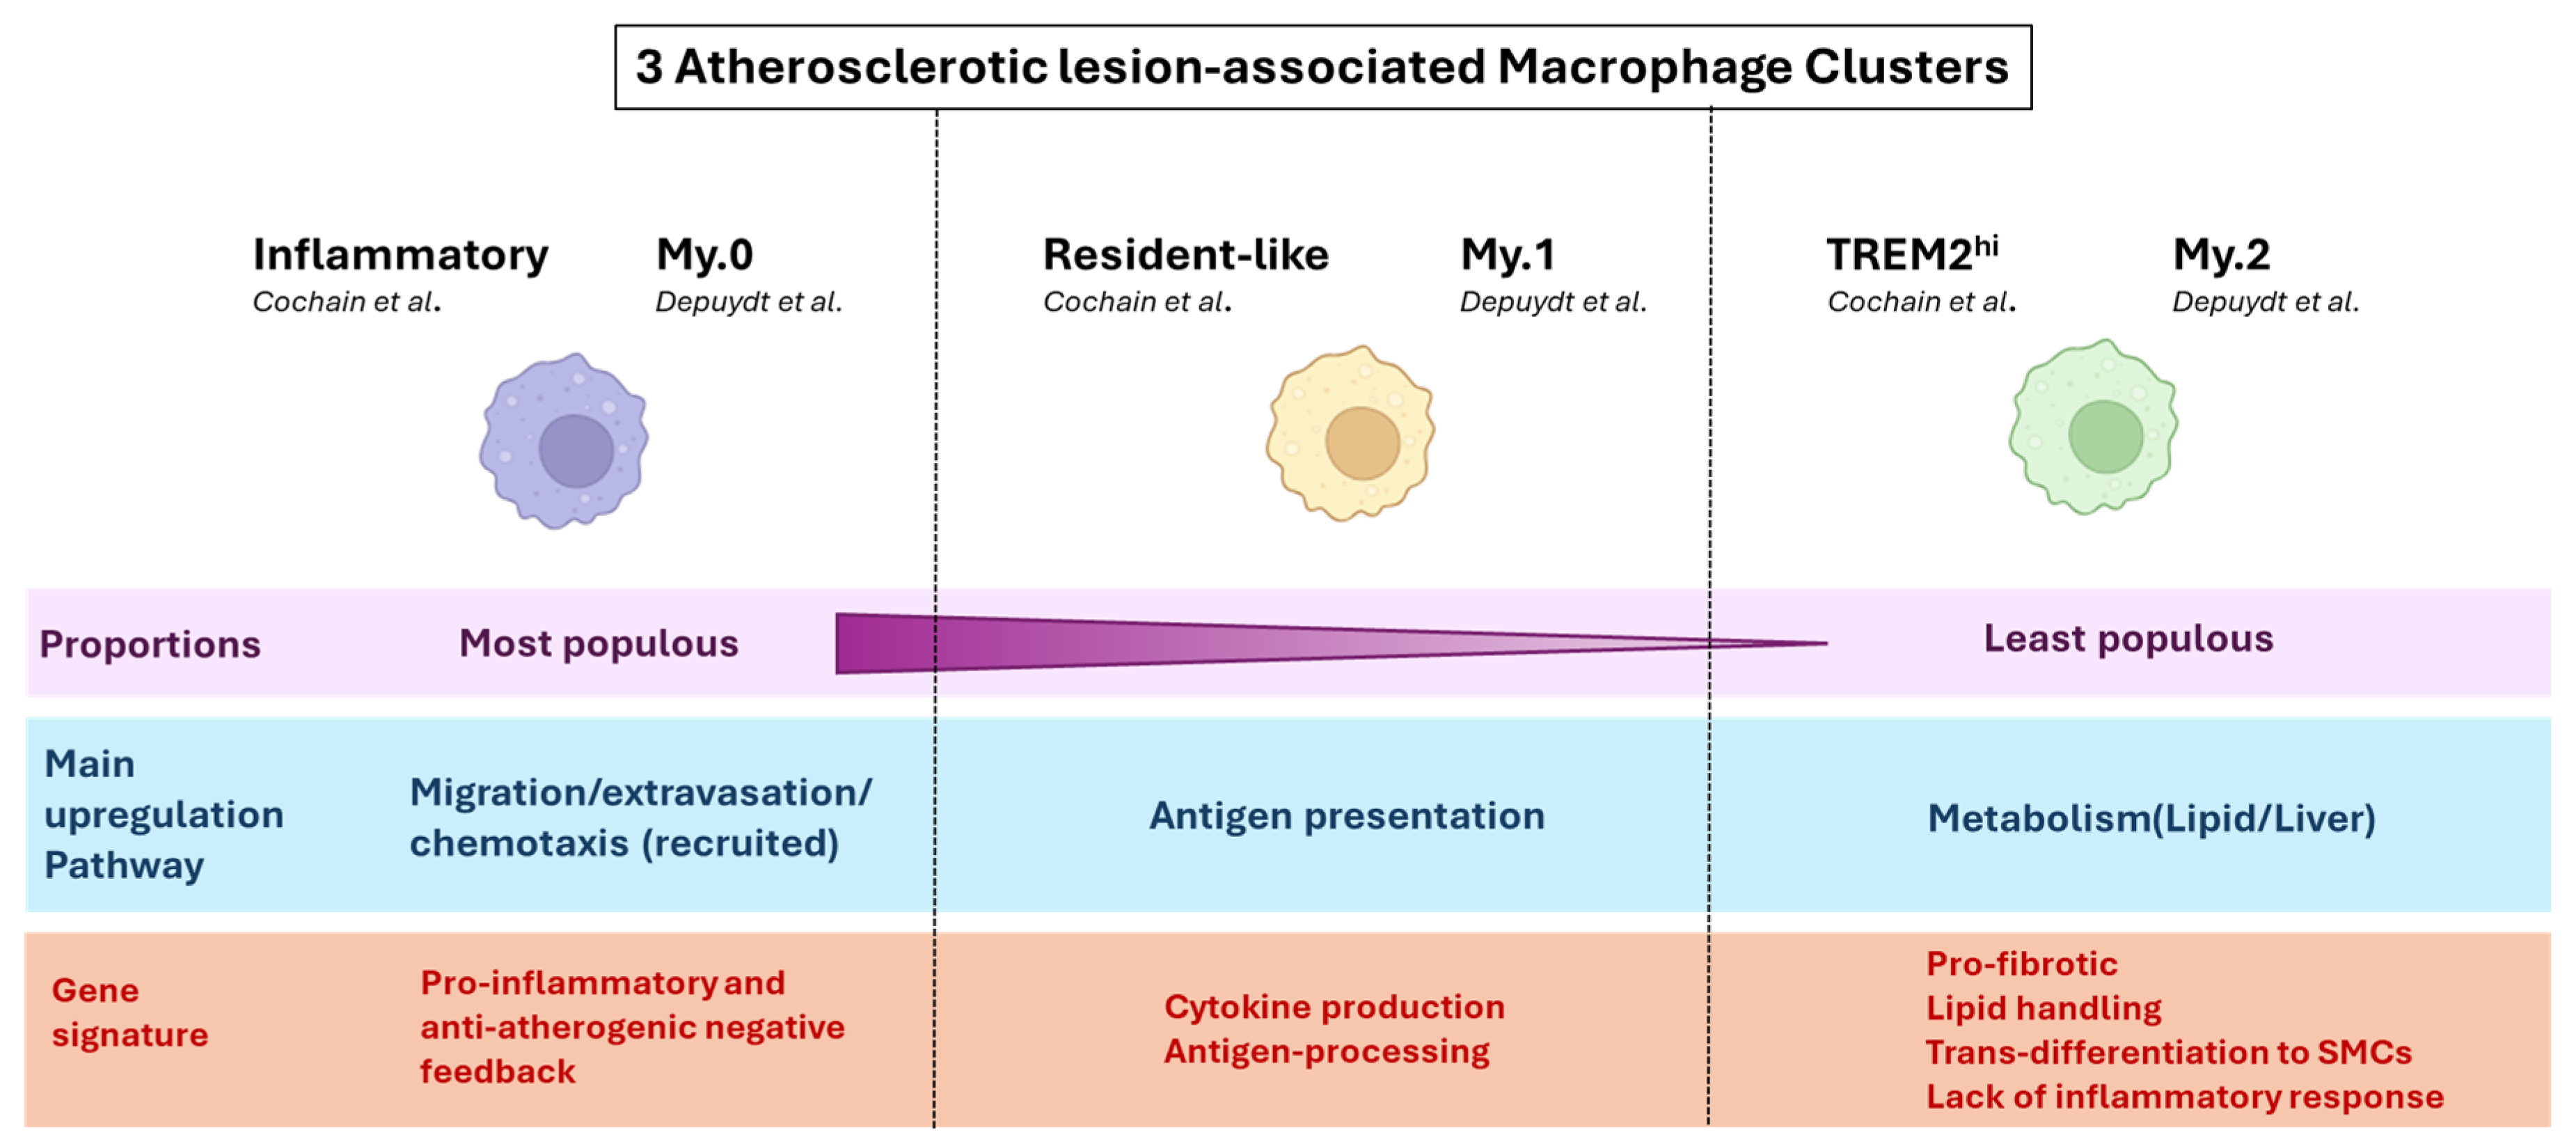
3.1. Macrophages
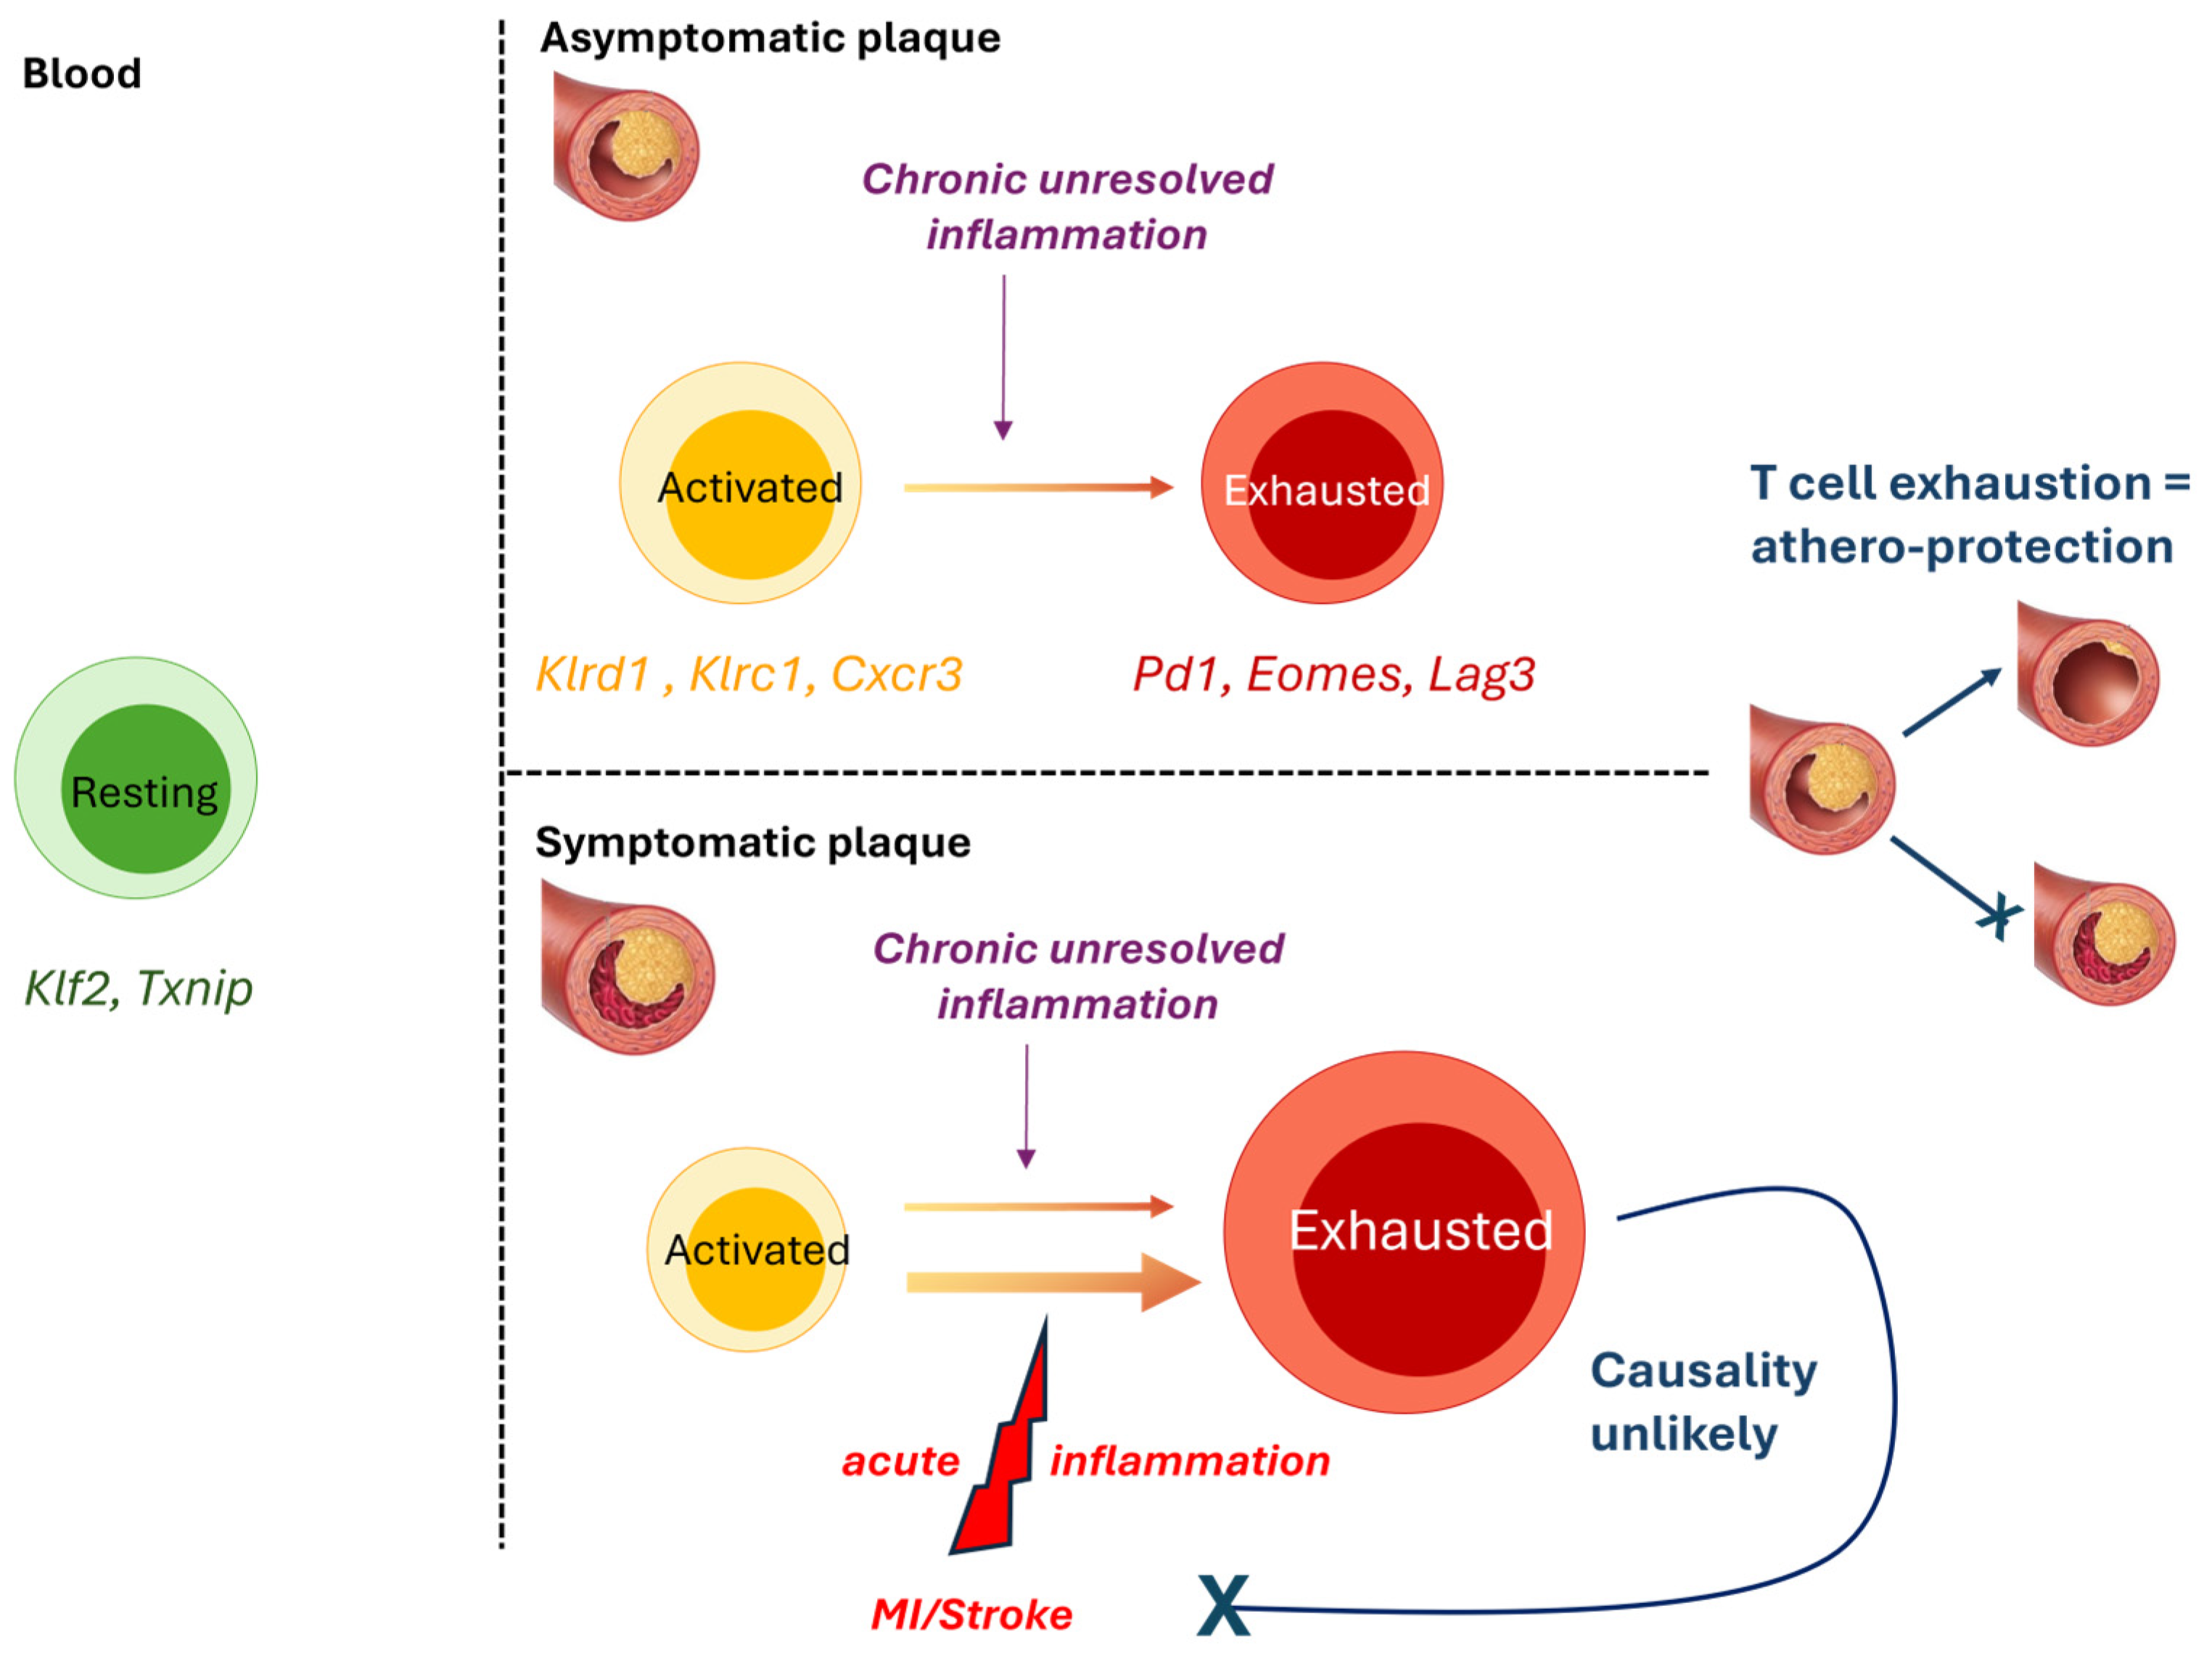
3.2. T-Cells
3.3. B-Cells
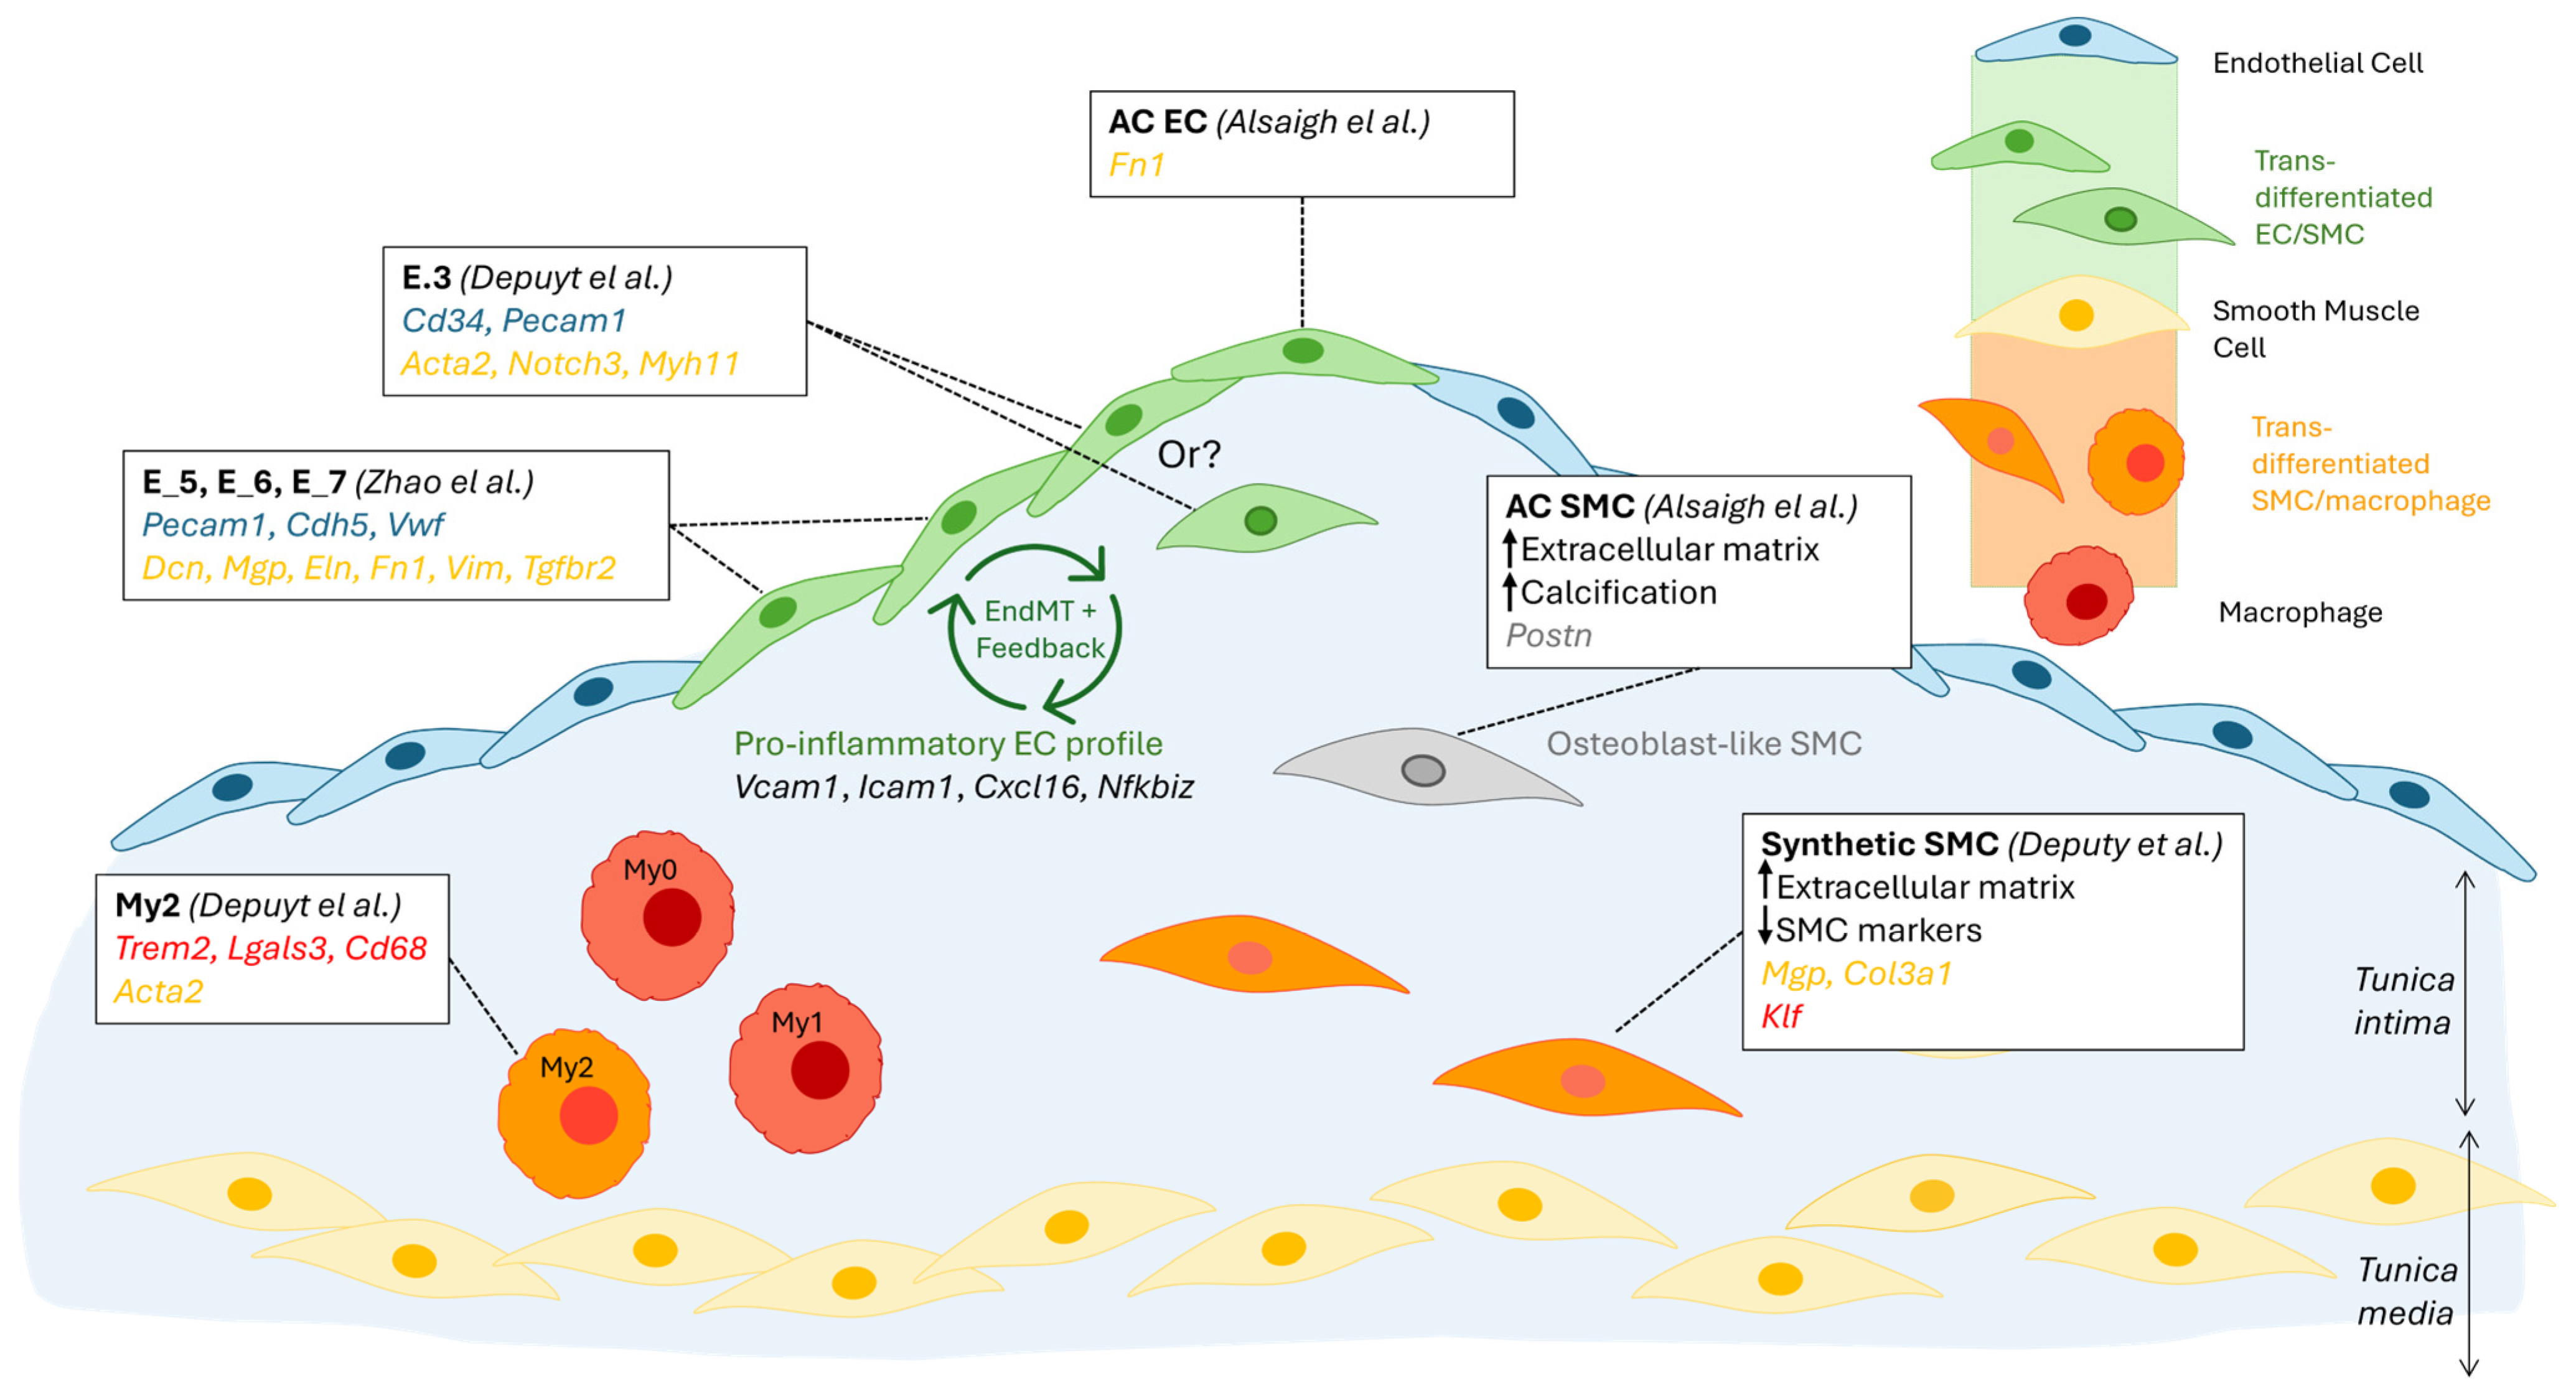
3.4. Non-Immune Cells
3.4.1. Endothelial Cells
3.4.2. Smooth Muscle Cells
3.4.3. Regional Segregation of Transcriptomic Profiles
4. Discussion
Author Contributions
Funding
Institutional Review Board Statement
Informed Consent Statement
Data Availability Statement
Conflicts of Interest
Abbreviations
| APC | Antigen-presenting cell |
| CAD | Coronary artery disease |
| cDC | Conventional dendritic cell |
| Cite-seq | Cellular indexing of transcriptomes and epitopes by sequencing |
| CVD | Cardiovascular disease |
| CyTOF | Cytometry by time of flight |
| DC | Dendritic cell |
| ECM | Extracellular matrix |
| End-MT | Endothelial-to-mesenchymal transition |
| FISH | Fluorescence in situ hybridization |
| HFD | High-fat diet |
| HHcy | Hyperhomocysteinemia |
| HybISS | Hybridization-based in situ sequencing |
| IPA | Ingenuity pathway analysis |
| IRF | Interferon regulatory transcription factors |
| MDA-LDL | Malondialdehyde low-density lipoprotein |
| MoDC | Monocyte-derived dendritic cell |
| MTEnd | Mesenchymal-to-endothelial transition |
| PEDF | Pigment epithelium-derived factor |
| Spn | Sialophorin |
| ScRNAseq | Single-cell RNA sequencing |
| TLR | Toll-like receptor |
| Treg | Regulatory T-cell |
References
- Wolf, D.; Ley, K. Immunity and Inflammation in Atherosclerosis. Circ. Res. 2019, 124, 315–327. [Google Scholar] [CrossRef] [PubMed]
- Bjorkegren, J.L.M.; Lusis, A.J. Atherosclerosis: Recent developments. Cell 2022, 185, 1630–1645. [Google Scholar] [CrossRef] [PubMed]
- Bashore, A.C.; Zhu, L.Y.; Reilly, M.P. A new era in understanding atherosclerotic plaques. Nat. Cardiovasc. Res. 2022, 1, 1127–1129. [Google Scholar] [CrossRef] [PubMed]
- Tabas, I.; Lichtman, A.H. Monocyte-Macrophages and T Cells in Atherosclerosis. Immunity 2017, 47, 621–634. [Google Scholar] [CrossRef]
- Cochain, C.; Vafadarnejad, E.; Arampatzi, P.; Pelisek, J.; Winkels, H.; Ley, K.; Wolf, D.; Saliba, A.-E.; Zernecke, A. Single-Cell RNA-Seq Reveals the Transcriptional Landscape and Heterogeneity of Aortic Macrophages in Murine Atherosclerosis. Circ. Res. 2018, 122, 1661–1674. [Google Scholar] [CrossRef]
- Winkels, H.; Ehinger, E.; Vassallo, M.; Buscher, K.; Dinh, H.Q.; Kobiyama, K.; Hamers, A.A.; Cochain, C.; Vafadarnejad, E.; Saliba, A.-E.; et al. Atlas of the Immune Cell Repertoire in Mouse Atherosclerosis Defined by Single-Cell RNA-Sequencing and Mass Cytometry. Circ. Res. 2018, 122, 1675–1688. [Google Scholar] [CrossRef]
- Kim, K.; Shim, D.; Lee, J.S.; Zaitsev, K.; Williams, J.W.; Kim, K.W.; Jang, M.Y.; Seok Jang, H.; Yun, T.J.; Lee, S.H.; et al. Transcriptome Analysis Reveals Nonfoamy Rather Than Foamy Plaque Macrophages Are Proinflammatory in Atherosclerotic Murine Models. Circ. Res. 2018, 123, 1127–1142. [Google Scholar] [CrossRef]
- Gu, W.; Ni, Z.; Tan, Y.-Q.; Deng, J.; Zhang, S.-J.; Lv, Z.-C.; Wang, X.-J.; Chen, T.; Zhang, Z.; Hu, Y.; et al. Adventitial Cell Atlas of wt (Wild Type) and ApoE (Apolipoprotein E)-Deficient Mice Defined by Single-Cell RNA Sequencing. Arterioscler. Thromb. Vasc. Biol. 2019, 39, 1055–1071. [Google Scholar] [CrossRef]
- Fernandez, D.M.; Rahman, A.H.; Fernandez, N.F.; Chudnovskiy, A.; Amir, E.-A.D.; Amadori, L.; Khan, N.S.; Wong, C.K.; Shamailova, R.; Hill, C.A.; et al. Single-cell immune landscape of human atherosclerotic plaques. Nat. Med. 2019, 25, 1576–1588. [Google Scholar] [CrossRef]
- Depuydt, M.A.C.; Prange, K.H.; Slenders, L.; Örd, T.; Elbersen, D.; Boltjes, A.; de Jager, S.C.; Asselbergs, F.W.; de Borst, G.J.; Aavik, E.; et al. Microanatomy of the Human Atherosclerotic Plaque by Single-Cell Transcriptomics. Circ. Res. 2020, 127, 1437–1455. [Google Scholar] [CrossRef]
- Zhao, G.; Lu, H.; Liu, Y.; Zhao, Y.; Zhu, T.; Garcia-Barrio, M.T.; Chen, Y.E.; Zhang, J. Single-Cell Transcriptomics Reveals Endothelial Plasticity During Diabetic Atherogenesis. Front. Cell Dev. Biol. 2021, 9, 689469. [Google Scholar] [CrossRef] [PubMed]
- Ma, X.; Deng, J.; Han, L.; Song, Y.; Miao, Y.; Du, X.; Dang, G.; Yang, D.; Zhong, B.; Jiang, C.; et al. Single-cell RNA sequencing reveals B cell-T cell interactions in vascular adventitia of hyperhomocysteinemia-accelerated atherosclerosis. Protein Cell 2022, 13, 540–547. [Google Scholar] [CrossRef] [PubMed]
- Alsaigh, T.; Evans, D.; Frankel, D.; Torkamani, A. Decoding the transcriptome of calcified atherosclerotic plaque at single-cell resolution. Commun. Biol. 2022, 5, 1084. [Google Scholar] [CrossRef] [PubMed]
- Mosquera, J.V.; Auguste, G.; Wong, D.; Turner, A.W.; Hodonsky, C.J.; Alvarez-Yela, A.C.; Song, Y.; Cheng, Q.; Cardenas, C.L.L.; Theofilatos, K.; et al. Integrative single-cell meta-analysis reveals disease-relevant vascular cell states and markers in human atherosclerosis. Cell Rep. 2023, 42, 113380. [Google Scholar] [CrossRef]
- Pattarabanjird, T.; Srikakulapu, P.; Ransegnola, B.; Marshall, M.A.; Ghosheh, Y.; Gulati, R.; Durant, C.; Drago, F.; Taylor, A.M.; Ley, K.; et al. Single-cell profiling of CD11c+ B cells in atherosclerosis. Front. Immunol. 2023, 14, 1296668. [Google Scholar] [CrossRef]
- von Scheidt, M.; Zhao, Y.; Kurt, Z.; Pan, C.; Zeng, L.; Yang, X.; Schunkert, H.; Lusis, A.J. Applications and Limitations of Mouse Models for Understanding Human Atherosclerosis. Cell Metab. 2017, 25, 248–261. [Google Scholar] [CrossRef]
- Gistera, A.; Ketelhuth, D.F.; Malin, S.G.; Hansson, G.K. Animal Models of Atherosclerosis-Supportive Notes and Tricks of the Trade. Circ. Res. 2022, 130, 1869–1887. [Google Scholar] [CrossRef]
- Cole, J.E.; Park, I.; Ahern, D.J.; Kassiteridi, C.; Abeam, D.D.; E Goddard, M.; Green, P.; Maffia, P.; Monaco, C. Immune cell census in murine atherosclerosis: Cytometry by time of flight illuminates vascular myeloid cell diversity. Cardiovasc. Res. 2018, 114, 1360–1371. [Google Scholar] [CrossRef]
- Getz, G.S.; Reardon, C.A. Do the Apoe-/- and Ldlr-/- Mice Yield the Same Insight on Atherogenesis? Arterioscler. Thromb. Vasc. Biol. 2016, 36, 1734–1741. [Google Scholar] [CrossRef]
- Bjornson-Hooper, Z.B.; Fragiadakis, G.K.; Spitzer, M.H.; Chen, H.; Madhireddy, D.; Hu, K.; Lundsten, K.; McIlwain, D.R.; Nolan, G.P. A Comprehensive Atlas of Immunological Differences Between Humans, Mice, and Non-Human Primates. Front. Immunol. 2022, 13, 867015. [Google Scholar] [CrossRef]
- Moore, K.J.; Tabas, I. Macrophages in the pathogenesis of atherosclerosis. Cell 2011, 145, 341–355. [Google Scholar] [CrossRef] [PubMed]
- Bobryshev, Y.V.; Ivanova, E.A.; Chistiakov, D.A.; Nikiforov, N.G.; Orekhov, A.N. Macrophages and Their Role in Atherosclerosis: Pathophysiology and Transcriptome Analysis. BioMed Res. Int. 2016, 2016, 9582430. [Google Scholar] [CrossRef]
- Maganto-Garcia, E.; Tarrio, M.L.; Grabie, N.; Bu, D.-X.; Lichtman, A.H. Dynamic changes in regulatory T cells are linked to levels of diet-induced hypercholesterolemia. Circulation 2011, 124, 185–195. [Google Scholar] [CrossRef] [PubMed]
- Li, J.; McArdle, S.; Gholami, A.; Kimura, T.; Wolf, D.; Gerhardt, T.; Miller, J.; Weber, C.; Ley, K. CCR5+T-bet+FoxP3+ Effector CD4 T Cells Drive Atherosclerosis. Circ. Res. 2016, 118, 1540–1552. [Google Scholar] [CrossRef] [PubMed]
- Moeinafshar, A.; Razi, S.; Rezaei, N. Interleukin 17, the double-edged sword in atherosclerosis. Immunobiology 2022, 227, 152220. [Google Scholar] [CrossRef]
- Ma, S.; Wang, S.; Li, M.; Zhang, Y.; Zhu, P. The effects of pigment epithelium-derived factor on atherosclerosis: Putative mechanisms of the process. Lipids Health Dis. 2018, 17, 240. [Google Scholar] [CrossRef]
- Liuzzo, G.; Biasucci, L.M.; Trotta, G.; Brugaletta, S.; Pinnelli, M.; Digianuario, G.; Rizzello, V.; Rebuzzi, A.G.; Rumi, C.; Maseri, A.; et al. Unusual CD4+CD28null T lymphocytes and recurrence of acute coronary events. J. Am. Coll. Cardiol. 2007, 50, 1450–1458. [Google Scholar] [CrossRef]
- Malhotra, N.; Leyva-Castillo, J.M.; Jadhav, U.; Barreiro, O.; Kam, C.; O’neill, N.K.; Meylan, F.; Chambon, P.; von Andrian, U.H.; Siegel, R.M.; et al. RORalpha-expressing T regulatory cells restrain allergic skin inflammation. Sci. Immunol. 2018, 3, eaao6923. [Google Scholar] [CrossRef]
- Wohlfert, E.A.; Grainger, J.R.; Bouladoux, N.; Konkel, J.E.; Oldenhove, G.; Ribeiro, C.H.; Hall, J.A.; Yagi, R.; Naik, S.; Bhairavabhotla, R.; et al. GATA3 controls Foxp3(+) regulatory T cell fate during inflammation in mice. J. Clin. Investig. 2011, 121, 4503–4515. [Google Scholar] [CrossRef]
- Kumar, B.V.; Ma, W.; Miron, M.; Granot, T.; Guyer, R.S.; Carpenter, D.J.; Senda, T.; Sun, X.; Ho, S.-H.; Lerner, H.; et al. Human Tissue-Resident Memory T Cells Are Defined by Core Transcriptional and Functional Signatures in Lymphoid and Mucosal Sites. Cell Rep. 2017, 20, 2921–2934. [Google Scholar] [CrossRef]
- Cochain, C.; Chaudhari, S.M.; Koch, M.; Wiendl, H.; Eckstein, H.-H.; Zernecke, A. Programmed cell death-1 deficiency exacerbates T cell activation and atherogenesis despite expansion of regulatory T cells in atherosclerosis-prone mice. PLoS ONE 2014, 9, e93280. [Google Scholar] [CrossRef] [PubMed]
- Bu, D.X.; Tarrio, M.; Maganto-Garcia, E.; Stavrakis, G.; Tajima, G.; Lederer, J.A.; Jarolim, P.; Freeman, G.J.; Sharpe, A.H.; Lichtman, A.H. Impairment of the programmed cell death-1 pathway increases atherosclerotic lesion development and inflammation. Arterioscler. Thromb. Vasc. Biol. 2011, 31, 1100–1107. [Google Scholar] [CrossRef] [PubMed]
- Lutgens, E.; Seijkens, T.T.P. Cancer patients receiving immune checkpoint inhibitor therapy are at an increased risk for atherosclerotic cardiovascular disease. J. Immunother. Cancer 2020, 8, e000300. [Google Scholar] [CrossRef] [PubMed]
- Matter, M.A.; Paneni, F.; Libby, P.; Frantz, S.; E Stähli, B.; Templin, C.; Mengozzi, A.; Wang, Y.-J.; Kündig, T.M.; Räber, L.; et al. Inflammation in acute myocardial infarction: The good, the bad and the ugly. Eur. Heart J. 2024, 45, 89–103. [Google Scholar] [CrossRef]
- Adams, G.N.; Stavrou, E.X.; Fang, C.; Merkulova, A.; Alaiti, M.A.; Nakajima, K.; Morooka, T.; Merkulov, S.; LaRusch, G.A.; I Simon, D.; et al. Prolylcarboxypeptidase promotes angiogenesis and vascular repair. Blood 2013, 122, 1522–1531. [Google Scholar] [CrossRef]
- Tong, S.; Ji, Q.; Du, Y.; Zhu, X.; Zhu, C.; Zhou, Y. Sfrp5/Wnt Pathway: A Protective Regulatory System in Atherosclerotic Cardiovascular Disease. J. Interferon Cytokine Res. 2019, 39, 472–482. [Google Scholar] [CrossRef]
- Min, J.K.; Park, H.; Choi, H.-J.; Kim, Y.; Pyun, B.-J.; Agrawal, V.; Song, B.-W.; Jeon, J.; Maeng, Y.-S.; Rho, S.-S.; et al. The WNT antagonist Dickkopf2 promotes angiogenesis in rodent and human endothelial cells. J. Clin. Investig. 2011, 121, 1882–1893. [Google Scholar] [CrossRef]
- Grover, J.; Roughley, P.J. Characterization and expression of murine PRELP. Matrix Biol. 2001, 20, 555–564. [Google Scholar] [CrossRef]
- Deuel, T.F.; Zhang, N.; Yeh, H.-J.; Silos-Santiago, I.; Wang, Z.-Y. Pleiotrophin: A cytokine with diverse functions and a novel signaling pathway. Arch. Biochem. Biophys. 2002, 397, 162–171. [Google Scholar] [CrossRef]
- Pilecki, B.; Holm, A.T.; Schlosser, A.; Moeller, J.B.; Wohl, A.P.; Zuk, A.V.; Heumüller, S.E.; Wallis, R.; Moestrup, S.K.; Sengle, G.; et al. Characterization of Microfibrillar-associated Protein 4 (MFAP4) as a Tropoelastin- and Fibrillin-binding Protein Involved in Elastic Fiber Formation. J. Biol. Chem. 2016, 291, 1103–1114. [Google Scholar] [CrossRef]
- Hubmacher, D.; Apte, S.S. ADAMTS proteins as modulators of microfibril formation and function. Matrix Biol. 2015, 47, 34–43. [Google Scholar] [CrossRef] [PubMed]
- Hu, Y.; Zhang, Z.; Torsney, E.; Afzal, A.R.; Davison, F.; Metzler, B.; Xu, Q. Abundant progenitor cells in the adventitia contribute to atherosclerosis of vein grafts in ApoE-deficient mice. J. Clin. Investig. 2004, 113, 1258–1265. [Google Scholar] [CrossRef] [PubMed]
- Boring, L.; Gosling, J.; Cleary, M.; Charo, I.F. Decreased lesion formation in CCR2-/- mice reveals a role for chemokines in the initiation of atherosclerosis. Nature 1998, 394, 894–897. [Google Scholar] [CrossRef] [PubMed]
- Liu, M.S.; Kang, G.F.; Ghosh, S. Activation of phospholipases A1 and A2 in heart, liver, and blood during endotoxin shock. J. Surg. Res. 1988, 45, 472–480. [Google Scholar] [CrossRef]
- Hazell, G.G.; Peachey, A.M.G.; Teasdale, J.E.; Sala-Newby, G.B.; Angelini, G.D.; Newby, A.C.; White, S.J. PI16 is a shear stress and inflammation-regulated inhibitor of MMP2. Sci. Rep. 2016, 6, 39553. [Google Scholar] [CrossRef]
- Suh, S.H.; Kim, S.W. Dyslipidemia in Patients with Chronic Kidney Disease: An Updated Overview. Diabetes Metab. J. 2023, 47, 612–629. [Google Scholar] [CrossRef]
- Turner, A.W.; Hu, S.S.; Mosquera, J.V.; Ma, W.F.; Hodonsky, C.J.; Wong, D.; Auguste, G.; Song, Y.; Sol-Church, K.; Farber, E.; et al. Single-nucleus chromatin accessibility profiling highlights regulatory mechanisms of coronary artery disease risk. Nat. Genet. 2022, 54, 804–816. [Google Scholar] [CrossRef]
- Sun, J.; Singh, P.; Shami, A.; Kluza, E.; Pan, M.; Djordjevic, D.; Michaelsen, N.B.; Kennbäck, C.; van der Wel, N.N.; Orho-Melander, M.; et al. Spatial Transcriptional Mapping Reveals Site-Specific Pathways Underlying Human Atherosclerotic Plaque Rupture. J. Am. Coll. Cardiol. 2023, 81, 2213–2227. [Google Scholar] [CrossRef]
- Bleckwehl, T.; Babler, A.; Tebens, M.; Maryam, S.; Nyberg, M.; Bosteen, M.; Halder, M.; Shaw, I.; Fleig, S.; Pyke, C.; et al. Encompassing view of spatial and single-cell RNA sequencing renews the role of the microvasculature in human atherosclerosis. Nat. Cardiovasc. Res. 2025, 4, 26–44. [Google Scholar] [CrossRef]
- Khan, A.W.; Paneni, F.; Jandeleit-Dahm, K.A.M. Cell-specific epigenetic changes in atherosclerosis. Clin. Sci. 2021, 135, 1165–1187. [Google Scholar] [CrossRef]
- Xu, S.; Kamato, D.; Little, P.J.; Nakagawa, S.; Pelisek, J.; Jin, Z.G. Targeting epigenetics and non-coding RNAs in atherosclerosis: From mechanisms to therapeutics. Pharmacol. Ther. 2019, 196, 15–43. [Google Scholar] [CrossRef]

| 1st Author/Date | Technique | Model | Main Findings |
|---|---|---|---|
| Cochain [5] June 2018 | scRNAseq of immune (CD45+-enriched) cells from mouse aorta | LdlR−/− and ApoE−/− male mice on chow diet vs. high-fat diet (HFD) 11 weeks vs. 20 weeks | Macrophages are the predominant leukocyte population in plaque and are highly heterogeneous in disease. Macrophage populations specific to atherosclerosis are present at different stages of the disease. |
| Winkels [6] June 2018 | CyTOF and scRNAseq on immune (CD45+-enriched) cells from mouse aorta Deconvolution of bulk RNAseq | LdlR−/− or ApoE−/− female mice on chow diet vs. HFD (12 weeks) Human carotid plaques | LDLR−/− or ApoE−/− mice have different atherosclerotic leukocyte populations and distributions. Both mouse and human carotid plaques are enriched in T-cells, macrophages, and monocytes. Each of these populations is highly transcriptomically heterogeneous. |
| Kim [7] October 2018 | scRNAseq of immune (CD45+-enriched) cells from mouse aorta Bulk RNAseq of flow-sorted foamy vs. non-foamy macrophages | LdlR−/− mice on chow diet vs. HFD (12 weeks) | Separation of functions between non-foamy and foamy macrophages. Non-foamy cells were mostly involved in (pro- and anti-) inflammatory responses, while foamy cells upregulated pathways involved in lipid metabolism. Foamy cell proportions correlated with atherosclerosis severity. |
| Gu [8] June 2019 | scRNAseq on total cells from mouse aortic adventitita | ApoE−/− vs. wildtype male mice (12 wo) on chow diet | Non-immune cell populations in aortic adventitia are numerous, and heterogeneous, and they contribute to the recruitment of immune cells in the early stages of atherosclerosis. |
| Fernandez [9] October 2019 | CyTOF, CITE-Seq, and scRNAseq immune (CD45+-enriched) cells from carotid artery plaques of patients | Patients with clinically symptomatic atherosclerotic disease compared to those with asymptomatic disease | T-cells are the most abundant population of plaque leukocytes, and effector memory T-cells are specifically enriched in plaques compared to blood. T-cells at the lesion site display features of activation and immune exhaustion, indicating a likely transition from activation to exhaustion. T-cell exhaustion is further increased in symptomatic plaques. |
| Depuydt [10] September 2020 | scRNAseq of total cells from human carotid endarterectomy tissue | Patients with carotid artery disease | Described the cellular landscape of human atherosclerotic plaque. Revealed high heterogeneity and plasticity of T cells, macrophages, and endothelial cells. Identified likely cell–cell interactions. |
| Zhao [11] May 2021 | scRNAseq of EC (CD31+)-enriched cells from mouse heart and aorta | LdlR−/− mice on chow vs. diabetogenic diet (12 weeks) | High EC heterogeneity in healthy and atherosclerotic aortas. EndMT drives atherosclerosis and is increased by it. |
| Ma [12] July 2022 | scRNAseq of immune (CD45+-enriched) cells from mouse aorta | ApoE−/− mice fed with homocysteine vs. HFD | The majority of B-cells in atherosclerotic aortas function as antigen-presenting cells, and this is exacerbated following homocysteine, but not HFD, acceleration. Antigen-presenting B-cells accelerate atherosclerosis by interacting with CD4+ T cells. |
| Alsaigh [13] October 2022 | scRNAseq on the total aortic cell population. EC and SMC-focused analysis | Patients with asymptomatic type VII plaque, comparing composition at calcified atherosclerotic core and proximal adjacent region | VSMCs and ECs contribute to calcification in atherosclerotic plaque through different pathways. Transcriptomic profiles of EC/SMC situated at the core of the plaque are different from those at the border and suggest that cells at the core drive plaque remodelling and calcification, while cells at the border drive inflammation. |
| Mosquera [14] November 2023 | Integrated meta-analysis of 22 scRNA-seq libraries coupled with GWAS summary statistics and genetic prioritisation. | Human coronary arteries, atherosclerotic lesions, and non-lesions | SMCs are highly plastic at the plaque site. Different SMC phenotypes likely drive different pathologies. Fibromyocytes are highly associated with CAD/Myocardial Infarction, while fibrochondrocytes are enriched for calcification. |
| Pattarabanjird [15] January 2024 | Flow cytometry on blood, spleen, and bone marrow from ApoE−/− mice. CITEseq on blood from coronary artery disease patients | Ageing Apoe−/− mice, 50 vs. 100-week-old Patients with coronary artery disease (CAD), high vs. low severity | The proportion of CD11c+ B cells increased in blood, spleen, and bone marrow from older mice and correlates with the increase in aortic plaque. Specific CD11c+ B-cell subsets (age-associated and double negative 2, DN2) were increased in blood from patients with high severity CAD, compared to low severity. DN2 CD11c+ B-cells can be recruited from the blood to the plaque. |
| MOUSE | HUMAN | |||
|---|---|---|---|---|
| Blood | Plaque * | Blood | Plaque * | |
| [20] | [5,6,18] | [20] | [6,9,10] | |
| Monocytes/macrophages | 1.4–2% | 22–60% | 2.3–4.6% | 13–65% |
| T-cells | 7–9% | 28.3–49% | 11–17% | 19–65% |
| B-cells | 10–20% | 6–29% | 1–2% | 4–11% |
| Neutrophils | 1–3% | <1–3% | 30–50% | <1–2% |
| NK cells | 1.1–1.2% | <1–2% | 1–1.3% | <1–5% |
Disclaimer/Publisher’s Note: The statements, opinions and data contained in all publications are solely those of the individual author(s) and contributor(s) and not of MDPI and/or the editor(s). MDPI and/or the editor(s) disclaim responsibility for any injury to people or property resulting from any ideas, methods, instructions or products referred to in the content. |
© 2025 by the authors. Licensee MDPI, Basel, Switzerland. This article is an open access article distributed under the terms and conditions of the Creative Commons Attribution (CC BY) license (https://creativecommons.org/licenses/by/4.0/).
Share and Cite
Cetin, E.; Raby, A.-C. Understanding Atherosclerotic Plaque Cellular Composition: Recent Advances Driven by Single Cell Omics. Cells 2025, 14, 770. https://doi.org/10.3390/cells14110770
Cetin E, Raby A-C. Understanding Atherosclerotic Plaque Cellular Composition: Recent Advances Driven by Single Cell Omics. Cells. 2025; 14(11):770. https://doi.org/10.3390/cells14110770
Chicago/Turabian StyleCetin, Esra, and Anne-Catherine Raby. 2025. "Understanding Atherosclerotic Plaque Cellular Composition: Recent Advances Driven by Single Cell Omics" Cells 14, no. 11: 770. https://doi.org/10.3390/cells14110770
APA StyleCetin, E., & Raby, A.-C. (2025). Understanding Atherosclerotic Plaque Cellular Composition: Recent Advances Driven by Single Cell Omics. Cells, 14(11), 770. https://doi.org/10.3390/cells14110770