Article

Cultures of Human Skin Mast Cells, an Attractive In Vitro Model for Studies of Human Mast Cell Biology

1
Department of Cell and Molecular Biology, Uppsala University, The Biomedical Center, Box 596, SE-75124 Uppsala, Sweden
2
Department of Anatomy, Physiology, and Biochemistry, Swedish University of Agricultural Sciences, Box 7011, SE-75007 Uppsala, Sweden
3
Institute of Allergology, Charité—Universitätsmedizin Berlin, Corporate Member of Freie Universität Berlin and Humboldt-Universität zu Berlin, Hindenburgdamm 30, 12203 Berlin, Germany
4
Fraunhofer Institute for Translational Medicine and Pharmacology ITMP, Immunology and Allergology IA, Hindenburgdamm 30, 12203 Berlin, Germany
*
Authors to whom correspondence should be addressed.
These authors contributed equally to this work.
Cells 2024, 13(1), 98; https://doi.org/10.3390/cells13010098
Submission received: 24 November 2023 / Revised: 21 December 2023 / Accepted: 27 December 2023 / Published: 2 January 2024

Abstract

:
Studies of mast cell biology are dependent on relevant and validated in vitro models. Here, we present detailed information concerning the phenotype of both freshly isolated human skin mast cells (MCs) and of in vitro cultures of these cells that were obtained by analyzing their total transcriptome. Transcript levels of MC-related granule proteins and transcription factors were found to be remarkably stable over a 3-week culture period. Relatively modest changes were also seen for important cell surface receptors including the high-affinity receptor for IgE, FCER1A, the low-affinity receptor for IgG, FCGR2A, and the receptor for stem cell factor, KIT. FCGR2A was the only Fc receptor for IgG expressed by these cells. The IgE receptor increased by 2–5-fold and an approximately 10-fold reduction in the expression of FCGR2A was observed most likely due to the cytokines, SCF and IL-4, used for expanding the cells. Comparisons of the present transcriptome against previously reported transcriptomes of mouse peritoneal MCs and mouse bone marrow-derived MCs (BMMCs) revealed both similarities and major differences. Strikingly, cathepsin G was the most highly expressed granule protease in human skin MCs, in contrast to the almost total absence of this protease in both mouse MCs. Transcript levels for the majority of cell surface receptors were also very low compared to the granule proteases in both mouse and human MCs, with a difference of almost two orders of magnitude. An almost total absence of T-cell granzymes was observed in human skin MCs, indicating that granzymes have no or only a minor role in human MC biology. Ex vivo skin MCs expressed high levels of selective immediate early genes and transcripts of heat shock proteins. In validation experiments, we determined that this expression was an inherent property of the cells and not the result of the isolation process. Three to four weeks in culture results in an induction of cell growth-related genes accompanying their expansion by 6–10-fold, which increases the number of cells for in vitro experiments. Collectively, we show that cultured human skin MCs resemble their ex vivo equivalents in many respects and are a more relevant in vitro model compared to mouse BMMCs for studies of MC biology, in particular human MC biology.

1. Introduction

Mast cells (MCs) are hematopoietic cells that are positioned at the interphase between tissue and the environment, such as the skin, the tongue, the intestinal mucosa, and the lung [1]. They are highly specialized cells filled with electron-dense granules that can act on external threats to initiate an inflammatory response. A number of physiologically highly potent substances, such as histamine and heparin, and a number of abundant granule proteases are stored in these granules. The granule-stored proteases can constitute up to 35% of the total cellular protein and the transcript levels for these proteases are among the highest in the entire cell [1,2]. The levels can reach several % of the total transcriptome [1,3]. Heparin and the related chondroitin sulfate are highly sulfated and negatively charged proteoglycans expressed by MCs. They play important roles as anticoagulants, as stabilizing agents for MC proteases, and as charge-compensating molecules in the granule storage of positively charged mediators, including histamine. The enzymes involved in the synthesis of these proteoglycans and of histamine are therefore important markers for MCs.
MCs can rapidly release their granule material upon stimulation of the cell by the crosslinking of receptors for immunoglobulin E (IgE) or by stimulation by complement components like the anaphylatoxins C3a, C4a, and C5a. MCs can also be activated by positively charged low-molecular-weight compounds, like substance P and compound 48/80. This response is mediated by the MRGPRX2 receptor, which is almost exclusively expressed by connective tissue-type MCs (CTMCs) [4,5,6]. Upon activation, MCs also produce a number of lipid mediators, including leukotriene C4 (LTC4) and prostaglandin D2 (PGD2). The enzymes involved in their synthesis, such as phospholipase A2 (PLA2), the hematopoietic prostaglandin D synthase (HPGDS), and leukotriene C4 synthase (LTC4S), are also important markers for MCs.
MC development and migration are regulated by cytokines and chemokines that deliver their information by binding to specific cell surface receptors. The growth and differentiation of MCs are primarily regulated by stem cell factor (SCF), interleukin-3 (IL-3) (especially in the mouse), IL-4, and IL-33, and the receptors for these cytokines are important characteristics of MCs [7,8,9,10,11,12,13,14,15,16,17,18,19,20,21,22].
Transcription factors play a key role in cell growth and differentiation and several of them are important characteristics of MCs, including GATA1, GATA2, and MITF [1,5,23,24,25]. Analyzing the transcript levels for these transcription factors can therefore reveal important features of MCs and how their phenotype changes upon in vitro culture conditions. These transcription factors are also important for the physiological role of MCs and can thereby give information on differences in MC biology between species. The MC-related transcription factors were therefore used in the present study, together with a panel of other proteins, as markers for the comparison between MCs in mouse and man and for the characterization of how MCs change upon culture. A selection of results from published studies on mouse peritoneal MCs and in vitro expanded mouse bone marrow-derived MCs (BMMCs), the two most commonly used models in mouse MC research, using the Ampliseq technology are summarized in Table 1 [1,26] for comparison with the human MC data presented in this article.
The majority of tissue MCs seem to originate from an early wave of cells coming from the yolk sac [27,28]. However, during inflammatory conditions, MC precursors can also be recruited from the bone marrow to increase in number in the inflamed tissue [29]. The fate of these cells upon returning to steady state conditions of the tissue is not fully known but most likely involves apoptosis of the majority of the cells. This relatively recent information concerning the origin of the majority of tissue MCs and macrophages has changed the view of the role of the bone marrow for both MCs and other hematopoietic cells like macrophages. Such information is of major importance for our view of the characteristics of in vitro-developed cells originating from the bone marrow compared to tissue-resident MCs and macrophages [30,31,32,33,34,35,36]. The most commonly used in vitro model for mouse MCs is namely bone marrow-derived MCs (BMMCs). These cells most likely represent cells of a different origin compared to the majority of tissue MCs, which appear to be yolk sac-derived. We have also recently shown that these BMMCs represent relatively immature cells that differ markedly in phenotype from tissue-resident MCs and should therefore be used with care as in vitro models of MC physiology [26] (see also Table 1). An interesting in vitro model for studies of MC physiology is therefore human skin MCs that can be expanded in vitro by a medium containing serum and recombinant SCF and IL-4, as described in this article. We can show here that they resemble tissue-resident MCs much better than mouse BMMCs and are therefore superior as an in vitro model, in particular for research of human MC biology.

2. Materials and Methods

2.1. Purification of Human Skin MCs

MC purification was performed as previously described [37,38] with several modifications specified in more recent work [21]. Skin was cut into strips and treated with dispase (24.5 mL per preparation, activity: 50 U/mL; Corning, Kaiserslautern, Germany) at 4 °C overnight. After removal of the epidermis, the dermis was chopped into small pieces and digested with 2.29 mg/mL collagenase (Worthington, Lakewood, NJ, USA), 0.75 mg/mL hyaluronidase (Sigma, Deisenhofen, Germany), DNase I at 10 µg/mL (both from Roche, Basel, Switzerland), and 5 mM MgSO4 for 1 h at 37 °C.
The cell suspensions were separated from remaining tissue by three steps of filtration. In the case of breast skin, the undigested tissue still remaining after the first digestion was subjected to a second digestion step of 1 h at 37 °C after the first filtration. MC purification from the dispersates was achieved by positive selection with anti-human c-Kit microbeads and an Auto-MACS separation device (both from Miltenyi Biotec, Bergisch Gladbach, Germany). MC purity always exceeded 98%, as assessed by acidic toluidine-blue staining (0.1% in 0.5 N HCl). Viability by trypan blue exclusion exceeded 99%. We used between 4.8 and 6.2 × 10⁶ MCs for one RNA isolation (ex vivo samples). Cultures were started from 1.5–6 × 10⁶ MCs; around 3 × 10⁶ were eventually used for one RNA preparation.

2.2. In Vitro Culture of Human Skin MCs

The isolated skin MCs were expanded in vitro for 2–3 weeks in cell culture medium (basal Iscove’s medium; BioSell, Feucht, Germany) containing 10% fetal calf serum (Biochrom, Berlin, Germany), 1% P/S (Fisher Scientific, Berlin, Germany), 1% non-essential amino acid solution (Roth, Karlsruhe, Germany), 100 ng/mL recombinant human stem cell factor (SCF) (Peprotech, Rocky Hill, NJ, USA), and 20 ng/mL of recombinant human IL-4 (Peprotech, Rocky Hill, NJ, USA). The medium was changed every three days to ensure there was a sufficient quantity of the recombinant cytokines.

2.3. RNA Isolation and Heparinase Treatment

Total RNA was prepared from freshly isolated MCs and in vitro-cultured MCs, following an established protocol for each preparation. Briefly, MCs were lysed in 700 µL QIAzol®lysis reagent (Qiagen, Hilden, Germany), mixed with 140 µL chloroform (Sigma) and 60 µL DEPC-treated water, and transferred to a 2 mL gel tube (Quanta bio/VWR, Dresden, Germany). After centrifugation, the supernatant was transferred to a NucleoSpin® filter and RNA was isolated using the NucleoSpin RNA kit from Machery-Nagel (Düren, Germany) following the manufacturer’s instructions. For heparinase (BioLab, Braunschweig, Germany) treatment, the resulting RNA solution was mixed with RNAse inhibitor (Thermo Fisher Scientific) and heparinase buffer (BioLab, Braunschweig, Germany) and incubated for 3 h at 25 °C. Another RNA isolation procedure was followed, using the NucleoSpin RNA kit from Machery-Nagel (Düren, Germany) according to the manufacturer’s protocol. To further concentrate preparations, RNA was precipitated overnight at −80 °C using 100% ethanol and sodium acetate (Merck, Darmstadt, Germany). The RNA of each preparation was eventually solved in 20 µL DEPC-treated water. After each treatment step, RNA concentration was determined by using a Nanodrop ND-1000 (Nano Drop Technologies, Wilmington, DE, USA).

2.4. Ampliseq Analysis of the Total Transcriptome

The transcriptome of freshly isolated mast cells and the different cultures were analyzed for their total transcriptome by the Thermo-Fisher chip-based Ampliseq transcriptomic platform at the SciLife lab in Uppsala, Sweden (Ion-Torrent next-generation sequencing system—Thermofisher, Waltham, MA, USA). The sequence results were delivered in the form of Excel files with normalized expression levels for an easy comparison between samples. In the Ampliseq analysis, all transcripts are read only once; this is why no normalization is needed.

2.5. Validations and RT-qPCR

For the first approach, cultured skin MCs were stimulated with an anti-FcεRI-Ab, AER-37 (0.5 µg/mL) (Abcam, Cambridge, UK), for 30 min, 90 min, and 24 h and compared to cultured unstimulated skin MCs. In the second approach, skin MCs were harvested 1 and 2 d after isolation, as well as after 3 weeks of cultivation. For the final part, cultured skin MCs were exposed to enzymes identically to what is used for skin MC isolation (2.29 mg/mL collagenase, 0.75 mg/mL hyaluronidase, DNase I at 10 µg/mL, and 5 mM MgSO4) and kept at 37 °C with or without shaking prior to harvest. RNA was extracted with the NucleoSpin RNA kit (Macherey-Nagel, Düren, Germany) and reverse transcribed with TaqMan Reverse Transcription reagent (Applied Biosystems, Foster City, CA, USA) according to the manufacturer’s recommendations. Quantitative PCR was performed with the LightCycler® FastStart DNA Master SYBR Green I reaction mix (Roche Diagnostics, Mannheim, Germany) in a QIAquant 96 5plex real-time PCR cycler (Qiagen, Hilden, Germany). The primers for target genes were designed with NCBI primer blast software and synthesized by TIB Molbiol, Berlin, Germany. The 2−ΔΔCT method was used to quantify the relative expression levels of target genes to several reference genes (appearing at the end of the table, i.e., β-actin, GAPDH, HPRT, and Cyclophilin B = Peptidylprolyl Isomerase B, gene name PPIB), as described (Table 2) [39,40]. Statistical analysis and visualization were performed with GraphPad Prism software (La Jolla, CA, USA, version 10.0.3.)

3. Results

3.1. Samples Used for Analysis

Samples of human foreskin and breast skin were, after surgery, collected and digested with dispase and collagenase to obtain a single cell suspension. These cells were then subjected to purification by magnetic cell sorting using a non-activating anti-kit antibody. Approximately 98%-pure MCs were obtained by this procedure for analysis of their entire transcriptome, before and after in vitro culturing for 2–3 weeks (Figure 1). The in vitro culture was performed in a serum containing a medium to which recombinant human stem cell factor (SCF) and interleukin-4 (IL-4) had been added. The aim of cultures was to obtain more cells for in vitro studies of MC biology. The number of MCs increased about 6–10-fold, by a three-week culture [38].
For the freshly isolated MCs, we analyzed three independent samples, all isolated from foreskin. Due to the relatively few cells obtained from each foreskin, three separate donor pools encompassing material from 12, 7, and 6 individuals, respectively, were used for the three fresh samples. The cultured samples were from 5–15 foreskin donors (or individual donors in the case of breast skin). For the in vitro-expanded cells, we had four cultures in total, two originating from foreskin (cultured for 20 and 17 days) and two from breast skin, cultured for 18 and 19 days. These seven samples were analyzed by the Ampliseq technology to obtain a quantitative map of the expression levels of all approximately 21,000 human genes.
By analyzing the expression of one non-coding RNA involved in X chromosome inactivation, XIST, we confirmed the origin of the seven samples in this analysis. Two of the three freshly isolated samples and the two originating from cultured foreskin MCs were clearly negative for this transcript, showing that they were of male origin. The two samples from breast skin showed high levels of expression of this gene, confirming their female origin (Table 3). Interestingly, one of the freshly isolated samples had a low level of this transcript indicating a mixed phenotype (Table 3). However, there are also reports of XIST expression in male cells [41]. We also included a male-specific gene, RPS4Y1, which is expressed from the Y chromosome and therefore cannot be expressed by female cells. This gene was expressed at relatively low levels in all three freshly isolated samples and in the two foreskin samples but not in the two breast samples, confirming the male origin of the five foreskin samples (Table 3).

3.2. Transcript Levels for the Major Granule-Stored Proteases and Other Proteases

We first analyzed the granule proteases, as they are, in general, highly and uniquely expressed by MCs. This is why they are good markers of MC identity and phenotype. Three serine proteases and a carboxypeptidase constitute the major granule proteins of human MCs. Their transcript levels were very high and largely stable during a period of three weeks of in vitro culture, with the exception of chymase, CMA1, which was reduced by approximately 50% (Table 4).
The most highly expressed protease was cathepsin G (CATG), a neutrophil and mast cell-expressed protease with approximately 10,000 reads, followed by beta-tryptase (TPSB2) with 7000 reads, carboxypeptidase A3 (CPA3) with 4000 reads, and chymase (CMA1) with 2000 reads (Table 4). The expression of most other hematopoietic serine proteases was very low or absent in these cells, except for the delta- and gamma-tryptases (TPSD1 and TPSG1) and carboxypeptidase M (CPM), all with an average of 220 reads or lower (Table 4). A minor increase in cathepsin C (CTSC) from approximately 30 to approximately 75 reads was observed after culture (Table 4). This enzyme is involved in N-terminal cleavage and activation of the majority of granule proteases [42]. An approximately 10-fold upregulation, from an average of 20 to 200 reads, was also observed for another endoplasmic reticulum or Golgi-located protease, cathepsin W (CTSW), which is expressed by NK cells and cytotoxic T cells (Table 4) [43]. We did not detect expression of any of the T-cell granzymes, except for a low level of granzyme B (GZMB) in two of the in vitro cultures, with 2 and 11 reads, respectively (Table 4). No transcripts were detected for any of the neutrophil proteases (except cathepsin G as described above), including N-elastase, proteinase-3, or neutrophil proteases 4 (NSP-4), and there was no expression of myeloperoxidase or lactoferrin, which, except for NSP-4, are all found in relatively high amounts in mature neutrophils. Likewise, we did not find the expression of any of the classical eosinophil markers, ECP, EDN, and EPO.
Only very minor differences in expression between freshly isolated and cultured MCs were observed for the lysosomal proteases cathepsin B, D, and L1 (CTSB, CTSD, and CTSL1) (Table 4). In contrast, a marked upregulation was observed for two tissue metalloproteases, ADAMTS7 and ADAM14, from very low levels with a few reads in fresh cells to 100–150 reads in cultured cells (Table 4).

3.3. Transcript Levels for Protease Inhibitors

Protease inhibitors are important to control the effects of the massive amounts of proteases stored in MCs and other immune cells. We could observe some changes in the pattern of protease inhibitors after the in vitro culture of skin MCs. While no major change was seen for TIMP1, TIMP3, and cystatin 3 (CST3), a steep upregulation of cystatin 7 (CST7) and serpin B1 (SERPINB1) and a major downregulation of serpins E1 (SERPINE1) and H1 (SERPINH1) were observed (Table 5).

3.4. Transcript Levels for Fc Receptors and Other Cell Surface Receptors

All three chains making up the high-affinity IgE receptor FcεRI (i.e., FCERIA, MS4A2, and FCERIG) were upregulated two- to five-fold in culture. In contrast, a relatively strong, 10-fold, downregulation of FCGR2A was observed (Table 6). Interestingly, FCGR2A was the only Fc receptor, in addition to the high-affinity IgE receptor, expressed by these skin MCs. All other Fc receptors were essentially negative, including FCER2, FCGR1A, FCGR2B, FCGR2C, FCGR3A, and FCGR3B (Table 6). This is of major importance in view of the numerous reports in the literature of Fc receptor expression in MCs. We can show here that these human MCs essentially only express two Fc receptors, the high-affinity IgE receptor and one of the low-affinity receptors for IgG, FCGR2A.
There was a marked upregulation of the inhibitory receptor CD200R1 and a minor upregulation of the inhibitory receptors CD300A and MILR1, also called Allergin 1; however, in all three cases, the upregulation was from relatively low starting levels to levels between 100 and 200 reads (Table 6).

3.5. Transcript Levels for MRGPRX2, Purinergic, Cannabinoid, and Anti-Mullerian Hormone Receptors

For the majority of these receptors, including MRGPRX2, the ATP receptor P2RX1, the endothelin receptor B (EDNRB), and several other receptors, we could not detect any major changes in transcript levels upon in vitro culture. They showed a very stable expression with only small variations as shown in Table 7. We observed a minor increase in the cannabinoid receptor CNR2 and in the ATP/ADP receptor P2RX6. However, for the ATP/ADP receptor P2RY1, we could see a marked upregulation, although from very low starting values (Table 7).

3.6. Transcript Levels for Growth Factor receptors

No major changes in transcript levels were observed for the majority of receptors for cytokines and other growth and differentiation factors, including the stem cell factor receptor (KIT), the erythropoietin receptor (EPOR), the colony stimulating factor receptors CSF2RA and CSF2RB, the IL-33 receptor (IL1RL1), and others. However, for a few receptors including the IL-9 receptor (IL9R), we observed an upregulation from an average of 5 reads to 100–150 reads (Table 8). A marked downregulation of the lymphotoxin B receptor (LTBR), and several members of the TNF receptor family, including TNFRSF9 and TNFRSF21, was also observed (Table 8). Interestingly, relatively low levels of expression were seen for the majority of these receptors, rarely over 100–200 reads, except for KIT that was in the range of 1300–1400 reads in cultured MCs (Table 8).
The expression level of the TSLP receptor, CRLF2, was relatively high in ex vivo MCs and lower in cultured MCs, in accordance with previous results showing a difference in responsiveness to TSLP between these MC subsets (Table 8) [44].

3.7. Transcript Levels for MHC Class I and Class II Genes

No major change in expression was seen for the MHC class I genes, HLA-A, HLA-B, and HLA-C (Table 9). However, for the MHC class II genes, we detected a marked downregulation upon in vitro culture. The levels of MHC class II in freshly isolated cells were, however, very low compared to monocytes, as discussed previously [5]. Monocytes have been analyzed previously and their MHC class II expression levels were in the range of several thousand reads [45]. In the present study, the most highly expressed class II gene was HLA-DRB1, which in one MC preparation reached 146 reads (Table 9). Upon in vitro culture, the expression of the different class II genes was reduced to almost undetectable levels (Table 9). The transcription factor regulating class II expression, the CIITA, was also very lowly expressed and was reduced down to almost zero transcripts after in vitro culture (Table 9).

3.8. Transcript Levels for Enzymes Involved in Proteoglycan, Histamine, Prostaglandin, and Leukotriene Synthesis

No major change in the expression of the enzymes involved in proteoglycan synthesis was observed (Supplementary Table S1). In contrast, several enzymes involved in histamine prostaglandin and leukotriene synthesis were upregulated upon culture, including a minor (2-fold) upregulation of the histidine decarboxylase (HDC) from approximately 800 to 2000 reads, a 3–4-fold upregulation of the prostaglandin synthesis enzyme HPGDS from 600 to 2500 reads, and an almost 10-fold upregulation of the leukotriene synthesis enzyme leukotriene C4 synthase, LTC4S, from approximately 100 to 1000 reads (Table 10). No change in the expression of histamine receptor 4 (HRH4) expression was seen upon culture (Table 10). Interestingly, the only enzyme that showed a major downregulation was the phospholipase A2 -G2A (PLA2G2A) that is involved in the release of arachidonic acid from membrane phospholipids, generating the precursor of both prostaglandins and leukotrienes. However, PLA2G2A is a secreted form of phospholipase A2 and is probably of minor importance for the intracellular levels of arachidonic acid, and its role in MC biology is less well known. High levels of annexin 1 (ANXA1) mRNA were detected in these cells, with approximately 5000 reads in freshly isolated cells and a minor reduction to around 2000 reads in cultured cells (Table 10). Annexin 1 is a phospholipid binding protein also named lipocortin I, which acts as a negative regulator of phospholipase 2 and can thereby inhibit eicosanoid production and suppress inflammation [46]. A minor upregulation from approximately 700 reads to 1800 reads was seen for long-chain-fatty-acid-CoA ligase 4 (ACSL4), an enzyme with a role in lipid metabolism with preference for arachidonic acid [47]. A minor upregulation was also seen for the prostaglandin E receptor 3 (PTGER3). It is a receptor with a preference for prostaglandin E2, which typically increases FcεRI-dependent allergic responses in contrast to PTGER2 and PTGER4 [48]. We found no or very minor changes upon culture in the expression of PTGER2 and PTGER4 (Table 10). A low level of the complement component C2 and a marked upregulation of one of the anaphylatoxin receptors, C3AR1, was observed upon in vitro culture (Table 10).

3.9. Transcript Levels for Cell Adhesion Molecules

Several minor and a few major changes in the expression of cell adhesion molecules were observed, while the majority were relatively stable. The most pronounced upregulation was seen for integrin alpha 2B (ITGA2B), which went from a few reads to around 500 reads. A marked upregulation was also observed for CECAM 1 from around 10 reads to close to 300 reads (Table 11). A decrease in expression was instead seen for integrins alpha 5 and 9 (ITGA5 and ITGA9) which went from approximately 150–250 to around 25 reads (Table 11). An almost 10-fold decrease was also observed for L1CAM going from around 250 reads to between 20 and 50 reads after three weeks in culture (Table 11). L1CAM has important functions in the development of the nervous system, where it engages in cell–matrix and cell–cell interactions, e.g., by binding to integrins such as alpha Vβ3; its potential significance in MCs has been recently discussed [49]. In mouse peritoneal MCs, the most highly expressed cell adhesion molecules were instead Itgb1 with 444 reads, Itga4 with 404 reads, Itgb2 with 388 reads, Itga2b with 266 reads, and Itga9 with 217 reads [1].

3.10. Transcript Levels for Transcription Factors

The MC-related transcription factors GATA1, GATA2, MITF, and HEY1 showed no or very modest changes in expression upon culture, in agreement with most other transcription factors analyzed (Table 12). Also, no changes in transcript levels were seen for two more general transcription factors that have been shown to be of major importance for skin MC maintenance and for regulating GATA2, the evolutionary ancient CREB1 [39] and STAT5 [50,51], respectively (Table 12). However, we found examples of quite dramatic changes, and that was primarily in a few zinc finger and leucine zipper genes including KLF2, KLF4, TSC22D3, and ZFP36. These genes were highly expressed in the freshly isolated cells and strongly downregulated in culture (Table 12). KLF2 has a major role in erythroid and lung development [52]. However, its expression is most pronounced in lymphocytes [53]. KLF4 is highly expressed in non-dividing cells and downregulated upon the induction of cell division, thereby matching our data. The over-expression of KLF4 induces growth arrest [54]. ZFP36 is involved in mRNA stability and binds to AU-rich elements at the 3’ ends of mRNAs to increase their degradation, primarily of cytokine transcripts [55]. Its expression is very high in non-dividing myelocytes like granulocytes, monocytes, as well as MCs [53]. TSC22D3 may have a role in regulating the anti-inflammatory and immunosuppressive effects of IL-10 and corticosteroids [56]. Like KLF2, its expression is strongly enriched in lymphocytes [53]. Except for KLF4, the reason for the dramatic downregulation of these zinc finger and leucine zipper genes during transition from resting to actively dividing cells is not known, but this finding is consistent with what was previously reported for breast skin MCs [5].

3.11. Transcript Levels for Growth-Related Genes

Most of the growth-related genes were highly upregulated in culture, as indicated in the previous section where the growth-arrest-inducing zinc finger gene KLF4 was highly expressed in freshly isolated cells but almost totally absent from cells after in vitro culture (Table 12 and Table 13). Cell growth is apparently induced in culture and genes associated with the cell cycle are consequently increased in expression from low levels of a few reads to several hundred reads (Table 13). We observed potent upregulation of the histone H3 needed for new DNA assembly, cell cycle-regulated ribonucleotide reductase (RRM2), topoisomerase 2A (TOP2A), cyclin-dependent kinase (CDK1), a key player in cell cycle regulation, and of MKI67, a well-known marker for cell proliferation and ribosomal RNA synthesis (Ki-67) (Table 13) [57].

3.12. Transcript Levels for Cytokine and Growth Factor Genes

Most of the cytokines, chemokines, and other growth factor-related genes showed minor changes in expression. However, major changes were detected in a few entities. VEGFA, PDGFA, and IL-13 all showed a marked downregulation in expression upon in vitro culture, and this also applied to some degree to CSF1 (M-CSF) (Table 14). Both VEGFA and PDGFA dropped in expression by almost 100-fold, VEGFA from approximately 2000 reads to 20 reads, and PDGFA from around 350 to 7 reads (Table 14). There were also examples of the opposite, such as GM-CSF (CSF2), which showed a 10–100-fold increase to levels in the range of 300–800 reads, and IL-7, which increased 10 times but from very low initial levels (Table 14). A low level of transcription from the periostin gene (PSTN) was observed, a gene that has been associated with TH2 high asthma [58]. Slightly higher levels were seen for growth and differentiating factor 15 (GDF15) that was first identified as macrophage inhibitory cytokine-1, MIC-1 [59]. EMR2 is encoded by the ADGRE2 gene and a member of the adhesion GPCR family. This gene shows intermediate expression that does not seem to be substantially affected by culture (Table 10). A low level of the optineurin transcript (OPTN) as well as a high expression of TNFAIP3, also named A20, was noted. The latter encodes a zinc finger protein rapidly induced by tumor necrosis factor that seems to be importantly implicated in the downregulation of the inflammatory response induced by LPS [60] (Table 10). Its expression was strongly diminished upon in vitro culture.

3.13. Transcript Levels for Several Cluster of Differentiation (CD) Cell Surface-Expressed Proteins

Most of the CD molecules, including CD4, CD9, and CD14, showed relatively minor changes in expression upon in vitro expansion (Table 15). However, we found a few CD molecules showing more pronounced changes. These included CD63, which was increased by approximately 4-fold from around 300 reads to 1200 reads, CD274, also named PD-L1, which was decreased by approximately 10-fold from around 130 reads to 15 reads, and CD52, a 12 amino acid GPI-anchored peptide that may have an antiadhesive effect due to its high negative charge, which was increased by almost 40 times from around 20 reads to 800 reads (Table 15).

3.14. Transcript Levels for Circadian Clock-Related Genes

Most of the circadian clock genes show minor changes in expression, however, with some interesting exceptions. PER1 dropped in expression quite dramatically from almost 2000 to around 20 reads and TIMELESS increased by almost 50 times from very low levels around 2 reads to almost 100 reads (Table 16).

3.15. Transcript Levels for Other Proteins of Potential Interest

The expression levels of an extended list of genes of potential interest for the function of MCs can be found in Supplementary Tables S1–S11. In these tables, we list enzymes involved in proteoglycan synthesis, solute carriers, lipid transporters, calcium channels, sodium channels, potassium channels, other cell surface proteins, Siglecs, olfactory receptors, other receptors, cell signaling components, other enzymes, proteins related to vesicle transport, cytoskeletal and nuclear proteins, extracellular matrix proteins, oncogenes, and proteins of unknown function (Supplementary Tables S1–S11).

3.16. Transcript Levels for Heat Shock Proteins (HSPs) and Immediate Early Genes (IEGs)

A number of heat shock proteins and a few immediate early response genes including FOS, FOSB, and JUNB were highly expressed in the freshly isolated cells, some being the most highly expressed genes in these cells. These genes included the heat shock proteins HSPA1A, HSPA1B, HISPA6, and HSP90AB1, where HSPA1A reached over 75,000 reads, and FOSB, which had over 14,000 reads in one sample but was low in cultured cells (Table 17).
To understand whether the high expression of HSPs and IEGs in ex vivo MCs was an inherent property of the cells (that was lost in the conditions of the culture) or whether it was a stress response of the cells due to the isolation process, we performed two types of experiments.
Firstly, we made use of the fact that the stimulation of cultured skin MCs, e.g., by SCF or FcεRI aggregation, can induce a potent but transient IEG expression [10,39,40]. Here, we explored the kinetics of IEG and HSP expression following FcεRI aggregation. Indeed, expression of the two IEGs, FOS and FOSB, was induced and peaked after 30 min, but it diminished already after 90 min and was down to baseline after 24 h (Figure 2A). While IEGs are well known to be regulated by various stimuli, requiring CREB activity as an intermediary in skin MCs [39], it was unknown whether this also applies to HSPs. As displayed in Figure 2A, there was only marginal upregulation of HSPA1A and HSPA1B at 90 min (by ≈3-fold). Therefore, HSPs showed a distinct pattern of regulation vis-à-vis IEGs.
We then examined whether freshly extracted skin MCs rapidly downregulated IEGs and HSPs, which could suggest that the expression was primarily resulting from (unspecific) activation during isolation. The assumption was that if expression was the result of the isolation procedure (rather than a feature of the physiologic MCs), then expression would be at the level of cultured MCs after 1 day at the latest. However, this was not the case. As displayed in Figure 2B, the expression of HSP and IEG was still between ≈25 and ≈80-fold higher after 1 day versus in 3-week-cultured MCs. A significantly higher IEG expression was also detected after 2 days. The time-course, showing a drop in gene expression after 2 days versus 1 day, suggested that a subpopulation was gradually lost in the culture. In fact, 25–30% of skin MCs were lost during the first day, suggesting that their survival requires the skin microenvironment. Alternatively, MCs may actively downregulate expression of these genes in the new micromilieu.
In another series of experiments, cultured MCs were exposed to the conditions applied during isolation (i.e., digestive enzymes with or without shaking in a water bath). Compellingly, there was likewise no efficient induction of either IEGs or HSPs by incubation with collagenase/hyaluronidase/DNAse with or without shaking, establishing that the conditions MCs endure during isolation do not bring about the high expression found in ex vivo MCs (Figure 3). FOSB was a slight exception, but even after treatment with enzymes, its transcript abundance was at only 0.1–0.2% of the freshly extracted MCs, not explaining the high abundance in the latter.

4. Discussion

A detailed analysis of the total transcriptome of freshly isolated and cultured human skin MCs was performed to validate the quality of the in vitro-expanded MCs concerning their potential use as models of human MC biology. The cultured cells were found to be remarkably stable in their transcriptome compared to what has been observed for mouse BMMCs (Table 1) [26]. Mouse BMMCs represent a very immature version of mouse MCs where the expression levels of several important MC markers are very low compared to freshly isolated mouse peritoneal MCs, including the granule-stored chymase, Mcpt4 (mMCP-4), the tryptase Mcpt6 (mMCP-6), and the drug/neuropeptide receptor Mrgprb2 (Table 1) [26]. One additional important difference between these two model systems for studies of MC biology is that they represent cells of very different developmental origin. The mouse BMMCs originate from adult bone marrow, whereas the majority of human skin MCs have their origin primarily in an early wave of cells from the yolk sac [27,28]. A recent study of MCs from different mouse organs has shown that, also in the mouse, the organ of origin is a decisive factor for the resulting MC phenotype even though cells from different sources were exposed to identical microenvironments during their recent history [61].
The skin MCs used herein are human, which makes them better models of human biology than mouse MCs of any origin. The presented data harmonize with a previous analysis of skin MCs using another technology for transcriptome analysis, namely, deep-CAGE sequencing [5]. We have expanded this analysis here to include additional samples and another sequencing technology to verify the findings, and, most importantly, to extend to foreskin MCs, which had not been analyzed previously. Concerning granzymes, we did not detect expression of any of the granzymes under steady state conditions. However, some of them may be induced by LPS or IgE receptor crosslinking, as has been observed for GZMB, which was found to be highly inducible following FcεRI aggregation in human skin MCs in the Motakis study [5]. A fivefold increase in GZMB levels was also seen in mouse BMMCs upon LPS stimulation [1]. Also, mouse GZMC was actually upregulated from 0.1 reads to 100 reads, which corresponds to a 1000-fold increase but from very low starting levels [1]. However, during normal steady state conditions, granzymes seem to be almost totally absent from both mouse and human MCs.
In this study, the multiagonist receptor MRGPRX2 remained largely stable, although a slightly lower expression was detected in cultured MCs. This was in contrast to previous studies, demonstrating a prominent downregulation of this receptor at the transcript, protein, and functional levels in cultured skin MCs [5,62]. Even so, skin MCs still retain decent levels of MRGPRX2 in culture and can be used for MRGPRX2-related research, as substantiated by the findings herein. This is in marked contrast to mouse BMMCs that almost totally lack expression of the corresponding mouse receptor Mrgprb2 (Table 1). Expression of the dopamine receptor DRD2 was also observed in this dataset at similar expression levels as in previous studies [49].
Skin is a heterogeneous organ with different micromilieus prevailing in distinct locations. In the skin, MCs interact chiefly with endothelial cells of arterioles and fibroblasts, which shape the MC phenotype [63,64]. MCs interact with fibroblasts by different receptors, including but not limited to KIT, different integrins, and still unidentified receptor–receptor pairs [65,66,67]. The known receptors were also found to be expressed in our current study. Here, we analyzed the transcriptome in MCs derived from both foreskin and breast skin. We previously compared these two skin MC subsets by low-throughput techniques and found that the differences were rather small [68]. For example, breast skin MCs displayed slightly higher tryptase activity but lower histamine and chymase activity; however, there were huge variations within groups [68]. The very minor differences observed here, in global gene expression, between female and male samples further confirmed this concept. These findings suggest that despite their different sources (female, adult versus male, juvenile), major characteristics of skin MCs are surprisingly stable and are not strongly influenced by age, sex, or the precise location.
Concerning the cultured human skin MCs, one additional factor is the total number of cells. Upon in vitro culture, the cells start to proliferate, and we found that the expression of genes related to cell growth were increased (Table 13). After three weeks of culturing, the number of cells had increased by 6–10 times, resulting in more cells available for experiments. However, it is advantageous to use ex vivo skin MCs at least in a few experiments, to verify findings obtained with the precultured counterparts. The notion that expanded cells will resemble their respective prototype cell in the original tissue, even after culture, was recently reported also for mouse fetal skin or fetal liver-derived MCs [61]. However, our findings demonstrate a number of slightly unusual features that should be taken into consideration when using the in vitro-expanded human skin MCs in studies of MC biology (
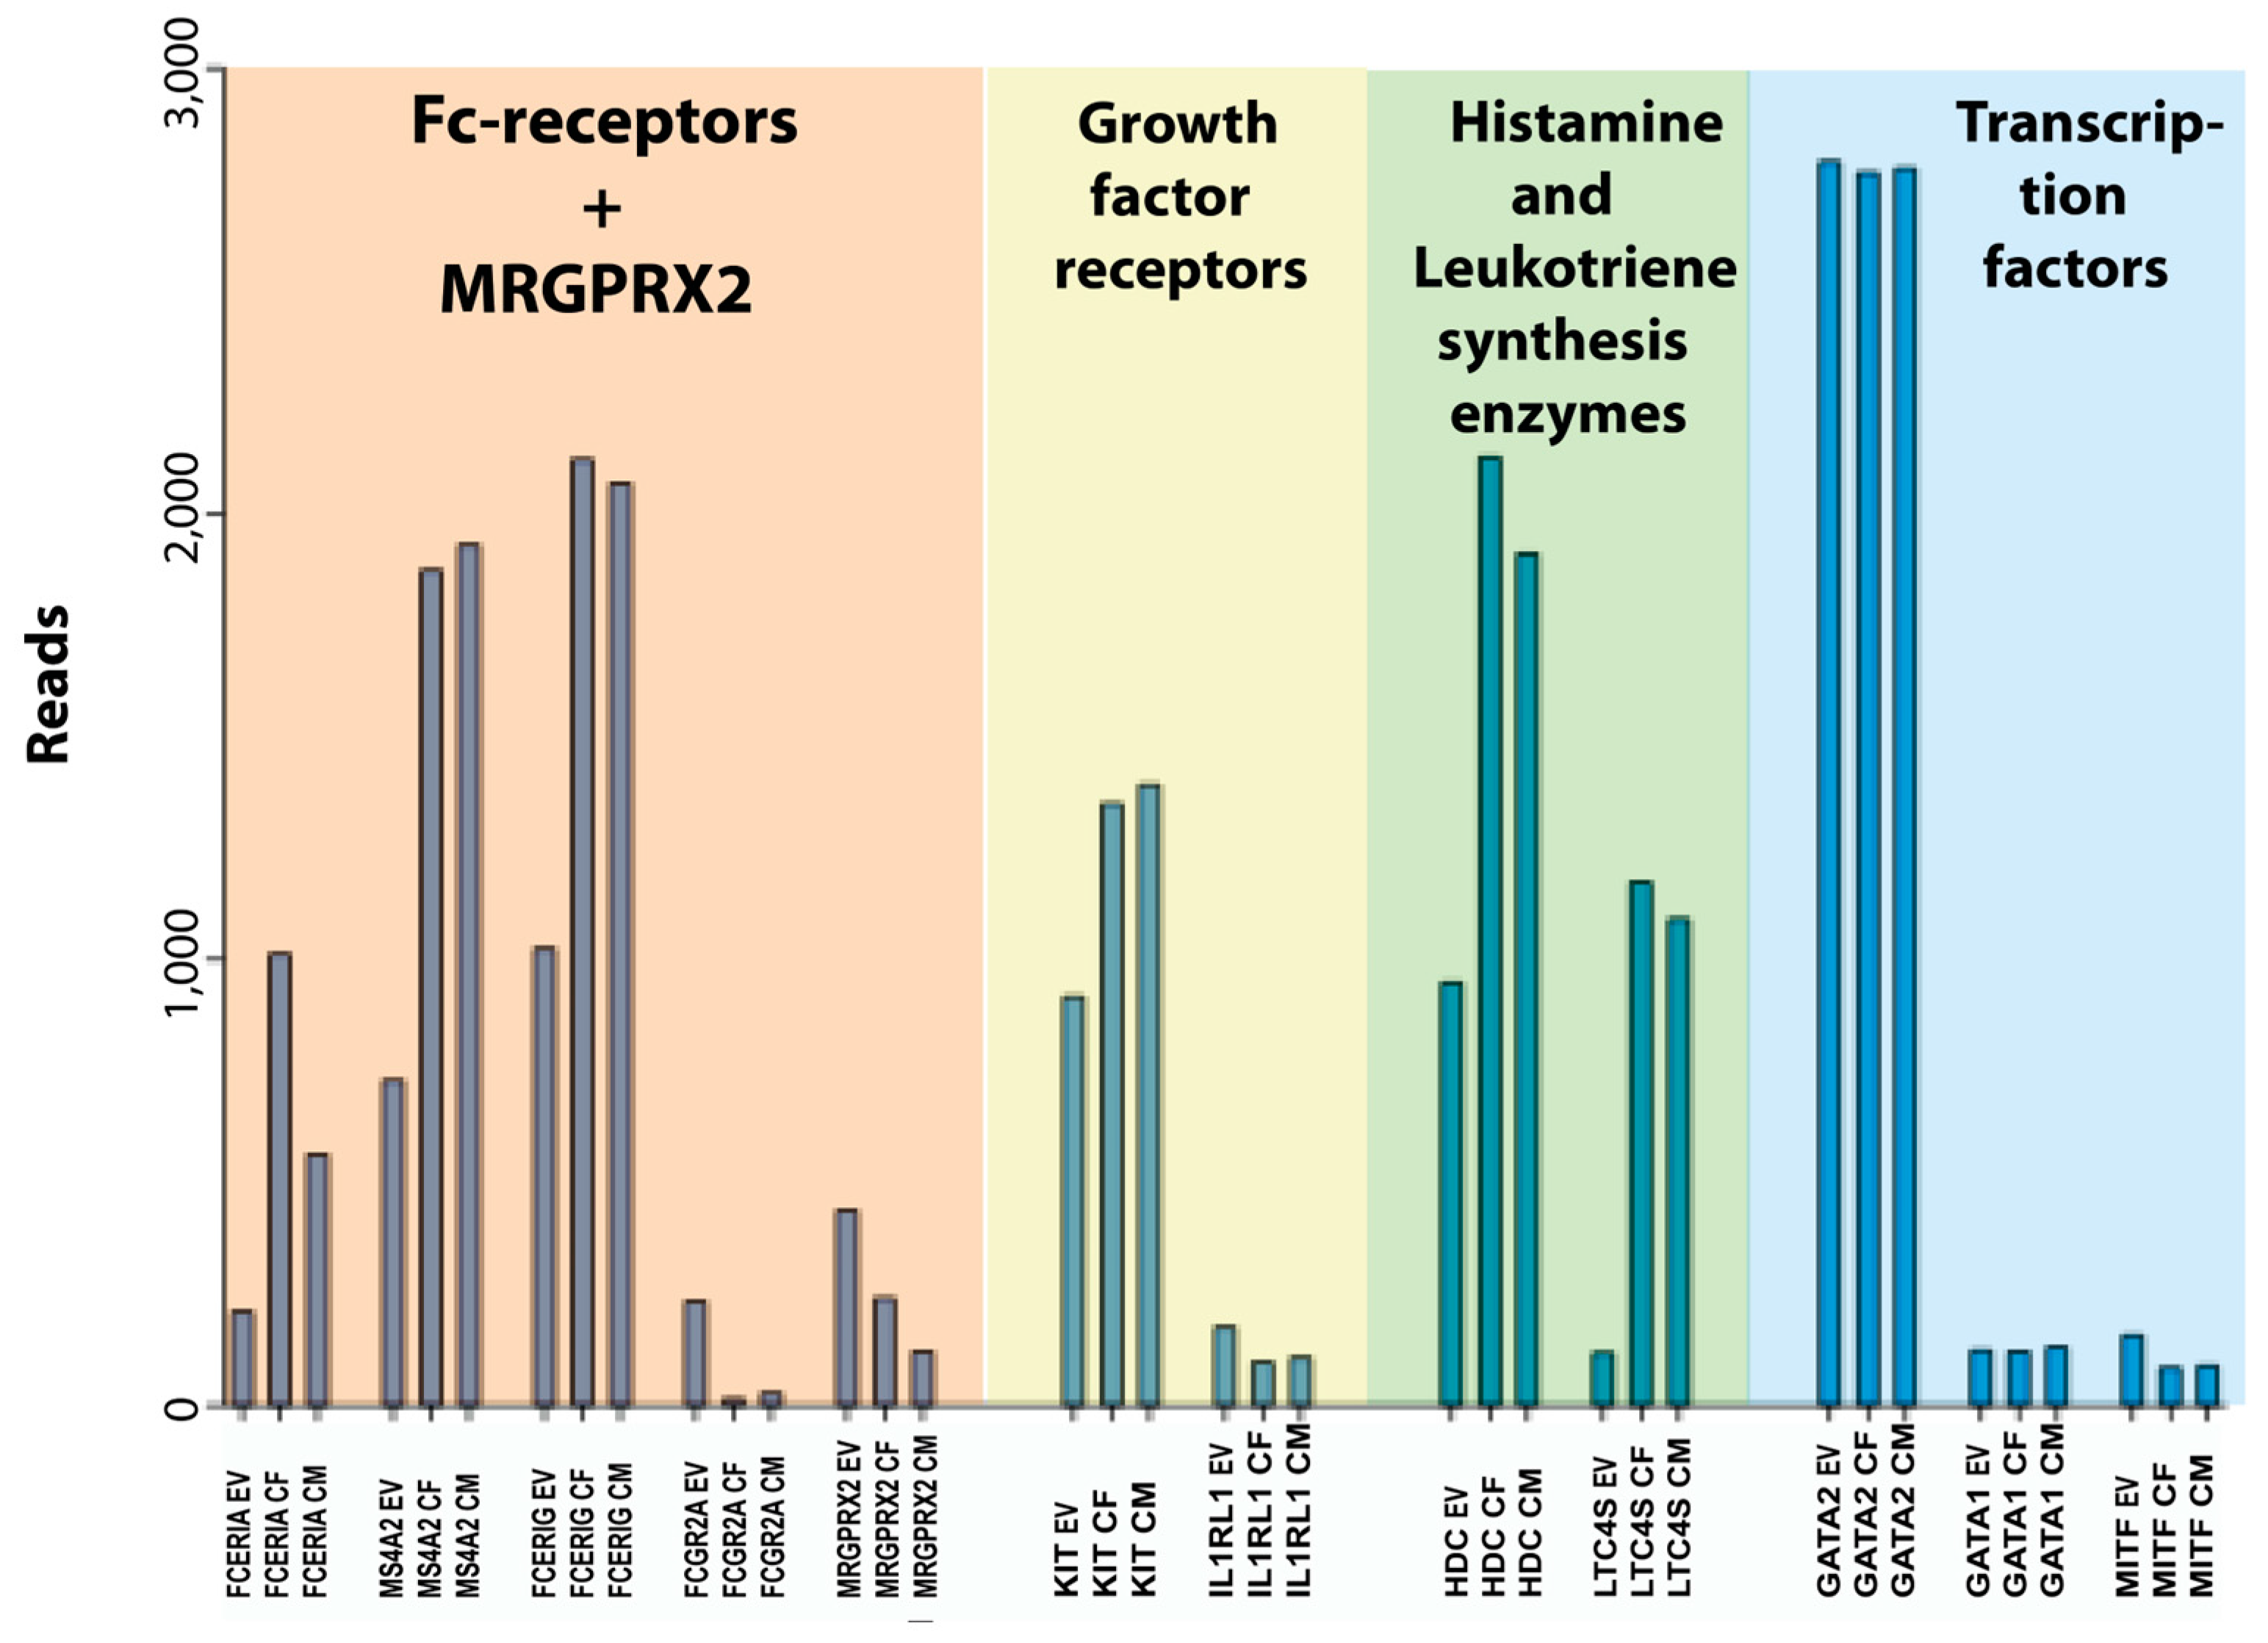
Figure 4 and Figure 5). Notably, the expression of the three genes for the high-affinity IgE receptor was increased by 2–5 times and there was an almost 10-fold reduction in the transcript level for the low-affinity IgG receptor FCGR2A. Moreover, there was an almost 10-fold upregulation of the leukotriene synthesis enzyme, leukotriene C4 synthase (LTC4S) (Figure 5). The demonstrated upregulation of high-affinity IgE receptor subunits and the leukotriene synthesis enzymes harmonizes with previous studies, and it is most likely explained by an induced response to the added SCF and IL-4 in the culture medium [18,38,62,69]. This also expands to IL-5 [70], GATA3 [71,72], and FCER1A [73]. There were also changes in cell adhesion molecules with a shift from integrin alpha 5 and 9 to beta 2A (Table 11). We found no or very minor changes in the enzymes involved in proteoglycan synthesis but a clear upregulation of some enzymes involved in leukotriene and prostaglandin synthesis (Table 10). In spite of these changes, the in vitro-expanded human skin MCs seem to be a very interesting model for studies of human MC biology. We can also say from this study that there are no or very minor differences between cells isolated from men or females. The only major sex-related differences we found were in the non-coding transcript XIST for X chromosome inactivation, which was found essentially only in the two female samples, and in the male-specific gene RPS4Y1, which is expressed from the Y chromosome (Table 3). XIST acts to cover one copy of the X chromosome, rendering it inactive [74].
For future studies including the design and evaluation of novel treatment strategies based on targeting MCs, there are some findings that need to be taken into serious consideration. One example is the very limited complexity in Fc receptor expression in human skin MCs. Attempts are made to use antibodies against the inhibitory IgG receptor FCGR2B for downregulating MC activation through the high-affinity IgE receptor. The possibility of inhibiting MC activation by FCGR2B crosslinking is probably very limited in view of the almost total absence of the transcripts for this receptor both in freshly isolated and cultured skin MCs (Table 6). However, this does not exclude that FCGR2B can be induced in skin MCs under disease conditions or that FCGR2B is expressed by human MCs in other tissues. Moreover, we did not detect the expression of any of the granzymes, which is in contrast to published work. Here, we found that the levels of all five granzymes in the freshly isolated skin MCs were very low, close to zero, indicating that granzymes have no or only a very limited role in human MC biology unless cells are stimulated.
The high expression of selective IEGs and HSPs was a hallmark of ex vivo MCs, while this quality was lost in culture, as reported previously [53]. Because the high expression of IEGs was likewise detected in monocytes, basophils, neutrophils, and other cells [53], we hypothesized that this was an inherent property of fully mature leukocytes, also encompassing ex vivo MCs, to be gradually lost outside of the body. Alternatively, it could have resulted from the isolation process.
Using several strategies, we found that the first hypothesis was most likely correct accounting for most of the effect. Firstly, we showed that mimicking the steps of isolation did not lead to a general upregulation of HSPs and IEGs in cultured MCs (only to a 20-fold increase in one gene), while the expression in cultured versus ex vivo cells was >10,000-fold lower (by RT-qPCR; up to ≈1000-fold by sequencing). This is in accordance with findings in the mouse, where the exposure of peritoneal MCs to digestive enzymes led to a maximally fivefold difference in a limited number of genes [75]. Interestingly, several IEGs were found among the regulated genes in this mouse study and FOSB was third in their list, in line with what we found here for FOSB (but not for FOS). However, this moderate increase can by no means explain the differences between ex vivo and cultured MCs, but it does indicate that a slight modulation during purification can occur in a gene-dependent manner. This upregulation is most likely transient, though. In fact, FOSB was down more strongly after 1 and 2 d compared to FOS (the latter not enhanced by digestive enzymes/shaking).
Additional evidence for an inherently high expression of HSPs and IEGs in skin MCs came from the fact that expression following MC purification did not diminish as rapidly as expression induced by MC stimulation. Indeed, the levels in ex vivo MCs were still increased at 1 or even 2 d vis-à-vis cultured MCs. In contrast, when IEGs were induced by FcεRI aggregation, the levels were back to their initial values after 1 d or less.
Our data are in line with the comprehensive FANTOM5 atlas. For example, granulocytes and monocytes expressed very high levels of certain IEGs, including FOS and JUNB. Both of the HSPs uncovered as high in skin MCs were also expressed in brain regions and reproductive organs (which were not exposed to digestive enzymes). Moreover, only some HSPs were highly expressed in skin MCs, while others were not; and the same applied to IEGs. Therefore, these genes are not expressed across the board in ex vivo cells/tissues but in clearly defined, cell- and tissue-specific patterns. For example, monocytes expressed substantial FOS but only little FOSB, while FOSB reached similar levels as in skin MCs also in basophils, eosinophils, Langerhans cells, and CD8+ cells [53]. Expression of HSPA1A/B was pronounced in the newborn brain, adult reproductive tissues (breast and vagina), heart, aorta, and adipocytes (in addition to influenza-infected macrophages). It is not entirely clear why primary cells accumulate such high levels of these transcripts. However, abundant expression seems to extend to the protein level in MCs and monocytes, whereby FOS (transcript and protein) abundance in primary monocytes was particularly striking [25]. In that paper, we compared the expression in primary myelocytes with corresponding cell lines (THP-1 and HMC-1), detecting much higher levels in primary cells, while reduction was a hallmark of actively cycling cells [25]. This was confirmed herein and extended to HSPs in MCs (yet not monocytes), emphasizing that each ex vivo cell expresses a unique combination of IEGs/HSPs. Regarding FOS specifically, it is described as indispensable in monocyte differentiation, increasing during maturation [76]. We assume that FOS and other factors play similar roles in MCs in vivo where they maintain the fully differentiated state and long-term survival within the cutaneous environment. In this regard, certain IEGs, HSPs, and several TFs like KLF2 and KLF4 (all much higher in freshly extracted MCs) may all be part of the same program.
In summary, this study provides a detailed transcriptomic characterization of in vivo matured human skin MCs in comparison with their in vitro-expanded counterparts. The findings confirm and extend our understanding of the phenotype of skin MCs in their normal tissue environment. Such information is also essential for the design and evaluation of novel potential treatment strategies aimed at targeting MCs in vivo. Based on previous and current findings, in vitro-expanded human skin MCs seem to be one of the best alternatives presently available for in vitro studies of the general in vivo function of human skin MCs. However, it should be noted that the large amounts of human skin needed to obtain a sufficient number of freshly isolated MCs is still an obstacle for the wider use of this model. To fully see the potential of these cells as in vitro models of human MC biology, future studies of the activation of these cells, both freshly isolated and cultured, by IgE receptor crosslinking and by activation of the MRGPRX2 receptor are needed. Some of these experiments are currently underway in our laboratories.

Supplementary Materials

The following supporting information can be downloaded at: https://www.mdpi.com/article/10.3390/cells13010098/s1, Table S1: Transcript levels in reads from an Ampliseq analysis of freshly isolated MCs from foreskin and from purified MCs from breast skin and foreskin MCs cultured for 2-3 weeks for proteoglycans and other carbohydrate related functions. Table S2: Transcript levels in reads from an Ampliseq analysis of freshly isolated MCs from foreskin and from purified MCs from breast skin and foreskin MCs cultured for 2-3 weeks for solute carriers. Table S3: Transcript levels in reads from an Ampliseq analysis of freshly isolated MCs from foreskin and from purified MCs from breast skin and foreskin MCs cultured for 2-3 weeks for calcium, sodium and potassium channels-transporters and other cell surface proteins. Table S4: Transcript levels in reads from an Ampliseq analysis of freshly isolated MCs from foreskin and from purified MCs from breast skin and foreskin MCs cultured for 2-3 weeks for Siglecs. Table S5: Transcript levels in reads from an Ampliseq analysis of freshly isolated MCs from foreskin and from purified MCs from breast skin and foreskin MCs cultured for 2-3 weeks for olfactory and other receptors. Table S6: Transcript levels in reads from an Ampliseq analysis of freshly isolated MCs from foreskin and from purified MCs from breast skin and foreskin MCs cultured for 2-3 weeks for cell signaling components. Table S7: Transcript levels in reads from an Ampliseq analysis of freshly isolated MCs from foreskin and from purified MCs from breast skin and foreskin MCs cultured for 2-3 weeks for other enzymes. Table S8: Transcript levels in reads from an Ampliseq analysis of freshly isolated MCs from foreskin and from purified MCs from breast skin and foreskin MCs cultured for 2-3 weeks for components of vesicle transport. Table S9: Transcript levels in reads from an Ampliseq analysis of freshly isolated MCs from foreskin and from purified MCs from breast skin and foreskin MCs cultured for 2-3 weeks for cytoskeletal, nuclear, enamel and angiogenesis related proteins. Table S10: Transcript levels in reads from an Ampliseq analysis of freshly isolated MCs from foreskin and from purified MCs from breast skin and foreskin MCs cultured for 2-3 weeks for nuclear proteins. Table S11: Transcript levels in reads from an Ampliseq analysis of freshly isolated MCs from foreskin and from purified MCs from breast skin and foreskin MCs cultured for 2-3 weeks for extracellular matrix, oncogenes, endogenous retroviral and proteins of unknown function.

Author Contributions

Conceptualization, M.B. and L.H.; Methodology, M.B. and L.H; Validation, S.R.T., K.F., M.B. and L.H.; Formal analysis, S.A., K.F., M.B. and L.H.; Investigation, S.A., S.R.T. and K.F.; Data curation, M.B. and L.H.; Writing—original draft, M.B. and L.H.; Writing—review & editing, S.A., S.R.T., K.F. and S.W.; Visualization, M.B. and L.H.; Supervision, L.H. and M.B.; Project administration, L.H. and M.B; Funding acquisition, L.H, S.W and M.B. All authors have read and agreed to the published version of the manuscript.

Funding

The study was supported by grants from Konsul Berghs Stiftelse (Srinivas Akula), Knut and Alice Wallenberg Foundation (KAW 2017-0022) (Lars Hellman and Sara Wernersson), and the Deutsche Forschungsgemeinschaft DFG (BA-3769/3, BA-3769/4) (Magda Babina).

Informed Consent Statement

Informed consent was obtained from all subjects involved in the study.

Data Availability Statement

All information of importance for the conclusions are present in the manuscript.

Conflicts of Interest

The authors declare no conflict of interest.

Abbreviations

MCs: mast cells; BMMCs, bone marrow-derived mast cells; CPA3, carboxypeptidase A3.

References

  1. Akula, S.; Paivandy, A.; Fu, Z.; Thorpe, M.; Pejler, G.; Hellman, L. Quantitative In-Depth Analysis of the Mouse Mast Cell Transcriptome Reveals Organ-Specific Mast Cell Heterogeneity. Cells 2020, 9, 211. [Google Scholar] [CrossRef] [PubMed]
  2. Schwartz, L.B.; Irani, A.M.; Roller, K.; Castells, M.C.; Schechter, N.M. Quantitation of histamine, tryptase, and chymase in dispersed human T and TC mast cells. J. Immunol. 1987, 138, 2611–2615. [Google Scholar] [CrossRef] [PubMed]
  3. Lutzelschwab, C.; Pejler, G.; Aveskogh, M.; Hellman, L. Secretory granule proteases in rat mast cells. Cloning of 10 different serine proteases and a carboxypeptidase A from various rat mast cell populations. J. Exp. Med. 1997, 185, 13–29. [Google Scholar] [CrossRef] [PubMed]
  4. Tatemoto, K.; Nozaki, Y.; Tsuda, R.; Konno, S.; Tomura, K.; Furuno, M.; Ogasawara, H.; Edamura, K.; Takagi, H.; Iwamura, H.; et al. Immunoglobulin E-independent activation of mast cell is mediated by Mrg receptors. Biochem. Biophys. Res. Commun. 2006, 349, 1322–1328. [Google Scholar] [CrossRef] [PubMed]
  5. Motakis, E.; Guhl, S.; Ishizu, Y.; Itoh, M.; Kawaji, H.; de Hoon, M.; Lassmann, T.; Carninci, P.; Hayashizaki, Y.; Zuberbier, T.; et al. Redefinition of the human mast cell transcriptome by deep-CAGE sequencing. Blood 2014, 123, e58–e67. [Google Scholar] [CrossRef] [PubMed]
  6. McNeil, B.D.; Pundir, P.; Meeker, S.; Han, L.; Undem, B.J.; Kulka, M.; Dong, X. Identification of a mast-cell-specific receptor crucial for pseudo-allergic drug reactions. Nature 2015, 519, 237–241. [Google Scholar] [CrossRef] [PubMed]
  7. Valent, P.; Spanblochl, E.; Sperr, W.R.; Sillaber, C.; Zsebo, K.M.; Agis, H.; Strobl, H.; Geissler, K.; Bettelheim, P.; Lechner, K. Induction of differentiation of human mast cells from bone marrow and peripheral blood mononuclear cells by recombinant human stem cell factor/kit-ligand in long-term culture. Blood 1992, 80, 2237–2245. [Google Scholar] [CrossRef]
  8. Irani, A.M.; Nilsson, G.; Miettinen, U.; Craig, S.S.; Ashman, L.K.; Ishizaka, T.; Zsebo, K.M.; Schwartz, L.B. Recombinant human stem cell factor stimulates differentiation of mast cells from dispersed human fetal liver cells. Blood 1992, 80, 3009–3021. [Google Scholar] [CrossRef]
  9. Mitsui, H.; Furitsu, T.; Dvorak, A.M.; Irani, A.M.; Schwartz, L.B.; Inagakis, N.; Takei, M.; Ishizaka, K.; Zsebo, K.M.; Gillis, S.; et al. Development of human mast cells from umbilical cord blood cells by recombinant human and murine c-kit ligand. Proc. Natl. Acad. Sci. USA 1993, 90, 735–739. [Google Scholar] [CrossRef]
  10. Franke, K.; Kirchner, M.; Mertins, P.; Zuberbier, T.; Babina, M. The SCF/KIT axis in human mast cells: Capicua acts as potent KIT repressor and ERK predominates PI3K. Allergy 2022, 77, 3337–3349. [Google Scholar] [CrossRef]
  11. Okayama, Y.; Kawakami, T. Development, migration, and survival of mast cells. Immunol. Res. 2006, 34, 97–115. [Google Scholar] [CrossRef] [PubMed]
  12. Cruse, G.; Metcalfe, D.D.; Olivera, A. Functional deregulation of KIT: Link to mast cell proliferative diseases and other neoplasms. Immunol. Allergy Clin. N. Am. 2014, 34, 219–237. [Google Scholar] [CrossRef] [PubMed]
  13. Toru, H.; Eguchi, M.; Matsumoto, R.; Yanagida, M.; Yata, J.; Nakahata, T. Interleukin-4 promotes the development of tryptase and chymase double-positive human mast cells accompanied by cell maturation. Blood 1998, 91, 187–195. [Google Scholar] [CrossRef] [PubMed]
  14. Bischoff, S.C.; Sellge, G.; Lorentz, A.; Sebald, W.; Raab, R.; Manns, M.P. IL-4 enhances proliferation and mediator release in mature human mast cells. Proc. Natl. Acad. Sci. USA 1999, 96, 8080–8085. [Google Scholar] [CrossRef]
  15. Thienemann, F.; Henz, B.M.; Babina, M. Regulation of mast cell characteristics by cytokines: Divergent effects of interleukin-4 on immature mast cell lines versus mature human skin mast cells. Arch. Dermatol. Res. 2004, 296, 134–138. [Google Scholar] [CrossRef]
  16. Kulka, M.; Metcalfe, D.D. High-resolution tracking of cell division demonstrates differential effects of TH1 and TH2 cytokines on SCF-dependent human mast cell production in vitro: Correlation with apoptosis and Kit expression. Blood 2005, 105, 592–599. [Google Scholar] [CrossRef]
  17. Guhl, S.; Artuc, M.; Neou, A.; Babina, M.; Zuberbier, T. Long-term cultured human skin mast cells are suitable for pharmacological studies of anti-allergic drugs due to high responsiveness to FcepsilonRI cross-linking. Biosci. Biotechnol. Biochem. 2011, 75, 382–384. [Google Scholar] [CrossRef]
  18. Babina, M.; Guhl, S.; Artuc, M.; Zuberbier, T. IL-4 and human skin mast cells revisited: Reinforcement of a pro-allergic phenotype upon prolonged exposure. Arch. Dermatol. Res. 2016, 308, 665–670. [Google Scholar] [CrossRef]
  19. Allakhverdi, Z.; Smith, D.E.; Comeau, M.R.; Delespesse, G. Cutting edge: The ST2 ligand IL-33 potently activates and drives maturation of human mast cells. J. Immunol. 2007, 179, 2051–2054. [Google Scholar] [CrossRef]
  20. Iikura, M.; Suto, H.; Kajiwara, N.; Oboki, K.; Ohno, T.; Okayama, Y.; Saito, H.; Galli, S.J.; Nakae, S. IL-33 can promote survival, adhesion and cytokine production in human mast cells. Lab. Investig. 2007, 87, 971–978. [Google Scholar] [CrossRef]
  21. Babina, M.; Wang, Z.; Franke, K.; Guhl, S.; Artuc, M.; Zuberbier, T. Yin-Yang of IL-33 in Human Skin Mast Cells: Reduced Degranulation, but Augmented Histamine Synthesis through p38 Activation. J. Investig. Dermatol. 2019, 139, 1516–1525.e3. [Google Scholar] [CrossRef] [PubMed]
  22. Wang, Z.; Guhl, S.; Franke, K.; Artuc, M.; Zuberbier, T.; Babina, M. IL-33 and MRGPRX2-Triggered Activation of Human Skin Mast Cells-Elimination of Receptor Expression on Chronic Exposure, but Reinforced Degranulation on Acute Priming. Cells 2019, 8, 341. [Google Scholar] [CrossRef] [PubMed]
  23. Kitamura, Y.; Morii, E.; Jippo, T.; Ito, A. Effect of MITF on mast cell differentiation. Mol. Immunol. 2002, 38, 1173–1176. [Google Scholar] [CrossRef] [PubMed]
  24. Ohneda, K.; Ohmori, S.; Yamamoto, M. Mouse Tryptase Gene Expression is Coordinately Regulated by GATA1 and GATA2 in Bone Marrow-Derived Mast Cells. Int. J. Mol. Sci. 2019, 20, 4603. [Google Scholar] [CrossRef] [PubMed]
  25. Babina, M.; Schulke, Y.; Kirchhof, L.; Guhl, S.; Franke, R.; Bohm, S.; Zuberbier, T.; Henz, B.M.; Gombart, A.F. The transcription factor profile of human mast cells in comparison with monocytes and granulocytes. Cell. Mol. Life Sci. 2005, 62, 214–226. [Google Scholar] [CrossRef]
  26. Akula, S.; Paivandy, A.; Fu, Z.; Thorpe, M.; Pejler, G.; Hellman, L. How Relevant Are Bone Marrow-Derived Mast Cells (BMMCs) as Models for Tissue Mast Cells? A Comparative Transcriptome Analysis of BMMCs and Peritoneal Mast Cells. Cells 2020, 9, 2118. [Google Scholar] [CrossRef] [PubMed]
  27. Li, Z.; Liu, S.; Xu, J.; Zhang, X.; Han, D.; Liu, J.; Xia, M.; Yi, L.; Shen, Q.; Xu, S.; et al. Adult Connective Tissue-Resident Mast Cells Originate from Late Erythro-Myeloid Progenitors. Immunity 2018, 49, 640–653.e5. [Google Scholar] [CrossRef]
  28. Gentek, R.; Ghigo, C.; Hoeffel, G.; Bulle, M.J.; Msallam, R.; Gautier, G.; Launay, P.; Chen, J.; Ginhoux, F.; Bajenoff, M. Hemogenic Endothelial Fate Mapping Reveals Dual Developmental Origin of Mast Cells. Immunity 2018, 48, 1160–1171.e5. [Google Scholar] [CrossRef]
  29. Hallgren, J.; Gurish, M.F. Mast cell progenitor trafficking and maturation. Adv. Exp. Med. Biol. 2011, 716, 14–28. [Google Scholar] [CrossRef]
  30. Sieweke, M.H.; Allen, J.E. Beyond stem cells: Self-renewal of differentiated macrophages. Science 2013, 342, 1242974. [Google Scholar] [CrossRef]
  31. Amit, I.; Winter, D.R.; Jung, S. The role of the local environment and epigenetics in shaping macrophage identity and their effect on tissue homeostasis. Nat. Immunol. 2016, 17, 18–25. [Google Scholar] [CrossRef] [PubMed]
  32. Perdiguero, E.G.; Klapproth, K.; Schulz, C.; Busch, K.; de Bruijn, M.; Rodewald, H.R.; Geissmann, F. The Origin of Tissue-Resident Macrophages: When an Erythro-myeloid Progenitor Is an Erythro-myeloid Progenitor. Immunity 2015, 43, 1023–1024. [Google Scholar] [CrossRef] [PubMed]
  33. Hoeffel, G.; Chen, J.; Lavin, Y.; Low, D.; Almeida, F.F.; See, P.; Beaudin, A.E.; Lum, J.; Low, I.; Forsberg, E.C.; et al. C-Myb(+) erythro-myeloid progenitor-derived fetal monocytes give rise to adult tissue-resident macrophages. Immunity 2015, 42, 665–678. [Google Scholar] [CrossRef] [PubMed]
  34. Ginhoux, F.; Greter, M.; Leboeuf, M.; Nandi, S.; See, P.; Gokhan, S.; Mehler, M.F.; Conway, S.J.; Ng, L.G.; Stanley, E.R.; et al. Fate mapping analysis reveals that adult microglia derive from primitive macrophages. Science 2010, 330, 841–845. [Google Scholar] [CrossRef] [PubMed]
  35. Kierdorf, K.; Erny, D.; Goldmann, T.; Sander, V.; Schulz, C.; Perdiguero, E.G.; Wieghofer, P.; Heinrich, A.; Riemke, P.; Holscher, C.; et al. Microglia emerge from erythromyeloid precursors via Pu.1- and Irf8-dependent pathways. Nat. Neurosci. 2013, 16, 273–280. [Google Scholar] [CrossRef] [PubMed]
  36. Bain, C.C.; Bravo-Blas, A.; Scott, C.L.; Perdiguero, E.G.; Geissmann, F.; Henri, S.; Malissen, B.; Osborne, L.C.; Artis, D.; Mowat, A.M. Constant replenishment from circulating monocytes maintains the macrophage pool in the intestine of adult mice. Nat. Immunol. 2014, 15, 929–937. [Google Scholar] [CrossRef] [PubMed]
  37. Babina, M.; Guhl, S.; Starke, A.; Kirchhof, L.; Zuberbier, T.; Henz, B.M. Comparative cytokine profile of human skin mast cells from two compartments--strong resemblance with monocytes at baseline but induction of IL-5 by IL-4 priming. J. Leukoc. Biol. 2004, 75, 244–252. [Google Scholar] [CrossRef] [PubMed]
  38. Guhl, S.; Neou, A.; Artuc, M.; Zuberbier, T.; Babina, M. Skin mast cells develop non-synchronized changes in typical lineage characteristics upon culture. Exp. Dermatol. 2014, 23, 933–935. [Google Scholar] [CrossRef]
  39. Franke, K.; Bal, G.; Li, Z.; Zuberbier, T.; Babina, M. CREB Is Activated by the SCF/KIT Axis in a Partially ERK-Dependent Manner and Orchestrates Survival and the Induction of Immediate Early Genes in Human Skin Mast Cells. Int. J. Mol. Sci. 2023, 24, 4135. [Google Scholar] [CrossRef]
  40. Franke, K.; Bal, G.; Li, Z.; Zuberbier, T.; Babina, M. Clorfl86/RHEX Is a Negative Regulator of SCF/KIT Signaling in Human Skin Mast Cells. Cells 2023, 12, 1306. [Google Scholar] [CrossRef]
  41. Inoue, K.; Kohda, T.; Sugimoto, M.; Sado, T.; Ogonuki, N.; Matoba, S.; Shiura, H.; Ikeda, R.; Mochida, K.; Fujii, T.; et al. Impeding Xist expression from the active X chromosome improves mouse somatic cell nuclear transfer. Science 2010, 330, 496–499. [Google Scholar] [CrossRef] [PubMed]
  42. Korkmaz, B.; Lesner, A.; Letast, S.; Mahdi, Y.K.; Jourdan, M.L.; Dallet-Choisy, S.; Marchand-Adam, S.; Kellenberger, C.; Viaud-Massuard, M.C.; Jenne, D.E.; et al. Neutrophil proteinase 3 and dipeptidyl peptidase I (cathepsin C) as pharmacological targets in granulomatosis with polyangiitis (Wegener granulomatosis). Semin. Immunopathol. 2013, 35, 411–421. [Google Scholar] [CrossRef] [PubMed]
  43. Brown, J.; Matutes, E.; Singleton, A.; Price, C.; Molgaard, H.; Buttle, D.; Enver, T. Lymphopain, a cytotoxic T and natural killer cell-associated cysteine proteinase. Leukemia 1998, 12, 1771–1781. [Google Scholar] [CrossRef] [PubMed]
  44. Hazzan, T.; Eberle, J.; Worm, M.; Babina, M. Thymic Stromal Lymphopoietin Interferes with the Apoptosis of Human Skin Mast Cells by a Dual Strategy Involving STAT5/Mcl-1 and JNK/Bcl-xL. Cells 2019, 8, 829. [Google Scholar] [CrossRef] [PubMed]
  45. Paivandy, A.; Akula, S.; Lara, S.; Fu, Z.; Olsson, A.K.; Kleinau, S.; Pejler, G.; Hellman, L. Quantitative In-Depth Transcriptome Analysis Implicates Peritoneal Macrophages as Important Players in the Complement and Coagulation Systems. Int. J. Mol. Sci. 2022, 23, 1185. [Google Scholar] [CrossRef] [PubMed]
  46. Wallner, B.P.; Mattaliano, R.J.; Hession, C.; Cate, R.L.; Tizard, R.; Sinclair, L.K.; Foeller, C.; Chow, E.P.; Browing, J.L.; Ramachandran, K.L.; et al. Cloning and expression of human lipocortin, a phospholipase A2 inhibitor with potential anti-inflammatory activity. Nature 1986, 320, 77–81. [Google Scholar] [CrossRef] [PubMed]
  47. Kuch, E.M.; Vellaramkalayil, R.; Zhang, I.; Lehnen, D.; Brugger, B.; Sreemmel, W.; Ehehalt, R.; Poppelreuther, M.; Fullekrug, J. Differentially localized acyl-CoA synthetase 4 isoenzymes mediate the metabolic channeling of fatty acids towards phosphatidylinositol. Biochim. Et Biophys. Acta 2014, 1841, 227–239. [Google Scholar] [CrossRef] [PubMed]
  48. Morimoto, K.; Shirata, N.; Taketomi, Y.; Tsuchiya, S.; Segi-Nishida, E.; Inazumi, T.; Kabashima, K.; Tanaka, S.; Murakami, M.; Narumiya, S.; et al. Prostaglandin E2-EP3 signaling induces inflammatory swelling by mast cell activation. J. Immunol. 2014, 192, 1130–1137. [Google Scholar] [CrossRef]
  49. Babina, M.; Franke, K.; Bal, G. How "Neuronal" Are Human Skin Mast Cells? Int. J. Mol. Sci. 2022, 23, 871. [Google Scholar] [CrossRef]
  50. Shelburne, C.P.; McCoy, M.E.; Piekorz, R.; Sexl, V.; Roh, K.H.; Jacobs-Helber, S.M.; Gillespie, S.R.; Bailey, D.P.; Mirmonsef, P.; Mann, M.N.; et al. Stat5 expression is critical for mast cell development and survival. Blood 2003, 102, 1290–1297. [Google Scholar] [CrossRef]
  51. Li, Y.; Qi, X.; Liu, B.; Huang, H. The STAT5-GATA2 pathway is critical in basophil and mast cell differentiation and maintenance. J. Immunol. 2015, 194, 4328–4338. [Google Scholar] [CrossRef] [PubMed]
  52. Pearson, R.; Fleetwood, J.; Eaton, S.; Crossley, M.; Bao, S. Kruppel-like transcription factors: A functional family. Int. J. Biochem. Cell Biol. 2008, 40, 1996–2001. [Google Scholar] [CrossRef] [PubMed]
  53. Noguchi, S.; Arakawa, T.; Fukuda, S.; Furuno, M.; Hasegawa, A.; Hori, F.; Ishikawa-Kato, S.; Kaida, K.; Kaiho, A.; Kanamori-Katayama, M.; et al. FANTOM5 CAGE profiles of human and mouse samples. Sci. Data 2017, 4, 170112. [Google Scholar] [CrossRef] [PubMed]
  54. Chen, X.; Johns, D.C.; Geiman, D.E.; Marban, E.; Dang, D.T.; Hamlin, G.; Sun, R.; Yang, V.W. Kruppel-like factor 4 (gut-enriched Kruppel-like factor) inhibits cell proliferation by blocking G1/S progression of the cell cycle. J. Biol. Chem. 2001, 276, 30423–30428. [Google Scholar] [CrossRef]
  55. Carballo, E.; Lai, W.S.; Blackshear, P.J. Feedback inhibition of macrophage tumor necrosis factor-alpha production by tristetraprolin. Science 1998, 281, 1001–1005. [Google Scholar] [CrossRef]
  56. Ayyar, V.S.; Almon, R.R.; Jusko, W.J.; DuBois, D.C. Quantitative tissue-specific dynamics of in vivo GILZ mRNA expression and regulation by endogenous and exogenous glucocorticoids. Physiol. Rep. 2015, 3, e12382. [Google Scholar] [CrossRef]
  57. Bullwinkel, J.; Baron-Luhr, B.; Ludemann, A.; Wohlenberg, C.; Gerdes, J.; Scholzen, T. Ki-67 protein is associated with ribosomal RNA transcription in quiescent and proliferating cells. J. Cell. Physiol. 2006, 206, 624–635. [Google Scholar] [CrossRef]
  58. Corren, J.; Lemanske, R.F.; Hanania, N.A.; Korenblat, P.E.; Parsey, M.V.; Arron, J.R.; Harris, J.M.; Scheerens, H.; Wu, L.C.; Su, Z.; et al. Lebrikizumab treatment in adults with asthma. N. Engl. J. Med. 2011, 365, 1088–1098. [Google Scholar] [CrossRef]
  59. Bootcov, M.R.; Bauskin, A.R.; Valenzuela, S.M.; Moore, A.G.; Bansal, M.; He, X.Y.; Zhang, H.P.; Donnellan, M.; Mahler, S.; Pryor, K.; et al. MIC-1, a novel macrophage inhibitory cytokine, is a divergent member of the TGF-beta superfamily. Proc. Natl. Acad. Sci. USA 1997, 94, 11514–11519. [Google Scholar] [CrossRef]
  60. Lee, E.G.; Boone, D.L.; Chai, S.; Libby, S.L.; Chien, M.; Lodolce, J.P.; Ma, A. Failure to regulate TNF-induced NF-kappaB and cell death responses in A20-deficient mice. Science 2000, 289, 2350–2354. [Google Scholar] [CrossRef]
  61. Iuliano, C.; Absmaier-Kijak, M.; Sinnberg, T.; Hoffard, N.; Hils, M.; Koberle, M.; Wolbing, F.; Shumilina, E.; Heise, N.; Fehrenbacher, B.; et al. Fetal Tissue-Derived Mast Cells (MC) as Experimental Surrogate for In Vivo Connective Tissue MC. Cells 2022, 11, 928. [Google Scholar] [CrossRef] [PubMed]
  62. Babina, M.; Wang, Z.; Artuc, M.; Guhl, S.; Zuberbier, T. MRGPRX2 is negatively targeted by SCF and IL-4 to diminish pseudo-allergic stimulation of skin mast cells in culture. Exp. Dermatol. 2018, 27, 1298–1303. [Google Scholar] [CrossRef] [PubMed]
  63. Kaltenbach, L.; Martzloff, P.; Bambach, S.K.; Aizarani, N.; Mihlan, M.; Gavrilov, A.; Glaser, K.M.; Stecher, M.; Thunauer, R.; Thiriot, A.; et al. Slow integrin-dependent migration organizes networks of tissue-resident mast cells. Nat. Immunol. 2023, 24, 915–924. [Google Scholar] [CrossRef] [PubMed]
  64. Alimohammadi, S.; Masuda-Kuroki, K.; Szollosi, A.G.; Di Nardo, A. Factors Influencing Marker Expressions of Cultured Human Cord Blood-Derived Mast Cells. Int. J. Mol. Sci. 2023, 24, 14891. [Google Scholar] [CrossRef] [PubMed]
  65. Leist, M.; Sunder, C.A.; Drube, S.; Zimmermann, C.; Geldmacher, A.; Metz, M.; Dudeck, A.; Maurer, M. Membrane-bound stem cell factor is the major but not only driver of fibroblast-induced murine skin mast cell differentiation. Exp. Dermatol. 2017, 26, 255–262. [Google Scholar] [CrossRef] [PubMed]
  66. Pincha, N.; Hajam, E.Y.; Badarinath, K.; Batta, S.P.R.; Masudi, T.; Dey, R.; Andreasen, P.; Kawakami, T.; Samuel, R.; George, R.; et al. PAI1 mediates fibroblast-mast cell interactions in skin fibrosis. J. Clin. Investig. 2018, 128, 1807–1819. [Google Scholar] [CrossRef] [PubMed]
  67. Trautmann, A.; Feuerstein, B.; Ernst, N.; Brocker, E.B.; Klein, C.E. Heterotypic cell-cell adhesion of human mast cells to fibroblasts. Arch. Dermatol. Res. 1997, 289, 194–203. [Google Scholar] [CrossRef]
  68. Babina, M.; Guhl, S.; Artuc, M.; Zuberbier, T. Skin mast cell phenotypes between two highly divergent cohorts—More pronounced variability within than between groups. Exp. Dermatol. 2017, 26, 446–449. [Google Scholar] [CrossRef]
  69. Hsieh, F.H.; Lam, B.K.; Penrose, J.F.; Austen, K.F.; Boyce, J.A. T helper cell type 2 cytokines coordinately regulate immunoglobulin E-dependent cysteinyl leukotriene production by human cord blood-derived mast cells: Profound induction of leukotriene C(4) synthase expression by interleukin 4. J. Exp. Med. 2001, 193, 123–133. [Google Scholar] [CrossRef]
  70. Zhang, D.H.; Yang, L.; Ray, A. Differential responsiveness of the IL-5 and IL-4 genes to transcription factor GATA-3. J. Immunol. 1998, 161, 3817–3821. [Google Scholar] [CrossRef]
  71. Seki, N.; Miyazaki, M.; Suzuki, W.; Hayashi, K.; Arima, K.; Myburgh, E.; Izuhara, K.; Brombacher, F.; Kubo, M. IL-4-induced GATA-3 expression is a time-restricted instruction switch for Th2 cell differentiation. J. Immunol. 2004, 172, 6158–6166. [Google Scholar] [CrossRef] [PubMed]
  72. Onderdijk, A.J.; Baerveldt, E.M.; Kurek, D.; Kant, M.; Florencia, E.F.; Debets, R.; Prens, E.P. IL-4 Downregulates IL-1beta and IL-6 and Induces GATA3 in Psoriatic Epidermal Cells: Route of Action of a Th2 Cytokine. J. Immunol. 2015, 195, 1744–1752. [Google Scholar] [CrossRef] [PubMed]
  73. Toru, H.; Ra, C.; Nonoyama, S.; Suzuki, K.; Yata, J.; Nakahata, T. Induction of the high-affinity IgE receptor (Fc epsilon RI) on human mast cells by IL-4. Int. Immunol. 1996, 8, 1367–1373. [Google Scholar] [CrossRef] [PubMed]
  74. Ng, K.; Pullirsch, D.; Leeb, M.; Wutz, A. Xist and the order of silencing. EMBO Rep. 2007, 8, 34–39. [Google Scholar] [CrossRef]
  75. Dwyer, D.F.; Barrett, N.A.; Austen, K.F.; Immunological Genome Project, C. Expression profiling of constitutive mast cells reveals a unique identity within the immune system. Nat. Immunol. 2016, 17, 878–887. [Google Scholar] [CrossRef]
  76. Friedman, A.D. Transcriptional regulation of granulocyte and monocyte development. Oncogene 2002, 21, 3377–3390. [Google Scholar] [CrossRef]
Figure 1. A schematic presentation of the experiment.
Cells 13 00098 g001
Figure 2. Expression of IEGs/HSPs quickly returns to baseline after FcεRI stimulation but not after purification of skin MCs. (A) Cultured skin-derived MCs were stimulated by FcεRI aggregation for the indicated times and expression of the respective genes was quantified by RT-qPCR and normalized to unstimulated control. N ≥ 7. (B) Skin MCs were kept in standard medium, 10%FCS, and no growth factors at 37 °C for 1 and 2 d following isolation, as described in methods. Cultured MCs were used after around 3 weeks in culture. Gene expression was studied as in (A). n ≥ 4. Normalized against 4 HKGs. The p-values are given directly in the figure.
Cells 13 00098 g002
Figure 3. Conditions applied during isolation do not (efficiently) induce expression of IEGs/HSPs. Cultured skin MCs were exposed to digestive enzymes with/without additional shaking or kept in normal culture conditions (“cultured”). Expression of the respective genes in cultured skin MCs (exposed/non-exposed) and in freshly isolated skin MCs (ex vivo) was quantified by RT-qPCR and normalized to the control (black column). N = 2.
Cells 13 00098 g003
Figure 4. A summary of the major granule proteases of this transcriptional analysis of human skin MCs. EV stands for ex vivo or freshly isolated cells, CF for cultured female cells, and CM for cultured male cells.
Cells 13 00098 g004
Figure 5. A summary of a few key genes of this transcriptional analysis of human skin MCs including Fc and MRGPRX2 receptors, growth factor receptors, histamine and leukotriene synthesis enzymes and transcription factors. EV stands for ex vivo or freshly isolated cells, CF for cultured female cells, and CM for cultured male cells.
Cells 13 00098 g005
Table 1. Transcript levels in reads from an Ampliseq analysis of purified mouse peritoneal MCs and of a 3-week culture of mouse BMMCs.
GeneMouse Peritoneal MCsMouse BMMCs
Proteases
Cma1 (Mcpt5)45,22115,683
Mcpt4 (mMCP-4)31,2907
Tpsb2 (Mcpt6)67,7733119
Cpa3 (CPA-3)45,60422,478
Tpsab1 (Mcpt7)9654
Mcpt9 (mMCP-9)00
CtsG (CTS-G)51218
Mcpt8 (mMCP-8)1246
Gzm B236386
Gzm C0.80.1
Gzm D0.40
Gzm E00.1
Receptors
FcεRI alpha2521631
Ms4a2 (IgE rec. beta)12974288
c-kit720833
Mrgprb28998
Transcription factors
Gata174296
Gata222725205
Gata32714
Mitf370144
Table 2. Primer sequences for primers used in the quantitative PCR analysis described above.
GeneForward Primer (5′->3′)Reverse Primer (5′->3′)
FOSAGTGACCGTGGGAATGAAGTGCTTCAACAGACTACGAG
FOSBCTACGGAGCCTGCACTTTCAAGCGAGTCCTCAAAGTACGC
HSPA1AAGCTGGAGCAGGTGTGTAACCAGCAATCTTGGAAAGGCCC
HSPA1BTGTAACCCCATCATCAGCGGTCCCAACAGTCCACCTCAAAG
ACTBCTGGAACGGTGAAGGTGACAAAGGGACTTCCTGTAACAATGCA
GAPDHACATCGCTCAGACACCATGTGTAGTTGAGGTCAATGAAGGG
HPRTGCCTCCCATCTCCTTCATCACCTGGCGTCGTGATTAGTGA
PPIBAAGATGTCCCTGTGCCCTACATGGCAAGCATGTGGTGTTT
Table 3. Transcript levels in reads from an Ampliseq analysis of freshly isolated MCs from foreskin and from purified MCs from breast skin and foreskin cultured for 2–3 weeks for two transcripts that are highly gender related.
Freshly Isolated CellsCells Cultured for 2–3 Weeks
Foreskin (Male)Foreskin (Male)Breast Skin (Female)
XIST154000389311
RPS4Y18173531931720.10.2
Table 4. Transcript levels in reads from an Ampliseq analysis of freshly isolated MCs from foreskin and from purified MCs from breast skin and foreskin cultured for 2–3 weeks for the major granule proteases and a few additional lysosomal, tissue, and general proteases.
Freshly Isolated CellsCells Cultured for 2–3 Weeks
Foreskin (Male)Foreskin (Male)Breast Skin (Female)
Proteases
CATG9445619412,15618,84713,47016,28521,210
TPSB2709661777970679115,60437715143
CPA34403308649766134481257176465
CMA117131359295895465511771160
TPSD1418671457862196156
TPSG1864910739537388
CPM140811948528791
GZMA000.10.30.50.12
GZMK0000000
GZMB0.40.201120.60.2
GZMH0000000.2
GZMM0000000
CTSC23283674838372
CTSW321212175184294177
CTSD2356172328063513431833545192
CTSB241315334499608495517
CTSL1481585529272228
PLAT (tPA)136288137317158164218
PLAU (uPA)1023810018121620
ADAMTS780585641456853
ADAMTS1421398159108141
ADAM12964144144158146
PRSS1238599810334
CASP38874119168217294223
BACE21034939399425473434
Table 5. Transcript levels in reads from an Ampliseq analysis of freshly isolated MCs from foreskin and from purified MCs from breast skin and foreskin cultured for 2–3 weeks for a number of protease inhibitors.
Freshly Isolated CellsCells Cultured for 2–3 Weeks
Foreskin (Male)Foreskin (Male)Breast Skin (Female)
Protease inhibitors
TIMP1407357502692630569982
TIMP31270995939414529434521
CST3564586395258219219337
CST711191444184827601210
LXN271324916171613
SERPINB13331562221652156916691663
SERPINE120033911590.762
SERPINH127035247017101113
Table 6. Transcript levels in reads from an Ampliseq analysis of freshly isolated MCs from foreskin and from purified MCs from breast skin and foreskin cultured for 2–3 weeks for Fc and other cell surface receptors.
Freshly Isolated CellsCells Cultured for 2–3 Weeks
Foreskin (Male)Foreskin (Male)Breast Skin (Female)
Fc receptors
FCER1A (α)2141272074946339871041
MS4A2 (β)8174416422129173219661782
FCER1G (γ)90884811402064207418522391
FCER20000000
FCGR1A0000.3000
FCGR2A1421993253620236
FCGR2B20.40.2000.10
FCGR2C211000.40
FCGR3A0.3000000
FCGR3B0000000
MILR1572968162145135204
CD200R12465848510988
CD300A563574119151152167
Table 7. Transcript levels in reads from an Ampliseq analysis of freshly isolated MCs from foreskin and from purified MCs from breast skin and foreskin cultured for 2–3 weeks for MRGPRX2, purinergic, cannabinoid, and anti-Mullerian hormone receptors.
Freshly Isolated CellsCells Cultured for 2–3 Weeks
Foreskin (Male)Foreskin (Male)Breast Skin (Female)
Multiligand Pseudo-Allergy Receptor, Purinergic and Cannabinoid Receptors, Anti-Mullerian Hormone Receptors
MRGPRX2365253511134109143338
MAS1L11926344301057634
P2RX1334226337259356328335
P2RX64348111212
P2RY1113275776861
CNRIP11137481241224382124
DRD235195671579447
PAQR514271126171192171187
EDNRB101636554682169
ADORA2B86517302123
ADORA3163514201012
CNR1140.3000.10
CNR20001011138
AMHR25926578610485101
Table 8. Transcript levels in reads from an Ampliseq analysis of freshly isolated MCs from foreskin and from purified MCs from breast skin and foreskin cultured for 2–3 weeks for a number of growth factor, hormone, and retinoid receptors.
Freshly Isolated CellsCells Cultured for 2–3 Weeks
Foreskin (Male)Foreskin (Male)Breast Skin (Female)
Growth Factor Receptors, Hormone Receptors, and Retinoid Receptors
KIT10234588111381140313471352
EPOR1053811258636973
CSF2RA (GM-CSFR)146630.811
CSF2RB (beta)512347789177312448326
CRLF2 (TSLP-R)19442725787768577
IL1RL1 (IL33R)125289226115999699
BMPR1A59424774747892
PTAFR5325466414490128
IL2RA173214289010211
IL3RA10110.64340.7
IL5RA171114161299
IL6R6998277131615
IL6ST124252115616265110
IL9R411215512211087
IL18R128021651088566247
GPR3439914206224332304
MC1R96194413667130
TNFRSF91593512821115101
TNFRSF21292226503691117
LTBR74654381034
ACVR1B28622717121213
ADIPOR2481015864716264
GABARAPL1437125961112
AGTRAP11550109201253215293
ADRB2561590832262252244278
RXRA1811091426894117129
NRP1587126150149171213
NRP2871324769554739
Table 9. Transcript levels in reads from an Ampliseq analysis of freshly isolated MCs from foreskin and from purified MCs from breast skin and foreskin cultured for 2–3 weeks for MHC class I and class II genes.
Freshly Isolated CellsCells Cultured for 2–3 Weeks
Foreskin (Male)Foreskin (Male)Breast Skin (Female)
MHC and Related Genes
HLA-A344326253167201231329
HLA-B297188709310633848
HLA-C552241200251196449475
HLA-DPA19360211023135
HLA-DPB13928910.30.20.4
HLA-DRA7565190.300.40.2
HLA-DRB11461211180.70.8520
HLA-DQA117840.400.20
HLA-DOA20.60.40000.1
HLA-DOB0.10.100000
CIITA730.50.400.10
Table 10. Transcript levels in reads from an Ampliseq analysis of freshly isolated MCs from foreskin and from purified MCs from breast skin and foreskin cultured for 2–3 weeks for enzymes involved in histamine, prostaglandin, and leukotriene synthesis.
Freshly Isolated CellsCells Cultured for 2–3 Weeks
Foreskin (Male)Foreskin (Male)Breast Skin (Female)
Histamine, Prostaglandin, and Leukotriene Synthesis and Receptors
HDC85379610441941188018442409
HRH427731159236
HPGD1296102114917877807488579230
HPGDS7054845882133271527282015
PTGS2 (Cox2)523392353881364293248
PTGS1 (Cox1)378357401340389335390
ALOX5307143109369351282380
PLA2G2A2725796067000
PLA2G30000000
PLA2G4A1812933432028
LTC4S12960105923125811111236
TBXAS1261826104129128108
ANXA13919542366751938155819071793
ACSL45298415761961183020271607
PTGER223101533365328
PTGER3431834115102122117
PTGER4217203210268230234272
Complement and Coagulation Components
C21313134332310
C3AR13168111138157146
PROCR36191420221218
Table 11. Transcript levels in reads from an Ampliseq analysis of freshly isolated MCs from foreskin and from purified MCs from breast skin and foreskin cultured for 2–3 weeks for cell adhesion molecules.
Freshly Isolated CellsCells Cultured for 2–3 Weeks
Foreskin (Male)Foreskin (Male)Breast Skin (Female)
Cell Adhesion Molecules
ITGA2B436547479649654
ITGA398759234231834
ITGA516235817625212522
ITGA914812715623172822
ITGAV291482425132018
ITGAX8623176839981115
PXN18012714731293437
SELPLG602134135228262209
ICAM1146531538425237
L1CAM30423223352582420
FAT134362485716054
CEACAM111614261309301254
NINJ118126612319243716
PMP22504523279365351270321
NTM1199715857435299
JPH49362127801097294
Table 12. Transcript levels in reads from an Ampliseq analysis of freshly isolated MCs from foreskin and from purified MCs from breast skin and foreskin cultured for 2–3 weeks for transcription factors.
Freshly Isolated CellsCells Cultured for 2–3 Weeks
Foreskin (Male)Foreskin (Male)Breast Skin (Female)
Transcription Factors
GATA22859142127192735281525752955
GATA1105108141116147119123
GATA312129121015
MITF1956411894838087
HEY18620614567234640
HES11381178815161313
CREB175835467647371
STAT5A80567078868665
STAT5B111100156127128150133
BHLHE401449969715976104616121267
NFE2L318192720212218
PBX1534450112136131134
PHTF2372632878910099
HOXB222141264605867
HOXB431122446555652
RUNX26123401451714
NR4A19971474761366114880
IKZF1158133124262353353312
KLF22008820201888310
KLF41751104111840.700.60.1
TSC22D32856264828595876
ZFP3615,39510,60711,92312253289138
ZNF61854267461696773
ZNF52143193570566977
ZCCHC2453654660777077
ZMIZ1190300224135158153159
GFI11164154195229148257
EGR3494194902422220379248
MEIS2275193320287260272285
STAT322219987248223243261
AFF2954890919089104
TAL18741729286114112
E2F821139323120
FOXM10.30.30.2111817555
GLI357473222211125
EPAS1436835592321286206129
MAF23595419252836
PTRF465707280175125198140
Table 13. Transcript levels in reads from an Ampliseq analysis of freshly isolated MCs from foreskin and from purified MCs from breast skin and foreskin cultured for 2–3 weeks for growth-related genes.
Freshly Isolated CellsCells Cultured for 2–3 Weeks
Foreskin (Male)Foreskin (Male)Breast Skin (Female)
Cell Growth-Related Transcripts
HIST1H3G891016959821145645
HIST1H3J544481319363174
HIST1H3F421229238277185
RRM210.31323254259133
TOP2A112326189207151
CDK111114012010874
MKI670.30.40.714310711165
Table 14. Transcript levels in reads from an Ampliseq analysis of freshly isolated MCs from foreskin and from purified MCs from breast skin and foreskin cultured for 2–3 weeks for cytokine and growth factor genes.
Freshly Isolated CellsCells Cultured for 2–3 Weeks
Foreskin (Male)Foreskin (Male)Breast Skin (Female)
Growth Factors
VEGFA19481323284823231715
VEGFB13887108185240155213
VEGFC790.410.200.4
PDGFA2703664428775
PDGFB4140.80000
PDGFC1720140.90.20.70.7
CSF1 (M-CSF)15799331736466232561274
CSF2 (GM-CSF)9616276360627799
CCL21518164480717899251379925
CCL434117472934198
CXCL16263160310117156185252
LIF65930714021798121015821085
TGFA31214158596587
TGFB1I1137149752713811
TNF138124213194358
TNFSF10899396264163149201
IL1329472810.30.50.4
IL7120.110122511
IL50.1005831
POSTN192414043225
GDF15136277852547797
EMR2154207168127109148118
OPTN37271080586356
Growth Factor-Induced Proteins
TNFAIP35148131858823182411
Table 15. Transcript levels in reads from an Ampliseq analysis of freshly isolated MCs from foreskin and from purified MCs from breast skin and foreskin cultured for 2–3 weeks for several cluster of differentiation (CD) cell surface-expressed proteins.
Freshly Isolated CellsCells Cultured for 2–3 Weeks
Foreskin (Male)Foreskin (Male)Breast Skin (Female)
Surface Markers
CD4238157188201342365382
CD99311078997914833896770
CD142226162127936
CD22146110118411585730738
CD33422870140100199179
CD344230.1000
CD5229209954776833697
CD632653062701255109212741264
CD6835530527511241240686999
CD274 (PD-L1)10615813017171510
CD27617322832443441
CD1091613731323031
PROS1675545220243297301
Table 16. Transcript levels in reads from an Ampliseq analysis of freshly isolated MCs from foreskin and from purified MCs from breast skin and foreskin cultured for 2–3 weeks for circadian clock-related genes.
Freshly Isolated CellsCells Cultured for 2–3 Weeks
Foreskin (Male)Foreskin (Male)Breast Skin (Female)
Circadian Proteins
PER120281197210426182623
CLOCK20171346394143
PER245542910121117
TIMELESS42197719862
PER339211540362539
ARNTL53113151514
NR1D145362513131011
NR1D237331231313432
Table 17. Transcript levels in reads from an Ampliseq analysis of freshly isolated MCs from foreskin and from purified MCs from breast skin and foreskin cultured for 2–3 weeks for heat shock proteins and immediate early genes.
Freshly Isolated CellsCells Cultured for 2–3 Weeks
Foreskin (Male)Foreskin (Male)Breast Skin (Female)
Stress and Growth Response
FOSB13,651886114,157495396
FOS6395304320261405115860
JUN3017160.30.20.20.1
JUNB567631183982231250331315
HSPA1A33,98835,50175,250211293259293
HSPA1B11,715509423,08565855745
HSPA6417396950000.40
HSPH188542370211511194108
HSP90AB1235025004641391430432479
PLAUR888415101265417047
CLU9587997971523196324602376
CREB3L2338307323375471401350
IER311861693836105974911751143
EGR3494194902422220379248
Disclaimer/Publisher’s Note: The statements, opinions and data contained in all publications are solely those of the individual author(s) and contributor(s) and not of MDPI and/or the editor(s). MDPI and/or the editor(s) disclaim responsibility for any injury to people or property resulting from any ideas, methods, instructions or products referred to in the content.

