

Transcriptional and Chromatin Accessibility Profiling of Neural Stem Cells Differentiating into Astrocytes Reveal Dynamic Signatures Affected under Inflammatory Conditions

 , , , , and
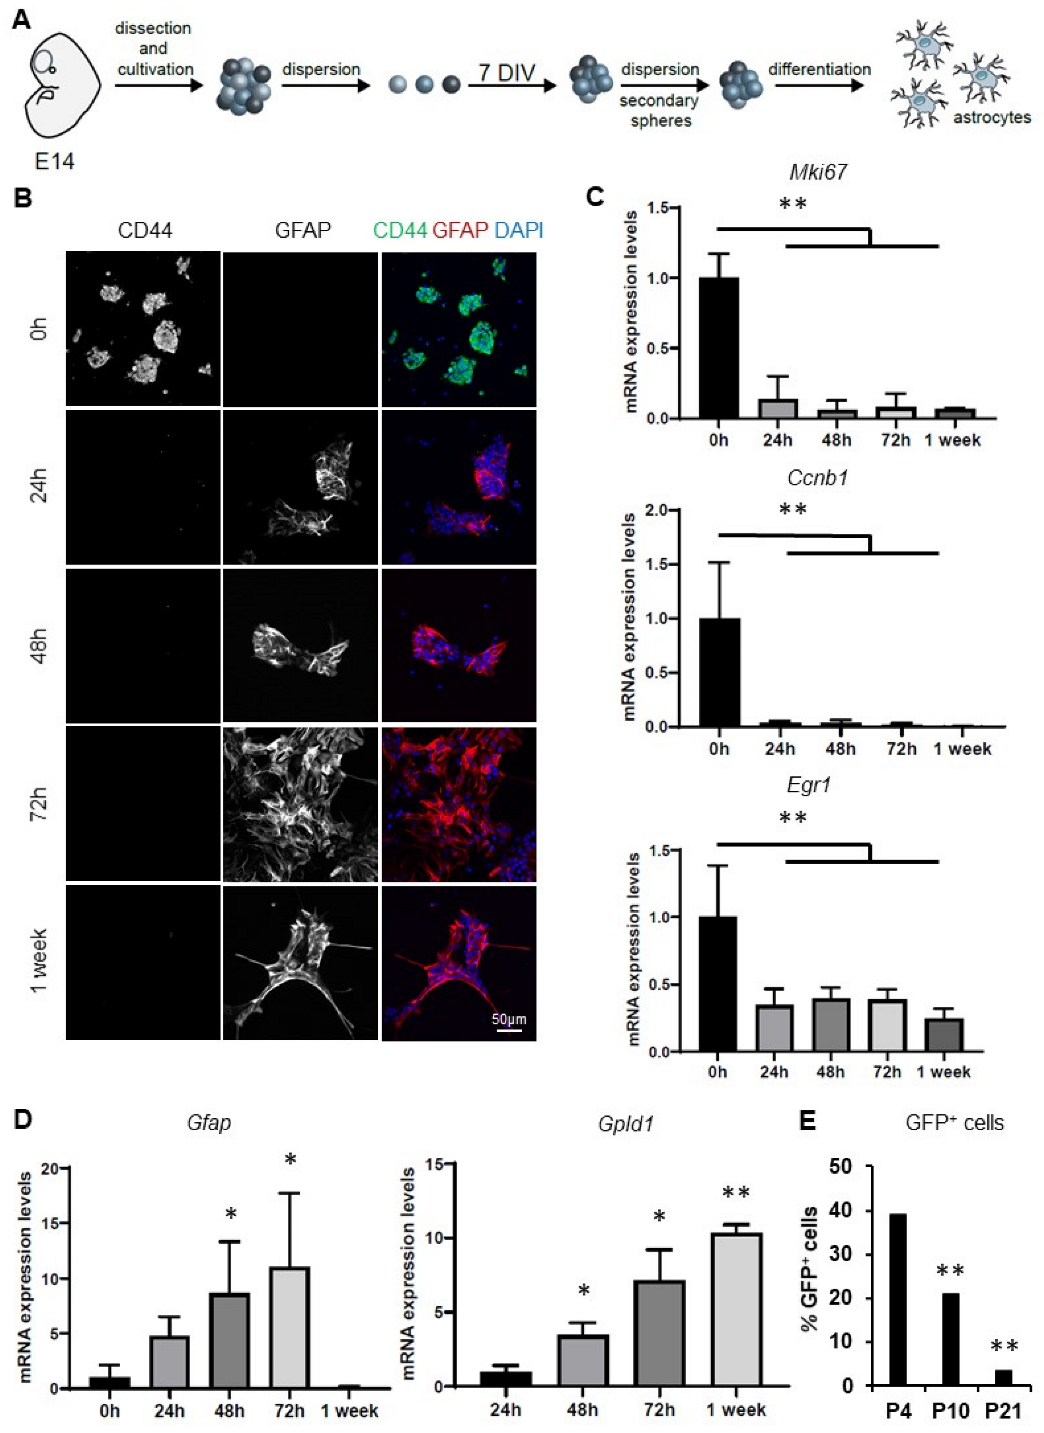
Abstract
1. Introduction
2. Materials and Methods
2.1. Animals and Ethics
2.2. Cell Culture
2.3. Selection of Astrocytes Based on Antibody-Coated Beads
2.4. Real-Time qPCR (RT-qPCR)
2.5. Immunocytochemistry
2.6. Preparation of Mouse Forebrain Cell Suspensions from hGFAP::eGFP Transgenic Mice and Flow Cytometry Analyses
2.7. RNA-Sequencing Analyses
2.8. ATAC-Sequencing Analyses
2.9. Transcription Factor Footprint Analysis
2.10. Reconstruction of Gene Regulatory Networks
2.11. Raw Data Files
2.12. Statistical Analyses
3. Results
3.1. Characterization of an In Vitro Model of Astrocytic Differentiation from Murine Neurospheres
3.2. Exposure of NSPs to TNF under Differentiating Conditions Modulates the Expression of Specific NSC and Astrocytic Markers
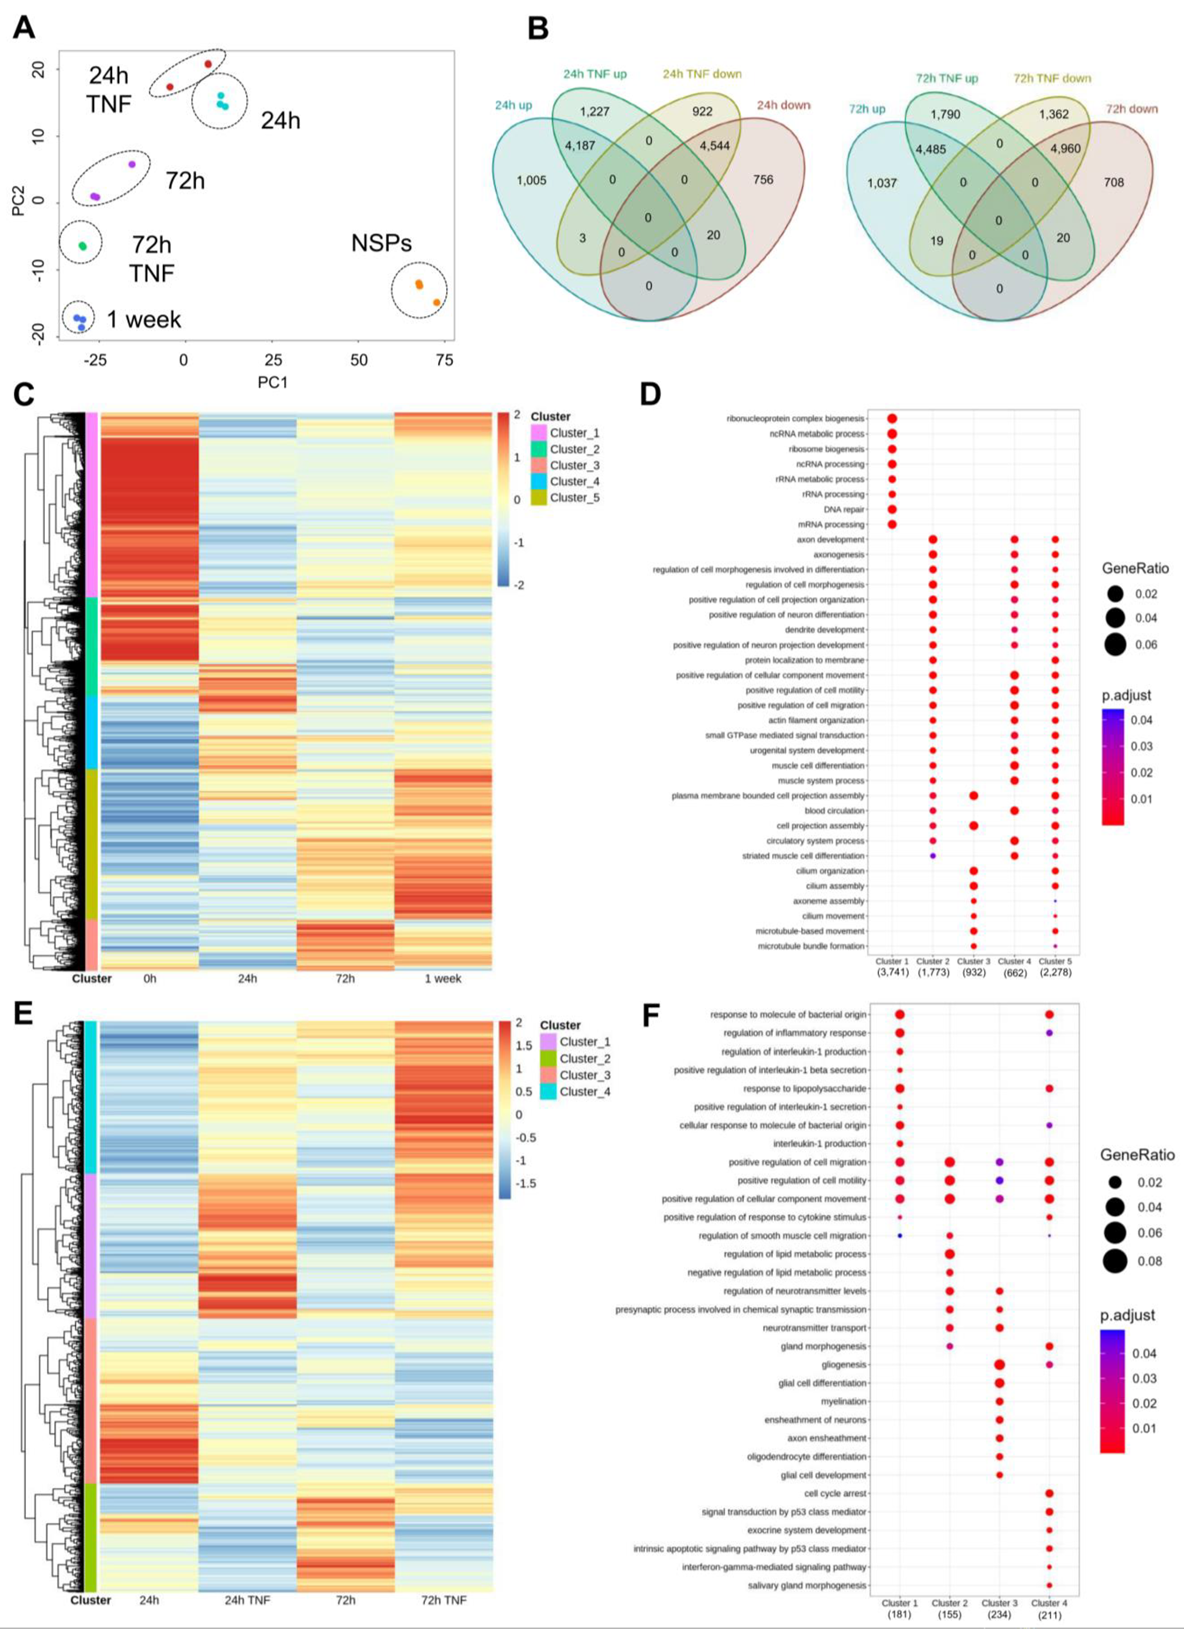
3.3. Transcriptomics Analyses under Normal and Inflammatory Conditions Reveal Discrete Populations of Differentiating Astrocytes
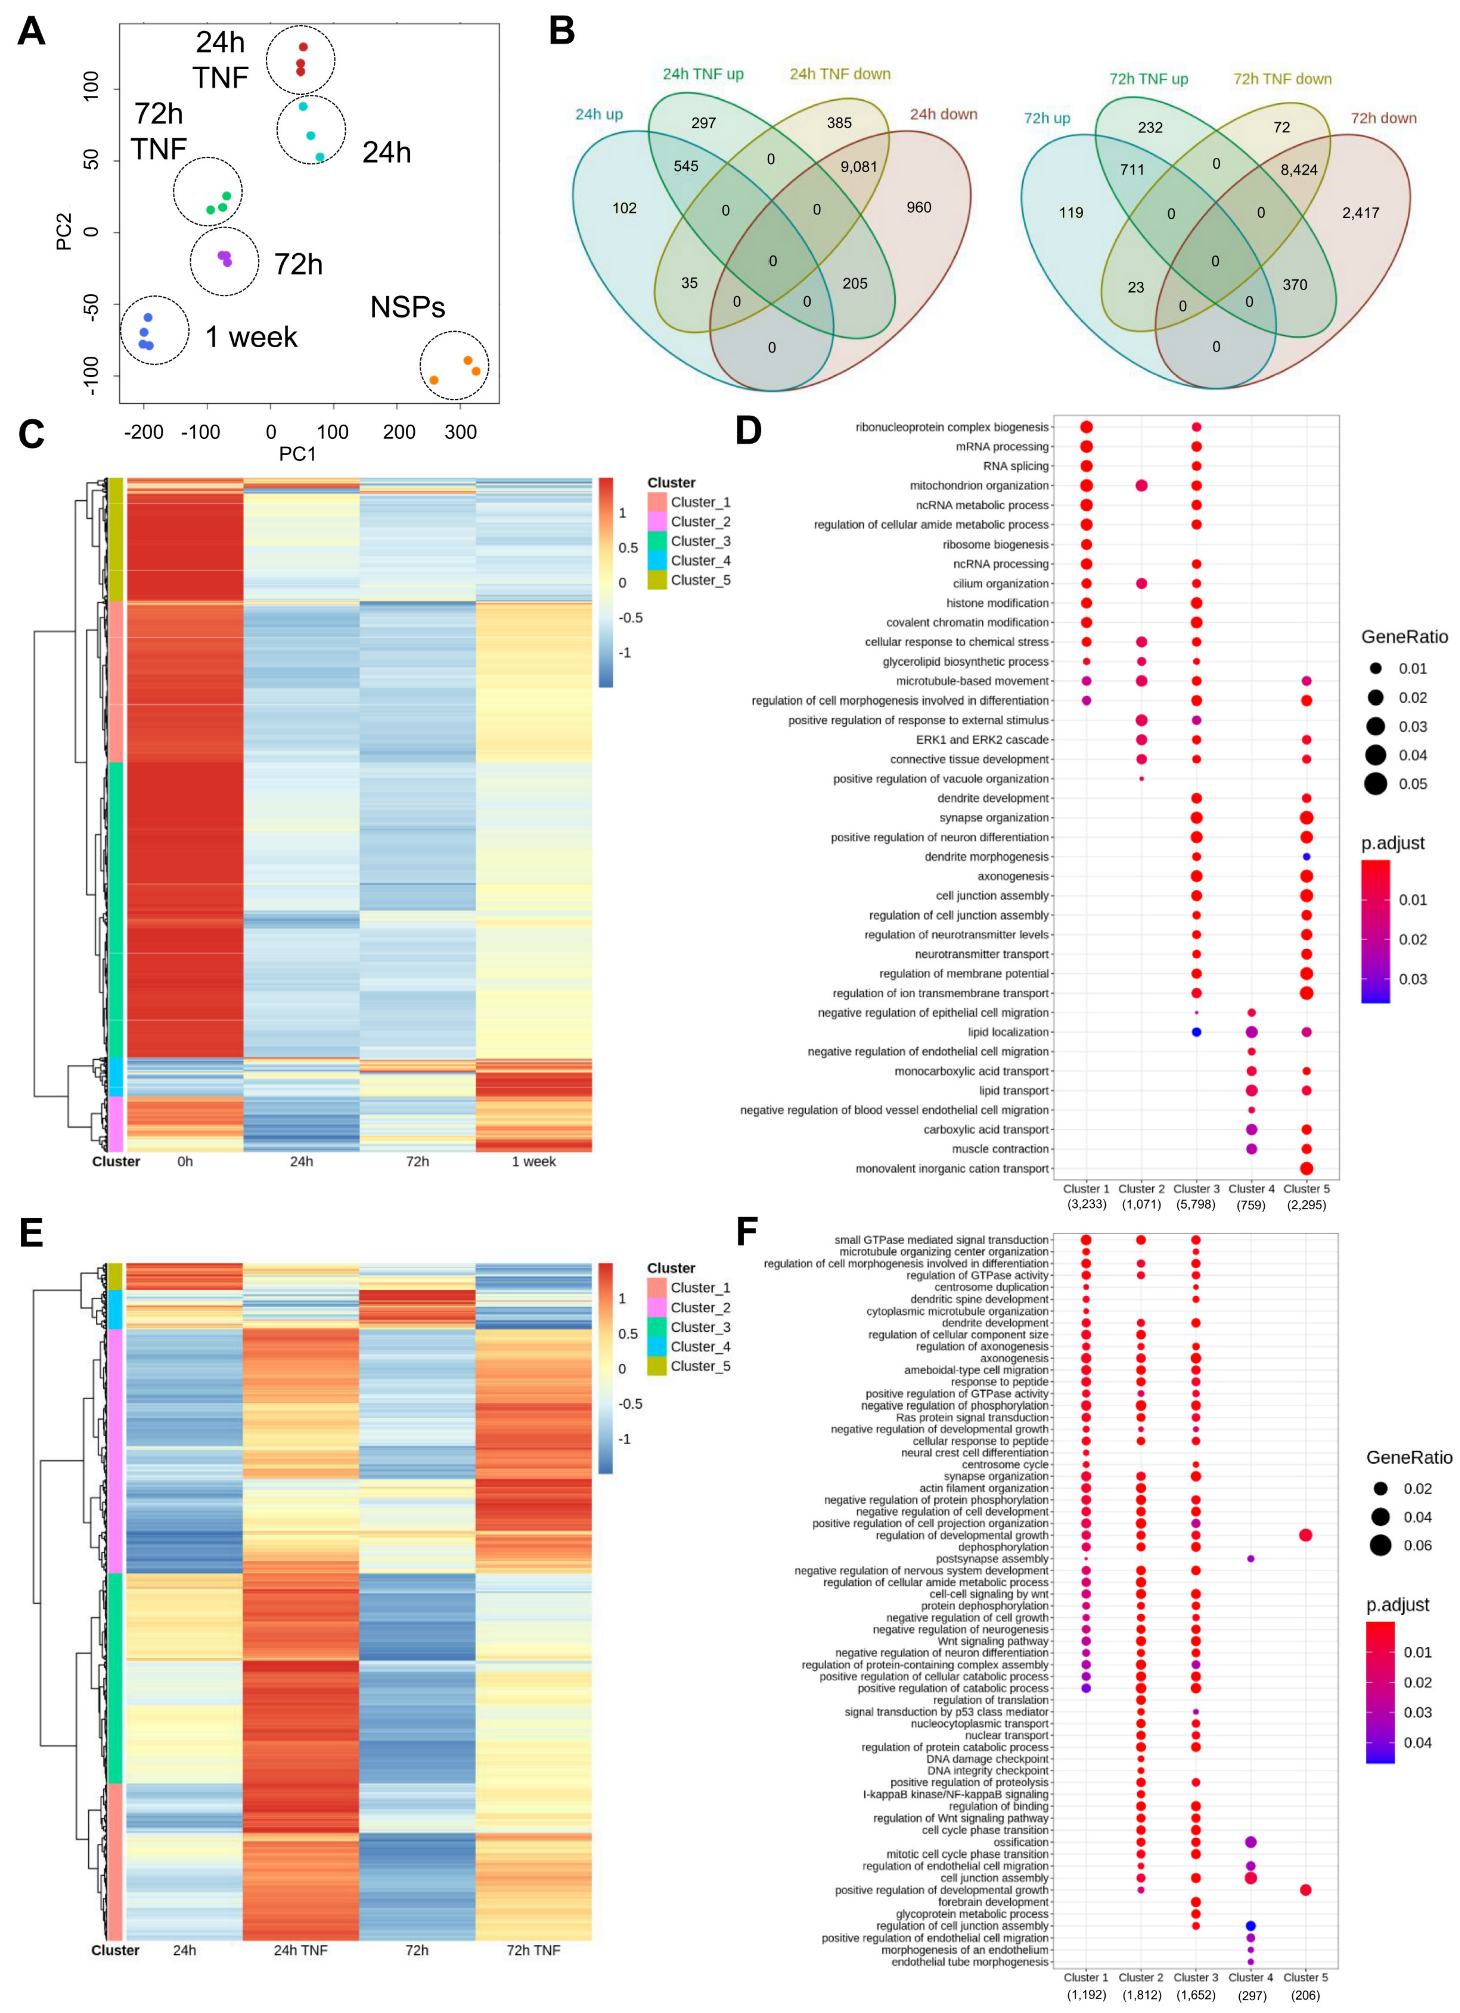
3.4. Chromatin Accessibility Profiling Detects Extensive Chromatin Remodeling along the Astrocytic Differentiation Affected by TNF Exposure
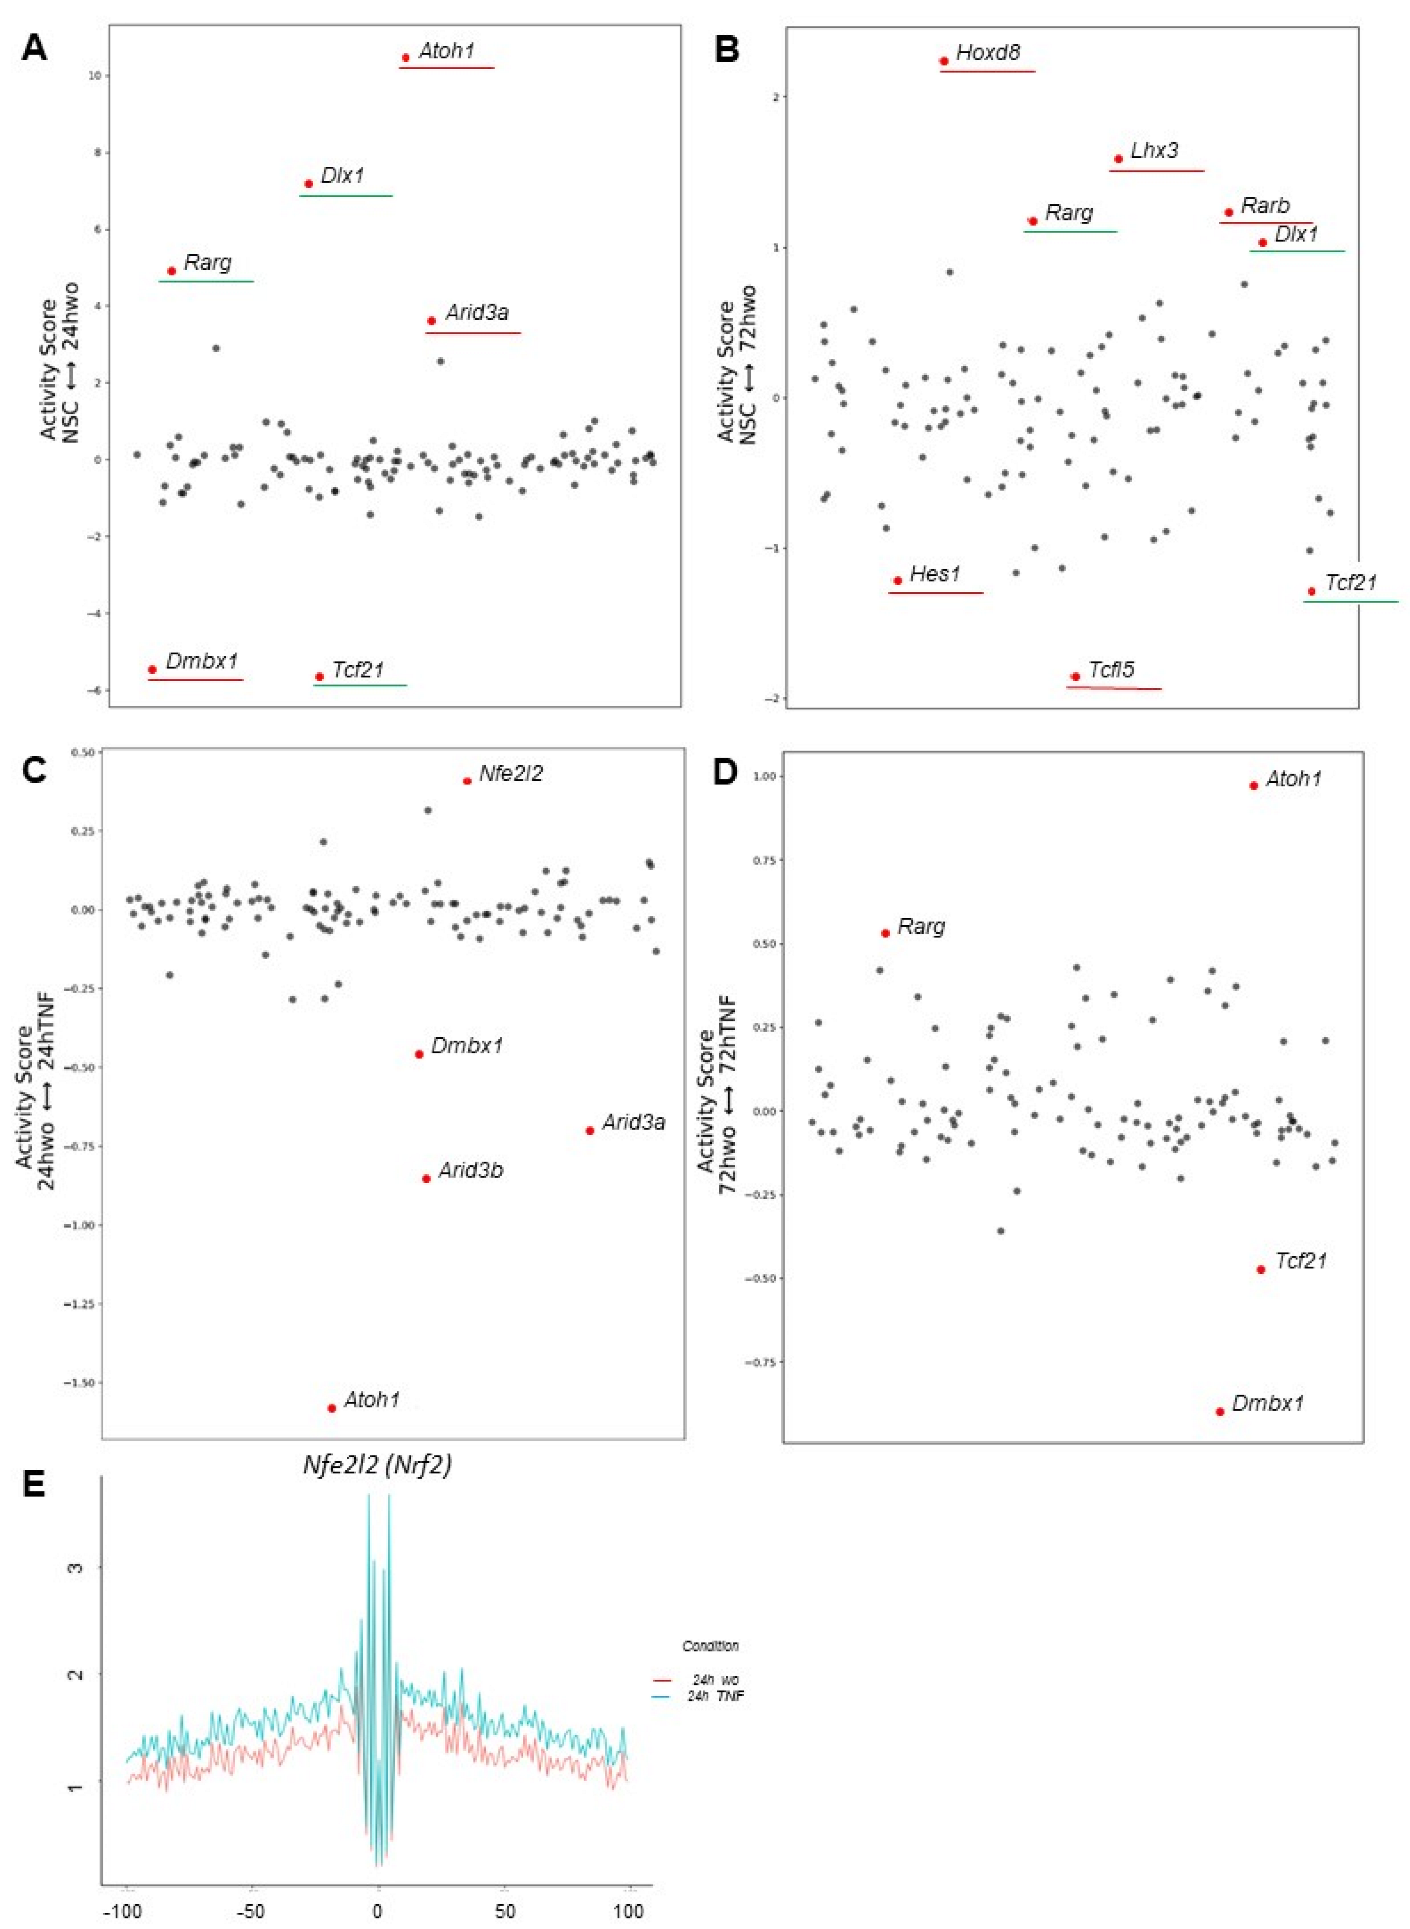
3.5. Transcription Factor Binding Analyses Uncover Dynamic Footprints Associated with Astrocyte Specification and Maturation under Normal and Inflammatory Conditions
3.6. Transcriptional and Chromatin Accessibility States Positively Correlate at Specific NSC and Astrocytic Gene Loci
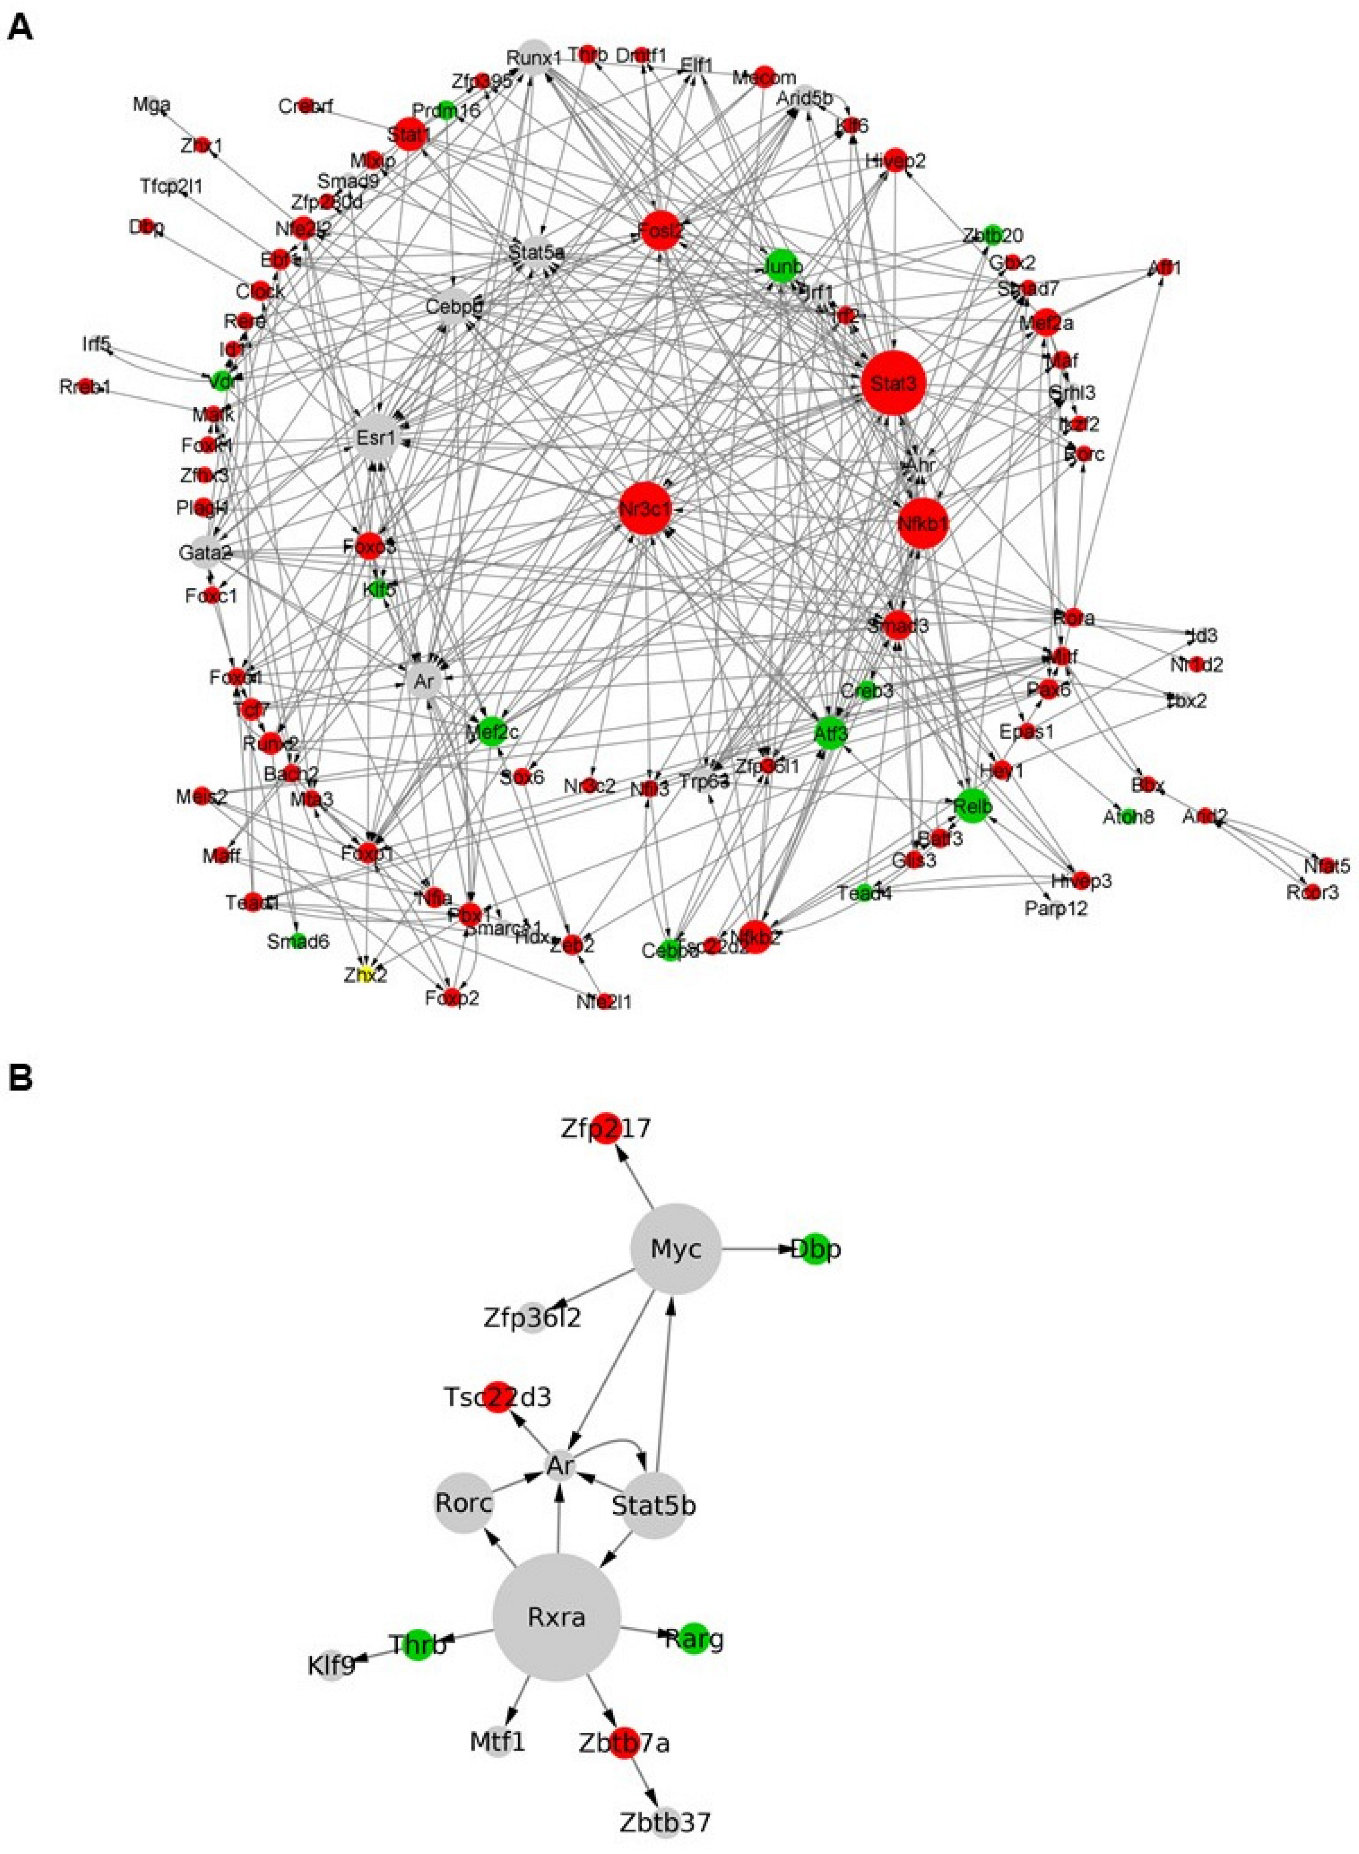
3.7. Inference of Gene Regulatory Networks Enables the Identification of Key Transcription Factor Bindig Motifs Associated with Astrocytic Differentiation under Physiological and Inflammatory Conditions
4. Discussion
4.1. In Vitro Model Characterization
4.2. Targeted Gene Expression and Genome-Wide Transcriptional Analyses
4.3. Genome-Wide Chromatin Accessibility Profiling
4.4. Footprint Analyses
4.5. RNA-seq & ATAC-seq Correlation Analyses
4.6. Reconstructed Gene Regulatory Networks
5. Conclusions
Supplementary Materials
Author Contributions
Funding
Institutional Review Board Statement
Informed Consent Statement
Data Availability Statement
Acknowledgments
Conflicts of Interest
References
- Hirabayashi, Y.; Gotoh, Y. Stage-dependent fate determination of neural precursor cells in mouse forebrain. Neurosci. Res. 2005, 51, 331–336. [Google Scholar] [CrossRef] [PubMed]
- Takouda, J.; Katada, S.; Nakashima, K. Emerging mechanisms underlying astrogenesis in the developing mammalian brain. Proc. Jpn. Acad. Ser. B Phys. Biol. Sci. 2017, 93, 386–398. [Google Scholar] [CrossRef] [PubMed]
- Gotz, M.; Nakafuku, M.; Petrik, D. Neurogenesis in the Developing and Adult Brain-Similarities and Key Differences. Cold Spring Harb. Perspect. Biol. 2016, 8, a018853. [Google Scholar] [CrossRef] [PubMed]
- Pavlou, M.A.S.; Grandbarbe, L.; Buckley, N.J.; Niclou, S.P.; Michelucci, A. Transcriptional and epigenetic mechanisms underlying astrocyte identity. Prog. Neurobiol. 2019, 174, 36–52. [Google Scholar] [CrossRef]
- Domingues, H.S.; Portugal, C.C.; Socodato, R.; Relvas, J.B. Corrigendum: Oligodendrocyte, Astrocyte and Microglia Crosstalk in Myelin Development, Damage, and Repair. Front. Cell. Dev. Biol. 2016, 4, 79. [Google Scholar] [CrossRef]
- Pekny, M.; Pekna, M.; Messing, A.; Steinhauser, C.; Lee, J.M.; Parpura, V.; Hol, E.M.; Sofroniew, M.V.; Verkhratsky, A. Astrocytes: A central element in neurological diseases. Acta Neuropathol. 2016, 131, 323–345. [Google Scholar] [CrossRef]
- Messing, A.; Brenner, M.; Feany, M.B.; Nedergaard, M.; Goldman, J.E. Alexander disease. J. Neurosci. 2012, 32, 5017–5023. [Google Scholar] [CrossRef]
- Quinlan, R.A.; Brenner, M.; Goldman, J.E.; Messing, A. GFAP and its role in Alexander disease. Exp. Cell Res. 2007, 313, 2077–2087. [Google Scholar] [CrossRef]
- Arvidsson, L.; Covacu, R.; Estrada, C.P.; Sankavaram, S.R.; Svensson, M.; Brundin, L. Long-distance effects of inflammation on differentiation of adult spinal cord neural stem/progenitor cells. J. Neuroimmunol. 2015, 288, 47–55. [Google Scholar] [CrossRef]
- Lozano, D.; Gonzales-Portillo, G.S.; Acosta, S.; de la Pena, I.; Tajiri, N.; Kaneko, Y.; Borlongan, C.V. Neuroinflammatory responses to traumatic brain injury: Etiology, clinical consequences, and therapeutic opportunities. Neuropsychiatr. Dis. Treat. 2015, 11, 97–106. [Google Scholar] [CrossRef]
- Hess, D.C.; Borlongan, C.V. Stem cells and neurological diseases. Cell Prolif. 2008, 41 (Suppl. S1), 94–114. [Google Scholar] [CrossRef]
- Galvao, R.P.; Zong, H. Inflammation and Gliomagenesis: Bi-Directional Communication at Early and Late Stages of Tumor Progression. Curr. Pathobiol. Rep. 2013, 1, 19–28. [Google Scholar] [CrossRef] [PubMed]
- Sanai, N.; Alvarez-Buylla, A.; Berger, M.S. Neural stem cells and the origin of gliomas. N. Engl. J. Med. 2005, 353, 811–822. [Google Scholar] [CrossRef] [PubMed]
- Alcantara Llaguno, S.R.; Parada, L.F. Cell of origin of glioma: Biological and clinical implications. Br. J. Cancer 2016, 115, 1445–1450. [Google Scholar] [CrossRef]
- Idriss, H.T.; Naismith, J.H. TNFα and the TNF receptor superfamily: Structure-function relationship(s). Microsc. Res. Tech. 2000, 50, 184–195. [Google Scholar] [CrossRef]
- Sun, M.; Fink, P.J. A new class of reverse signaling costimulators belongs to the TNF family. J. Immunol. 2007, 179, 4307–4312. [Google Scholar] [CrossRef] [PubMed]
- Park, S.H.; Kang, K.; Giannopoulou, E.; Qiao, Y.; Kang, K.; Kim, G.; Park-Min, K.H.; Ivashkiv, L.B. Type I interferons and the cytokine TNF cooperatively reprogram the macrophage epigenome to promote inflammatory activation. Nat. Immunol. 2017, 18, 1104–1116. [Google Scholar] [CrossRef] [PubMed]
- Adefuin, A.M.; Kimura, A.; Noguchi, H.; Nakashima, K.; Namihira, M. Epigenetic mechanisms regulating differentiation of neural stem/precursor cells. Epigenomics 2014, 6, 637–649. [Google Scholar] [CrossRef]
- Hwang, D.W.; Jaganathan, A.; Shrestha, P.; Jin, Y.; El-Amine, N.; Wang, S.H.; Hammell, M.; Mills, A.A. Chromatin-mediated translational control is essential for neural cell fate specification. Life Sci. Alliance 2018, 1, e201700016. [Google Scholar] [CrossRef] [PubMed]
- Buenrostro, J.D.; Giresi, P.G.; Zaba, L.C.; Chang, H.Y.; Greenleaf, W.J. Transposition of native chromatin for fast and sensitive epigenomic profiling of open chromatin, DNA-binding proteins and nucleosome position. Nat. Methods 2013, 10, 1213–1218. [Google Scholar] [CrossRef]
- Birck, C.; Ginolhac, A.; Pavlou, M.A.S.; Michelucci, A.; Heuschling, P.; Grandbarbe, L. NF-κB and TNF Affect the Astrocytic Differentiation from Neural Stem Cells. Cells 2021, 10, 840. [Google Scholar] [CrossRef] [PubMed]
- Grandbarbe, L.; Bouissac, J.; Rand, M.; Hrabe de Angelis, M.; Artavanis-Tsakonas, S.; Mohier, E. Delta-Notch signaling controls the generation of neurons/glia from neural stem cells in a stepwise process. Development 2003, 130, 1391–1402. [Google Scholar] [CrossRef] [PubMed]
- Schmittgen, T.D.; Livak, K.J. Analyzing real-time PCR data by the comparative CT method. Nat. Protoc. 2008, 3, 1101–1108. [Google Scholar] [CrossRef] [PubMed]
- Zhuo, L.; Sun, B.; Zhang, C.-L.; Fine, A.; Chiu, S.-Y.; Messing, A. Live Astrocytes Visualized by Green Fluorescent Protein in Transgenic Mice. Dev. Biol. 1997, 187, 36–42. [Google Scholar] [CrossRef] [PubMed]
- Li, Z.; Schulz, M.H.; Look, T.; Begemann, M.; Zenke, M.; Costa, I.G. Identification of transcription factor binding sites using ATAC-seq. Genome Biol. 2019, 20, 45. [Google Scholar] [CrossRef]
- Huynh-Thu, V.A.; Irrthum, A.; Wehenkel, L.; Geurts, P. Inferring regulatory networks from expression data using tree-based methods. PLoS ONE 2010, 5, e12776. [Google Scholar] [CrossRef]
- Michelucci, A.; Bithell, A.; Burney, M.J.; Johnston, C.E.; Wong, K.Y.; Teng, S.W.; Desai, J.; Gumbleton, N.; Anderson, G.; Stanton, L.W.; et al. The Neurogenic Potential of Astrocytes Is Regulated by Inflammatory Signals. Mol. Neurobiol. 2016, 53, 3724–3739. [Google Scholar] [CrossRef]
- Escartin, C.; Galea, E.; Lakatos, A.; O’Callaghan, J.P.; Petzold, G.C.; Serrano-Pozo, A.; Steinhauser, C.; Volterra, A.; Carmignoto, G.; Agarwal, A.; et al. Reactive astrocyte nomenclature, definitions, and future directions. Nat. Neurosci. 2021, 24, 312–325. [Google Scholar] [CrossRef]
- Liddelow, S.A.; Guttenplan, K.A.; Clarke, L.E.; Bennett, F.C.; Bohlen, C.J.; Schirmer, L.; Bennett, M.L.; Munch, A.E.; Chung, W.S.; Peterson, T.C.; et al. Neurotoxic reactive astrocytes are induced by activated microglia. Nature 2017, 541, 481–487. [Google Scholar] [CrossRef]
- Cahoy, J.D.; Emery, B.; Kaushal, A.; Foo, L.C.; Zamanian, J.L.; Christopherson, K.S.; Xing, Y.; Lubischer, J.L.; Krieg, P.A.; Krupenko, S.A.; et al. A transcriptome database for astrocytes, neurons, and oligodendrocytes: A new resource for understanding brain development and function. J. Neurosci. 2008, 28, 264–278. [Google Scholar] [CrossRef]
- Lovatt, D.; Sonnewald, U.; Waagepetersen, H.S.; Schousboe, A.; He, W.; Lin, J.H.; Han, X.; Takano, T.; Wang, S.; Sim, F.J.; et al. The transcriptome and metabolic gene signature of protoplasmic astrocytes in the adult murine cortex. J. Neurosci. 2007, 27, 12255–12266. [Google Scholar] [CrossRef] [PubMed]
- Zamanian, J.L.; Xu, L.; Foo, L.C.; Nouri, N.; Zhou, L.; Giffard, R.G.; Barres, B.A. Genomic analysis of reactive astrogliosis. J. Neurosci. 2012, 32, 6391–6410. [Google Scholar] [CrossRef]
- Rothhammer, V.; Quintana, F.J. Control of autoimmune CNS inflammation by astrocytes. Semin. Immunopathol. 2015, 37, 625–638. [Google Scholar] [CrossRef] [PubMed]
- Grill, M.; Syme, T.E.; Nocon, A.L.; Lu, A.Z.; Hancock, D.; Rose-John, S.; Campbell, I.L. Strawberry notch homolog 2 is a novel inflammatory response factor predominantly but not exclusively expressed by astrocytes in the central nervous system. Glia 2015, 63, 1738–1752. [Google Scholar] [CrossRef] [PubMed]
- Molofsky, A.V.; Krencik, R.; Ullian, E.M.; Tsai, H.H.; Deneen, B.; Richardson, W.D.; Barres, B.A.; Rowitch, D.H. Astrocytes and disease: A neurodevelopmental perspective. Genes Dev. 2012, 26, 891–907. [Google Scholar] [CrossRef] [PubMed]
- Sloan, S.A.; Barres, B.A. Mechanisms of astrocyte development and their contributions to neurodevelopmental disorders. Curr. Opin. Neurobiol. 2014, 27, 75–81. [Google Scholar] [CrossRef] [PubMed]
- Magistri, M.; Khoury, N.; Mazza, E.M.; Velmeshev, D.; Lee, J.K.; Bicciato, S.; Tsoulfas, P.; Faghihi, M.A. A comparative transcriptomic analysis of astrocytes differentiation from human neural progenitor cells. Eur. J. Neurosci. 2016, 44, 2858–2870. [Google Scholar] [CrossRef]
- Goodnight, A.V.; Kremsky, I.; Khampang, S.; Jung, Y.H.; Billingsley, J.M.; Bosinger, S.E.; Corces, V.G.; Chan, A.W.S. Chromatin accessibility and transcription dynamics during in vitro astrocyte differentiation of Huntington’s Disease Monkey pluripotent stem cells. Epigenetics Chromatin 2019, 12, 67. [Google Scholar] [CrossRef] [PubMed]
- Chandrasekaran, A.; Avci, H.X.; Leist, M.; Kobolak, J.; Dinnyes, A. Astrocyte Differentiation of Human Pluripotent Stem Cells: New Tools for Neurological Disorder Research. Front. Cell. Neurosci. 2016, 10, 215. [Google Scholar] [CrossRef]
- Sofroniew, M.V.; Vinters, H.V. Astrocytes: Biology and pathology. Acta Neuropathol. 2010, 119, 7–35. [Google Scholar] [CrossRef]
- Gabel, S.; Koncina, E.; Dorban, G.; Heurtaux, T.; Birck, C.; Glaab, E.; Michelucci, A.; Heuschling, P.; Grandbarbe, L. Inflammation Promotes a Conversion of Astrocytes into Neural Progenitor Cells via NF-κB Activation. Mol. Neurobiol. 2016, 53, 5041–5055. [Google Scholar] [CrossRef] [PubMed]
- Lee, S.J.; Drabik, K.; Van Wagoner, N.J.; Lee, S.; Choi, C.; Dong, Y.; Benveniste, E.N. ICAM-1-induced expression of proinflammatory cytokines in astrocytes: Involvement of extracellular signal-regulated kinase and p38 mitogen-activated protein kinase pathways. J. Immunol. 2000, 165, 4658–4666. [Google Scholar] [CrossRef] [PubMed]
- Neal, M.; Luo, J.; Harischandra, D.S.; Gordon, R.; Sarkar, S.; Jin, H.; Anantharam, V.; Desaubry, L.; Kanthasamy, A.; Kanthasamy, A. Prokineticin-2 promotes chemotaxis and alternative A2 reactivity of astrocytes. Glia 2018, 66, 2137–2157. [Google Scholar] [CrossRef]
- Brosnan, C.F.; Raine, C.S. The astrocyte in multiple sclerosis revisited. Glia 2013, 61, 453–465. [Google Scholar] [CrossRef] [PubMed]
- Parratt, J.D.; Prineas, J.W. Neuromyelitis optica: A demyelinating disease characterized by acute destruction and regeneration of perivascular astrocytes. Mult. Scler. 2010, 16, 1156–1172. [Google Scholar] [CrossRef]
- Belanger, M.; Allaman, I.; Magistretti, P.J. Brain energy metabolism: Focus on astrocyte-neuron metabolic cooperation. Cell Metab. 2011, 14, 724–738. [Google Scholar] [CrossRef]
- Brown, A.M.; Ransom, B.R. Astrocyte glycogen and brain energy metabolism. Glia 2007, 55, 1263–1271. [Google Scholar] [CrossRef]
- Brunet, J.F.; Allaman, I.; Magistretti, P.J.; Pellerin, L. Glycogen metabolism as a marker of astrocyte differentiation. J. Cereb. Blood Flow Metab. 2010, 30, 51–55. [Google Scholar] [CrossRef]
- Bak, L.K.; Walls, A.B.; Schousboe, A.; Waagepetersen, H.S. Astrocytic glycogen metabolism in the healthy and diseased brain. J. Biol. Chem. 2018, 293, 7108–7116. [Google Scholar] [CrossRef]
- Iglesias, J.; Morales, L.; Barreto, G.E. Metabolic and Inflammatory Adaptation of Reactive Astrocytes: Role of PPARs. Mol. Neurobiol. 2017, 54, 2518–2538. [Google Scholar] [CrossRef]
- Court, F.; Le Boiteux, E.; Fogli, A.; Muller-Barthelemy, M.; Vaurs-Barriere, C.; Chautard, E.; Pereira, B.; Biau, J.; Kemeny, J.L.; Khalil, T.; et al. Transcriptional alterations in glioma result primarily from DNA methylation-independent mechanisms. Genome Res. 2019, 29, 1605–1621. [Google Scholar] [CrossRef] [PubMed]
- Imayoshi, I.; Sakamoto, M.; Yamaguchi, M.; Mori, K.; Kageyama, R. Essential roles of Notch signaling in maintenance of neural stem cells in developing and adult brains. J. Neurosci. 2010, 30, 3489–3498. [Google Scholar] [CrossRef]
- Yun, S.J.; Byun, K.; Bhin, J.; Oh, J.H.; Nhung, L.T.H.; Hwang, D.; Lee, B. Transcriptional regulatory networks associated with self-renewal and differentiation of neural stem cells. J. Cell. Physiol. 2010, 225, 337–347. [Google Scholar] [CrossRef] [PubMed]
- Ahmed, S.; Gan, H.T.; Lam, C.S.; Poonepalli, A.; Ramasamy, S.; Tay, Y.; Tham, M.; Yu, Y.H. Transcription factors and neural stem cell self-renewal, growth and differentiation. Cell Adhes. Migr. 2009, 3, 412–424. [Google Scholar] [CrossRef] [PubMed]
- Habas, A.; Hahn, J.; Wang, X.; Margeta, M. Neuronal activity regulates astrocytic Nrf2 signaling. Proc. Natl. Acad. Sci. USA 2013, 110, 18291–18296. [Google Scholar] [CrossRef] [PubMed]
- Liddell, J.R. Are Astrocytes the Predominant Cell Type for Activation of Nrf2 in Aging and Neurodegeneration? Antioxidants 2017, 6, 65. [Google Scholar] [CrossRef]
- Hayes, J.D.; Dinkova-Kostova, A.T. The Nrf2 regulatory network provides an interface between redox and intermediary metabolism. Trends Biochem. Sci. 2014, 39, 199–218. [Google Scholar] [CrossRef]
- Starks, R.R.; Biswas, A.; Jain, A.; Tuteja, G. Combined analysis of dissimilar promoter accessibility and gene expression profiles identifies tissue-specific genes and actively repressed networks. Epigenetics Chromatin 2019, 12, 16. [Google Scholar] [CrossRef]
- Wen, S.; Li, H.; Liu, J. Dynamic signaling for neural stem cell fate determination. Cell Adhes. Migr. 2009, 3, 107–117. [Google Scholar] [CrossRef]
- Lattke, M.; Goldstone, R.; Ellis, J.K.; Boeing, S.; Jurado-Arjona, J.; Marichal, N.; MacRae, J.I.; Berninger, B.; Guillemot, F. Extensive transcriptional and chromatin changes underlie astrocyte maturation in vivo and in culture. Nat. Commun. 2021, 12, 4335. [Google Scholar] [CrossRef]
- Tiwari, N.; Pataskar, A.; Peron, S.; Thakurela, S.; Sahu, S.K.; Figueres-Onate, M.; Marichal, N.; Lopez-Mascaraque, L.; Tiwari, V.K.; Berninger, B. Stage-Specific Transcription Factors Drive Astrogliogenesis by Remodeling Gene Regulatory Landscapes. Cell Stem Cell 2018, 23, 557–571.e8. [Google Scholar] [CrossRef] [PubMed]
- Fuente-Martin, E.; Garcia-Caceres, C.; Morselli, E.; Clegg, D.J.; Chowen, J.A.; Finan, B.; Brinton, R.D.; Tschop, M.H. Estrogen, astrocytes and the neuroendocrine control of metabolism. Rev. Endocr. Metab. Disord. 2013, 14, 331–338. [Google Scholar] [CrossRef] [PubMed]
- Spence, R.D.; Hamby, M.E.; Umeda, E.; Itoh, N.; Du, S.; Wisdom, A.J.; Cao, Y.; Bondar, G.; Lam, J.; Ao, Y.; et al. Neuroprotection mediated through estrogen receptor-α in astrocytes. Proc. Natl. Acad. Sci. USA 2011, 108, 8867–8872. [Google Scholar] [CrossRef] [PubMed]
- Tertil, M.; Skupio, U.; Barut, J.; Dubovyk, V.; Wawrzczak-Bargiela, A.; Soltys, Z.; Golda, S.; Kudla, L.; Wiktorowska, L.; Szklarczyk, K.; et al. Glucocorticoid receptor signaling in astrocytes is required for aversive memory formation. Transl. Psychiatry 2018, 8, 255. [Google Scholar] [CrossRef]
- Pearson, C.A.; Moore, D.M.; Tucker, H.O.; Dekker, J.D.; Hu, H.; Miquelajauregui, A.; Novitch, B.G. Foxp1 Regulates Neural Stem Cell Self-Renewal and Bias Toward Deep Layer Cortical Fates. Cell Rep. 2020, 30, 1964–1981.e3. [Google Scholar] [CrossRef]
- Braccioli, L.; Vervoort, S.J.; Adolfs, Y.; Heijnen, C.J.; Basak, O.; Pasterkamp, R.J.; Nijboer, C.H.; Coffer, P.J. FOXP1 Promotes Embryonic Neural Stem Cell Differentiation by Repressing Jagged1 Expression. Stem Cell Rep. 2017, 9, 1530–1545. [Google Scholar] [CrossRef]
- Tchieu, J.; Calder, E.L.; Guttikonda, S.R.; Gutzwiller, E.M.; Aromolaran, K.A.; Steinbeck, J.A.; Goldstein, P.A.; Studer, L. NFIA is a gliogenic switch enabling rapid derivation of functional human astrocytes from pluripotent stem cells. Nat. Biotechnol. 2019, 37, 267–275. [Google Scholar] [CrossRef]
- Zhang, J.; Xu, X.; Liu, H.; Jin, L.; Shen, X.; Xie, C.; Xiang, W.; Yang, D.; Feng, W.; Wang, J.; et al. Astrocytic YAP prevents the demyelination through promoting expression of cholesterol synthesis genes in experimental autoimmune encephalomyelitis. Cell Death Dis. 2021, 12, 907. [Google Scholar] [CrossRef]
- Herrera, F.; Chen, Q.; Schubert, D. Synergistic effect of retinoic acid and cytokines on the regulation of glial fibrillary acidic protein expression. J. Biol. Chem. 2010, 285, 38915–38922. [Google Scholar] [CrossRef]
- Wu, X.; Kihara, T.; Akaike, A.; Niidome, T.; Sugimoto, H. PI3K/Akt/mTOR signaling regulates glutamate transporter 1 in astrocytes. Biochem. Biophys. Res. Commun. 2010, 393, 514–518. [Google Scholar] [CrossRef]
- Lin, M.S.; Sun, Y.Y.; Chiu, W.T.; Hung, C.C.; Chang, C.Y.; Shie, F.S.; Tsai, S.H.; Lin, J.W.; Hung, K.S.; Lee, Y.H. Curcumin attenuates the expression and secretion of RANTES after spinal cord injury in vivo and lipopolysaccharide-induced astrocyte reactivation in vitro. J. Neurotrauma 2011, 28, 1259–1269. [Google Scholar] [CrossRef] [PubMed]
- Bani-Yaghoub, M.; Tremblay, R.G.; Lei, J.X.; Zhang, D.; Zurakowski, B.; Sandhu, J.K.; Smith, B.; Ribecco-Lutkiewicz, M.; Kennedy, J.; Walker, P.R.; et al. Role of Sox2 in the development of the mouse neocortex. Dev. Biol. 2006, 295, 52–66. [Google Scholar] [CrossRef]
- Santopolo, G.; Magnusson, J.P.; Lindvall, O.; Kokaia, Z.; Frisen, J. Blocking Notch-Signaling Increases Neurogenesis in the Striatum after Stroke. Cells 2020, 9, 1732. [Google Scholar] [CrossRef] [PubMed]
- Stipursky, J.; Gomes, F.C. TGF-β1/SMAD signaling induces astrocyte fate commitment in vitro: Implications for radial glia development. Glia 2007, 55, 1023–1033. [Google Scholar] [CrossRef] [PubMed]
- Platanitis, E.; Decker, T. Regulatory Networks Involving STATs, IRFs, and NFκB in Inflammation. Front. Immunol. 2018, 9, 2542. [Google Scholar] [CrossRef]
- Herrmann, J.E.; Imura, T.; Song, B.; Qi, J.; Ao, Y.; Nguyen, T.K.; Korsak, R.A.; Takeda, K.; Akira, S.; Sofroniew, M.V. STAT3 is a critical regulator of astrogliosis and scar formation after spinal cord injury. J. Neurosci. 2008, 28, 7231–7243. [Google Scholar] [CrossRef] [PubMed]
- Lattke, M.; Reichel, S.N.; Baumann, B. NF-κB-mediated astrocyte dysfunction initiates neurodegeneration. Oncotarget 2017, 8, 50329–50330. [Google Scholar] [CrossRef] [PubMed]
- Grivennikov, S.I.; Karin, M. Dangerous liaisons: STAT3 and NF-κB collaboration and crosstalk in cancer. Cytokine Growth Factor Rev. 2010, 21, 11–19. [Google Scholar] [CrossRef] [PubMed]
- Fan, Y.; Mao, R.; Yang, J. NF-κB and STAT3 signaling pathways collaboratively link inflammation to cancer. Protein Cell 2013, 4, 176–185. [Google Scholar] [CrossRef]
- Hong, S.; Song, M.R. STAT3 but not STAT1 is required for astrocyte differentiation. PLoS ONE 2014, 9, e86851. [Google Scholar] [CrossRef]
- Lawrence, T. The nuclear factor NF-κB pathway in inflammation. Cold Spring Harb. Perspect. Biol. 2009, 1, a001651. [Google Scholar] [CrossRef] [PubMed]
- Logan, T.T.; Rusnak, M.; Symes, A.J. Runx1 promotes proliferation and neuronal differentiation in adult mouse neurosphere cultures. Stem Cell Res. 2015, 15, 554–564. [Google Scholar] [CrossRef]
- Fields, J.; Ghorpade, A. C/EBPβ regulates multiple IL-1beta-induced human astrocyte inflammatory genes. J. Neuroinflamm. 2012, 9, 177. [Google Scholar] [CrossRef]
- Hunt, D.; Raivich, G.; Anderson, P.N. Activating transcription factor 3 and the nervous system. Front. Mol. Neurosci. 2012, 5, 7. [Google Scholar] [CrossRef] [PubMed]
- Trentin, A.G. Thyroid hormone and astrocyte morphogenesis. J. Endocrinol. 2006, 189, 189–197. [Google Scholar] [CrossRef] [PubMed]


Disclaimer/Publisher’s Note: The statements, opinions and data contained in all publications are solely those of the individual author(s) and contributor(s) and not of MDPI and/or the editor(s). MDPI and/or the editor(s) disclaim responsibility for any injury to people or property resulting from any ideas, methods, instructions or products referred to in the content. |
© 2023 by the authors. Licensee MDPI, Basel, Switzerland. This article is an open access article distributed under the terms and conditions of the Creative Commons Attribution (CC BY) license (https://creativecommons.org/licenses/by/4.0/).
Share and Cite
Pavlou, M.A.S.; Singh, K.; Ravichandran, S.; Halder, R.; Nicot, N.; Birck, C.; Grandbarbe, L.; del Sol, A.; Michelucci, A. Transcriptional and Chromatin Accessibility Profiling of Neural Stem Cells Differentiating into Astrocytes Reveal Dynamic Signatures Affected under Inflammatory Conditions. Cells 2023, 12, 948. https://doi.org/10.3390/cells12060948
Pavlou MAS, Singh K, Ravichandran S, Halder R, Nicot N, Birck C, Grandbarbe L, del Sol A, Michelucci A. Transcriptional and Chromatin Accessibility Profiling of Neural Stem Cells Differentiating into Astrocytes Reveal Dynamic Signatures Affected under Inflammatory Conditions. Cells. 2023; 12(6):948. https://doi.org/10.3390/cells12060948
Chicago/Turabian StylePavlou, Maria Angeliki S., Kartikeya Singh, Srikanth Ravichandran, Rashi Halder, Nathalie Nicot, Cindy Birck, Luc Grandbarbe, Antonio del Sol, and Alessandro Michelucci. 2023. "Transcriptional and Chromatin Accessibility Profiling of Neural Stem Cells Differentiating into Astrocytes Reveal Dynamic Signatures Affected under Inflammatory Conditions" Cells 12, no. 6: 948. https://doi.org/10.3390/cells12060948
APA StylePavlou, M. A. S., Singh, K., Ravichandran, S., Halder, R., Nicot, N., Birck, C., Grandbarbe, L., del Sol, A., & Michelucci, A. (2023). Transcriptional and Chromatin Accessibility Profiling of Neural Stem Cells Differentiating into Astrocytes Reveal Dynamic Signatures Affected under Inflammatory Conditions. Cells, 12(6), 948. https://doi.org/10.3390/cells12060948