Article

Differences in Cerebral Glucose Metabolism in ALS Patients with and without C9orf72 and SOD1 Mutations

1
Division of Psychiatry, Division of Neurology, University Hospitals Leuven, VIB-KULeuven Center for Brain & Disease Research, Laboratory of Neurobiology, Department of Neurosciences, Leuven Brain Institute (LBI), Katholieke Universiteit Leuven, 3000 Leuven, Belgium
2
Department of Radiology and Nuclear Medicine, Ghent University Hospital, 9000 Ghent, Belgium
3
Division of Neurology, University Hospitals Leuven, VIB-KULeuven Center for Brain & Disease Research, Laboratory of Neurobiology, Department of Neurosciences, Leuven Brain Institute (LBI), Katholieke Universiteit Leuven, 3000 Leuven, Belgium
4
Department of Imaging and Pathology, Nuclear Medicine and Molecular Imaging, Katholieke Universiteit Leuven, 3000 Leuven, Belgium
5
Center for Human Genetics, University Hospitals Leuven, 3000 Leuven, Belgium
6
VIB-KU Leuven Center for Brain & Disease Research, Laboratory of Neurobiology, Department of Neurosciences, Leuven Brain Institute (LBI), Katholieke Universiteit Leuven, 3000 Leuven, Belgium
7
Laboratory of Cognitive Neurology, Department of Neurosciences, Leuven Brain Institute (LBI), Katholieke Universiteit Leuven, 3000 Leuven, Belgium
*
Author to whom correspondence should be addressed.
These authors contributed equally to this work.
Cells 2023, 12(6), 933; https://doi.org/10.3390/cells12060933
Submission received: 2 February 2023 / Revised: 10 March 2023 / Accepted: 13 March 2023 / Published: 18 March 2023

Abstract

:
Amyotrophic lateral sclerosis (ALS) is characterized by progressive loss of upper and lower motor neurons. In 10% of patients, the disorder runs in the family. Our aim was to study the impact of ALS-causing gene mutations on cerebral glucose metabolism. Between October 2010 and October 2022, 538 patients underwent genetic testing for mutations with strong evidence of causality for ALS and 18F-2-fluoro-2-deoxy-D-glucose-PET (FDG PET), at University Hospitals Leuven. We identified 48 C9orf72-ALS and 22 SOD1-ALS patients. After propensity score matching, two cohorts of 48 and 21 matched sporadic ALS patients, as well as 20 healthy controls were included. FDG PET images were assessed using a voxel-based and volume-of-interest approach. We observed widespread frontotemporal involvement in all ALS groups, in comparison to healthy controls. The degree of relative glucose metabolism in SOD1-ALS in motor and extra-motor regions did not differ significantly from matched sporadic ALS patients. In C9orf72-ALS, we found more pronounced hypometabolism in the peri-rolandic region and thalamus, and hypermetabolism in the medulla extending to the pons, in comparison to matched sporadic ALS patients. Our study revealed C9orf72-dependent differences in glucose metabolism in the peri-rolandic region, thalamus, and brainstem (i.e., medulla, extending to the pons) in relation to matched sporadic ALS patients.

1. Introduction

The multifaceted clinical syndrome of amyotrophic lateral sclerosis (ALS) presents with rapidly progressing neurodegeneration in motor and extra-motor regions and is usually fatal within 2–5 years after disease onset [1]. The disorder is characterized by varying phenotypic manifestations with degeneration of both upper motor neurons (UMN) in the motor cortex and lower motor neurons (LMN) in the brainstem and spinal cord [2]. This leads to progressive muscle weakness and paralysis. ALS has an average age of onset of 55–65 years, and an incidence of 1.5–2.7 per 100,000 inhabitants per year [1].
Even though most patients with ALS have a form of the condition that is described as sporadic, which means there is no apparent family history of the disorder, approximately 10% of patients have a familial form of ALS (fALS). In about 60–80% of fALS and 10% of sporadic ALS, gene mutations of large effect, with autosomal dominant inheritance, are present [1,2].
The most prevalent identified cause of ALS found in patients of European descent is a hexanucleotide repeat expansion (HRE) in the C9orf72 gene (OMIM 614260), accounting for 40–60% of fALS cases and 5–10% of apparently sporadic ALS cases [3,4]. C9orf72-associated ALS (C9orf72-ALS) is characterized by a wide range of phenotypic presentations, including a pure frontotemporal dementia (FTD) phenotype. Compared to sporadic ALS, ALS patients with a C9orf72 HRE more frequently present with bulbar onset and with cognitive and behavioral deficits [5]. Site of onset, age at onset, clinical presentation, disease progression, and (the extent of) cognitive impairment varies considerably within and across families [6,7,8].
Variants in the Cu/Zn superoxide dismutase-1 gene (OMIM 147450) are the second most common cause of ALS and account for 12–24% of fALS cases and 1% of apparently sporadic ALS cases, in populations of European descent [9,10,11,12,13,14,15]. Thus far more than 200 pathogenic mutations are reported in the Human Genome Mutation Database [10,16,17]. From a clinical point of view, SOD1-associated ALS (SOD1-ALS) is characterized by marked phenotypic variability. Some monogenetic causes are associated with a shorter survival (e.g., Ala5Val mutation), while other variants more commonly found in Western and Southern Europe are associated with a slower disease progression [10,11,12,13]. Cognitive involvement in SOD1-ALS is seldomly reported. A recent study however suggested that behavioral changes may be more common than previously thought among patients harboring SOD1 variants [18].
Other “major” ALS-causing gene mutations are mutations in TAR DNA-binding protein 43 (TARDBP-ALS) and in fused in sarcoma (FUS-ALS), each accounting for 1–5% of fALS cases [19,20].
Brain imaging is increasingly used to measure ALS-associated changes in vivo. Previous studies provided evidence of the diagnostic value of 18F-2-fluoro-2-deoxy-D-glucose-PET (FDG PET) in ALS, as peri-rolandic and variable prefrontal hypometabolism is found in most patients [21,22,23,24]. In addition, it appears to correlate with (the extent of) cognitive involvement and the presence of concomitant FTD, and has associated prognostic value [25].
Little research, however, has been done into the cerebral glucose metabolic correlates of monogenic forms of ALS. FDG PET studies that investigated the metabolic correlates associated with a C9orf72 HRE reported inconsistent findings concerning the extent of cortical involvement in C9orf72-ALS [21,26,27,28]. One study involving C9orf72-ALS patients described extensive and more widespread cortical hypometabolism in C9orf72-ALS than in sporadic ALS [26]. However, this finding was not replicated in two other studies [21,28]. To our knowledge, only one study reported on glucose metabolic changes in SOD1-ALS [29]. This FDG PET study by Canosa et al. described a cluster of relative hypermetabolism in the peri-rolandic region in SOD1-ALS patients in relation to sporadic ALS patients and healthy controls [29].
In this study, we investigated the glucose metabolic pattern associated with the two most prevalent monogenic causes of ALS in a large cohort, with a particular focus on comparing patterns of significant relative hypo- and hypermetabolism between familial and sporadic ALS.

2. Materials and Methods

The local Ethical Committee of the University Hospitals Leuven approved this study (s50354). Informed consent was obtained from all subjects in accordance with the Declaration of Helsinki.

2.1. Subjects

2.1.1. Healthy Controls

The healthy control population (HC) (n = 20; mean age ± SD, 62.4 ± 6.4 y, 8M/12F) was the same as that used in a previous FDG PET study [21].

2.1.2. Patients

A total number 538 incident patients were recruited from the Neuromuscular Clinic in the University Hospitals Leuven between October 2010 and October 2022. All patients were diagnosed by an experienced neurologist specialized in neuromuscular disorders, using the revised El Escorial and Awaji-Shima criteria [30], and underwent a diagnostic 18F-2-fluoro-2-deoxy-D-glucose-PET (FDG PET).
Out of the 538 patients, we considered 533 participants for this study. We excluded five participants because of comorbidities (brain cyst (n = 1), spastic paraparesis (n = 2), cerebrovascular accident (n = 2)).
In 84 patients with ALS, a pathogenic mutation was found, known to be associated with ALS. Most commonly, we found a C9orf72 HRE (n = 48, 57%), followed by a mutation in the SOD1 gene (n = 22; 26%), a mutation in the TARDBP gene (n = 7; 8%), a mutation in the FUS gene (n = 5; 6%), and lastly, a dual C9orf72 and TARDBP gene mutation (n = 2; 2%). Given the limited sample size of the three latter groups, they were not considered for further analyses.

2.2. Propensity Score Matching

The aim of this approach was to balance the selected covariance between the cohorts of observational data to minimize the effect of confounding factors. From an initial group of 449 sporadic ALS patients, we performed propensity score matching (PSM) [31,32] using a logistic regression model based on the following six variables: age at FDG PET, sex, King’s disease stage, diagnostic delay, the extent of lower vs. upper motor neuron involvement at diagnosis, and scanner type. Case-control matching for scanner type was performed, such that scanner type would not bias observed differences in the cerebral glucose metabolism. One-to-one pair matching was performed without replacement, using a caliper of 0.20.
The algorithm matched 48 C9orf72-associated ALS patients and 21 out of 22 SOD1-associated ALS patients to an equal number of sporadic ALS patients. One patient displayed a distinct phenotype of rapidly progressive respiratory onset ALS at a young age. A similar phenotype has not been observed before in our cohort of sporadic ALS patients.
The total study population consisted of 48 patients with C9orf72-associated ALS (C9orf72-ALS), 48 sporadic ALS patients matched to the C9orf72-ALS patient cohort (C9orf72-matchedsALS), 22 patients with SOD1-associated ALS (SOD1-ALS), 21 sporadic ALS patients matched to the SOD1-ALS cohort (SOD1-matchedsALS), and 20 healthy controls.

2.3. Assessment of Clinical Functioning

The clinical assessment at diagnosis and revised Amyotrophic Lateral Sclerosis Functional Rating Scale (ALSFRS-r) were utilized to perform King’s clinical staging [33].

2.4. Image Analysis

2.4.1. PET Acquisition and Reconstruction

All scans were acquired during the diagnostic work-up of patients. All subjects fasted at least 6 h before [18F] FDG injection. FDG PET scans were acquired using an ECAT HR+ camera (Siemens), a Biograph 16 HiRez PET/CT camera (Siemens), or a Biograph 40 Truepoint PET/CT camera (Siemens). In all cases, a bolus of [18F] FDG was injected intravenously under standard conditions: lying in a dimly lit, quiet room with eyes and ears open.
PET acquisitions were performed in list mode thirty minutes after injection. Images were acquired dynamically for 30 min on the ECAT HR+ (3D mode) and for 15–20 min on the HiRez and Truepoint (3D and listmode). During the acquisition, the patient’s head was immobilized with a vacuum pillow or headholder. All images were corrected for attenuation, scatter, and decay.
On the ECAT HR+, images were corrected for attenuation with the attenuation map, acquired with a transmission scan using 68Ge/68Ga rod sources, and projection data were reconstructed using 3-dimensional filtered back projection with a Hanning post-filter. On the HiRez and Truepoint, images were reconstructed using ordered-subset expectation maximization (OSEM) with 5 iterations over 8 subsets and 3 iterations over 21 subsets, respectively, with an 8 mm Gaussian kernel.

2.4.2. FDG PET Image Analysis

All scans were spatially normalized to Montreal Neurological Institute (MNI) space using a FDG PET template (SPM12; Welcome Trust Centre for Neuroimaging), implemented in Matlab (R2020b, The MathWorks Inc., Natick, MA, USA), and nonrigid registration with 16 iterations, in voxels of 2 mm × 2 mm × 2 mm. Isotropic Gaussian smoothing with full width at half maximum of 8 mm was performed, followed by proportional scaling to the mean uptake value within a brain mask, obtained by applying a relative threshold masking of 0.8 in the healthy control group.
Voxel-based findings were corroborated with an atlas-based volume-of-interest (VOI) analysis using the N30R83 Hammers probabilistic atlas and the Automated Anatomical Labeling (AAL) single-subject atlas implemented in PNEURO (PMOD, v3.7, PMOD Inc., Zurich, Switzerland) [34]. The AAL single-subject atlas was used to delineate the midbrain, pons, and medulla, enabling a more detailed delineation of the entire brainstem [35]. Standardized uptake value ratio (SUVR) values were calculated, by scaling the mean uptake in VOIs to the average grey matter activity to obtain relative metabolic activity.

2.5. Statistical Analysis

General statistics were done using SPSS 28.0 (SPSS Inc. Chicago, IL, USA). Data are presented as median (interquartile range). Normality of the distributions of the clinical data was assessed with a Shapiro–Wilk test (α = 0.05). For statistical comparisons, we used the χ2 test for categorical variables, or Kruskal–Wallis test for continuous variables. Survival was estimated using the Kaplan–Meier method and compared using log-rank tests, with Bonferroni-corrected post hoc pairwise comparisons.
For the voxel-based analyses, we used an analysis of variance (ANOVA) model, using the SPM12 toolbox, implemented in Matlab, to assess the effect of genetic status on cerebral glucose metabolic uptake. Statistical significance for the voxel-based analyses was set at puncorr < 0.001, combined with a pFWE < 0.05 at the cluster level, unless otherwise specified.
VOI-based independent Mann–Whitney U tests were conducted to determine if there were statistically significant differences in relative metabolic activity between C9orf72-ALS and C9orf72-matchedsALS, and between SOD1-ALS and SOD1-matchedsALS. We also compared each disease group to the healthy control group. We evaluated 37 regions, and the Benjamini–Hochberg procedure was used to control the false discovery rate (FDR) at 0.05 [36].

3. Results

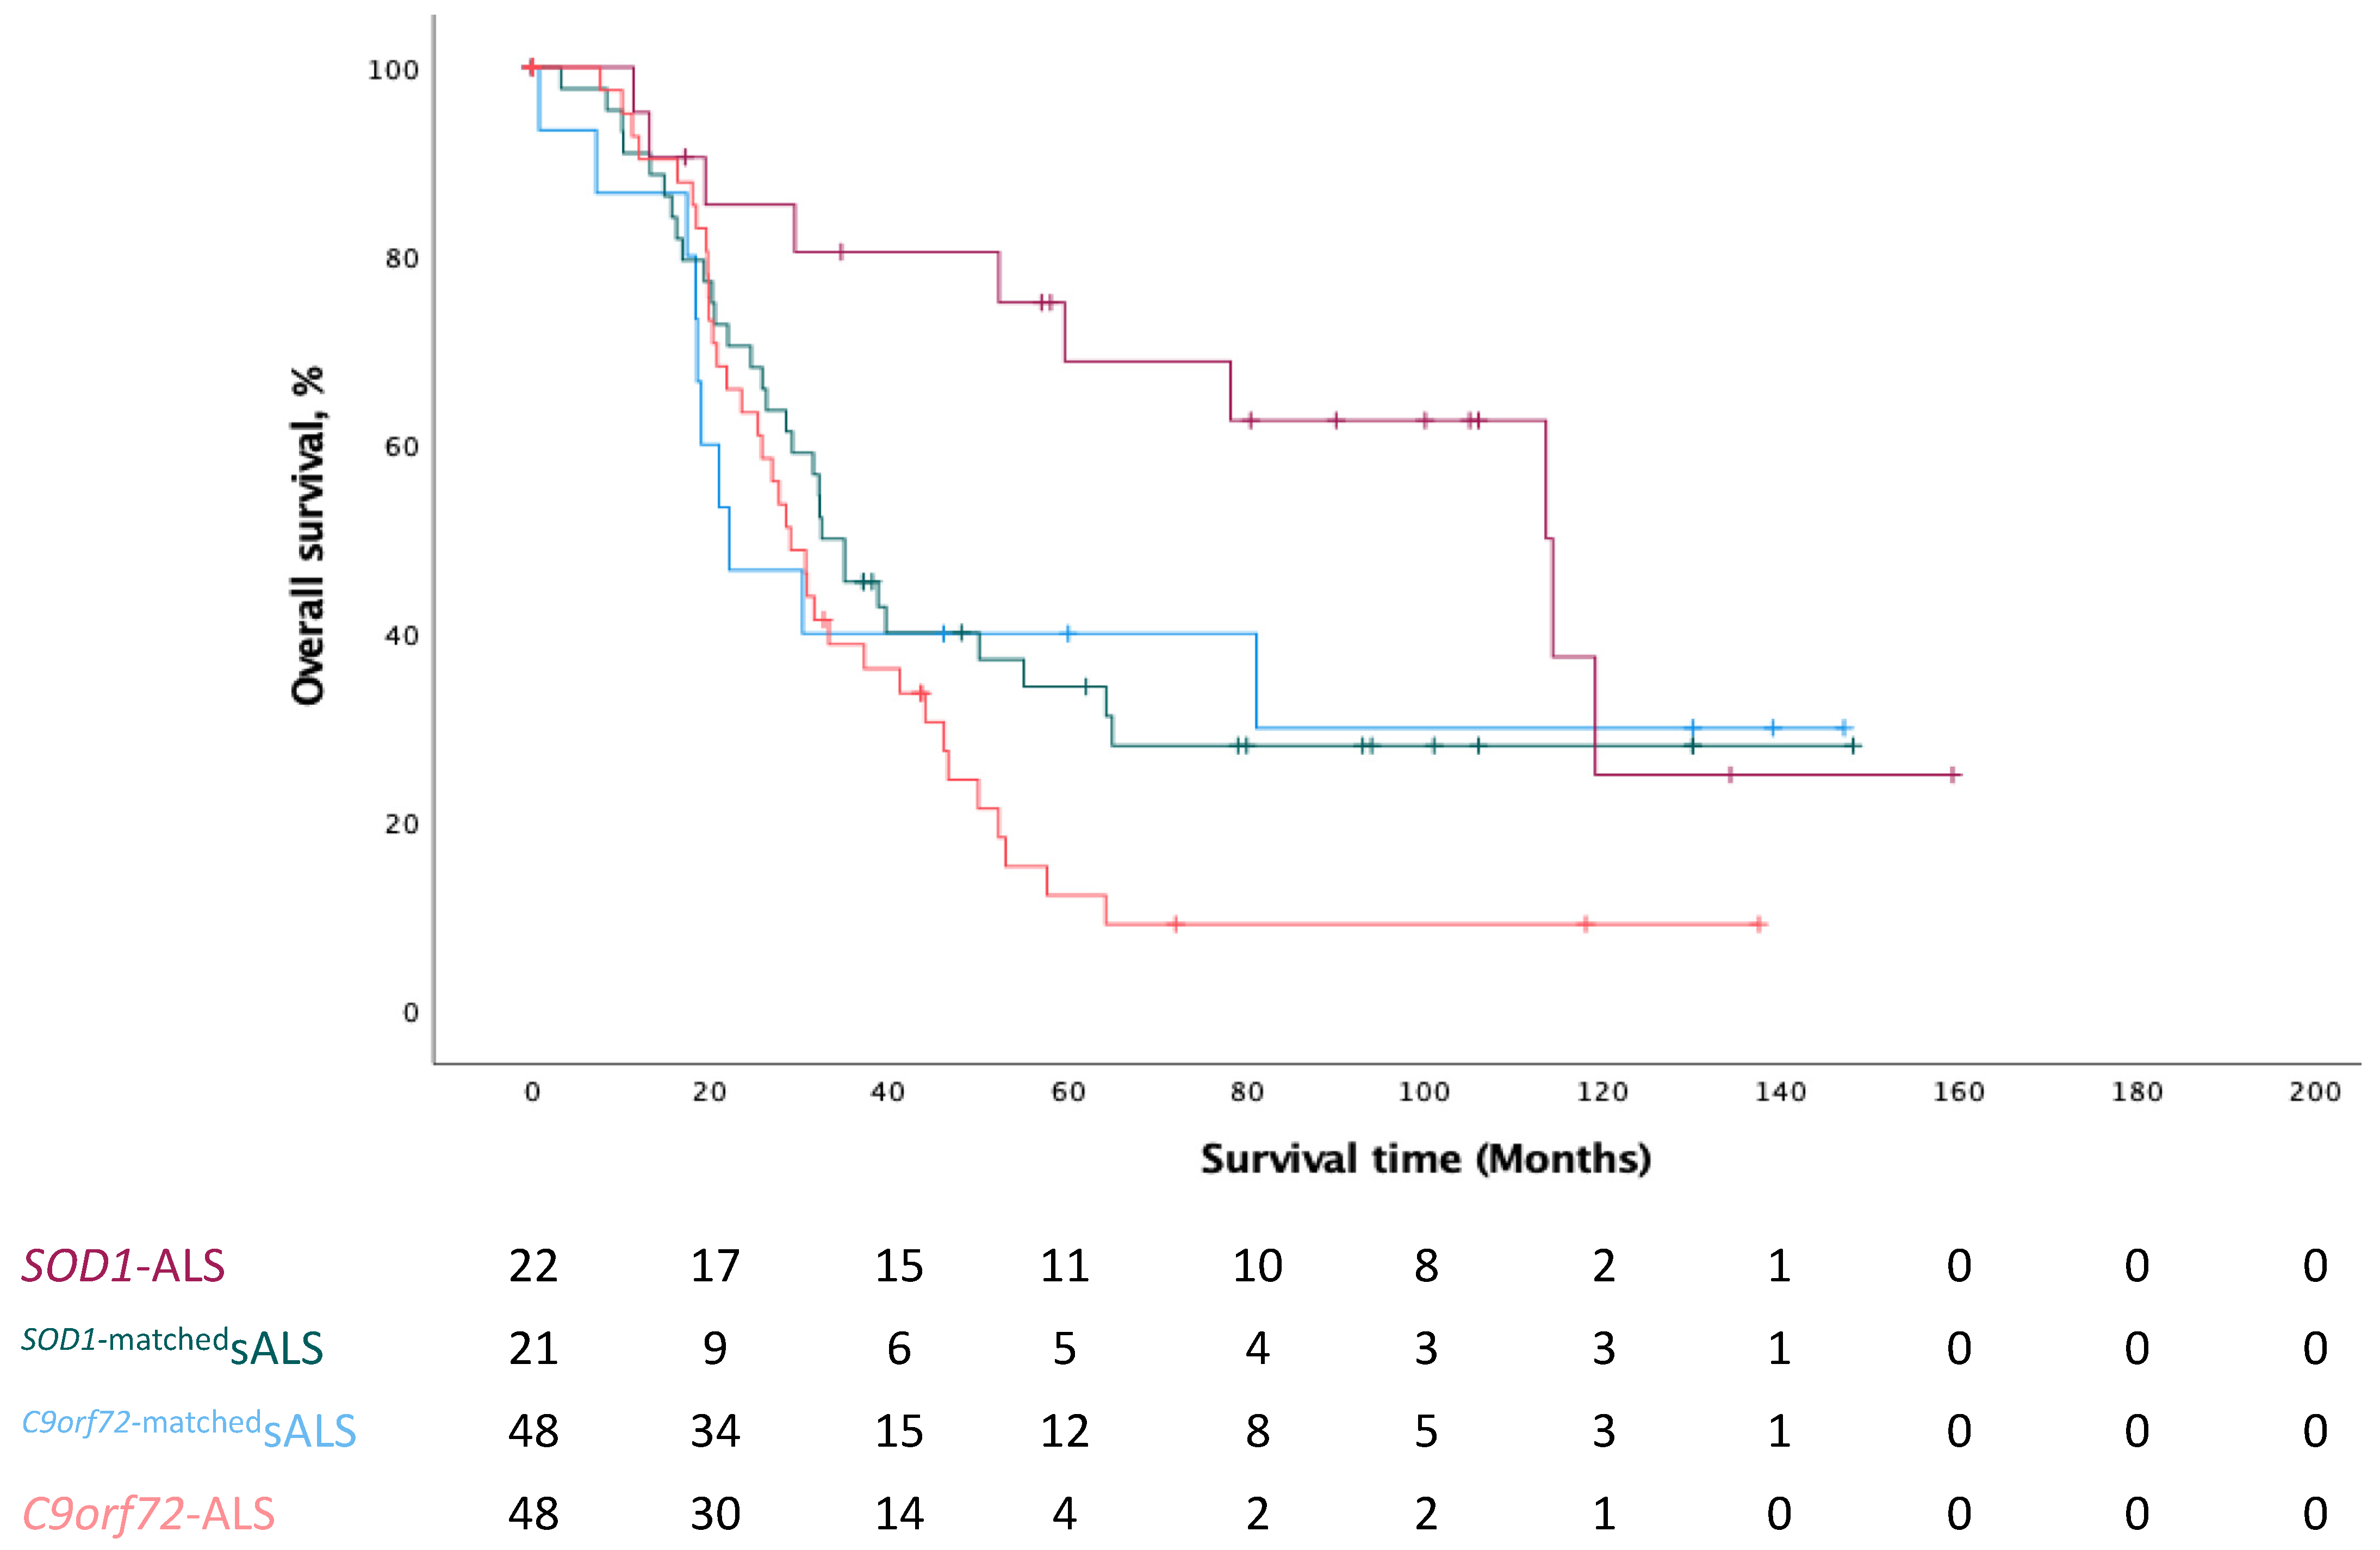
3.1. Demographics and Clinical Characteristics

In total, 48 C9orf72-associated ALS patients (C9orf72-ALS), 22 SOD1-associated ALS patients (SOD1-ALS), and 69 matched sporadic ALS patients (C9orf72-matchedsALS, n = 48; SOD1-matchedsALS, n = 21) were included, with a median age of 59 years (range, 29–84 years). The median injected [18F] FDG activity was 149 MBq (range, 106–283 MBq).
As we know that the disease progression rate between C9orf72-ALS and SOD1-ALS differs significantly, we employed propensity score matching to obtain “artificial sporadic ALS control cohorts”, matched to our C9orf72-ALS and SOD1-ALS cohorts. A comparative analysis did reveal a statistically significant difference in diagnostic delay (p < 0.001) between different ALS disease groups. Detailed demographics and clinical characteristics of each group are reported in Table 1.
As the disease progression rate between C9orf72-ALS and SOD1-ALS differs substantially, we compared survival rate between all four groups. A log rank test (Mantel–Cox) revealed that the survival distribution for the four ALS patient groups was significantly different, χ2(3) = 11.130, p = 0.011 (Figure 1). Pairwise comparisons revealed a significant difference between the unmatched genetic groups, SOD1-ALS and C9orf72-ALS, χ2(1) = 13.922, p = 0.0002 (Figure 1, Table 1). SOD1-ALS patients had a median survival time of 114 months, while C9orf72-ALS patients had a median survival time of 29 months and matched sporadic ALS patients had a median survival time of 22 months (SOD1-matchedsALS) and 32 months (C9orf72-matchedsALS).
A log rank test revealed a significantly different distribution in survival for the different ALS groups, χ2(3) = 11.130, p = 0.011. Log rank pairwise comparisons were done with a Bonferroni correction, with statistical significance accepted at the p < 0.0125 level. There was a significant difference in survival distribution for SOD1-ALS and C9orf72-ALS patients (p = 0.0002).

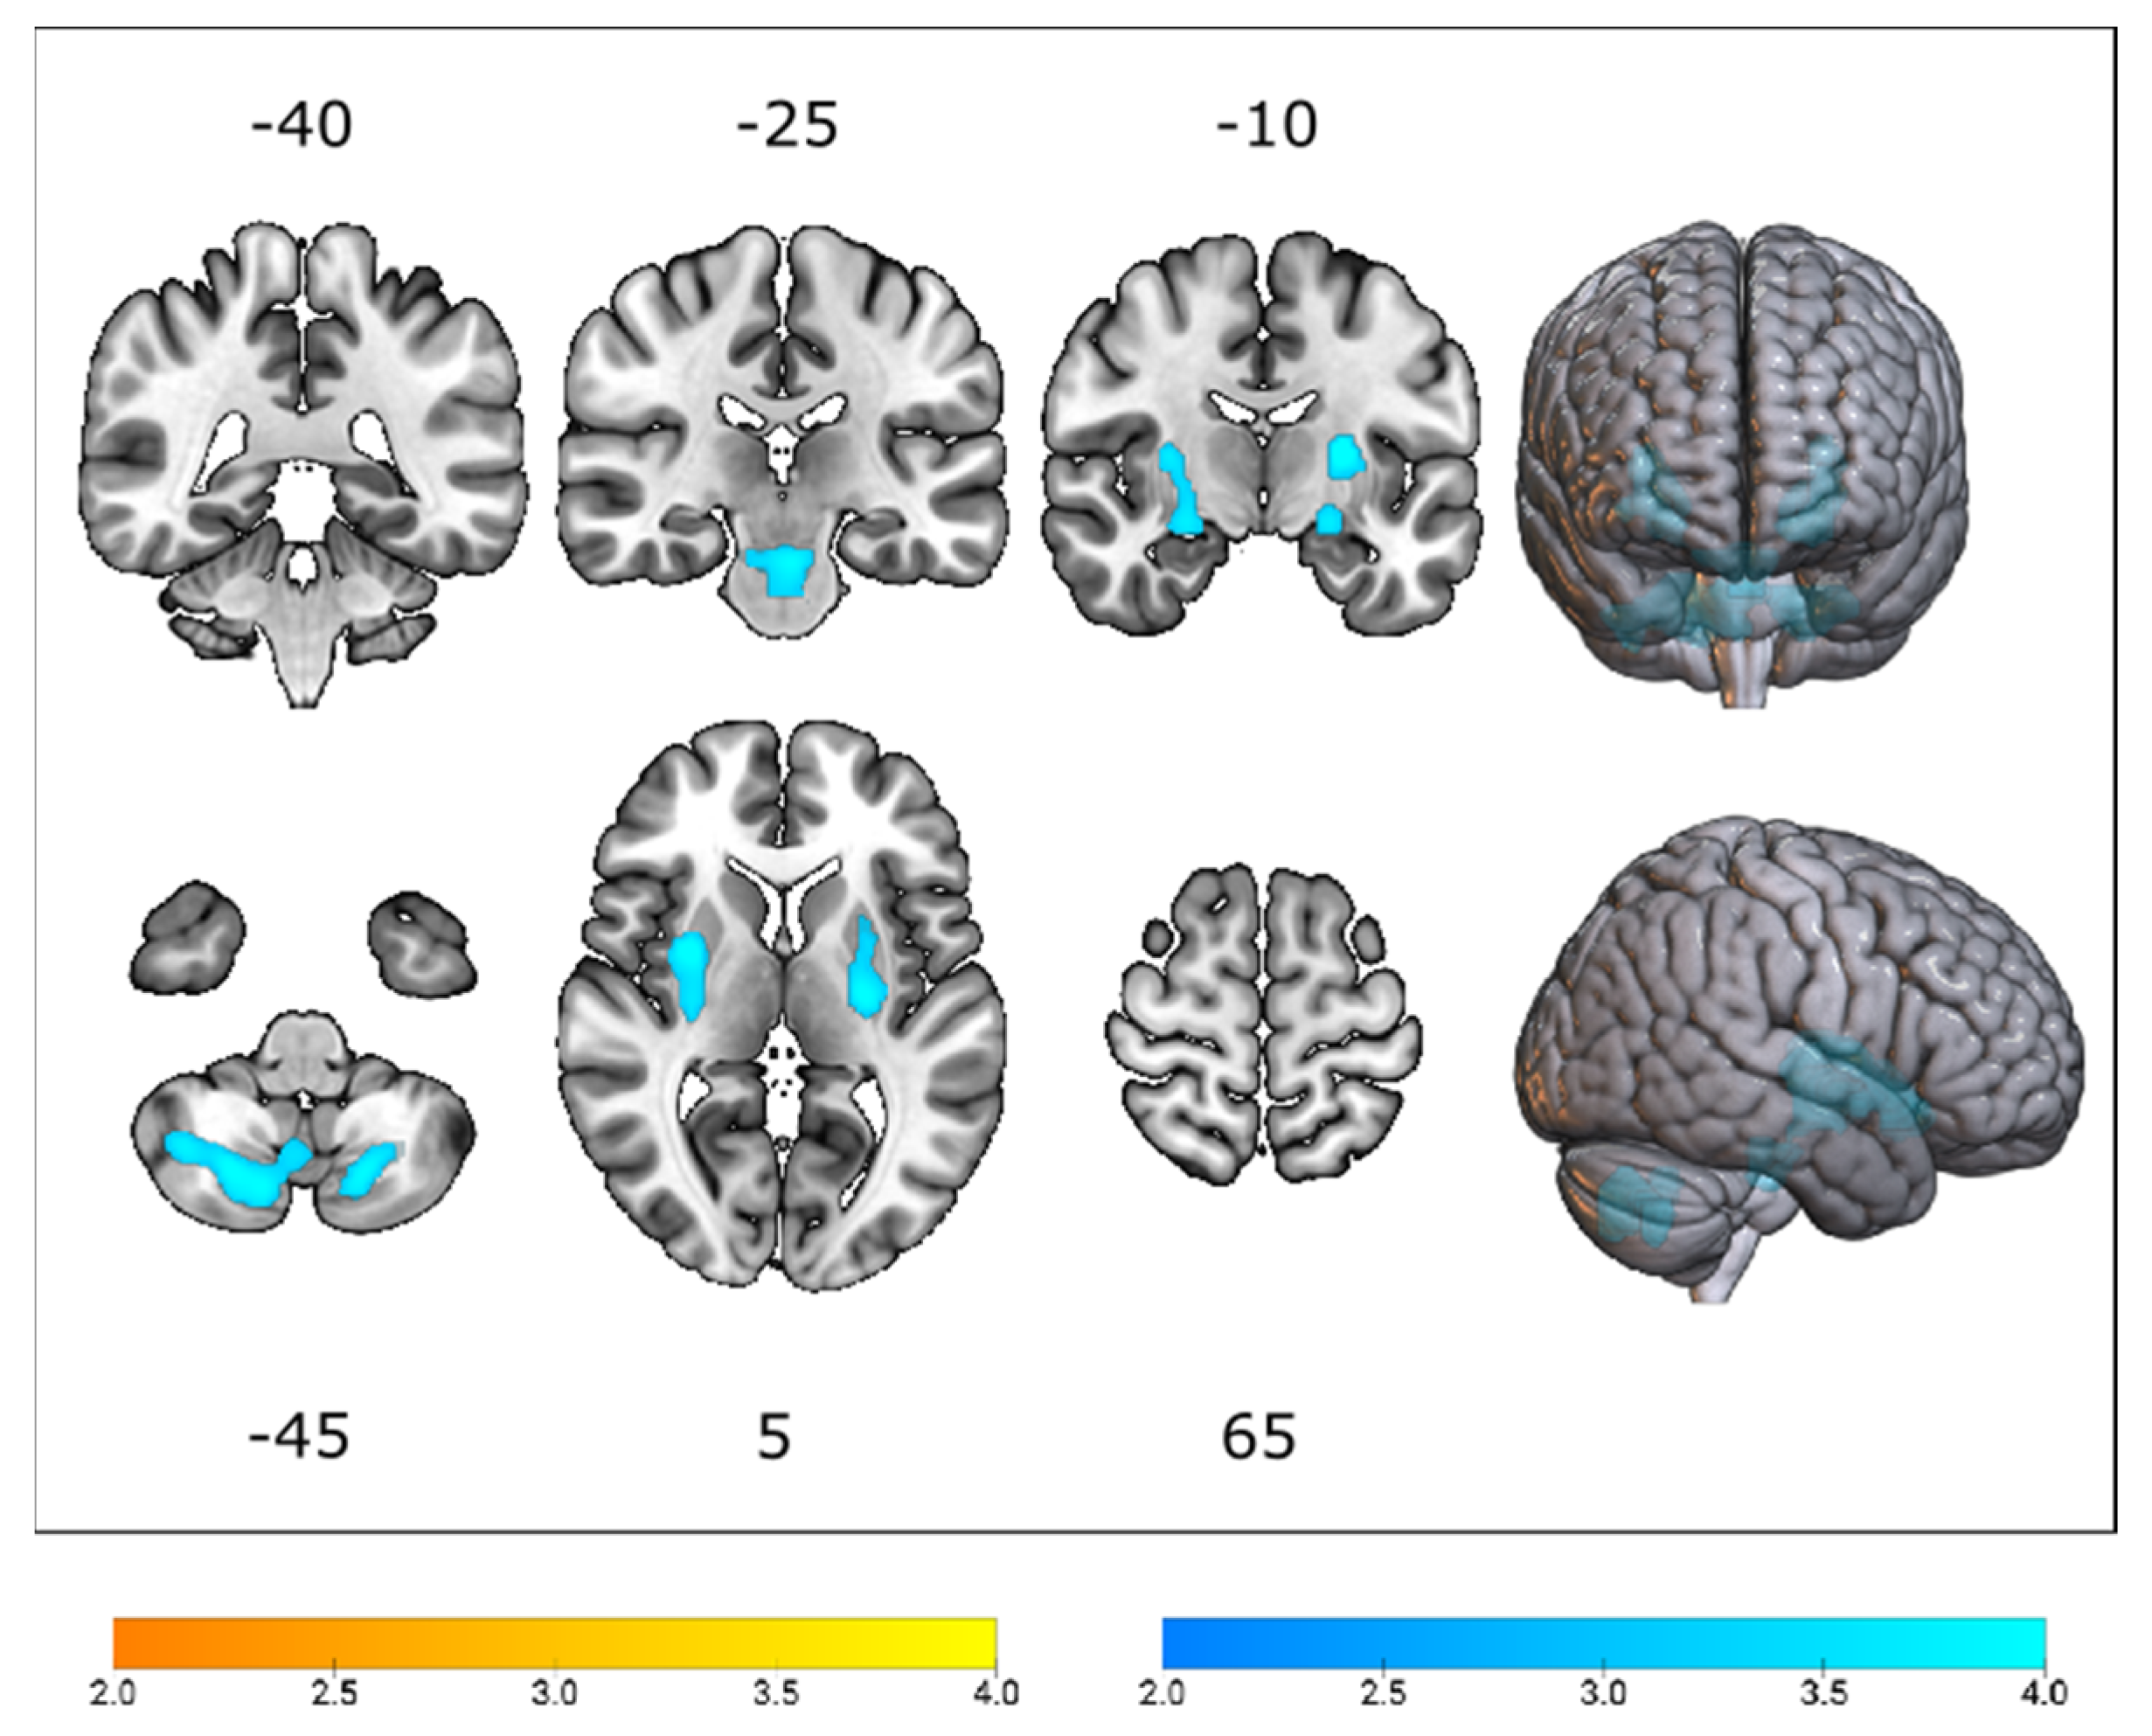
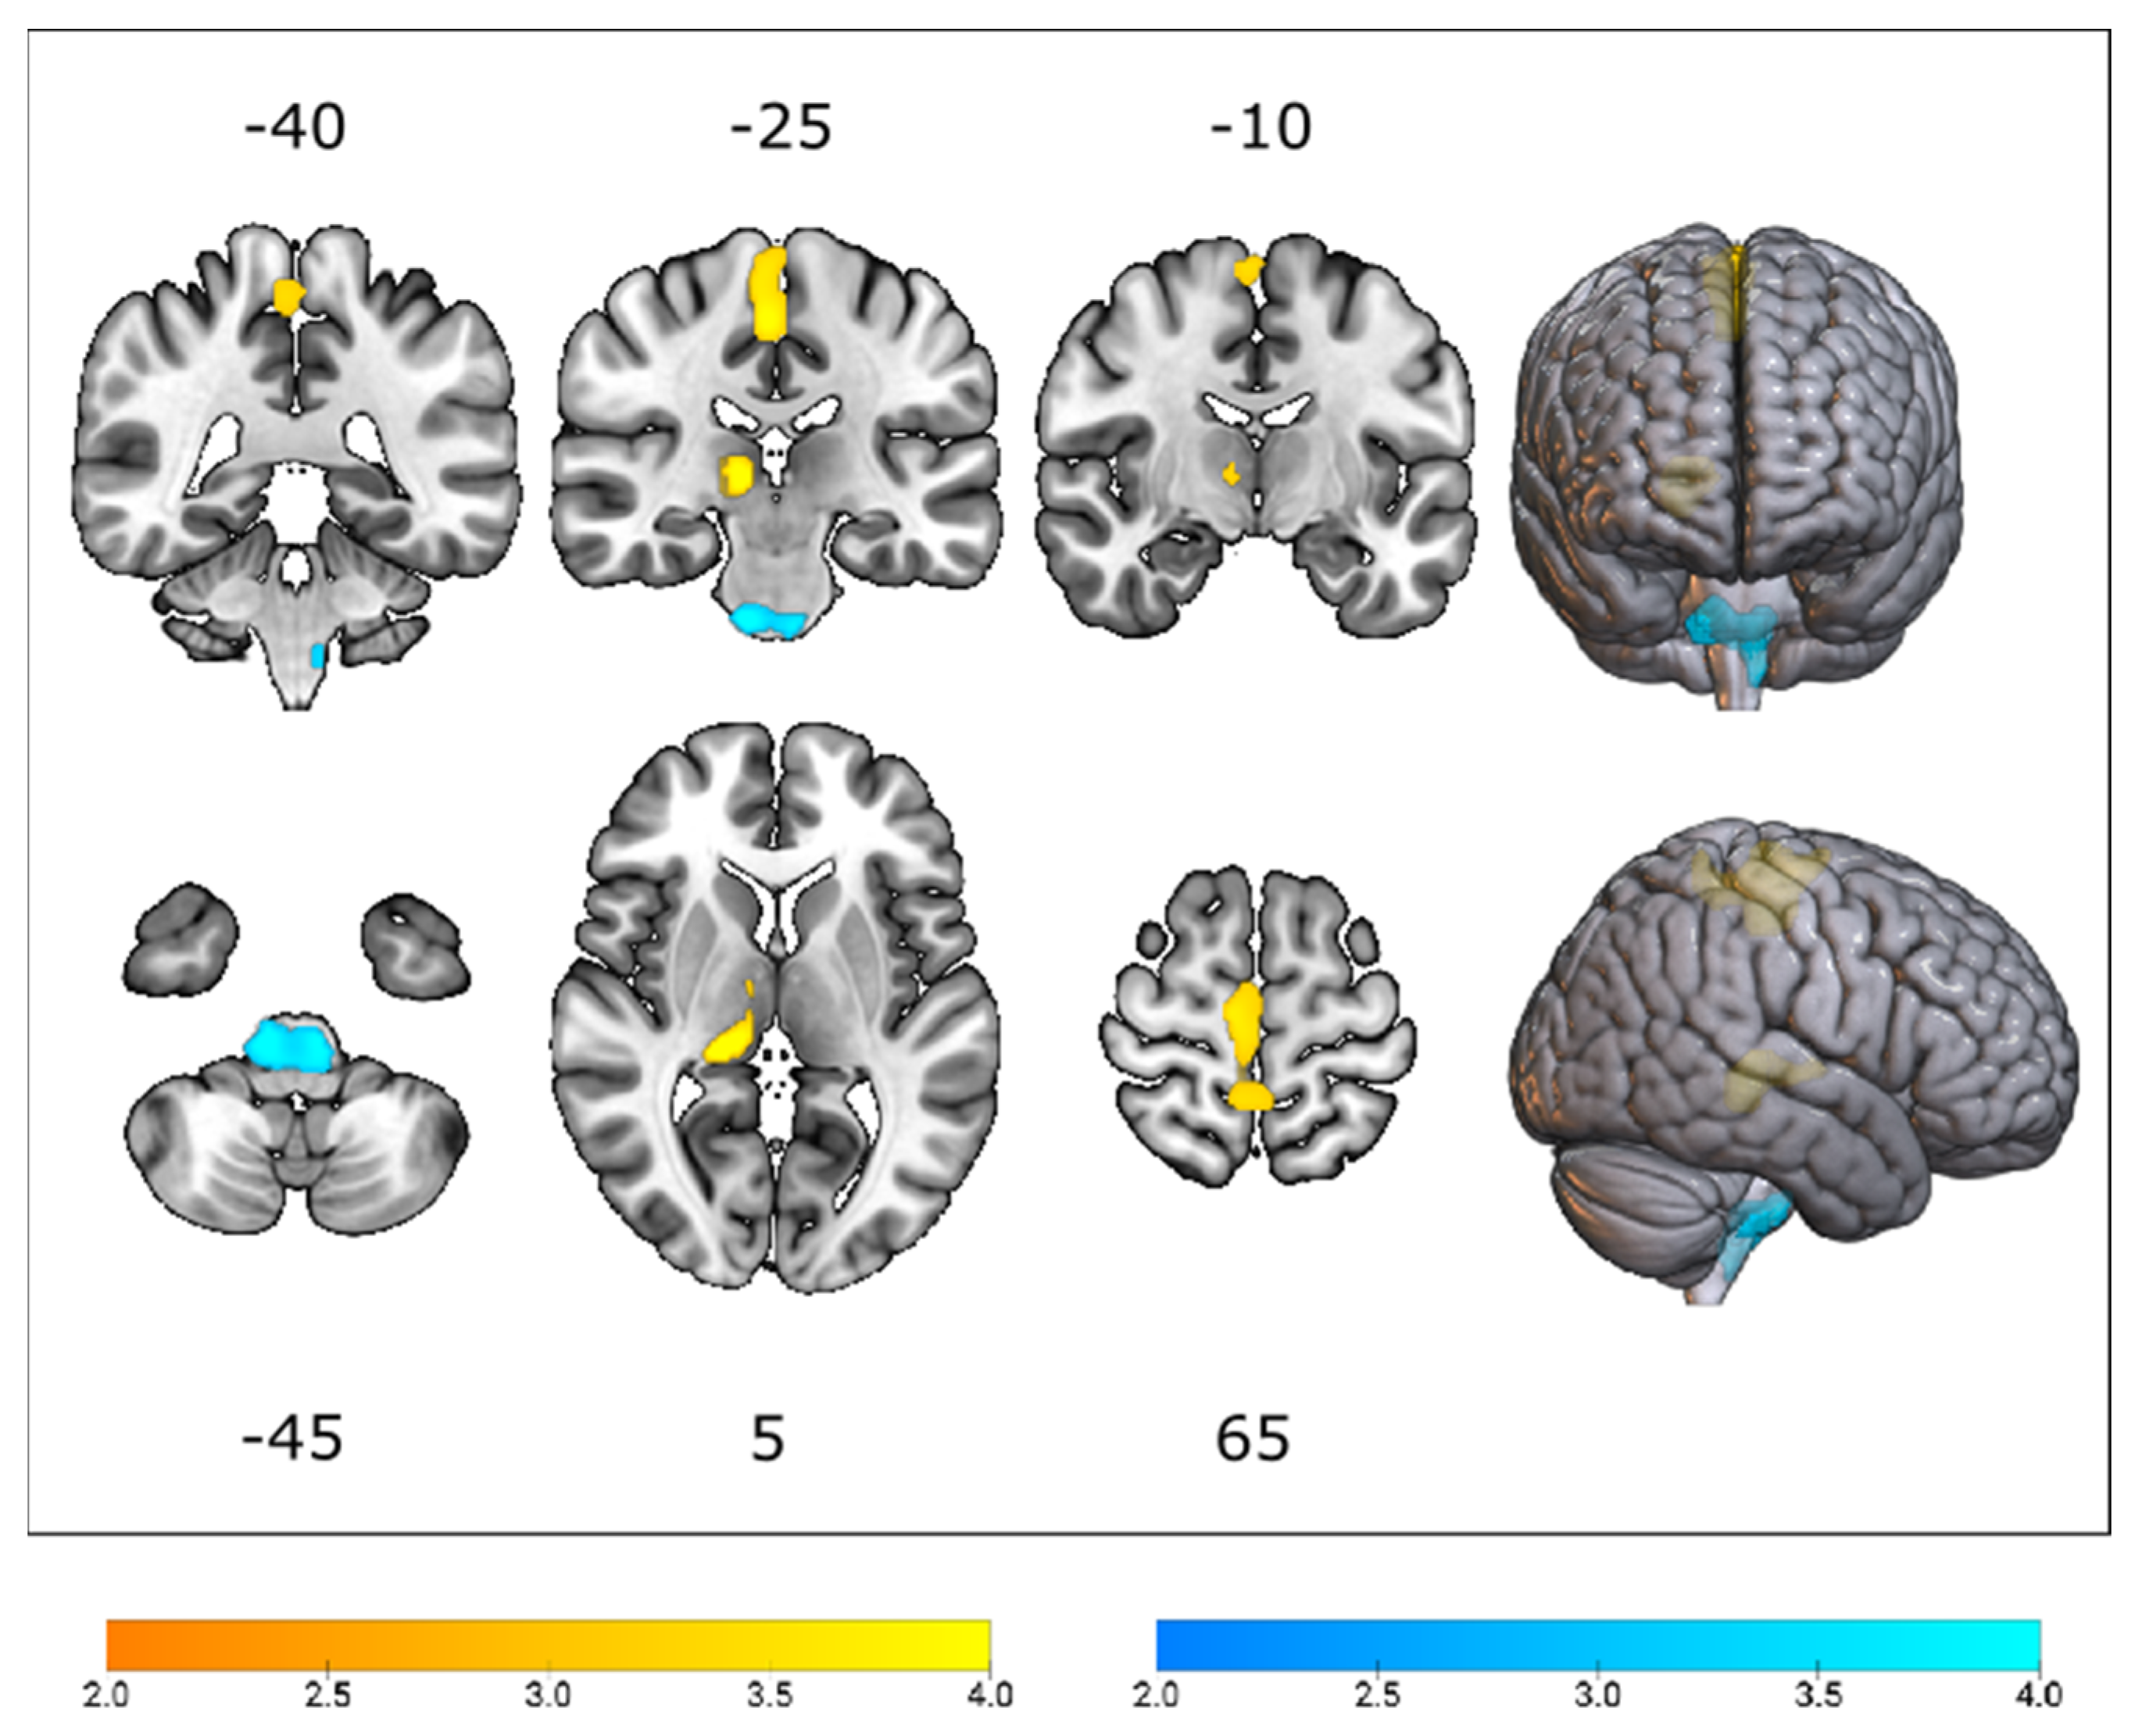
3.2. Cerebral Glucose Metabolic Changes between Different Genotypes

Voxel-based comparative analyses between C9orf72-ALS and SOD1-ALS patients revealed clusters of relative hypermetabolism in the brainstem (i.e., pons, extending to the midbrain) and cerebellum of C9orf72-ALS patients and relative hypometabolism bilaterally in the basal ganglia of SOD1-ALS patients (Figure 2 and Table S1).
The results of the VOI-based Mann–Whitney U test (Table 2, Figure S3) corroborated our findings at the voxel level in the basal ganglia (i.e., lentiform nucleus), brainstem (i.e., pons and midbrain), and cerebellum. In addition, the VOI-based comparative analysis revealed a significant difference in FDG uptake between C9orf72-ALS and SOD1-ALS patients in the peri-rolandic region, posterior cingulate gyrus, thalamus, and medulla.

3.3. Differences in Cerebral Glucose Metabolism between ALS Groups and Healthy Controls

We compared all ALS groups to a group of healthy controls. This revealed significantly reduced glucose metabolism in fronto-insular, temporal, parietal, and occipital cortices, the amygdala, basal ganglia, and thalamus in all ALS groups (Figures S1 and S2, Tables S2–S4). Hypermetabolism was observed in the cerebellum in C9orf72-ALS, SOD1-ALS, and C9orf72-matchedsALS patients and in the brainstem in C9orf72-ALS patients.

3.4. Effect of Genetic Status on Cerebral 18F FDG Uptake

Voxel-based comparative analyses between C9orf72-ALS and C9orf72-matchedsALS patients, and between SOD1-ALS and SOD1-matchedsALS patients, revealed two significant clusters of relative hypometabolism and one cluster of relative hypermetabolism in C9orf72-ALS patients in relation to C9orf72-matchedsALS patients.
This study demonstrated that C9orf72-ALS was associated with reduced glucose metabolism in the peri-rolandic region, extending to the precuneus, and the right thalamus, as well as increased glucose metabolism in the brainstem (i.e., medulla, extending to the pons), in relation to the C9orf72-matchedsALS group (Figure 3; Table S5).
Voxel-based analyses between SOD1-ALS and SOD1-matchedsALS groups revealed no significant clusters of relative hypo- or hypermetabolism. The results of the VOI-based Mann–Whitney U test (Table 3 and Table 4, Figure S3) corroborated our findings at the voxel level.

4. Discussion

The primary objective of this study was to investigate the effect of major gene mutations causative for ALS on cerebral glucose metabolism. The considerable variability in the phenotypic expression of ALS that is reflected in familial and sporadic ALS [8] makes comparative analyses between subgroups of ALS patients challenging.
To ensure that any differences in cerebral glucose metabolism between genotypes and sporadic ALS patients were not driven by population diversity, we matched C9orf72-ALS and SOD1-ALS patients to our cohort of sporadic ALS patients, using propensity score matching.
Comparing two genetic subtypes of ALS (i.e., C9orf72-ALS and SOD1-ALS) and their respective matched cohorts of sporadic ALS patients (i.e., C9orf72-matchedsALS and SOD1-matchedsALS) readily revealed more pronounced hypometabolism in the peri-rolandic region, extending to the precuneus, and thalamus, as well as hypermetabolism in the brainstem (i.e., medulla, extending to the pons), in C9orf72-ALS, when compared to C9orf72-matchedsALS.

4.1. The Effect of C9orf72 Status on Cerebral Glucose Metabolism

Previous research has produced contradictory research findings about the glucose metabolic signature in patients with a C9orf72 HRE [21,26,27,28]. The study by Van Laere et al. produced no significant differences between C9orf72-ALS and sporadic ALS [21], while the study by Diehl-Schmid et al. reported reduced glucose metabolism confined to the thalamus [28] in C9orf72-FTD and sporadic FTD.
Another study by Cistaro et al., on the other hand, described widespread reduced glucose metabolism in the left frontal and superior temporal cortices, the bilateral anterior and posterior cingulate cortex, insula, caudate, and thalamus, in C9orf72-ALS in comparison to sporadic ALS, and relative hypermetabolism in the midbrain, bilateral occipital cortex, globus pallidus, and left middle and inferior temporal cortices [26].
To overcome the challenge of selection bias that might occur due to the nature of retrospective studies and to minimize the effect of confounding factors, we studied the cerebral glucose metabolic pattern of 48 ALS patients with a C9orf72 HRE in relation to a group of matched sporadic ALS patients, using PSM.
The clusters of significantly reduced glucose metabolism in the peri-rolandic region, extending to the precuneus, and thalamus suggest that both the thalamus and the peri-rolandic region play a key role in C9orf72-mediated disease [26,27,28,37]. Reduced FDG uptake in C9orf72-ALS patients can reflect multiple neurobiological underpinnings, such as reduced excitability [38], synapse loss [39], and neurodegeneration. Mitochondrial dysfunction [40] may also contribute to the observed changes, as a recent study employing the [18F]2-tert- butyl-4-chloro-5-2H- pyridazin-3-one (BCPP-EF) radioligand for mitochondrial complex demonstrated that mitochondrial complex I reduction can be linked to a range of downstream neurodegenerative processes, such as hypometabolism. Follow-up PET studies with [18F]BCPP-EF and [18F]FDG would enable in vivo investigation of dysfunction of mitochondria and its relation to hypometabolism in C9orf72-ALS [41].
Thalamic involvement may not only be one of the earliest features of C9orf72-mediated disease, as demonstrated by PET studies in presymptomatic C9orf72 HRE carriers [37,42], but also one of the regions that is most severely affected by the disorder.
In comparison with healthy controls, we found relative hypermetabolism in the cerebellum, the medial temporal lobe, and the medulla, extending to the pons in C9orf72-ALS. Cerebellar and medial temporal hypermetabolism appears relatively prominent but not specific to C9orf72-ALS, as we found significant changes in the medulla (extending to the pons) when compared to matched sporadic ALS patients.
The neurobiological processes that underlie hypermetabolism in these regions remain to be elucidated. Various theories have been proposed to explain this observation, such as the normalization procedures used [21], recruitment of neural networks as a localized inflammatory response [21,24,25,43], or even a compensatory neuronal mechanism as the frontal regions (including the primary motor cortex) degenerate [44].
Indeed, unlike previous observations in C9orf72-associated FTD [27,28], we observed that the medulla was significantly hypermetabolic in C9orf72-ALS patients when compared to C9orf72-matchedsALS patients. A human autopsy study already demonstrated that C9orf72-ALS cases had more severe microglial pathology in the medulla compared to ALS cases without a C9orf72 hexanucleotide repeat expansion [45]. Relative hypermetabolism in this region may thus represent neuroinflammation associated with activated astrocytes or microglia [46]
This significant hypermetabolism in the medulla may be associated with a more aggressive disease phenotype in patients with a C9orf72 hexanucleotide repeat expansion [47,48,49], as a recent study with FDG PET/MRI demonstrated that medulla hypermetabolism is associated with shortened survival [50].

4.2. The Effect of SOD1 Status on Cerebral Glucose Metabolism

In our study, we found no significant differences in cerebral glucose metabolism between SOD1-ALS patients and matched sporadic ALS patients. Moreover, a comparison to healthy controls revealed a pattern of widespread relative hypometabolism in frontal, temporal, parietal, and subcortical regions (including basal ganglia and thalamus) in SOD1-ALS, resembling the glucose metabolic pattern observed in sporadic ALS [21,23,51,52].
Our findings are in line with several postmortem studies that described lesions of the (extrapyramidal) motor and nonmotor systems in SOD1-positive cases, including subcortical structures as well as frontotemporal cortices [53,54]. A recent study also revealed that behavioral changes are more commonly found in patients carrying SOD1 variants than previously thought [18].
In past years, a few in vivo neuroimaging studies have been conducted in SOD1-associated ALS. Two volumetric imaging studies demonstrated similar cerebral volumetric measurements between SOD1-ALS patients and sporadic ALS patients [55,56]. Two PET imaging studies using [11C]Flumazenil and [11C]WAY100635 described a more focal loss of GABAergic cortical inhibition and serotonergic binding differences in patients with a SOD1D91A mutation than in sporadic ALS patients [57,58]. More recently, a study employing 11C-PK11195 PET revealed widespread, diffuse cortical and subcortical increased glial activation in SOD1-associated ALS [59], comparably to what was observed in sporadic ALS [60].
A recent FDG PET study by Canosa et al. described a cluster of relative hypermetabolism in the peri-rolandic region in SOD1-ALS patients in relation to sporadic ALS patients and healthy controls [29]. Differences found between both FDG PET studies (i.e., our study and the study by Canosa et al. [29]) may be explained by the differences between the SOD1-ALS cohorts. A quarter of SOD1-ALS patients in the study by Canosa et al. had pure lower motor neuron involvement [29], a phenotype we did not observe in our cohort (Table S6). Moreover, both cohorts differed in the distribution of genetic variants, as in our cohort, the majority of SOD1 patients harbored an SOD1D91A (45%; n = 10) or SOD1G94C genetic variant (27%; n = 6) (Table S6).
Differences may also be attributed to the use of propensity score matching to minimize the impact of confounding variables. Unlike sequential bivariate matching, this technique accounts for potential multivariate interactions between the matching variables, which may introduce bias in the participant selection [31].
Nevertheless, large multicenter approaches investigating the cerebral glucose metabolism associated with different pathogenic SOD1 variants are needed to better understand the variability in disease presentations of different SOD1 mutations.
Our study has several limitations.
Firstly, subjects were scanned on three different PET cameras. Slight differences associated with CT-based versus 68Ge/Ga-based attenuation correction (especially in infratentorial areas), as well as spatial resolution may have contributed to an increased variance. However, the spatial resolution of the three scanners is highly similar. Nevertheless, case-control matching for scanner type was performed, such that scanner type would not bias observed differences in the cerebral glucose metabolism.
Secondly, the absence of individual MR images for each subject did not allow for partial volume correction. Cerebral glucose metabolism measured by PET may capture both implicit cellular metabolic functions and atrophy. However, our findings on metabolic signatures are in line with those reported in previous studies [21,23,24,26,27,28].
Thirdly, we tried to correct for confounding factors using PSM, but bias exposures are inevitable due to the respective nature of the study. PSM can account for multivariate interactions, minimizes selection error, and is better suited for smaller sample sizes [31,61].
Fourthly, due to the small sample size, we excluded the following carriers of a monogenic mutation causative for ALS in our cohort (TARDBP, n = 7; FUS, n = 5; TARDBP and C9orf72, n = 2) from all analyses.
Fifthly, we observed no significant differences between SOD1-ALS and sporadic ALS patients. We cannot exclude that between-group differences may have been washed out, due to within-group heterogeneity. This may have also reduced the power of our analyses. However, a post hoc power analysis on our cortical VOIs revealed that there was sufficient power, which suggests that the lack of significant differences may be due to a small effect size rather than to a shortage of power.
Finally, there were some discrepancies between VOI-based Mann–Whitney U tests and our voxel-based findings, possibly due to VOI dilution or our approach to multiple comparisons correction (i.e., familywise error rate versus false discovery rate (FDR)). Due to the lack of contemporaneous MRIs, the VOIS included in this analysis comprise different distributions of tissue classes at the individual level, which may potentially confound the interpretation. Secondly, the FDR is a less conservative approach to multiple comparisons correction and may result in a false-positive finding.

5. Conclusions

In conclusion, our findings demonstrate that the distribution of metabolic activity, using FDG PET, in SOD1-associated ALS resembles the changes observed in matched sporadic ALS patients, when compared to healthy controls. To enable more sensitive analyses, large multicenter approaches may aid in investigating the cerebral glucose metabolism associated with different pathogenic SOD1 variants.
Patients with a C9orf72 HRE, on the other hand, did present with significant differences in FDG uptake in the peri-rolandic region, thalamus, and brainstem (i.e., medulla, extending to the pons) compared to matched sporadic ALS patients and healthy controls. The results from the current study extend previous findings by identifying that, in addition to the thalamus, the peri-rolandic region and medulla play a key role in C9orf72-mediated ALS. Our findings support the hypothesis that ALS patients with a C9orf72 HRE demonstrate more central nervous system involvement than sporadic ALS and SOD1-associated ALS patients do.

Supplementary Materials

The following supporting information can be downloaded at: https://www.mdpi.com/article/10.3390/cells12060933/s1; Figure S1: T-statistical map detailing patterns of relative hypometabolism (yellow) and hypermetabolism (blue) (A) in C9orf72-ALS, when compared to healthy controls, and (B) in C9orf72-matchedsALS, when compared to healthy controls; Figure S2: T-statistical map detailing patterns of relative hypometabolism (yellow) and hypermetabolism (blue) (A) in SOD1-ALS, when compared to healthy controls, and (B) in SOD1-matchedsALS, when compared to healthy controls; Figure S3: Regional relative glucose metabolism in key volumes-of-interest regions in four ALS groups; Table S1: Global Cluster peak coordinates variants and statistics of relative glucose metabolism comparing C9orf72-ALS with SOD1-ALS; Table S2: Global Cluster peak coordinates variants and statistics of relative hypo- and hypermetabolism when comparing groups of ALS patients (i.e., SOD1-matchedsALS, C9orf72-matchedsALS, SOD1-ALS, and C9orf72-ALS) to healthy controls; Table S3: Volume-of-interest (VOI)-based Mann–Whitney U tests of 18F-FDG SUVR between healthy controls and C9orf72-ALS (n = 48) and matched sporadic ALS (C9orf72-matchedsALS; n = 48) patients; Table S4: Volume-of-interest (VOI)-based Mann–Whitney U tests of 18F-FDG SUVR between healthy controls and SOD1-ALS (n = 22) and matched sporadic ALS (SOD1-matchedsALS; n = 21) patients; Table S5: Global Cluster peak coordinates variants and statistics of relative glucose metabolism comparing C9orf72-ALS with C9orf72-matchedsALS; Table S6: Clinical and genetic data of ALS patients with a SOD1 gene mutation.

Author Contributions

Conceptualization, J.D.V., D.V.W., K.V.L. and P.V.D.; data curation, J.D.V., D.V.W., F.O., P.M., N.L., H.V.E., M.M., K.V.L. and P.V.D.; formal analysis, J.D.V. and P.V.D.; funding acquisition, J.D.V. and P.V.D.; investigation, J.D.V., D.V.W., K.V.L. and P.V.D.; methodology, J.D.V., D.V.W., F.O., M.D., H.V.E., M.M., M.K., P.D., K.V.L. and P.V.D.; project administration, J.D.V. and P.V.D.; resources, F.O., P.M., N.L., H.V.E., P.D., K.V.L. and P.V.D.; software, J.D.V., D.V.W., F.O., M.D., M.K., P.D., K.V.L. and P.V.D.; supervision, M.K., P.D., K.V.L. and P.V.D.; validation, J.D.V., D.V.W., M.K. and P.V.D.; visualization, J.D.V., D.V.W., F.O., M.D., M.K., P.D., K.V.L. and P.V.D.; writing—original draft, J.D.V. and P.V.D.; Writing—review and editing, J.D.V., D.V.W., F.O., P.M., N.L., M.D., H.V.E., M.M., M.K., P.D., K.V.L. and P.V.D. All authors have read and agreed to the published version of the manuscript.

Funding

This research was funded by Stichting Alzheimer Onderzoek (Grant nr: SAO-FRA 2021/0027), KU Leuven (Grant nr: PDMT2/21/083), University Hospitals Leuven, ALS Liga België, The Thierry Latran Foundation (INSPIRED).

Institutional Review Board Statement

The study was conducted in accordance with the Declaration of Helsinki and approved by the Institutional Review Board (or Ethics Committee) of University Hospitals Leuven (protocol code s50354, date: 26 January 2011).

Informed Consent Statement

Written informed consent was obtained from all alive subjects and waived for deceased patients.

Data Availability Statement

Not applicable.

Acknowledgments

Van Damme holds a senior clinical investigatorship of FWO-Vlaanderen and is supported by the E. von Behring Chair for Neuromuscular and Neurodegenerative Disorders, the ALS Liga België, and KU Leuven funds, Een Hart voor ALS, Laeversfonds voor ALS Onderzoek, and the Valéry Perrier Race Against ALS Fund. We thank all participants and their relatives for their contributions to this research.

Conflicts of Interest

P.V.D. has served in advisory boards for Biogen, CSL Behring, Alexion Pharmaceuticals, Ferrer, QurAlis, Cytokinetics, Argenx, UCB, Muna Therapeutics, Alector, Augustine Therapeutics, VectorY, Zambon (paid to institution). The other authors declare no conflict of interest.

References

  1. Van Es, M.A.; Hardiman, O.; Chio, A.; Al-Chalabi, A.; Pasterkamp, R.J.; Veldink, J.H.; Van Den Berg, L.H. Amyotrophic lateral sclerosis. Lancet 2017, 390, 2084–2098. [Google Scholar] [CrossRef] [PubMed]
  2. Masrori, P.; Van Damme, P. Amyotrophic lateral sclerosis: A clinical review. Eur. J. Neurol. 2020, 27, 1918–1929. [Google Scholar] [CrossRef]
  3. DeJesus-Hernandez, M.; Mackenzie, I.R.; Boeve, B.F.; Boxer, A.L.; Baker, M.; Rutherford, N.J.; Nicholson, A.M.; Finch, N.A.; Flynn, H.; Adamson, J.; et al. Expanded GGGGCC hexanucleotide repeat in noncoding region of C9ORF72 causes chromosome 9p-linked FTD and ALS. Neuron 2011, 72, 245–256. [Google Scholar] [CrossRef] [Green Version]
  4. Renton, A.E.; Majounie, E.; Waite, A.; Simón-Sánchez, J.; Rollinson, S.; Gibbs, J.R.; Schymick, J.C.; Laaksovirta, H.; van Swieten, J.C.; Myllykangas, L.; et al. A hexanucleotide repeat expansion in C9ORF72 is the cause of chromosome 9p21-linked ALS-FTD. Neuron 2011, 72, 257–268. [Google Scholar] [CrossRef] [PubMed] [Green Version]
  5. Cooper-Knock, J.; Kirby, J.; Highley, R.; Shaw, P.J. The Spectrum of C9orf72-mediated Neurodegeneration and Amyotrophic Lateral Sclerosis. Neurotherapeutics 2015, 12, 326–339. [Google Scholar] [CrossRef] [PubMed] [Green Version]
  6. Cooper-Knock, J.; Shaw, P.J.; Kirby, J. The widening spectrum of C9ORF72-related disease; genotype/phenotype correlations and potential modifiers of clinical phenotype. Acta Neuropathol. 2014, 127, 333–345. [Google Scholar] [CrossRef] [Green Version]
  7. Snowden, J.S.; Rollinson, S.; Thompson, J.C.; Harris, J.M.; Stopford, C.L.; Richardson, A.M.; Jones, M.; Gerhard, A.; Davidson, Y.S.; Robinson, A.; et al. Distinct clinical and pathological characteristics of frontotemporal dementia associated with C9ORF72 mutations. Brain 2012, 135 Pt 3, 693–708. [Google Scholar] [CrossRef]
  8. Swinnen, B.; Robberecht, W. The phenotypic variability of amyotrophic lateral sclerosis. Nat. Rev. Neurol. 2014, 10, 661–670. [Google Scholar] [CrossRef] [Green Version]
  9. Rosen, D.R.; Siddique, T.; Patterson, D.; Figlewicz, D.A.; Sapp, P.; Hentati, A.; Donaldson, D.; Goto, J.; O’Regan, J.P.; Deng, H.X.; et al. Mutations in Cu/Zn superoxide dismutase gene are associated with familial amyotrophic lateral sclerosis. Nature 1993, 362, 59–62. [Google Scholar] [CrossRef]
  10. Mejzini, R.; Flynn, L.L.; Pitout, I.L.; Fletcher, S.; Wilton, S.D.; Akkari, P.A. ALS Genetics, Mechanisms, and Therapeutics: Where Are We Now? Front. Neurosci. 2019, 13, 1310. [Google Scholar] [CrossRef] [Green Version]
  11. Andersen, P.M.; Forsgren, L.; Binzer, M.; Nilsson, P.; Ala-Hurula, V.; Keränen, M.L.; Bergmark, L.; Saarinen, A.; Haltia, T.; Tarvainen, I.; et al. Autosomal recessive adult-onset amyotrophic lateral sclerosis associated with homozygosity for Asp90Ala CuZn-superoxide dismutase mutation. A clinical and genealogical study of 36 patients. Brain 1996, 119 Pt 4, 1153–1172. [Google Scholar] [CrossRef] [PubMed] [Green Version]
  12. Li, H.F.; Wu, Z.Y. Genotype-phenotype correlations of amyotrophic lateral sclerosis. Transl. Neurodegener. 2016, 5, 3. [Google Scholar] [CrossRef] [Green Version]
  13. Juneja, T.; Pericak-Vance, M.A.; Laing, N.G.; Dave, S.; Siddique, T. Prognosis in familial amyotrophic lateral sclerosis: Progression and survival in patients with glu100gly and ala4val mutations in Cu,Zn superoxide dismutase. Neurology 1997, 48, 55–57. [Google Scholar] [CrossRef] [PubMed]
  14. Millecamps, S.; Salachas, F.; Cazeneuve, C.; Gordon, P.; Bricka, B.; Camuzat, A.; Guillot-Noël, L.; Russaouen, O.; Bruneteau, G.; Pradat, P.F.; et al. SOD1, ANG, VAPB, TARDBP, and FUS mutations in familial amyotrophic lateral sclerosis: Genotype-phenotype correlations. J. Med. Genet. 2010, 47, 554–560. [Google Scholar] [CrossRef] [PubMed]
  15. Project MinE: Study design and pilot analyses of a large-scale whole-genome sequencing study in amyotrophic lateral sclerosis. Eur. J. Hum. Genet. 2018, 26, 1537–1546. [CrossRef] [Green Version]
  16. Yamashita, S.; Ando, Y. Genotype-phenotype relationship in hereditary amyotrophic lateral sclerosis. Transl. Neurodegener. 2015, 4, 13. [Google Scholar] [CrossRef] [Green Version]
  17. Mathis, S.; Goizet, C.; Soulages, A.; Vallat, J.M.; Masson, G.L. Genetics of amyotrophic lateral sclerosis: A review. J. Neurol. Sci. 2019, 399, 217–226. [Google Scholar] [CrossRef]
  18. Bella, E.D.; Bersano, E.; Bruzzone, M.G.; Gellera, C.; Pensato, V.; Lauria, G.; Consonni, M. Behavioral and Cognitive Phenotypes of Patients With Amyotrophic Lateral Sclerosis Carrying SOD1 Variants. Neurology 2022, 99, e2052–e2062. [Google Scholar] [CrossRef]
  19. Trojsi, F.; Siciliano, M.; Femiano, C.; Santangelo, G.; Lunetta, C.; Calvo, A.; Moglia, C.; Marinou, K.; Ticozzi, N.; Drago Ferrante, G.; et al. Comorbidity of dementia with amyotrophic lateral sclerosis (ALS): Insights from a large multicenter Italian cohort. J. Neurol. 2017, 264, 2224–2231. [Google Scholar] [CrossRef]
  20. Lattante, S.; Rouleau, G.A.; Kabashi, E. TARDBP and FUS mutations associated with amyotrophic lateral sclerosis: Summary and update. Hum. Mutat. 2013, 34, 812–826. [Google Scholar] [CrossRef]
  21. Van Laere, K.; Vanhee, A.; Verschueren, J.; De Coster, L.; Driesen, A.; Dupont, P.; Robberecht, W.; Van Damme, P. Value of 18fluorodeoxyglucose-positron-emission tomography in amyotrophic lateral sclerosis: A prospective study. JAMA Neurol. 2014, 71, 553–561. [Google Scholar] [CrossRef] [Green Version]
  22. Van Weehaeghe, D.; Devrome, M.; Schramm, G.; De Vocht, J.; Deckers, W.; Baete, K.; Van Damme, P.; Koole, M.; Van Laere, K. Combined brain and spinal FDG PET allows differentiation between ALS and ALS mimics. Eur. J. Nucl. Med. Mol. Imaging 2020, 47, 2681–2690. [Google Scholar] [CrossRef]
  23. Van Weehaeghe, D.; Ceccarini, J.; Delva, A.; Robberecht, W.; Van Damme, P.; Van Laere, K. Prospective Validation of 18F-FDG Brain PET Discriminant Analysis Methods in the Diagnosis of Amyotrophic Lateral Sclerosis. J. Nucl. Med. 2016, 57, 1238–1243. [Google Scholar] [CrossRef] [Green Version]
  24. Pagani, M.; Chiò, A.; Valentini, M.C.; Öberg, J.; Nobili, F.; Calvo, A.; Moglia, C.; Bertuzzo, D.; Morbelli, S.; De Carli, F.; et al. Functional pattern of brain FDG-PET in amyotrophic lateral sclerosis. Neurology 2014, 83, 1067–1074. [Google Scholar] [CrossRef] [PubMed] [Green Version]
  25. Canosa, A.; Pagani, M.; Cistaro, A.; Montuschi, A.; Iazzolino, B.; Fania, P.; Cammarosano, S.; Ilardi, A.; Moglia, C.; Calvo, A.; et al. 18F-FDG-PET correlates of cognitive impairment in ALS. Neurology 2016, 86, 44–49. [Google Scholar] [CrossRef] [PubMed] [Green Version]
  26. Cistaro, A.; Pagani, M.; Montuschi, A.; Calvo, A.; Moglia, C.; Canosa, A.; Restagno, G.; Brunetti, M.; Traynor, B.J.; Nobili, F.; et al. The metabolic signature of C9ORF72-related ALS: FDG PET comparison with nonmutated patients. Eur. J. Nucl. Med. Mol. Imaging 2014, 41, 844–852. [Google Scholar] [CrossRef] [PubMed] [Green Version]
  27. Schönecker, S.; Neuhofer, C.; Otto, M.; Ludolph, A.; Kassubek, J.; Landwehrmeyer, B.; Anderl-Straub, S.; Semler, E.; Diehl-Schmid, J.; Prix, C.; et al. Atrophy in the Thalamus But Not Cerebellum Is Specific for C9orf72 FTD and ALS Patients—An Atlas-Based Volumetric MRI Study. Front. Aging Neurosci. 2018, 10, 45. [Google Scholar] [CrossRef] [Green Version]
  28. Diehl-Schmid, J.; Licata, A.; Goldhardt, O.; Förstl, H.; Yakushew, I.; Otto, M.; Anderl-Straub, S.; Beer, A.; Ludolph, A.C.; Landwehrmeyer, G.B.; et al. FDG-PET underscores the key role of the thalamus in frontotemporal lobar degeneration caused by C9ORF72 mutations. Transl. Psychiatry 2019, 9, 54. [Google Scholar] [CrossRef] [Green Version]
  29. Canosa, A.; Calvo, A.; Moglia, C.; Vasta, R.; Palumbo, F.; Solero, L.; Di Pede, F.; Cabras, S.; Arena, V.; Zocco, G.; et al. Amyotrophic lateral sclerosis with SOD1 mutations shows distinct brain metabolic changes. Eur. J. Nucl. Med. Mol. Imaging 2022, 49, 2242–2250. [Google Scholar] [CrossRef]
  30. Schrooten, M.; Smetcoren, C.; Robberecht, W.; Van Damme, P. Benefit of the Awaji diagnostic algorithm for amyotrophic lateral sclerosis: A prospective study. Ann. Neurol. 2011, 70, 79–83. [Google Scholar] [CrossRef]
  31. Rosenbaum, P.R.; Rubin, D.B. The central role of the propensity score in observational studies for causal effects. Biometrika 1983, 70, 41–55. [Google Scholar] [CrossRef]
  32. D’Agostino, R.B., Jr. Propensity score methods for bias reduction in the comparison of a treatment to a non-randomized control group. Stat. Med. 1998, 17, 2265–2281. [Google Scholar] [CrossRef]
  33. Cedarbaum, J.M.; Stambler, N.; Malta, E.; Fuller, C.; Hilt, D.; Thurmond, B.; Nakanishi, A. The ALSFRS-R: A revised ALS functional rating scale that incorporates assessments of respiratory function. BDNF ALS Study Group (Phase III). J. Neurol. Sci. 1999, 169, 13–21. [Google Scholar] [CrossRef] [PubMed]
  34. Tzourio-Mazoyer, N.; Landeau, B.; Papathanassiou, D.; Crivello, F.; Etard, O.; Delcroix, N.; Mazoyer, B.; Joliot, M. Automated anatomical labeling of activations in SPM using a macroscopic anatomical parcellation of the MNI MRI single-subject brain. Neuroimage 2002, 15, 273–289. [Google Scholar] [CrossRef]
  35. Rolls, E.T.; Huang, C.C.; Lin, C.P.; Feng, J.; Joliot, M. Automated anatomical labelling atlas 3. Neuroimage 2020, 206, 116189. [Google Scholar] [CrossRef]
  36. Benjamini, Y.; Hochberg, Y. Controlling the False Discovery Rate: A Practical and Powerful Approach to Multiple Testing. J. R. Stat. Society. Ser. B 1995, 57, 289–300. [Google Scholar] [CrossRef]
  37. De Vocht, J.; Blommaert, J.; Devrome, M.; Radwan, A.; Van Weehaeghe, D.; De Schaepdryver, M.; Ceccarini, J.; Rezaei, A.; Schramm, G.; van Aalst, J.; et al. Use of Multimodal Imaging and Clinical Biomarkers in Presymptomatic Carriers of C9orf72 Repeat Expansion. JAMA Neurol. 2020, 77, 1008–1017. [Google Scholar] [CrossRef] [PubMed]
  38. Starr, A.; Sattler, R. Synaptic dysfunction and altered excitability in C9ORF72 ALS/FTD. Brain Res. 2018, 1693 Pt A, 98–108. [Google Scholar] [CrossRef]
  39. Henstridge, C.M.; Tzioras, M.; Paolicelli, R.C. Glial Contribution to Excitatory and Inhibitory Synapse Loss in Neurodegeneration. Front. Cell. Neurosci. 2019, 13, 63. [Google Scholar] [CrossRef] [Green Version]
  40. Calió, M.L.; Henriques, E.; Siena, A.; Bertoncini, C.R.A.; Gil-Mohapel, J.; Rosenstock, T.R. Mitochondrial Dysfunction, Neurogenesis, and Epigenetics: Putative Implications for Amyotrophic Lateral Sclerosis Neurodegeneration and Treatment. Front. Neurosci. 2020, 14, 679. [Google Scholar] [CrossRef]
  41. Terada, T.; Therriault, J.; Kang, M.S.; Savard, M.; Pascoal, T.A.; Lussier, F.; Tissot, C.; Wang, Y.-T.; Benedet, A.; Poltronetti, N.M.; et al. Mitochondrial complex I abnormalities underlie neurodegeneration and cognitive decline in Alzheimer’s disease. Eur. J. Neurol. 2022, 29, 1324–1334. [Google Scholar] [CrossRef] [PubMed]
  42. Malpetti, M.; Holland, N.; Jones, P.S.; Ye, R.; Cope, T.E.; Fryer, T.D.; Hong, Y.T.; Savulich, G.; Rittman, T.; Passamonti, L.; et al. Synaptic density in carriers of C9orf72 mutations: A [11C]UCB-J PET study. Ann. Clin. Transl. Neurol. 2021, 8, 1515–1523. [Google Scholar] [CrossRef] [PubMed]
  43. Cistaro, A.; Valentini, M.C.; Chiò, A.; Nobili, F.; Calvo, A.; Moglia, C.; Montuschi, A.; Morbelli, S.; Salmaso, D.; Fania, P.; et al. Brain hypermetabolism in amyotrophic lateral sclerosis: A FDG PET study in ALS of spinal and bulbar onset. Eur. J. Nucl. Med. Mol. Imaging 2012, 39, 251–259. [Google Scholar] [CrossRef] [PubMed]
  44. Matías-Guiu, J.A.; Pytel, V.; Cabrera-Martín, M.N.; Galán, L.; Valles-Salgado, M.; Guerrero, A.; Moreno-Ramos, T.; Matías-Guiu, J.; Carreras, J.L. Amyloid- and FDG-PET imaging in amyotrophic lateral sclerosis. Eur. J. Nucl. Med. Mol. Imaging 2016, 43, 2050–2060. [Google Scholar] [CrossRef]
  45. Brettschneider, J.; Toledo, J.B.; Van Deerlin, V.M.; Elman, L.; McCluskey, L.; Lee, V.M.; Trojanowski, J.Q. Microglial activation correlates with disease progression and upper motor neuron clinical symptoms in amyotrophic lateral sclerosis. PLoS ONE 2012, 7, e39216. [Google Scholar] [CrossRef] [Green Version]
  46. Chew, S.; Atassi, N. Positron Emission Tomography Molecular Imaging Biomarkers for Amyotrophic Lateral Sclerosis. Front. Neurol. 2019, 10, 135. [Google Scholar] [CrossRef] [Green Version]
  47. Gendron, T.F.; Daughrity, L.M.; Heckman, M.G.; Diehl, N.N.; Wuu, J.; Miller, T.M.; Pastor, P.; Trojanowski, J.Q.; Grossman, M.; Berry, J.D.; et al. Phosphorylated neurofilament heavy chain: A biomarker of survival for C9ORF72-associated amyotrophic lateral sclerosis. Ann. Neurol. 2017, 82, 139–146. [Google Scholar] [CrossRef]
  48. Irwin, D.J.; McMillan, C.T.; Brettschneider, J.; Libon, D.J.; Powers, J.; Rascovsky, K.; Toledo, J.B.; Boller, A.; Bekisz, J.; Chandrasekaran, K. Cognitive decline and reduced survival in C9orf72 expansion frontotemporal degeneration and amyotrophic lateral sclerosis. J. Neurol. Neurosurg. Psychiatry 2013, 84, 163–169. [Google Scholar] [CrossRef] [PubMed] [Green Version]
  49. Umoh, M.E.; Fournier, C.; Li, Y.; Polak, M.; Shaw, L.; Landers, J.E.; Hu, W.; Gearing, M.; Glass, J.D. Comparative analysis of C9orf72 and sporadic disease in an ALS clinic population. Neurology 2016, 87, 1024–1030. [Google Scholar] [CrossRef] [PubMed] [Green Version]
  50. Zanovello, M.; Sorarù, G.; Campi, C.; Anglani, M.; Spimpolo, A.; Berti, S.; Bussè, C.; Mozzetta, S.; Cagnin, A.; Cecchin, D. Brain Stem Glucose Hypermetabolism in Amyotrophic Lateral Sclerosis/Frontotemporal Dementia and Shortened Survival: An 18F-FDG PET/MRI Study. J. Nucl. Med. 2022, 63, 777–784. [Google Scholar] [CrossRef]
  51. Devrome, M.; Van Weehaeghe, D.; De Vocht, J.; Van Damme, P.; Van Laere, K.; Koole, M. Glucose metabolic brain patterns to discriminate amyotrophic lateral sclerosis from Parkinson plus syndromes. EJNMMI Res. 2018, 8, 110. [Google Scholar] [CrossRef] [PubMed] [Green Version]
  52. van Weehaeghe, D.; Ceccarini, J.; Willekens, S.M.; de Vocht, J.; van Damme, P.; van Laere, K. Is there a glucose metabolic signature of spreading TDP-43 pathology in amyotrophic lateral sclerosis? Q. J. Nucl. Med. Mol. Imaging 2020, 64, 96–104. [Google Scholar] [CrossRef] [PubMed]
  53. Henstridge, C.M.; Sideris, D.I.; Carroll, E.; Rotariu, S.; Salomonsson, S.; Tzioras, M.; McKenzie, C.A.; Smith, C.; von Arnim, C.A.F.; Ludolph, A.C.; et al. Synapse loss in the prefrontal cortex is associated with cognitive decline in amyotrophic lateral sclerosis. Acta Neuropathol. 2018, 135, 213–226. [Google Scholar] [CrossRef] [PubMed] [Green Version]
  54. Hayashi, K.; Mochizuki, Y.; Takeuchi, R.; Shimizu, T.; Nagao, M.; Watabe, K.; Arai, N.; Oyanagi, K.; Onodera, O.; Hayashi, M.; et al. Clinicopathological characteristics of patients with amyotrophic lateral sclerosis resulting in a totally locked-in state (communication Stage V). Acta Neuropathol. Commun. 2016, 4, 107. [Google Scholar] [CrossRef] [Green Version]
  55. Agosta, F.; Spinelli, E.G.; Marjanovic, I.V.; Stevic, Z.; Pagani, E.; Valsasina, P.; Salak-Djokic, B.; Jankovic, M.; Lavrnic, D.; Kostic, V.S.; et al. Unraveling ALS due to SOD1 mutation through the combination of brain and cervical cord MRI. Neurology 2018, 90, e707. [Google Scholar] [CrossRef]
  56. Turner, M.R.; Hammers, A.; Allsop, J.; Al-chalabi, A.; Shaw, C.E.; Brooks, D.J.; Nigel Leigh, P.; Andersen, P.M. Volumetric cortical loss in sporadic and familial amyotrophic lateral sclerosis. Amyotroph. Lateral Scler. 2007, 8, 343–347. [Google Scholar] [CrossRef]
  57. Turner, M.R.; Hammers, A.; Al-Chalabi, A.; Shaw, C.E.; Andersen, P.M.; Brooks, D.J.; Leigh, P.N. Distinct cerebral lesions in sporadic and ‘D90A’ SOD1 ALS: Studies with [11C]flumazenil PET. Brain 2005, 128, 1323–1329. [Google Scholar] [CrossRef] [Green Version]
  58. Turner, M.R.; Rabiner, E.A.; Al-Chalabi, A.; Shaw, C.E.; Brooks, D.J.; Leigh, P.N.; Andersen, P.M. Cortical 5-HT1A receptor binding in patients with homozygous D90A SOD1 vs sporadic ALS. Neurology 2007, 68, 1233–1235. [Google Scholar] [CrossRef]
  59. Tondo, G.; Iaccarino, L.; Cerami, C.; Vanoli, G.E.; Presotto, L.; Masiello, V.; Coliva, A.; Salvi, F.; Bartolomei, I.; Mosca, L.; et al. (11) C-PK11195 PET-based molecular study of microglia activation in SOD1 amyotrophic lateral sclerosis. Ann. Clin. Transl. Neurol. 2020, 7, 1513–1523. [Google Scholar] [CrossRef]
  60. Van Weehaeghe, D.; Babu, S.; De Vocht, J.; Zürcher, N.R.; Chew, S.; Tseng, C.J.; Loggia, M.L.; Koole, M.; Rezaei, A.; Schramm, G.; et al. Moving Toward Multicenter Therapeutic Trials in Amyotrophic Lateral Sclerosis: Feasibility of Data Pooling Using Different Translocator Protein PET Radioligands. J. Nucl. Med. 2020, 61, 1621–1627. [Google Scholar] [CrossRef] [PubMed]
  61. Ho, D.E.; Imai, K.; King, G.; Stuart, E.A. Matching as Nonparametric Preprocessing for Reducing Model Dependence in Parametric Causal Inference. Political Anal. 2007, 15, 199–236. [Google Scholar] [CrossRef] [Green Version]
Figure 1. Kaplan–Meier plot of overall survival by ALS group.
Cells 12 00933 g001
Figure 2. T-statistical map detailing patterns of relative hypometabolism (yellow) and hypermetabolism (blue) in C9orf72-ALS patients, when compared to SOD1-ALS patients, thresholded at puncorr < 0.001 at voxel level, and pFWE < 0.05 at cluster level, while correcting for age, sex, scanner type and King’s disease stage. Clusters are overlaid on a T1-weighted template.
Cells 12 00933 g002
Figure 3. T-statistical map detailing patterns of relative hypometabolism (yellow) and hypermetabolism (blue) in C9orf72-ALS, when compared to a group of matched sporadic ALS patients, thresholded at puncorr < 0.001 at voxel level, and pFWE < 0.05 at cluster level. Clusters are overlaid on a T1-weighted template.
Cells 12 00933 g003
Table 1. Demographics and clinical characteristics of ALS patient groups (healthy controls, n = 20; C9orf72-ALS, n = 48; C9orf72-matchedsALS, n = 48; SOD1-ALS, n = 22; SOD1-matchedsALS, n = 21). Abbreviations: C9orf72-ALS, C9orf72-associated ALS; CI, confidence interval; IQR, interquartile range; M, months; Md, median; n, number; SOD1-ALS, SOD1-associated ALS; Yr, years.
Md (IQR)C9orf72-ALSC9orf72-matchedsALSSOD1-ALSSOD1-matchedsALSTest Statisticp-Value
Age at FDG PET (Yr)58.5 (9.00)63 (16.75)54.5 (20.00)60 (22.50)χ2(4): 4.1590.385
Diagnostic Delay (Yr)0.73 (0.62)0.34 (0.22)1.51 (1.48)0.43 (0.27)χ2(3): 47.322<0.001
Md (95% CI)
Survival Time (M)28.93
(24.00–33.86)
32.43
(24.75–40.11)
114.43
(71.02–157.84)
22.07
(7.72–36.42)
χ2(3): 11.1300.011
n (%)
Sex:
  • Male
28 (58)32 (67)12 (55)13 (62)χ2: 1.1840.757
King Stage:
  • Stage 1
14 (29)18 (38)7 (32)8 (38)χ2(3): 1.0250.795
  • Stage 2
17 (35)12 (25)7 (32)8 (38)
  • Stage 3
16 (33)16 (33)7 (32)5 (24)
  • Stage 4
1 (2)2 (4)1 (5)0 (0)
Onset type:
  • Spinal
33 (69)31 (65)18 (82)14 (67)χ2: 2.1850.535
Table 2. Volume-of-interest (VOI)-based Mann–Whitney U test of 18F-FDG SUVR between SOD1-ALS (n = 22) and C9orf72-ALS patients; n = 48). FDR-corrected p-values < 0.05 for multiple testing were considered significant. Abbreviations: IQR, interquartile range; Md, median; sALS = sporadic ALS; SOD1-ALS = SOD1-associated ALS; SUVR = standardized uptake value ratio.
Median (IQR)SOD1-ALSC9orf72-ALSTest StatisticpFDR Value
Mid Frontal gyrus1.100 (0.07)1.070 (0.07)403.50.248
Precentral gyrus1.015 (0.04)0.990 (0.05)272.00.007
Straight gyrus0.975 (0.05)0.970 (0.06)479.50.711
Orbitofrontal cortex1.000 (0.07)1.010 (0.06)485.00.746
Inferior frontal gyrus1.075 (0.06)1.050 (0.06)373.00.181
Superior frontal gyrus1.010 (0.05)0.990 (0.04)384.00.165
Medial orbital gyrus0.960 (0.05)0.970 (0.07)442.50.490
Lateral orbital gyrus1.025 (0.05)1.020 (0.06)479.00.732
Posterior orbital gyrus0.940 (0.03)0.960 (0.06)452.00.515
Subgenual frontal cortex0.830 (0.05)0.835 (0.08)509.00.855
Subcallosal area0.825 (0.05)0.800 (0.10)427.00.389
Pre-subgenual frontal cortex1.030 (0.06)1.005 (0.12)515.00.893
Hippocampus0.770 (0.18)0.780 (0.08)486.50.739
Amygdala0.720 (0.07)0.745 (0.07)379.50.168
Anterior temporal lobe (med)0.740 (0.04)0.755 (0.04)398.50.229
Lateral Anterior temporal lobe0.860 (0.06)0.870 (0.04)505.50.896
Parahippocampal and ambient gyri0.780 (0.03)0.790 (0.03)416.00.317
Superior temporal gyrus, posterior1.010 (0.08)1.000 (0.06)469.50.652
Middle and inferior temporal gyrus0.940 (0.04)0.940 (0.04)506.00.875
Fusiform gyrus0.840 (0.04)0.840 (0.06)506.00.875
Posterior temporal lobe1.000 (0.03)1.010 (0.03)457.50.543
Superior temporal gyrus, anterior0.840 (0.05)0.820 (0.05)449.50.537
Postcentral gyrus1.010 (0.03)0.980 (0.04)246.50.006
Superior parietal gyrus1.090 (0.05)1.070 (0.04)374.50.172
Inferolateral remainder parietal lobe1.055 (0.04)1.040 (0.04)383.50.174
Lateral remainder of the occipital lobe1.100 (0.05)1.120 (0.07)438.00.468
Lingual gyrus1.180 (0.06)1.190 (0.12)450.50.524
Cuneus1.220 (0.07)1.255 (0.12)487.00.720
Thalamus0.935 (0.06)0.880 (0.10)278.50.012
Insula0.930 (0.04)0.925 (0.03)515.50.874
Cingulate gyrus, anterior1.005 (0.06)0.975 (0.08)376.00.167
Cingulate gyrus, posterior1.160 (0.05)1.120 (0.05)304.00.019
Cerebellum0.960 (0.09)1.025 (0.07)264.00.008
Medulla0.715 (0.10)0.790 (0.07)250.00.005
Midbrain0.740 (0.09)0.810 (0.08)288.00.012
Pons0.625 (0.06)0.680 (0.08)303.00.019
Lentiform nucleus1.080 (0.07)1.155 (0.08)214.00.003
Table 3. Volume-of-interest (VOI)-based Mann–Whitney U test of 18F-FDG SUVR between C9orf72-ALS (n = 48) patients and matched sporadic ALS (C9orf72-matchedsALS; n = 48) patients. FDR-corrected p-values < 0.05 for multiple testing were considered significant. Abbreviations: C9orf72-ALS, C9orf72-associated ALS; IQR, interquartile range; Md, median; sALS = sporadic ALS; SUVR = standardized uptake value ratio.
Median (IQR)C9orf72-ALSC9orf72-matchedsALSTest StatisticpFDR-Value
Mid Frontal gyrus1.070 (0.07)1.085 (0.06)1070.00.675
Precentral gyrus0.990 (0.05)1.010 (0.04)797.00.048
Straight gyrus0.970 (0.06)0.950 (0.08)1377.00.242
Orbitofrontal cortex1.010 (0.06)1.000 (0.07)1419.00.142
Inferior frontal gyrus1.050 (0.06)1.055 (0.06)1041.50.550
Superior frontal gyrus0.990 (0.04)1.000 (0.06)997.50.412
Medial orbital gyrus0.970 (0.07)0.960 (0.04)1429.50.138
Lateral orbital gyrus1.020 (0.06)1.000 (0.07)1321.00.377
Posterior orbital gyrus0.960 (0.06)0.945 (0.06)1300.50.407
Subgenual frontal cortex0.835 (0.08)0.820 (0.08)1343.00.314
Subcallosal area0.800 (0.10)0.810 (0.10)1133.00.940
Pre-subgenual frontal cortex1.005 (0.12)1.015 (0.12)1152.01.000
Hippocampus0.780 (0.08)0.770 (0.09)1231.50.668
Amygdala0.745 (0.07)0.720 (0.07)1368.00.261
Ant. Temporal lobe (med)0.755 (0.04)0.730 (0.06)1497.00.263
Ant. Temporal lobe (lateral)0.870 (0.04)0.860 (0.05)1320.50.362
Parahippocampal and ambient gyri0.790 (0.03)0.790 (0.05)1272.50.513
Superior temporal gyrus, posterior1.000 (0.06)1.015 (0.06)1008.50.414
Middle and inferior temporal gyrus0.940 (0.04)0.930 (0.03)1362.00.182
Fusiform gyrus0.840 (0.06)0.830 (0.05)1261.00.538
Posterior temporal lobe1.010 (0.03)1.010 (0.04)1206.00.751
Superior temporal gyrus, anterior0.820 (0.05)0.810 (0.08)1170.00.920
Postcentral gyrus0.980 (0.04)1.010 (0.05)670.00.007
Superior parietal gyrus1.070 (0.04)1.085 (0.04)774.00.031
Inferolateral remainder parietal lobe1.040 (0.04)1.050 (0.03)922.50.241
Lateral remainder occipital lobe1.120 (0.07)1.100 (0.06)1340.00.309
Lingual gyrus1.190 (0.12)1.190 (0.11)1217.00.710
Cuneus1.255 (0.12)1.230 (0.09)1227.00.673
Thalamus0.880 (0.10)0.930 (0.09)724.50.019
Insula0.925 (0.03)0.920 (0.06)1306.00.395
Cingulate gyrus, ant.0.975 (0.08)1.005 (0.09)957.00.312
Cingulate gyrus, post.1.120 (0.05)1.150 (0.05)659.00.011
Cerebellum1.025 (0.07)0.985 (0.07)1482.50.062
Medulla0.790 (0.07)0.740 (0.07)1602.50.012
Midbrain0.810 (0.08)0.790 (0.07)1453.00.100
Pons0.680 (0.08)0.650 (0.07)1421.50.148
Lentiform nucleus1.155 (0.08)1.110 (0.09)1569.50.015
Table 4. Volume-of-interest (VOI)-based Mann–Whitney U test of 18F-FDG SUVR between SOD1-ALS (n = 22) patients and matched sporadic ALS (SOD1-matchedsALS; n = 21) patients. FDR-corrected p-values < 0.05 for multiple testing were considered significant. Abbreviations: IQR, interquartile range; Md, median; sALS = sporadic ALS; SOD1-ALS = SOD1-associated ALS; SUVR = standardized uptake value ratio.
Median (IQR)SOD1-ALSSOD1-matched sALSTest StatisticpFDR Value
Mid Frontal gyrus1.100 (0.07)1.090 (0.03)249.51.000
Precentral gyrus1.015 (0.04)1.000 (0.04)299.01.000
Straight gyrus0.975 (0.05)0.990 (0.06)207.01.000
Orbitofrontal cortex1.000 (0.07)1.000 (0.06)214.00.965
Inferior frontal gyrus1.075 (0.06)1.050 (0.06)265.01.000
Superior frontal gyrus1.010 (0.05)1.010 (0.05)221.00.933
Medial orbital gyrus0.960 (0.05)0.960 (0.05)208.01.000
Lateral orbital gyrus1.025 (0.05)1.010 (0.06)260.51.000
Posterior orbital gyrus0.940 (0.03)0.960 (0.05)195.51.000
Subgenual frontal cortex0.830 (0.05)0.830 (0.05)243.50.937
Subcallosal area0.825 (0.05)0.820 (0.07)229.00.988
Pre-subgenual frontal cortex1.030 (0.06)1.040 (0.07)176.01.000
Hippocampus0.770 (0.18)0.770 (0.06)221.00.905
Amygdala0.720 (0.07)0.730 (0.05)207.51.000
Anterior temporal lobe (med)0.740 (0.04)0.750 (0.05)200.01.000
Lateral Anterior temporal lobe0.860 (0.06)0.870 (0.05)222.50.910
Parahippocampal and ambient gyri0.780 (0.03)0.780 (0.05)227.00.975
Superior temporal gyrus, posterior1.010 (0.08)1.010 (0.04)219.50.930
Middle and inferior temporal gyrus0.940 (0.04)0.950 (0.06)212.01.000
Fusiform gyrus0.840 (0.04)0.830 (0.05)252.51.000
Posterior temporal lobe1.000 (0.03)1.020 (0.03)210.51.000
Superior temporal gyrus, anterior0.840 (0.05)0.830 (0.06)193.51.000
Postcentral gyrus1.010 (0.03)1.010 (0.04)276.51.000
Superior parietal gyrus1.090 (0.05)1.070 (0.06)286.01.000
Inferolateral remainder parietal lobe1.055 (0.04)1.050 (0.03)278.01.000
Lateral remainder of the occipital lobe1.100 (0.05)1.100 (0.07)247.50.908
Lingual gyrus1.180 (0.06)1.190 (0.07)230.00.981
Cuneus1.220 (0.07)1.210 (0.07)301.01.000
Thalamus0.935 (0.06)0.940 (0.07)213.00.978
Insula0.930 (0.04)0.930 (0.05)214.50.877
Cingulate gyrus, anterior1.005 (0.06)1.000 (0.09)248.00.930
Cingulate gyrus, posterior1.160 (0.05)1.140 (0.07)262.01.000
Cerebellum0.960 (0.09)0.980 (0.06)171.51.000
Medulla0.715 (0.10)0.740 (0.09)194.01.000
Midbrain0.740 (0.09)0.760 (0.06)179.01.000
Pons0.625 (0.06)0.650 (0.05)200.51.000
Lentiform nucleus1.080 (0.07)1.100 (0.08)203.41.000
Disclaimer/Publisher’s Note: The statements, opinions and data contained in all publications are solely those of the individual author(s) and contributor(s) and not of MDPI and/or the editor(s). MDPI and/or the editor(s) disclaim responsibility for any injury to people or property resulting from any ideas, methods, instructions or products referred to in the content.

