

Development of an Automated Online Flow Cytometry Method to Quantify Cell Density and Fingerprint Bacterial Communities


Abstract
:
1. Introduction
2. Materials and Methods
2.1. Cultivation and Harvest of Bacterial Cells
2.2. NaCl/NaN3/EtOH Fixation
2.3. Paraformaldehyde (PFA)/EtOH Fixation for Standard Cytometric Analysis
2.4. DAPI Staining and Final Dilution for Standard Cytometric Analysis
2.5. Flow Cytometer
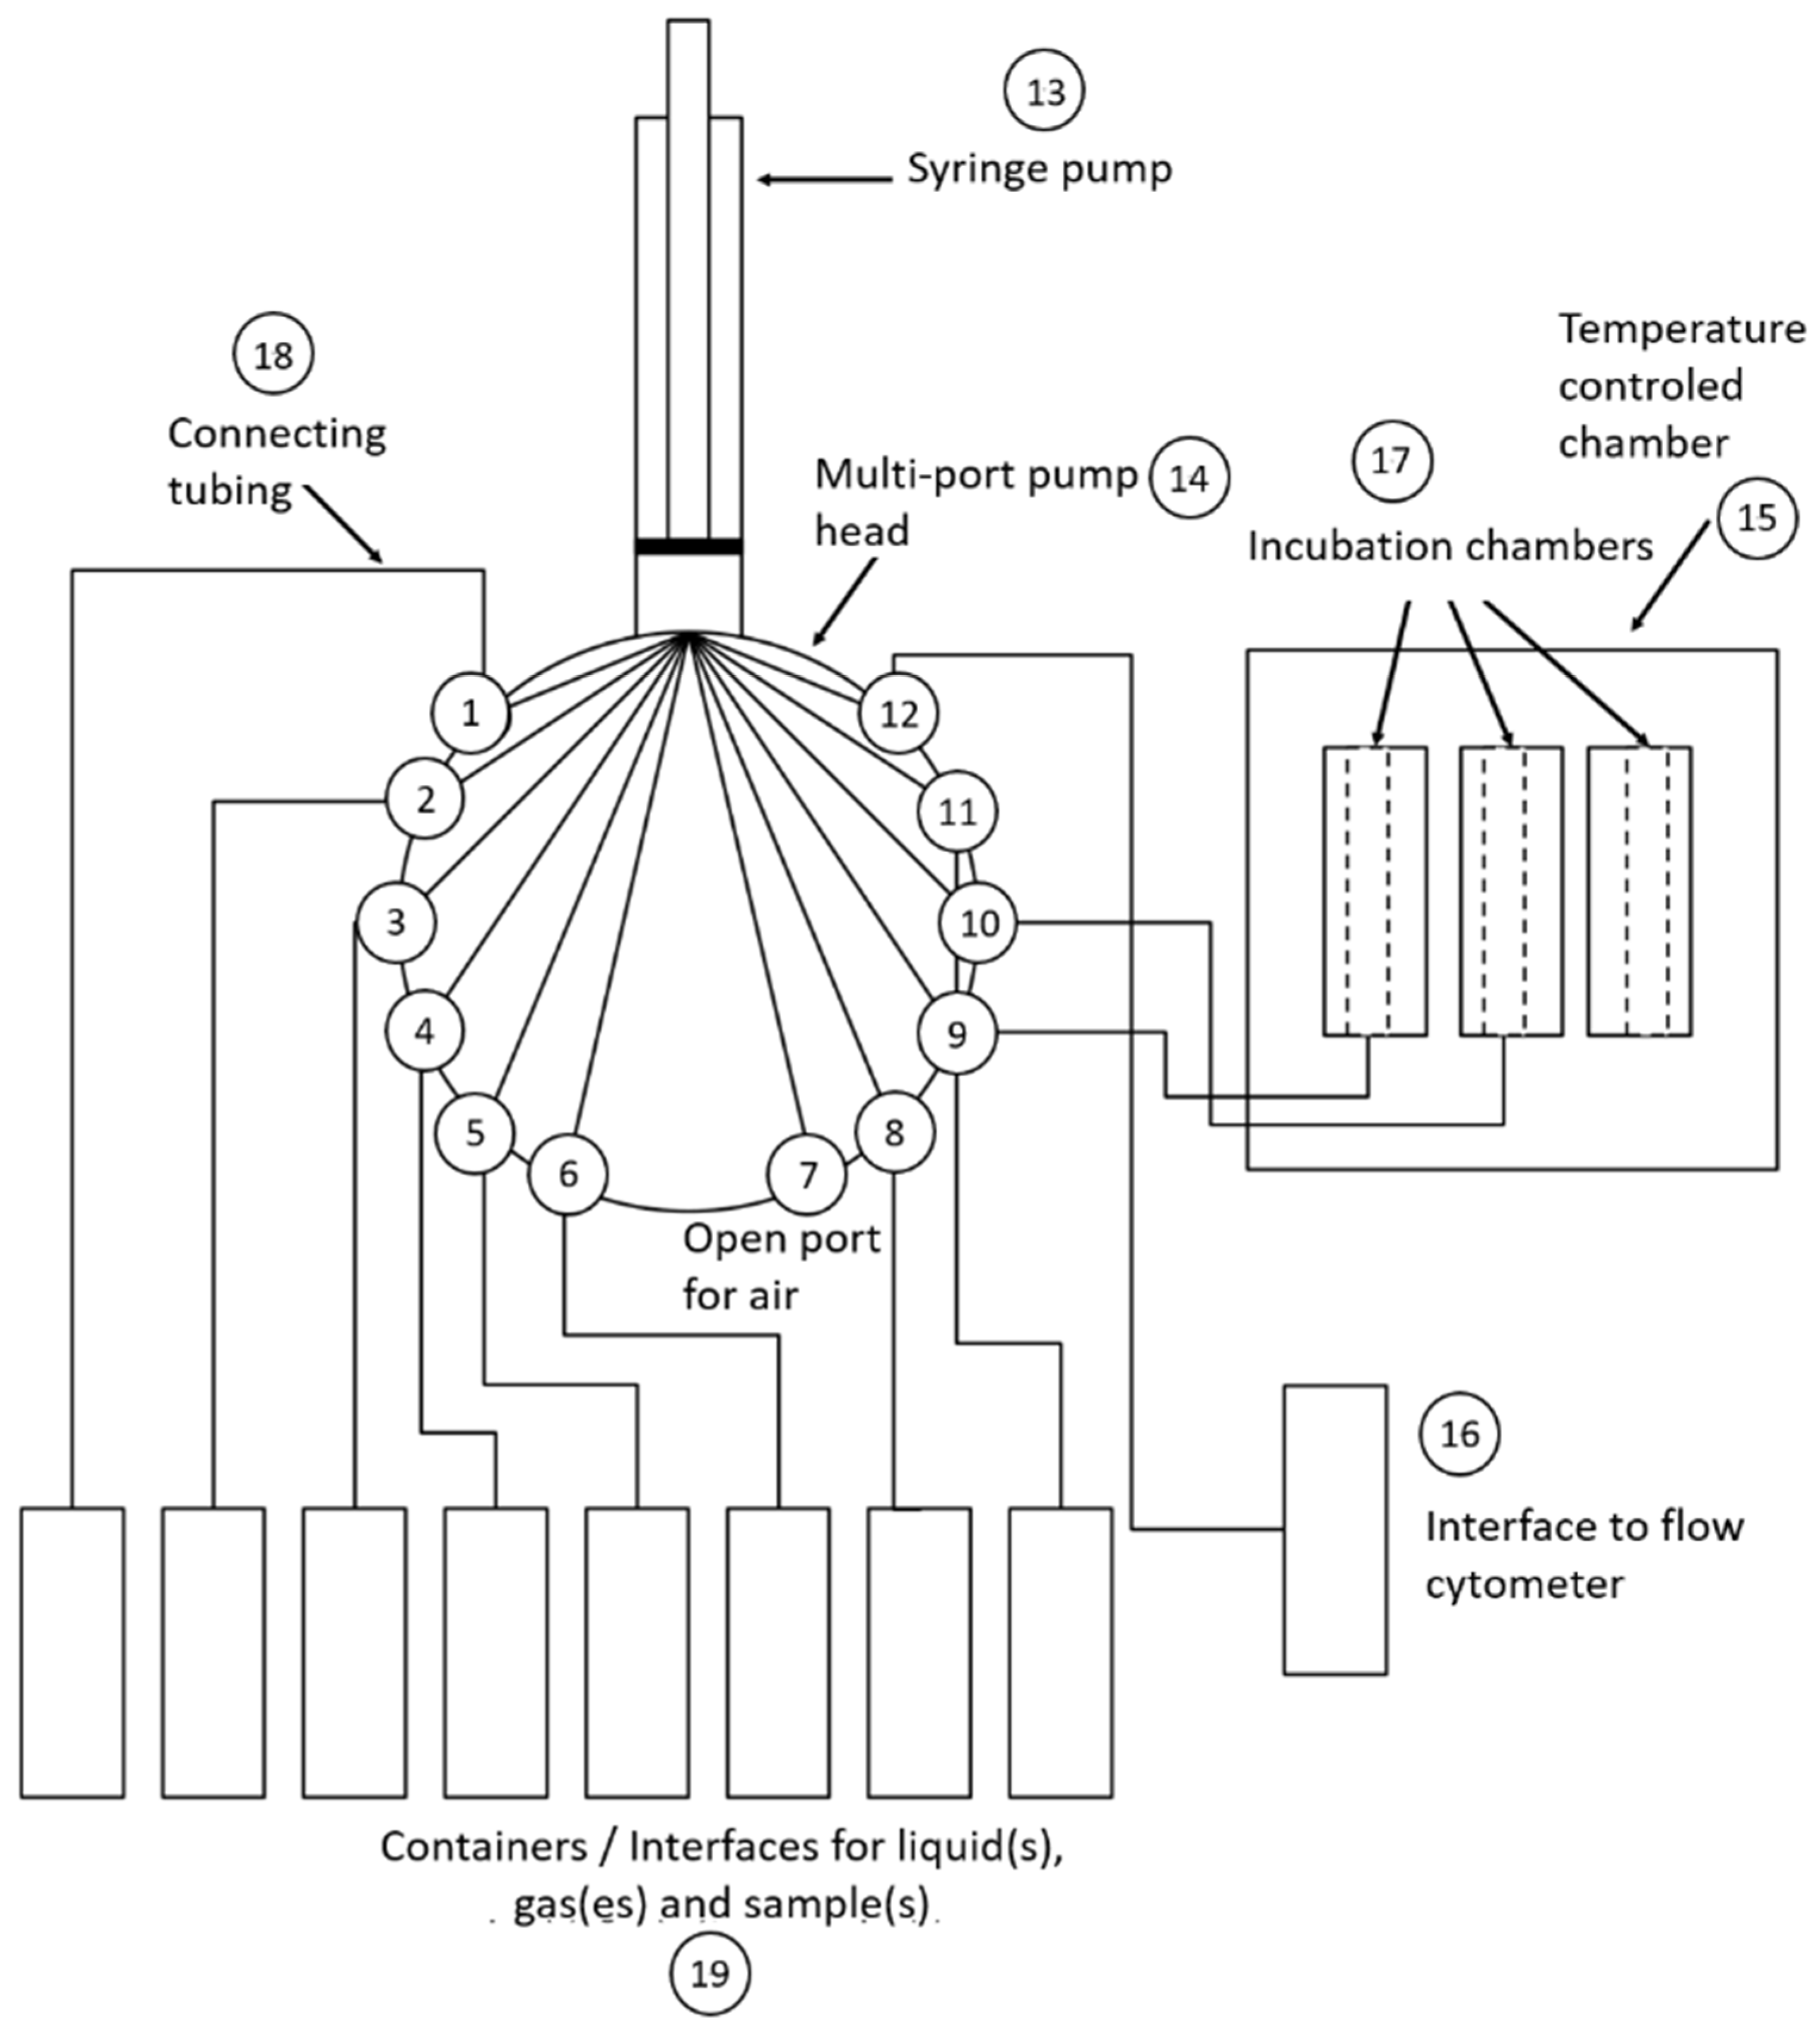
2.6. OC-300
2.7. Online Flow Cytometry Workflow for the Dilution, Fixation and Staining of Bacterial Cells
2.8. Cell Count Measurement
2.9. Stability of Measured Cell Concentration over Time Using the Online Flow Cytometry Workflow
2.10. Self-Cleaning Capabilities of the OC-300 Automation Unit between Measurements
2.11. Bioinformatics Evaluation
3. Results
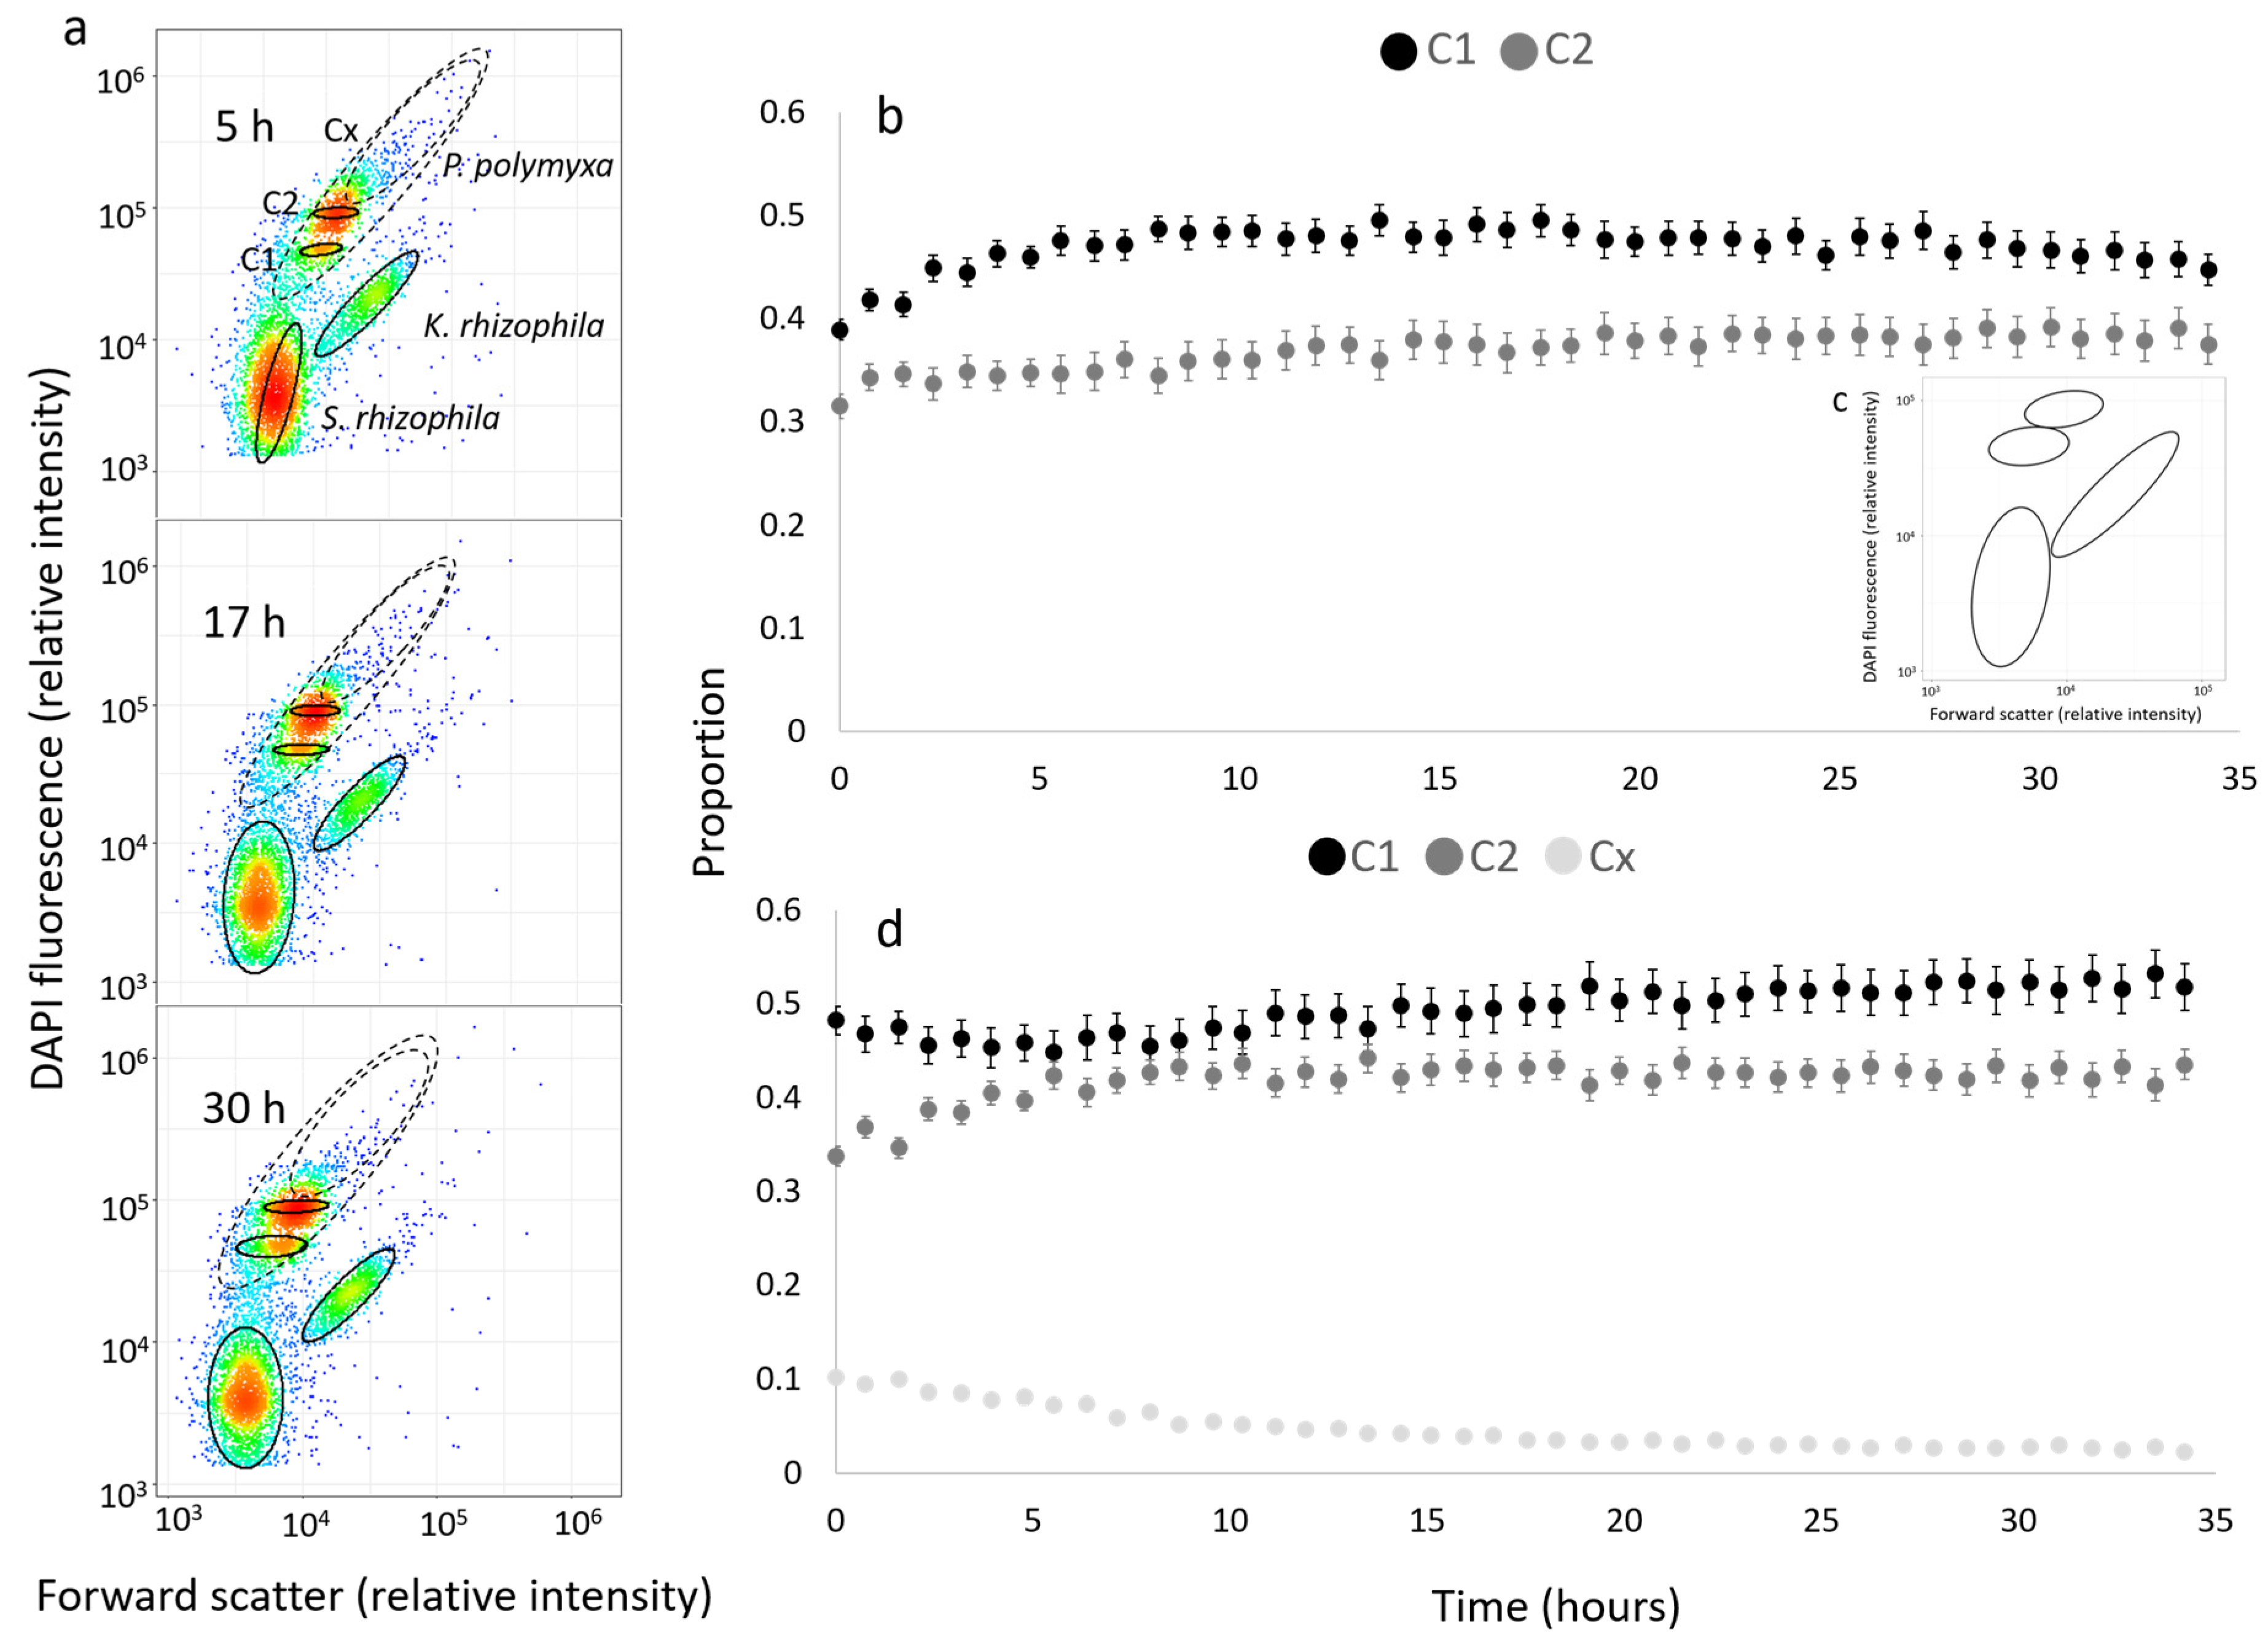
3.1. Automated Dilution, Fixation, Staining and Analysis of Microbial Community Samples
3.2. Reliable Self-Cleaning Procedures of the OC-300
3.3. Reliability of Automatically Determined Cell Counts
4. Discussion
4.1. Development of an Automated Online Procedure to Obtain Fingerprints of Microbial Communities
4.2. Reliable Self-Cleaning Procedures of the OC-300
4.3. Reliability of Automatically Determined Cell Counts
5. Conclusions
Supplementary Materials
Author Contributions
Funding
Institutional Review Board Statement
Informed Consent Statement
Data Availability Statement
Acknowledgments
Conflicts of Interest
References
- Lunjani, N.; Satitsuksanoa, P.; Lukasik, Z.; Sokolowska, M.; Eiwegger, T.; O’Mahony, L. Recent developments and highlights in mechanisms of allergic diseases: Microbiome. Allergy 2018, 73, 2314–2327. [Google Scholar] [CrossRef] [PubMed] [Green Version]
- D’Hondt, K.; Kostic, T.; McDowell, R.; Eudes, F.; Singh, B.K.; Sarkar, S.; Markakis, M.; Schelkle, B.; Maguin, E.; Sessitsch, A. Microbiome innovations for a sustainable future. Nat. Microbiol. 2021, 6, 138–142. [Google Scholar] [CrossRef] [PubMed]
- Bhatia, S.K.; Bhatia, R.K.; Choi, Y.-K.; Kan, E.; Kim, Y.-G.; Yang, Y.-H. Biotechnological potential of microbial consortia and future perspectives. Crit. Rev. Biotechnol. 2018, 38, 1209–1229. [Google Scholar] [CrossRef] [PubMed]
- Ghosh, S.; Chowdhury, R.; Bhattacharya, P. Mixed consortia in bioprocesses: Role of microbial interactions. Appl. Microbiol. Biotechnol. 2016, 100, 4283–4295. [Google Scholar] [CrossRef] [PubMed]
- Alford, J.S. Bioprocess control: Advances and challenges. Comput. Chem. Eng. 2006, 30, 1464–1475. [Google Scholar] [CrossRef]
- Kiviharju, K.; Salonen, K.; Moilanen, U.; Meskanen, E.; Leisola, M.; Eerikäinen, T. On-line biomass measurements in bioreactor cultivations: Comparison study of two on-line probes. J. Ind. Microbiol. Biotechnol. 2007, 34, 561–566. [Google Scholar] [CrossRef]
- Rösner, L.S.; Walter, F.; Ude, C.; John, G.T.; Beutel, S. Sensors and techniques for on-line determination of cell viability in bioprocess monitoring. Bioengineering 2022, 9, 762. [Google Scholar] [CrossRef]
- Fan, R.; Ebrahimi, M.; Quitmann, H.; Aden, M.; Czermak, P. An innovative optical sensor for the online monitoring and control of biomass concentration in a membrane bioreactor system for lactic acid production. Sensors 2016, 16, 411. [Google Scholar] [CrossRef] [Green Version]
- Horta, A.C.L.; da Silva, A.J.; Sargo, C.R.; Cavalcanti-Montaño, I.D.; Galeano-Suarez, I.D.; Velez, A.M.; Santos, M.P.; Gonçalves, V.M.; Giordano, R.C.; Zangirolami, T.C. Online monitoring of biomass concentration based on a capacitance sensor: Assessing the methodology for different bacteria and yeast high cell density fed-batch cultures. Braz. J. Chem. Eng. 2015, 32, 821–829. [Google Scholar] [CrossRef]
- Metze, S.; Ruhl, S.; Greller, G.; Grimm, C.; Scholz, J. Monitoring online biomass with a capacitance sensor during scale-up of industrially relevant CHO cell culture fed-batch processes in single-use bioreactors. Bioprocess Biosyst. Eng. 2020, 43, 193–205. [Google Scholar] [CrossRef] [Green Version]
- Trinh, T.; Branch, A.; Hambly, A.C.; Carvajal, G.; Coleman, H.M.; Stuetz, R.M.; Drewes, J.E.; Le-Clech, P.; Khan, S.J. Hazardous events in membrane bioreactors—Part 1: Impacts on key operational and bulk water quality parameters. J. Membr. Sci. 2016, 497, 494–503. [Google Scholar] [CrossRef]
- Shong, J.; Jimenez Diaz, M.R.; Collins, C.H. Towards synthetic microbial consortia for bioprocessing. Curr. Opin. Biotechnol. 2012, 23, 798–802. [Google Scholar] [CrossRef]
- Lee, L.S.; Goh, K.M.; Chan, C.S.; Annie Tan, G.Y.; Yin, W.; Chong, C.S.; Chan, K. Microbial diversity of thermophiles with biomass deconstruction potential in a foliage-rich hot spring. Microbiol. Open 2018, 7, e00615. [Google Scholar] [CrossRef] [PubMed]
- Rosselli, R.; Romoli, O.; Vitulo, N.; Vezzi, A.; Campanaro, S.; de Pascale, F.; Schiavon, R.; Tiarca, M.; Poletto, F.; Concheri, G.; et al. Direct 16S rRNA-seq from bacterial communities: A PCR-independent approach to simultaneously assess microbial diversity and functional activity potential of each taxon. Sci. Rep. 2016, 6, 32165. [Google Scholar] [CrossRef] [PubMed]
- Bittner, C.; Wehnert, G.; Scheper, T. In situ microscopy for on-line determination of biomass. Biotechnol. Bioeng. 1998, 60, 24–35. [Google Scholar] [CrossRef]
- Joeris, K.; Frerichs, J.-G.; Scheper, T.; Konstantinov, K. In-situ microscopy based monitoring of mammalian cell culture processes. In Animal Cell Technology Meets Genomics; Gòdia, F., Fussenegger, M., Eds.; Springer: Berlin/Heidelberg, Germany, 2005; Volume 2, pp. 605–608. [Google Scholar] [CrossRef]
- Bhatta, H.; Goldys, E.M.; Learmonth, R.P. Use of fluorescence spectroscopy to differentiate yeast and bacterial cells. Appl. Microbiol. Biotechnol. 2006, 71, 121–126. [Google Scholar] [CrossRef] [Green Version]
- Yang, L.; Zhou, Y.; Zhu, S.; Huang, T.; Wu, L.; Yan, X. Detection and quantification of bacterial autofluorescence at the single-cell level by a laboratory-built high-sensitivity flow cytometer. Anal. Chem. 2012, 84, 1526–1532. [Google Scholar] [CrossRef]
- Bäumler, M.; Schneider, M.; Ehrenreich, A.; Liebl, W.; Weuster-Botz, D. Synthetic co-culture of autotrophic Clostridium carboxidivorans and chain elongating Clostridium kluyveri monitored by flow cytometry. Microb. Biotechnol. 2022, 15, 1471–1485. [Google Scholar] [CrossRef]
- Liu, Z.; Cichocki, N.; Hübschmann, T.; Süring, C.; Ofiţeru, I.D.; Sloan, W.T.; Grimm, V.; Müller, S. Neutral mechanisms and niche differentiation in steady-state insular microbial communities revealed by single cell analysis. Environ. Microbiol. 2018, 21, 164–181. [Google Scholar] [CrossRef]
- Lambrecht, J.; Cichocki, N.; Schattenberg, F.; Kleinsteuber, S.; Harms, H.; Müller, S.; Sträuber, H. Key sub-community dynamics of medium-chain carboxylate production. Microb. Cell Factories 2019, 18, 92. [Google Scholar] [CrossRef] [Green Version]
- Martinez, J.A.; Delvenne, M.; Henrion, L.; Moreno, F.; Telek, S.; Dusny, C.; Delvigne, F. Controlling microbial co-culture based on substrate pulsing can lead to stability through differential fitness advantages. PLoS Comput. Biol. 2022, 18, e1010674. [Google Scholar] [CrossRef] [PubMed]
- Buysschaert, B.; Kerckhof, F.-M.; Vandamme, P.; De Baets, B.; Boon, N. Flow cytometric fingerprinting for microbial strain discrimination and physiological characterization. Cytom. Part A J. Int. Soc. Anal. Cytol. 2018, 93, 201–212. [Google Scholar] [CrossRef] [PubMed] [Green Version]
- Safford, H.R.; Bischel, H.N. Flow cytometry applications in water treatment, distribution, and reuse: A review. Water Res. 2019, 151, 110–133. [Google Scholar] [CrossRef] [PubMed]
- Van Nevel, S.; Koetzsch, S.; Proctor, C.R.; Besmer, M.D.; Prest, E.I.; Vrouwenvelder, J.S.; Knezev, A.; Boon, N.; Hammes, F. Flow cytometric bacterial cell counts challenge conventional heterotrophic plate counts for routine microbiological drinking water monitoring. Water Res. 2017, 113, 191–206. [Google Scholar] [CrossRef] [Green Version]
- Haange, S.-B.; Jehmlich, N.; Krügel, U.; Hintschich, C.; Wehrmann, D.; Hankir, M.; Seyfried, F.; Froment, J.; Hübschmann, T.; Müller, S.; et al. Gastric bypass surgery in a rat model alters the community structure and functional composition of the intestinal microbiota independently of weight loss. Microbiome 2020, 8, 13. [Google Scholar] [CrossRef] [PubMed]
- Zimmermann, J.; Hübschmann, T.; Schattenberg, F.; Schumann, J.; Durek, P.; Riedel, R.; Friedrich, M.; Glauben, R.; Siegmund, B.; Radbruch, A.; et al. High-resolution microbiota flow cytometry reveals dynamic colitis-associated changes in fecal bacterial composition. Eur. J. Immunol. 2016, 46, 1300–1303. [Google Scholar] [CrossRef]
- Esquivel, D.Y.A.; Guo, Y.; Brown, R.K.; Müller, S.; Schröder, U.; Harnisch, F. Investigating community dynamics and performance during microbial electrochemical degradation of whey. Chemelectrochem 2020, 7, 989–997. [Google Scholar] [CrossRef]
- Engel, C.; Schattenberg, F.; Dohnt, K.; Schröder, U.; Müller, S.; Krull, R. Long-term behaviour of defined mixed cultures of Geobacter sulfurreducens and Shewanella oneidensis in bioelectrochemical systems. Front. Bioeng. Biotechnol. 2019, 7, 60. [Google Scholar] [CrossRef] [Green Version]
- Besmer, M.D.; Weissbrodt, D.G.; Kratochvil, B.E.; Sigrist, J.A.; Weyland, M.S.; Hammes, F. The feasibility of automated online flow cytometry for in-situ monitoring of microbial dynamics in aquatic ecosystems. Front. Microbiol. 2014, 5, 265. [Google Scholar] [CrossRef] [Green Version]
- Schuster, J.; Huber, J.; Stumme, J.; Grieb, A.; Ernst, M. Combining real-time fluorescence spectroscopy and flow cytometry to reveal new insights in DOC and cell characterization of drinking water. Front. Environ. Chem. 2022, 3, 931067. [Google Scholar] [CrossRef]
- Besmer, M.D.; Sigrist, J.A.; Props, R.; Buysschaert, B.; Mao, G.; Boon, N.; Hammes, F. Laboratory-scale simulation and real-time tracking of a microbial contamination event and subsequent shock-chlorination in drinking water. Front. Microbiol. 2017, 8, 1900. [Google Scholar] [CrossRef] [PubMed]
- Hammes, F.; Broger, T.; Weilenmann, H.-U.; Vital, M.; Helbing, J.; Bosshart, U.; Huber, P.; Odermatt, R.P.; Sonnleitner, B. Development and laboratory-scale testing of a fully automated online flow cytometer for drinking water analysis. Cytom. Part A 2012, 81A, 508–516. [Google Scholar] [CrossRef] [PubMed]
- Pernice, M.C.; Gasol, J.M. Automated flow cytometry as a tool to obtain a fine-grain picture of marine prokaryote community structure along an entire oceanographic cruise. Front. Microbiol. 2023, 13, 1064112. [Google Scholar] [CrossRef] [PubMed]
- Bouchedja, D.N.; Danthine, S.; Kar, T.; Fickers, P.; Boudjellal, A.; Delvigne, F. Online flow cytometry, an interesting investigation process for monitoring lipid accumulation, dimorphism, and cells’ growth in the oleaginous yeast Yarrowia lipolytica JMY 775. Bioresour. Bioprocess. 2017, 4, 3. [Google Scholar] [CrossRef] [PubMed] [Green Version]
- Günther, S.; Hübschmann, T.; Rudolf, M.; Eschenhagen, M.; Röske, I.; Harms, H.; Müller, S. Fixation procedures for flow cytometric analysis of environmental bacteria. J. Microbiol. Methods 2008, 75, 127–134. [Google Scholar] [CrossRef]
- Bruckmann, C.; Müller, S.; zu Siederdissen, C.H. Automatic, fast, hierarchical, and non-overlapping gating of flow cytometric data with flowEMMi v2. Comput. Struct. Biotechnol. J. 2022, 20, 6473–6489. [Google Scholar] [CrossRef]
- Cichocki, N.; Hübschmann, T.; Schattenberg, F.; Kerckhof, F.-M.; Overmann, J.; Müller, S. Bacterial mock communities as standards for reproducible cytometric microbiome analysis. Nat. Protoc. 2020, 15, 2788–2812. [Google Scholar] [CrossRef]
- Favere, J.; Buysschaert, B.; Boon, N.; De Gusseme, B. Online microbial fingerprinting for quality management of drinking water: Full-scale event detection. Water Res. 2020, 170, 115353. [Google Scholar] [CrossRef]
- Haberkorn, I.; Off, C.L.; Besmer, M.D.; Buchmann, L.; Mathys, A. Automated online flow cytometry advances microalgal ecosystem management as in situ, high-temporal resolution monitoring tool. Front. Bioeng. Biotechnol. 2021, 9, 642671. [Google Scholar] [CrossRef]
- Prest, E.I.; Schaap, P.G.; Besmer, M.D.; Hammes, F. Dynamic hydraulics in a drinking water distribution system influence suspended particles and turbidity, but not microbiology. Water 2021, 13, 109. [Google Scholar] [CrossRef]
- Hammes, F.; Weilenmann, H.-U. Device and Method for Producing Individually Processed Fluid Samples. European Patent No. EP3573755A1, 4 December 2019. Available online: https://patents.google.com/patent/EP3573755A1/en?inventor=Frederik+Hammes (accessed on 18 April 2023).
- Koch, C.; Günther, S.; Desta, A.; Hübschmann, T.; Müller, S. Cytometric fingerprinting for analyzing microbial intracommunity structure variation and identifying subcommunity function. Nat. Protoc. 2013, 8, 190–202. [Google Scholar] [CrossRef]
- García-Solares, S.M.; Mena-Cervantes, V.Y.; Sosa-Rodríguez, F.S.; Hernández-Altamirano, R.; Vazquez-Arenas, J. circular economy involving microbial consortia in consolidated bioprocesses to produce biofuels. In Biofuels in Circular Economy; Bandh, S.A., Malla, F.A., Eds.; Springer Nature: Singapore, 2022; pp. 279–301. [Google Scholar] [CrossRef]
- O’Connor, K.E. Microbiology challenges and opportunities in the circular economy. Microbiology 2021, 167, 001026. [Google Scholar] [CrossRef] [PubMed]
- García-Timermans, C.; Rubbens, P.; Heyse, J.; Kerckhof, F.-M.; Props, R.; Skirtach, A.G.; Waegeman, W.; Boon, N. Discriminating bacterial phenotypes at the population and single-cell level: A Comparison of flow cytometry and raman spectroscopy Fingerprinting. Cytom. Part A 2020, 97, 713–726. [Google Scholar] [CrossRef]
- Li, S.; Liu, Z.; Süring, C.; Chen, L.; Müller, S.; Zeng, P. The impact of the antibiotic fosfomycin on wastewater communities measured by flow cytometry. Front. Microbiol. 2022, 12, 737831. [Google Scholar] [CrossRef] [PubMed]
- LeBaron, P.; Servais, P.; Agogué, H.; Courties, C.; Joux, F. Does the High Nucleic Acid content of individual bacterial cells allow us to discriminate between active cells and inactive cells in aquatic systems? Appl. Environ. Microbiol. 2001, 67, 1775–1782. [Google Scholar] [CrossRef] [PubMed] [Green Version]
- Li, S.; Abdulkadir, N.; Schattenberg, F.; da Rocha, U.N.; Grimm, V.; Müller, S.; Liu, Z. Stabilizing microbial communities by looped mass transfer. Proc. Natl. Acad. Sci. USA 2022, 119, e2117814119. [Google Scholar] [CrossRef] [PubMed]
- Hobro, A.J.; Smith, N.I. An evaluation of fixation methods: Spatial and compositional cellular changes observed by Raman imaging. Vib. Spectrosc. 2017, 91, 31–45. [Google Scholar] [CrossRef] [Green Version]
- Russo, I.; Del Mese, P.; Viretto, M.; Doronzo, G.; Mattiello, L.; Trovati, M.; Anfossi, G. Sodium azide, a bacteriostatic preservative contained in commercially available laboratory reagents, influences the responses of human platelets via the cGMP/PKG/VASP pathway. Clin. Biochem. 2008, 41, 343–349. [Google Scholar] [CrossRef]
- Alavi, P.; Starcher, M.R.; Zachow, C.; Müller, H.; Berg, G. Root-microbe systems: The effect and mode of interaction of Stress Protecting Agent (SPA) Stenotrophomonas rhizophila DSM14405T. Front. Plant Sci. 2013, 4, 141. [Google Scholar] [CrossRef] [Green Version]
- Deo, N.; Natarajan, K.; Somasundaran, P. Mechanisms of adhesion of Paenibacillus polymyxa onto hematite, corundum and quartz. Int. J. Miner. Process. 2001, 62, 27–39. [Google Scholar] [CrossRef]
- Purty, S.; Saranathan, R.; Prashanth, K.; Narayanan, K.; Asir, J.; Sheela Devi, C.; Kumar Amarnath, S. The expanding spectrum of human infections caused by Kocuria species: A case report and literature review. Emerg. Microbes Infect. 2013, 2, 1. [Google Scholar] [CrossRef] [PubMed]
- Koch, C.; Fetzer, I.; Harms, H.; Müller, S. CHIC-an automated approach for the detection of dynamic variations in complex microbial communities. Cytom. Part A 2013, 83, 561–567. [Google Scholar] [CrossRef] [PubMed] [Green Version]


| MilliQ H2O | 100% FlowClean Cleaning Agent | 10% FlowClean Cleaning Agent | 1% FlowClean Cleaning Agent | ||
|---|---|---|---|---|---|
| P. polymyxa | Cell concentration in bacterial sample (cells/mL) | 5.14 × 10⁸ ± 20.1% | 6.25 × 10⁸ ± 25.7% | 7.02 × 10⁸ ± 25.6% | 2.83 × 10⁸ ± 21.5% |
| Cell concentration in water sample (cells/mL) | 3.88 × 10⁷ ± 18.4% | 4.89 × 10⁷ ± 29.7% | 2.20 × 10⁷ ± 24.7% | 1.08 × 10⁷ ± 11.7% | |
| Carryover percentage | 7.6 ± 2.3% | 7.83 ± 2.7% | 3.1 ± 0.4% | 3.8 ± 1.0% | |
| K. rhizophila | Cell concentration in bacterial sample (cells/mL) | 4.99 × 10⁸ ± 10.9% | 2.65 × 10⁸ ± 10.0% | 4.82 × 10⁸ ± 21.0% | 4.12 × 10⁸ ± 11.4% |
| Cell concentration in water sample (cells/mL) | 1.54 × 10⁷ ± 23.4% | 8.39 × 10⁶ ± 12.2% | 1.02 × 10⁷ ± 21.6% | 4.37 × 10⁶ ± 15.1% | |
| Carryover percentage | 3.1 ± 3.1% | 3.2 ± 0.5% | 2.1 ± 0.8% | 1.1 ± 0.2% | |
| S. rhizophila | Cell concentration in bacterial sample (cells/mL) | 1.25 × 10⁹ ± 21.2% | 4.05 × 10⁹ ± 9.1% | 1.51 × 10⁹ ± 8.37% | 1.39 × 10⁹ ± 10.5% |
| Cell concentration in water sample (cells/mL) | 4.27 × 10⁷ ± 6.3% | 9.66 × 10⁷ ± 7.9% | 4.22 × 10⁷ ± 18.5% | 3.85 × 10⁷ ± 12.4% | |
| Carryover percentage | 3.41 ± 0.6% | 2.4 ± 0.2% | 2.8 ± 0.5% | 2.9 ± 0.6% |
Disclaimer/Publisher’s Note: The statements, opinions and data contained in all publications are solely those of the individual author(s) and contributor(s) and not of MDPI and/or the editor(s). MDPI and/or the editor(s) disclaim responsibility for any injury to people or property resulting from any ideas, methods, instructions or products referred to in the content. |
© 2023 by the authors. Licensee MDPI, Basel, Switzerland. This article is an open access article distributed under the terms and conditions of the Creative Commons Attribution (CC BY) license (https://creativecommons.org/licenses/by/4.0/).
Share and Cite
López-Gálvez, J.; Schiessl, K.; Besmer, M.D.; Bruckmann, C.; Harms, H.; Müller, S. Development of an Automated Online Flow Cytometry Method to Quantify Cell Density and Fingerprint Bacterial Communities. Cells 2023, 12, 1559. https://doi.org/10.3390/cells12121559
López-Gálvez J, Schiessl K, Besmer MD, Bruckmann C, Harms H, Müller S. Development of an Automated Online Flow Cytometry Method to Quantify Cell Density and Fingerprint Bacterial Communities. Cells. 2023; 12(12):1559. https://doi.org/10.3390/cells12121559
Chicago/Turabian StyleLópez-Gálvez, Juan, Konstanze Schiessl, Michael D. Besmer, Carmen Bruckmann, Hauke Harms, and Susann Müller. 2023. "Development of an Automated Online Flow Cytometry Method to Quantify Cell Density and Fingerprint Bacterial Communities" Cells 12, no. 12: 1559. https://doi.org/10.3390/cells12121559
APA StyleLópez-Gálvez, J., Schiessl, K., Besmer, M. D., Bruckmann, C., Harms, H., & Müller, S. (2023). Development of an Automated Online Flow Cytometry Method to Quantify Cell Density and Fingerprint Bacterial Communities. Cells, 12(12), 1559. https://doi.org/10.3390/cells12121559