
Regulation of Primary Cilium Length by O-GlcNAc during Neuronal Development in a Human Neuron Model

 , and
, and 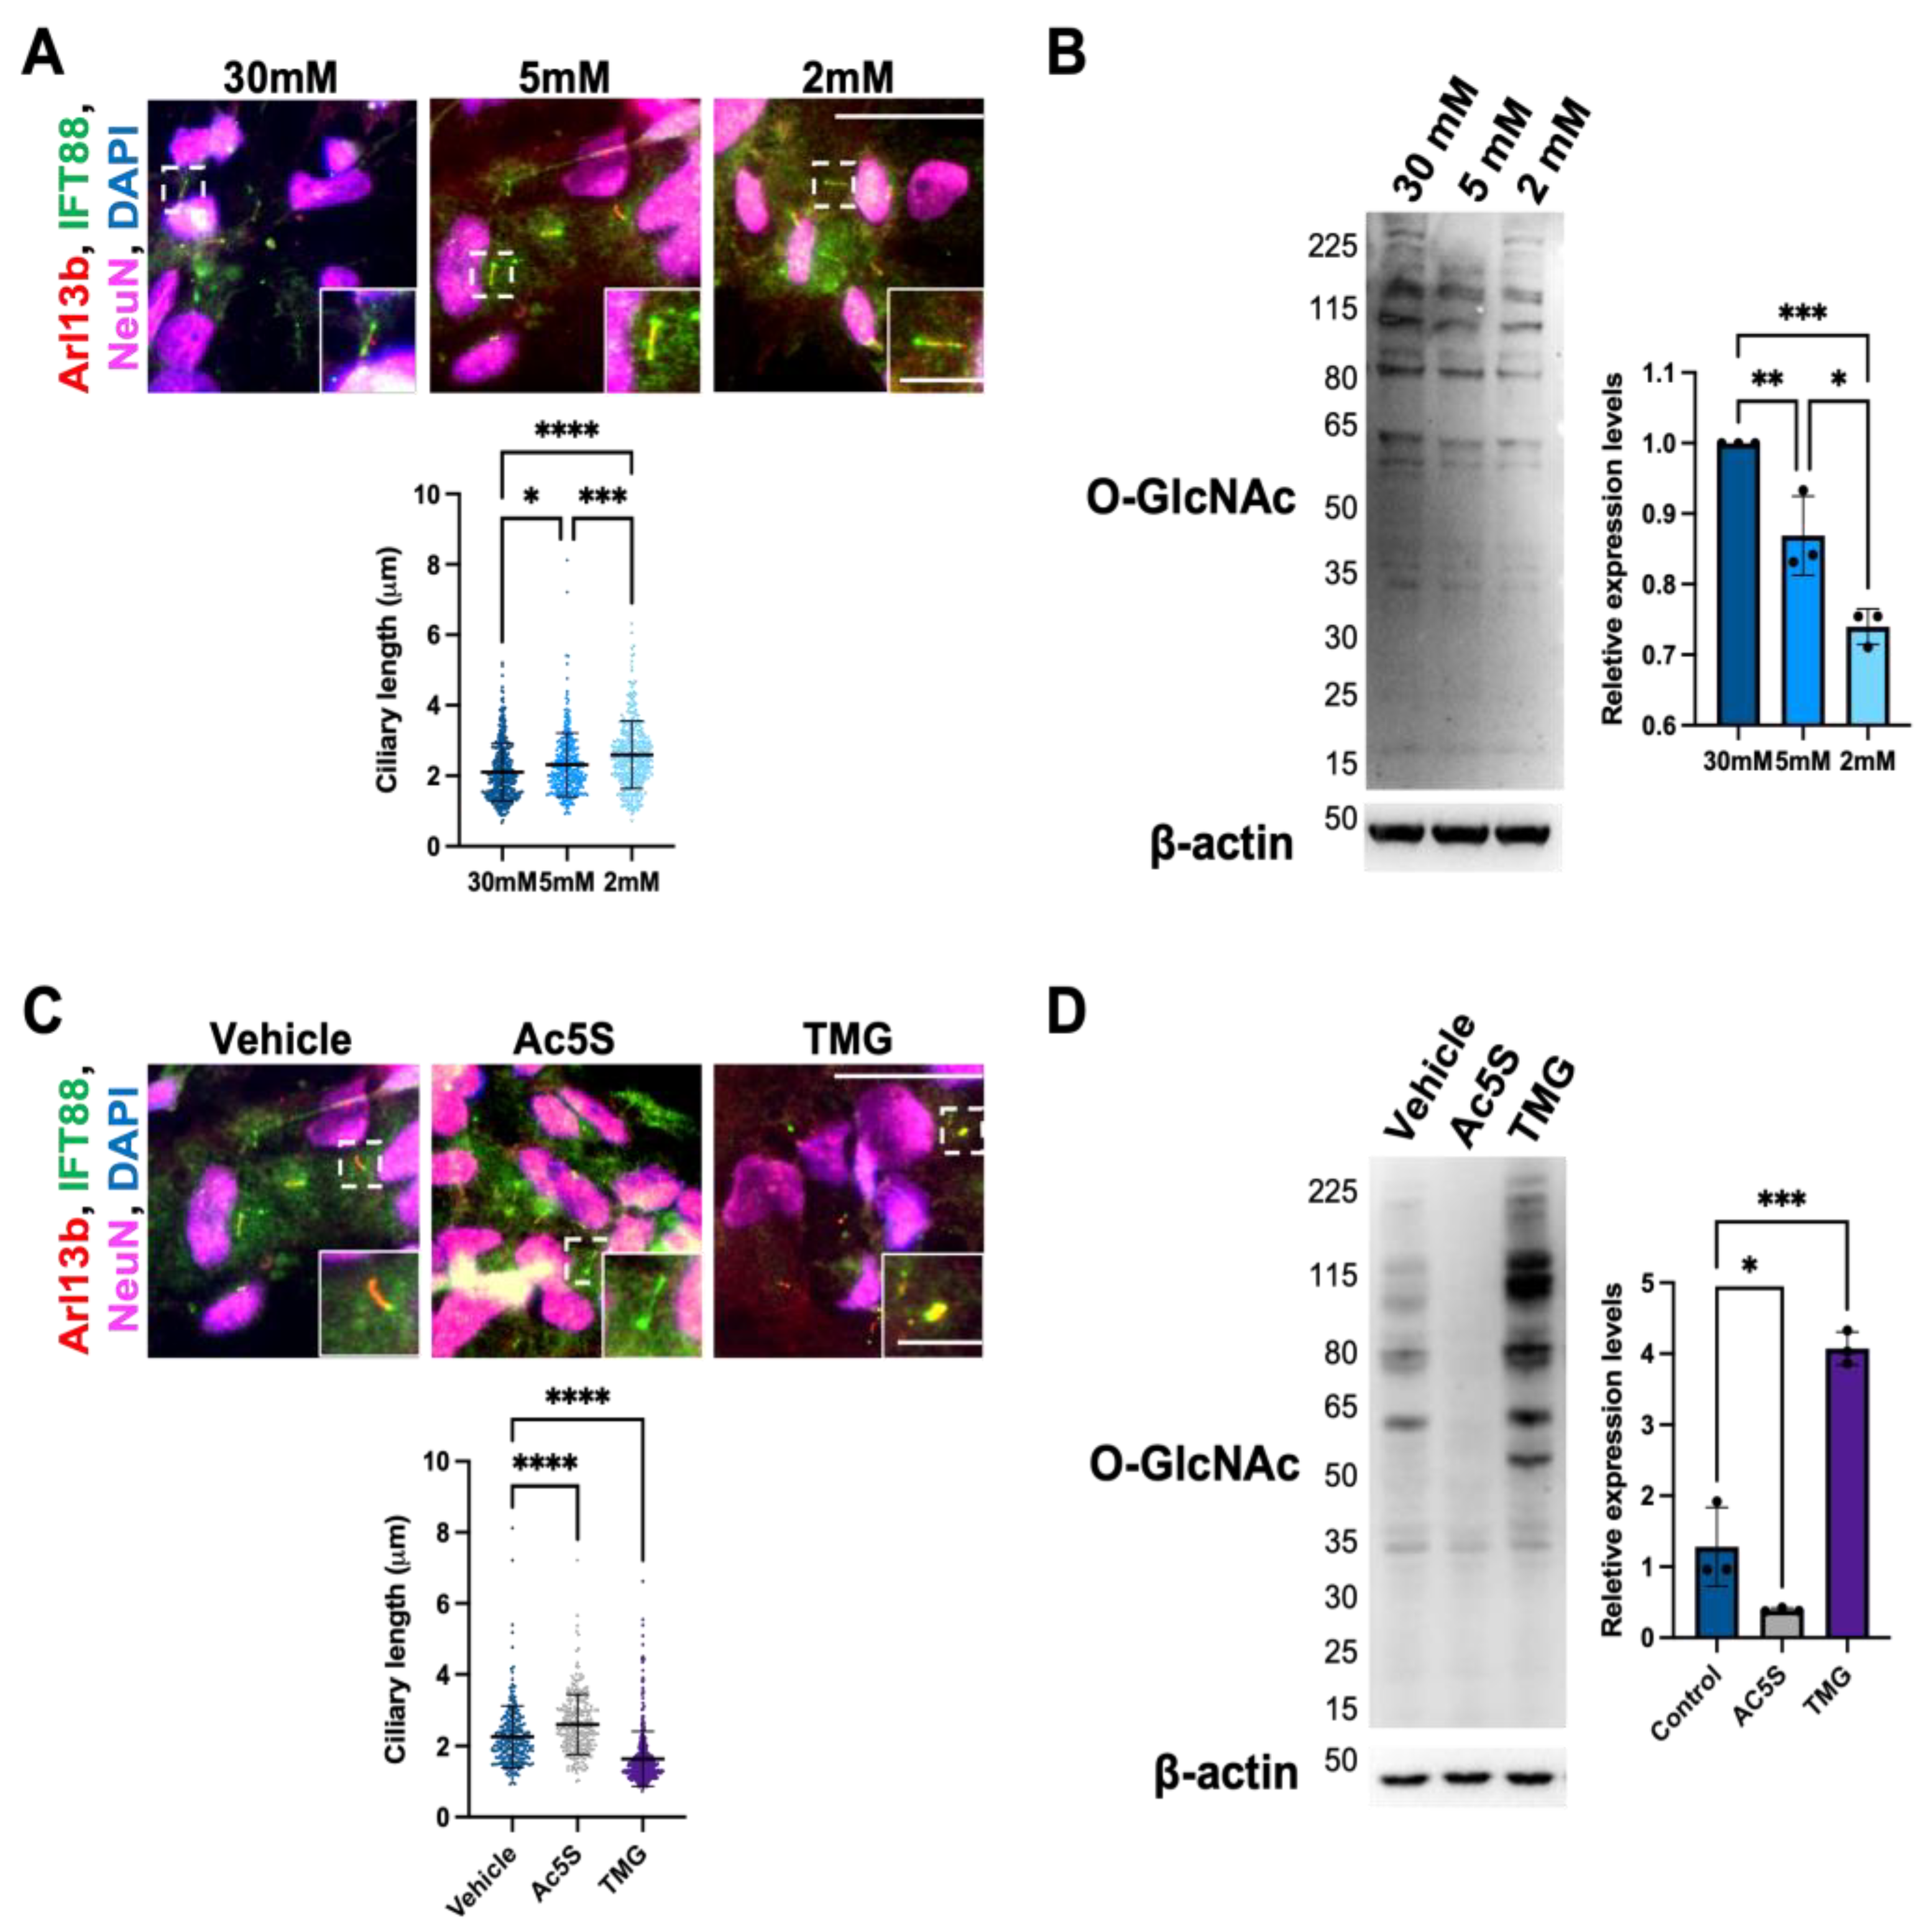
Abstract
1. Introduction
2. Materials and Methods
2.1. iPSC Cell Lines and Maintenance
2.2. Cortical Neuron Differentiation and Treatments
2.3. Western Blots
2.4. Immunofluorescence Staining
2.5. Quantification and Statistical Analysis
3. Results
3.1. Results
3.1.1. Cilium Length in Cortical Neurons Is Negatively Correlated with O-GlcNAc Levels
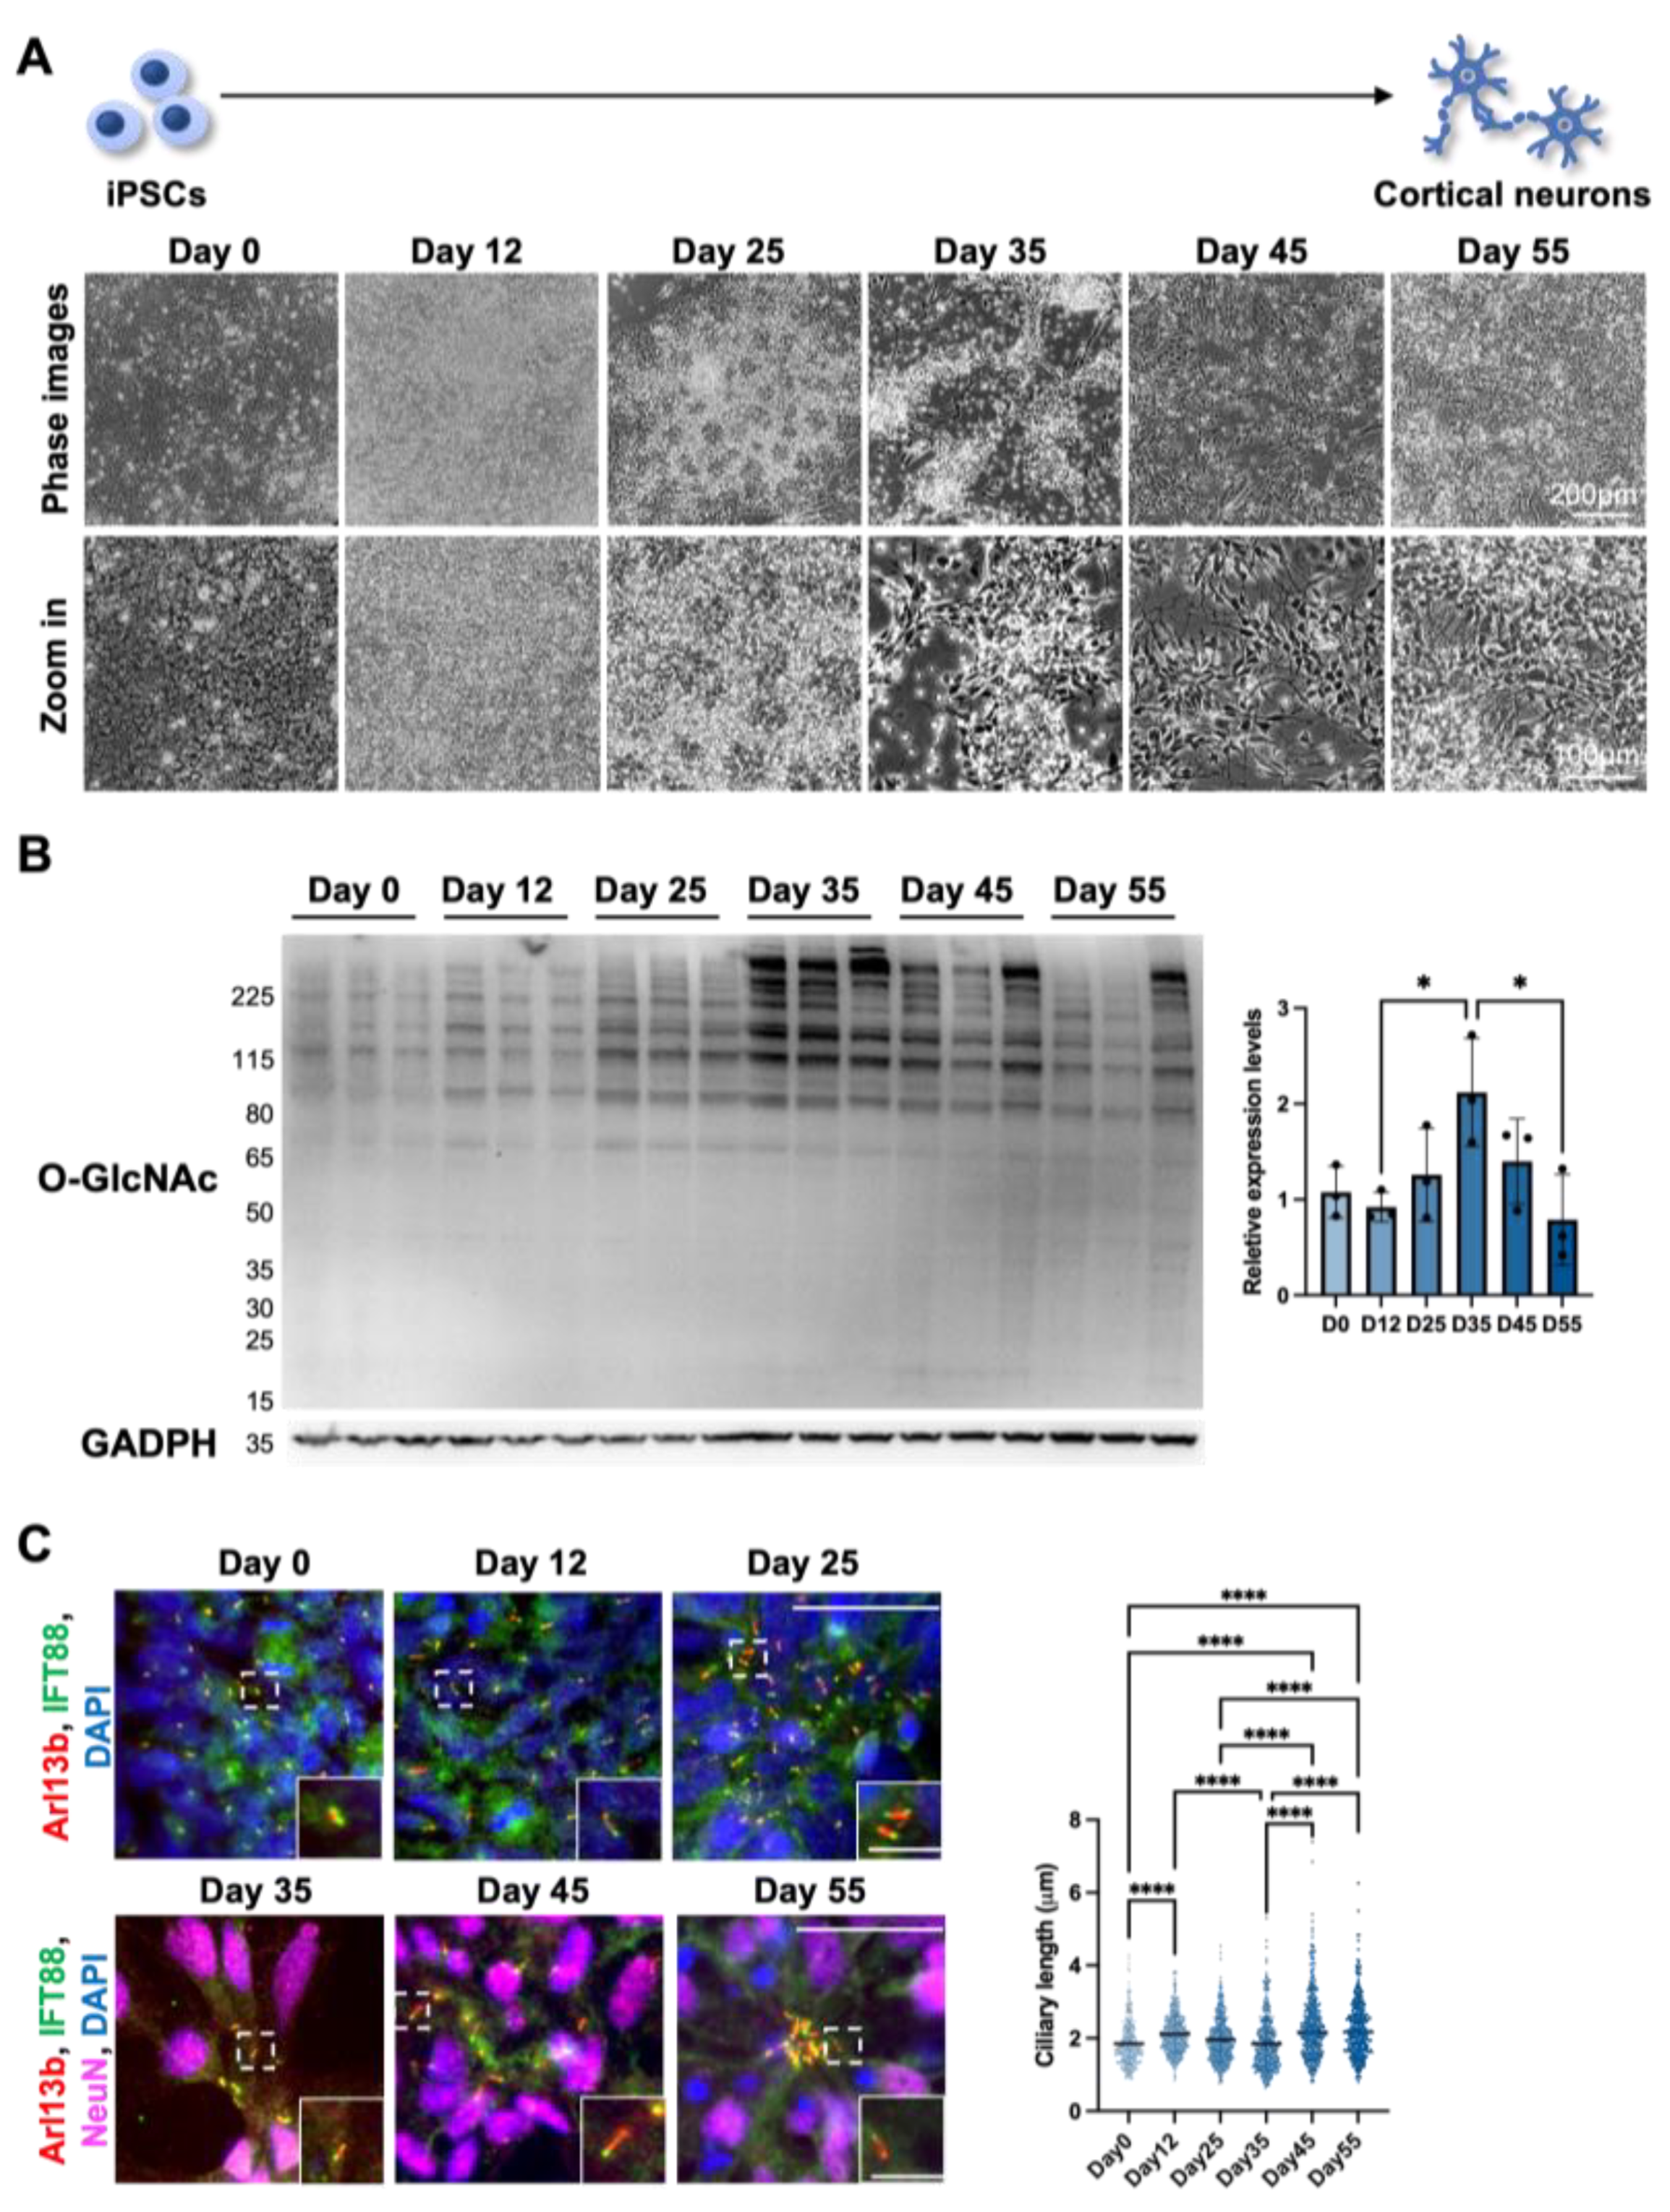
3.1.2. Cilia Formation Is Partially Regulated by O-GlcNAc Levels during Cortical Neuron Differentiation
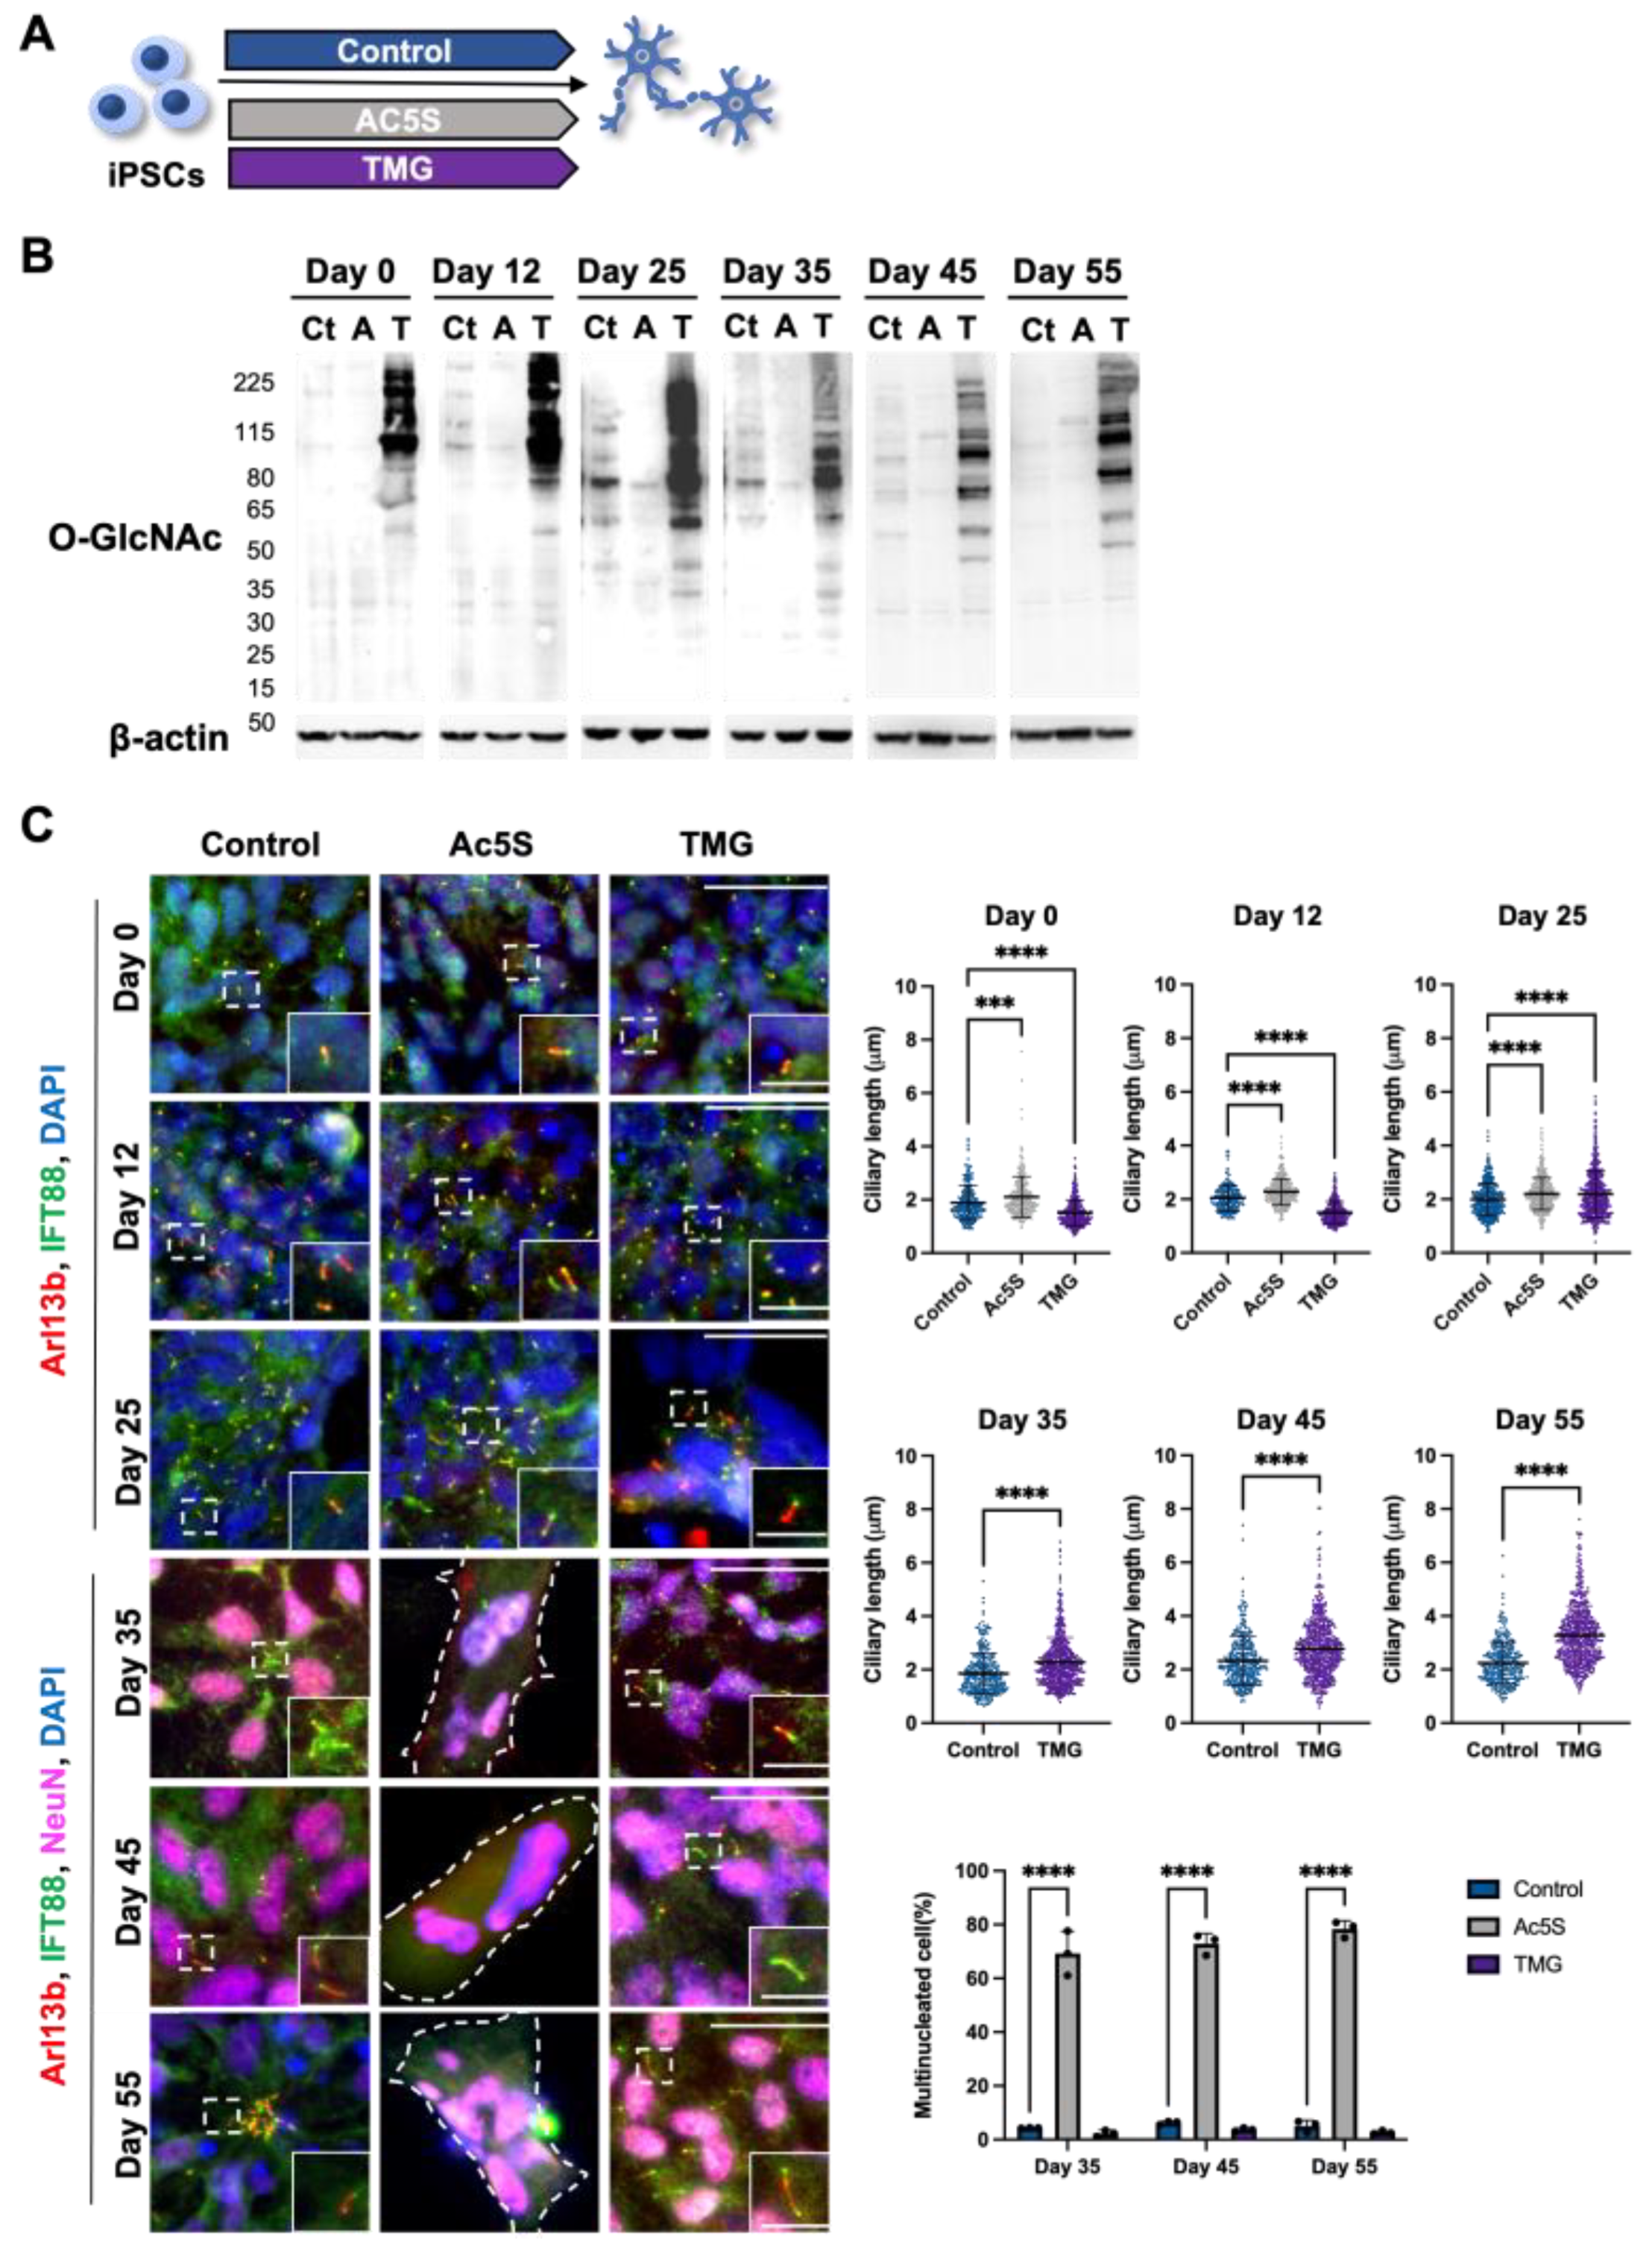
3.1.3. Long-Term Perturbation of OGN Causes Ciliary Defect during Cortical Neuron Development
3.1.4. Altered OGN and Subsequent Cilia Formation Interferes with Cortical Neuronal Differentiation
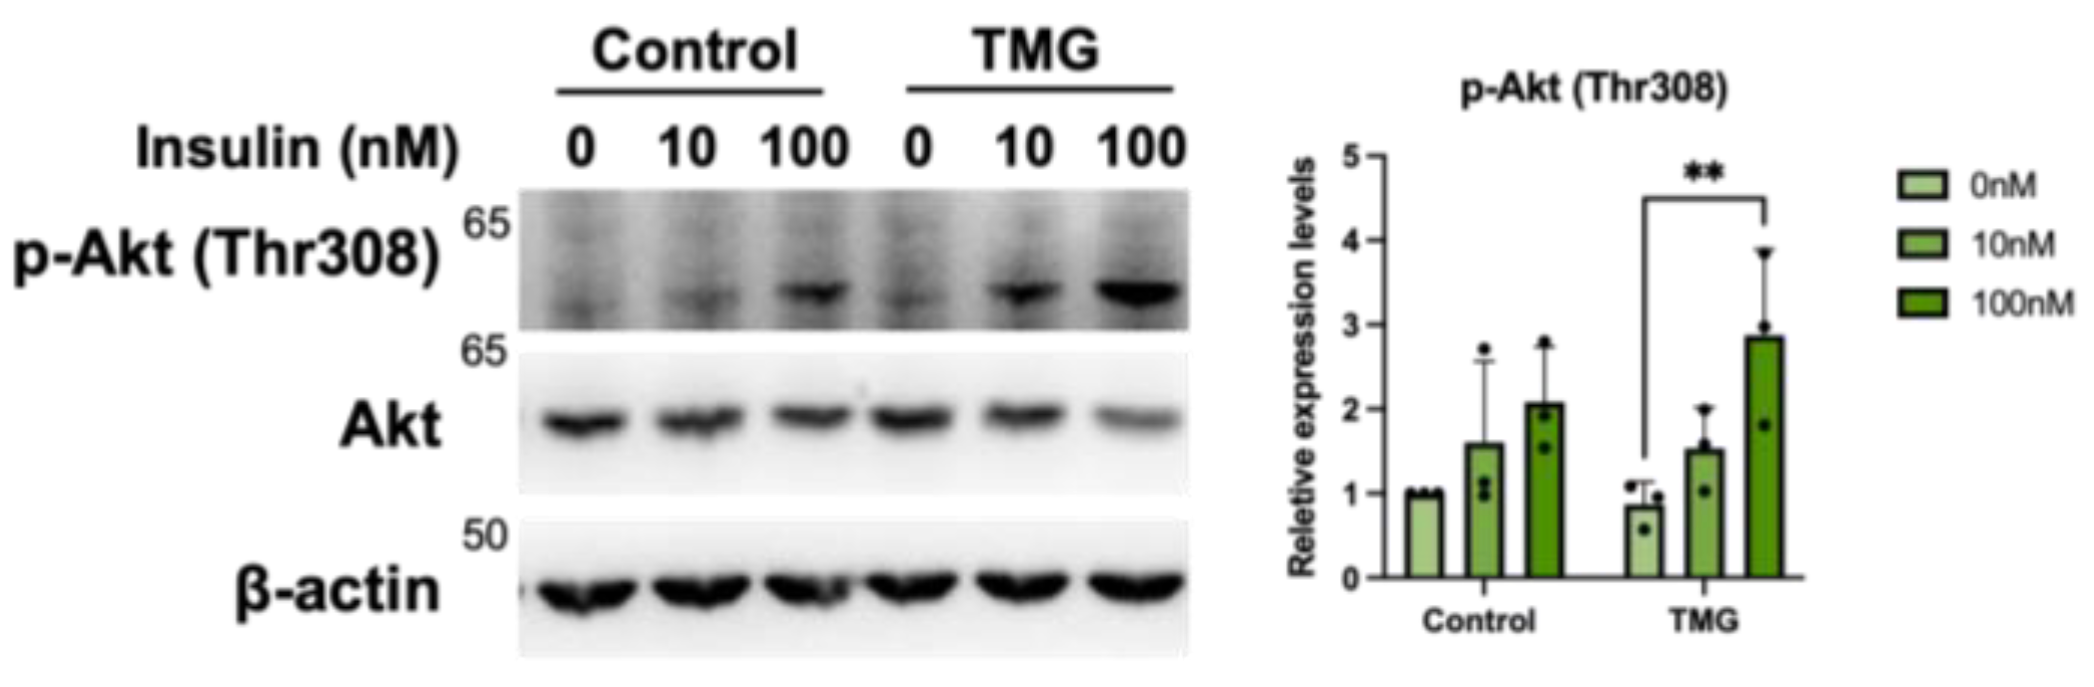
3.1.5. Increased Primary Cilium Length Leads to Higher Insulin Sensitivity of TMG-Treated Neurons
4. Discussion
Author Contributions
Funding
Institutional Review Board Statement
Informed Consent Statement
Data Availability Statement
Acknowledgments
Conflicts of Interest
References
- Pazour, G.J.; Witman, G.B. The vertebrate primary cilium is a sensory organelle. Curr. Opin. Cell Biol. 2003, 15, 105–110. [Google Scholar] [CrossRef] [PubMed]
- Goto, H.; Inoko, A.; Inagaki, M. Cell cycle progression by the repression of primary cilia formation in proliferating cells. Cell. Mol. Life Sci. 2013, 70, 3893–3905. [Google Scholar] [CrossRef]
- Mirvis, M.; Stearns, T.; James Nelson, W. Cilium structure, assembly, and disassembly regulated by the cytoskeleton. Biochem. J. 2018, 475, 2329–2353. [Google Scholar] [CrossRef]
- Plotnikova, O.V.; Golemis, E.A.; Pugacheva, E.N. Cell cycle-dependent ciliogenesis and cancer. Cancer Res. 2008, 68, 2058–2061. [Google Scholar] [CrossRef] [PubMed]
- Inoko, A.; Matsuyama, M.; Goto, H.; Ohmuro-Matsuyama, Y.; Hayashi, Y.; Enomoto, M.; Ibi, M.; Urano, T.; Yonemura, S.; Kiyono, T.; et al. Trichoplein and Aurora A block aberrant primary cilia assembly in proliferating cells. J. Cell Biol. 2012, 197, 391–405. [Google Scholar] [CrossRef]
- Besschetnova, T.Y.; Kolpakova-Hart, E.; Guan, Y.; Zhou, J.; Olsen, B.R.; Shah, J.V. Identification of signaling pathways regulating primary cilium length and flow-mediated adaptation. Curr. Biol. 2010, 20, 182–187. [Google Scholar] [CrossRef] [PubMed]
- Resnick, A.; Hopfer, U. Force-response considerations in ciliary mechanosensation. Biophys. J. 2007, 93, 1380–1390. [Google Scholar] [CrossRef] [PubMed]
- Sun, S.; Fisher, R.L.; Bowser, S.S.; Pentecost, B.T.; Sui, H. Three-dimensional architecture of epithelial primary cilia. Proc. Natl. Acad. Sci. USA 2019, 116, 9370–9379. [Google Scholar] [CrossRef]
- Wang, L.; Weidenfeld, R.; Verghese, E.; Ricardo, S.D.; Deane, J.A. Alterations in renal cilium length during transient complete ureteral obstruction in the mouse. J. Anat. 2008, 213, 79–85. [Google Scholar] [CrossRef]
- Verghese, E.; Ricardo, S.D.; Weidenfeld, R.; Zhuang, J.; Hill, P.A.; Langham, R.G.; Deane, J.A. Renal primary cilia lengthen after acute tubular necrosis. J. Am. Soc. Nephrol. 2009, 20, 2147–2153. [Google Scholar] [CrossRef]
- Collin, G.B.; Marshall, J.D.; Ikeda, A.; So, W.V.; Russell-Eggitt, I.; Maffei, P.; Beck, S.; Boerkoel, C.F.; Sicolo, N.; Martin, M.; et al. Mutations in ALMS1 cause obesity, type 2 diabetes and neurosensory degeneration in Alstrom syndrome. Nat. Genet. 2002, 31, 74–78. [Google Scholar] [CrossRef] [PubMed]
- Romani, M.; Micalizzi, A.; Valente, E.M. Joubert syndrome: Congenital cerebellar ataxia with the molar tooth. Lancet Neurol. 2013, 12, 894–905. [Google Scholar] [CrossRef]
- Hernandez-Hernandez, V.; Pravincumar, P.; Diaz-Font, A.; May-Simera, H.; Jenkins, D.; Knight, M.; Beales, P.L. Bardet-Biedl syndrome proteins control the cilia length through regulation of actin polymerization. Hum. Mol. Genet. 2013, 22, 3858–3868. [Google Scholar] [CrossRef]
- May-Simera, H.L.; Wan, Q.; Jha, B.S.; Hartford, J.; Khristov, V.; Dejene, R.; Chang, J.; Patnaik, S.; Lu, Q.; Banerjee, P.; et al. Primary Cilium-Mediated Retinal Pigment Epithelium Maturation Is Disrupted in Ciliopathy Patient Cells. Cell Rep. 2018, 22, 189–205. [Google Scholar] [CrossRef] [PubMed]
- Shi, H.; Wang, H.; Zhang, C.; Lu, Y.; Yao, J.; Chen, Z.; Xing, G.; Wei, Q.; Cao, X. Mutations in OSBPL2 cause hearing loss associated with primary cilia defects via sonic hedgehog signaling. JCI Insight 2022, 7, e149626. [Google Scholar] [CrossRef]
- Luo, N.; Conwell, M.D.; Chen, X.; Kettenhofen, C.I.; Westlake, C.J.; Cantor, L.B.; Wells, C.D.; Weinreb, R.N.; Corson, T.W.; Spandau, D.F.; et al. Primary cilia signaling mediates intraocular pressure sensation. Proc. Natl. Acad. Sci. USA 2014, 111, 12871–12876. [Google Scholar] [CrossRef] [PubMed]
- McEwen, D.P.; Koenekoop, R.K.; Khanna, H.; Jenkins, P.M.; Lopez, I.; Swaroop, A.; Martens, J.R. Hypomorphic CEP290/NPHP6 mutations result in anosmia caused by the selective loss of G proteins in cilia of olfactory sensory neurons. Proc. Natl. Acad. Sci. USA 2007, 104, 15917–15922. [Google Scholar] [CrossRef]
- Butler, M.T.; Wallingford, J.B. Planar cell polarity in development and disease. Nat. Rev. Mol. Cell Biol. 2017, 18, 375–388. [Google Scholar] [CrossRef]
- Ehnert, S.; Sreekumar, V.; Aspera-Werz, R.H.; Sajadian, S.O.; Wintermeyer, E.; Sandmann, G.H.; Bahrs, C.; Hengstler, J.G.; Godoy, P.; Nussler, A.K. TGF-beta1 impairs mechanosensation of human osteoblasts via HDAC6-mediated shortening and distortion of primary cilia. J. Mol. Med. 2017, 95, 653–663. [Google Scholar] [CrossRef]
- Zullo, A.; Iaconis, D.; Barra, A.; Cantone, A.; Messaddeq, N.; Capasso, G.; Dolle, P.; Igarashi, P.; Franco, B. Kidney-specific inactivation of Ofd1 leads to renal cystic disease associated with upregulation of the mTOR pathway. Hum. Mol. Genet. 2010, 19, 2792–2803. [Google Scholar] [CrossRef]
- Grisanti, L.; Revenkova, E.; Gordon, R.E.; Iomini, C. Primary cilia maintain corneal epithelial homeostasis by regulation of the Notch signaling pathway. Development 2016, 143, 2160–2171. [Google Scholar] [CrossRef] [PubMed]
- Kim, M.; Kim, M.; Lee, M.S.; Kim, C.H.; Lim, D.S. The MST1/2-SAV1 complex of the Hippo pathway promotes ciliogenesis. Nat. Commun. 2014, 5, 5370. [Google Scholar] [CrossRef] [PubMed]
- Town, T.; Breunig, J.J.; Sarkisian, M.R.; Spilianakis, C.; Ayoub, A.E.; Liu, X.; Ferrandino, A.F.; Gallagher, A.R.; Li, M.O.; Rakic, P.; et al. The stumpy gene is required for mammalian ciliogenesis. Proc. Natl. Acad. Sci. USA 2008, 105, 2853–2858. [Google Scholar] [CrossRef]
- Breunig, J.J.; Sarkisian, M.R.; Arellano, J.I.; Morozov, Y.M.; Ayoub, A.E.; Sojitra, S.; Wang, B.; Flavell, R.A.; Rakic, P.; Town, T. Primary cilia regulate hippocampal neurogenesis by mediating sonic hedgehog signaling. Proc. Natl. Acad. Sci. USA 2008, 105, 13127–13132. [Google Scholar] [CrossRef]
- Baudoin, J.P.; Viou, L.; Launay, P.S.; Luccardini, C.; Espeso Gil, S.; Kiyasova, V.; Irinopoulou, T.; Alvarez, C.; Rio, J.P.; Boudier, T.; et al. Tangentially migrating neurons assemble a primary cilium that promotes their reorientation to the cortical plate. Neuron 2012, 76, 1108–1122. [Google Scholar] [CrossRef]
- Bae, J.E.; Kang, G.M.; Min, S.H.; Jo, D.S.; Jung, Y.K.; Kim, K.; Kim, M.S.; Cho, D.H. Primary cilia mediate mitochondrial stress responses to promote dopamine neuron survival in a Parkinson’s disease model. Cell Death Dis. 2019, 10, 952. [Google Scholar] [CrossRef]
- Li, A.; Saito, M.; Chuang, J.Z.; Tseng, Y.Y.; Dedesma, C.; Tomizawa, K.; Kaitsuka, T.; Sung, C.H. Ciliary transition zone activation of phosphorylated Tctex-1 controls ciliary resorption, S-phase entry and fate of neural progenitors. Nat. Cell Biol. 2011, 13, 402–411. [Google Scholar] [CrossRef]
- Lee, C.H.; Song, D.K.; Park, C.B.; Choi, J.; Kang, G.M.; Shin, S.H.; Kwon, I.; Park, S.; Kim, S.; Kim, J.Y.; et al. Primary cilia mediate early life programming of adiposity through lysosomal regulation in the developing mouse hypothalamus. Nat. Commun. 2020, 11, 5772. [Google Scholar] [CrossRef]
- Choi, H.; Madhu, V.; Shapiro, I.M.; Risbud, M.V. Nucleus pulposus primary cilia alter their length in response to changes in extracellular osmolarity but do not control TonEBP-mediated osmoregulation. Sci. Rep. 2019, 9, 15469. [Google Scholar] [CrossRef]
- Matsumoto, M.; Sawada, M.; Garcia-Gonzalez, D.; Herranz-Perez, V.; Ogino, T.; Bang Nguyen, H.; Quynh Thai, T.; Narita, K.; Kumamoto, N.; Ugawa, S.; et al. Dynamic Changes in Ultrastructure of the Primary Cilium in Migrating Neuroblasts in the Postnatal Brain. J. Neurosci. 2019, 39, 9967–9988. [Google Scholar] [CrossRef]
- Stilling, S.; Kalliakoudas, T.; Benninghoven-Frey, H.; Inoue, T.; Falkenburger, B.H. PIP2 determines length and stability of primary cilia by balancing membrane turnovers. Commun. Biol. 2022, 5, 93. [Google Scholar] [CrossRef] [PubMed]
- Sachamitr, P.; Ho, J.C.; Ciamponi, F.E.; Ba-Alawi, W.; Coutinho, F.J.; Guilhamon, P.; Kushida, M.M.; Cavalli, F.M.G.; Lee, L.; Rastegar, N.; et al. PRMT5 inhibition disrupts splicing and stemness in glioblastoma. Nat. Commun. 2021, 12, 979. [Google Scholar] [CrossRef]
- Tian, J.L.; Qin, H. O-GlcNAcylation Regulates Primary Ciliary Length by Promoting Microtubule Disassembly. iScience 2019, 12, 379–391. [Google Scholar] [CrossRef]
- Yang, Y.; Hao, H.; Wu, X.; Guo, S.; Liu, Y.; Ran, J.; Li, T.; Li, D.; Liu, M.; Zhou, J. Mixed-lineage leukemia protein 2 suppresses ciliary assembly by the modulation of actin dynamics and vesicle transport. Cell Discov. 2019, 5, 33. [Google Scholar] [CrossRef]
- Yang, Y.; Ran, J.; Liu, M.; Li, D.; Li, Y.; Shi, X.; Meng, D.; Pan, J.; Ou, G.; Aneja, R.; et al. CYLD mediates ciliogenesis in multiple organs by deubiquitinating Cep70 and inactivating HDAC6. Cell Res. 2014, 24, 1342–1353. [Google Scholar] [CrossRef] [PubMed]
- Ozcan, S.; Andrali, S.S.; Cantrell, J.E. Modulation of transcription factor function by O-GlcNAc modification. Biochim. Biophys. Acta 2010, 1799, 353–364. [Google Scholar] [CrossRef] [PubMed]
- Li, C.; He, A.; Guo, Y.; Yang, X.; Luo, M.; Cheng, Z.; Huang, L.; Xia, Y.; Luo, S. Hypertonic stress modulates eNOS function through O-GlcNAc modification at Thr-866. Sci. Rep. 2021, 11, 11272. [Google Scholar] [CrossRef]
- Wang, S.; Huang, X.; Sun, D.; Xin, X.; Pan, Q.; Peng, S.; Liang, Z.; Luo, C.; Yang, Y.; Jiang, H.; et al. Extensive crosstalk between O-GlcNAcylation and phosphorylation regulates Akt signaling. PLoS ONE 2012, 7, e37427. [Google Scholar] [CrossRef]
- Yi, W.; Clark, P.M.; Mason, D.E.; Keenan, M.C.; Hill, C.; Goddard, W.A., III; Peters, E.C.; Driggers, E.M.; Hsieh-Wilson, L.C. Phosphofructokinase 1 glycosylation regulates cell growth and metabolism. Science 2012, 337, 975–980. [Google Scholar] [CrossRef]
- Hart, G.W. Three Decades of Research on O-GlcNAcylation-A Major Nutrient Sensor That Regulates Signaling, Transcription and Cellular Metabolism. Front. Endocrinol. (Lausanne) 2014, 5, 183. [Google Scholar] [CrossRef]
- Swamy, M.; Pathak, S.; Grzes, K.M.; Damerow, S.; Sinclair, L.V.; van Aalten, D.M.; Cantrell, D.A. Glucose and glutamine fuel protein O-GlcNAcylation to control T cell self-renewal and malignancy. Nat. Immunol. 2016, 17, 712–720. [Google Scholar] [CrossRef] [PubMed]
- Guo, H.; Zhang, B.; Nairn, A.V.; Nagy, T.; Moremen, K.W.; Buckhaults, P.; Pierce, M. O-Linked N-Acetylglucosamine (O-GlcNAc) Expression Levels Epigenetically Regulate Colon Cancer Tumorigenesis by Affecting the Cancer Stem Cell Compartment via Modulating Expression of Transcriptional Factor MYBL1. J. Biol. Chem. 2017, 292, 4123–4137. [Google Scholar] [CrossRef] [PubMed]
- Gelinas, R.; Mailleux, F.; Dontaine, J.; Bultot, L.; Demeulder, B.; Ginion, A.; Daskalopoulos, E.P.; Esfahani, H.; Dubois-Deruy, E.; Lauzier, B.; et al. AMPK activation counteracts cardiac hypertrophy by reducing O-GlcNAcylation. Nat. Commun. 2018, 9, 374. [Google Scholar] [CrossRef] [PubMed]
- Umapathi, P.; Mesubi, O.O.; Banerjee, P.S.; Abrol, N.; Wang, Q.; Luczak, E.D.; Wu, Y.; Granger, J.M.; Wei, A.C.; Reyes Gaido, O.E.; et al. Excessive O-GlcNAcylation Causes Heart Failure and Sudden Death. Circulation 2021, 143, 1687–1703. [Google Scholar] [CrossRef]
- Ferrer, C.M.; Lynch, T.P.; Sodi, V.L.; Falcone, J.N.; Schwab, L.P.; Peacock, D.L.; Vocadlo, D.J.; Seagroves, T.N.; Reginato, M.J. O-GlcNAcylation regulates cancer metabolism and survival stress signaling via regulation of the HIF-1 pathway. Mol. Cell 2014, 54, 820–831. [Google Scholar] [CrossRef]
- de Queiroz, R.M.; Madan, R.; Chien, J.; Dias, W.B.; Slawson, C. Changes in O-Linked N-Acetylglucosamine (O-GlcNAc) Homeostasis Activate the p53 Pathway in Ovarian Cancer Cells. J. Biol. Chem. 2016, 291, 18897–18914. [Google Scholar] [CrossRef] [PubMed]
- Peterson, S.B.; Hart, G.W. New insights: A role for O-GlcNAcylation in diabetic complications. Crit. Rev. Biochem. Mol. Biol. 2016, 51, 150–161. [Google Scholar] [CrossRef]
- Park, J.; Ha, H.J.; Chung, E.S.; Baek, S.H.; Cho, Y.; Kim, H.K.; Han, J.; Sul, J.H.; Lee, J.; Kim, E.; et al. O-GlcNAcylation ameliorates the pathological manifestations of Alzheimer’s disease by inhibiting necroptosis. Sci. Adv. 2021, 7, eabd3207. [Google Scholar] [CrossRef]
- Liu, F.; Iqbal, K.; Grundke-Iqbal, I.; Hart, G.W.; Gong, C.X. O-GlcNAcylation regulates phosphorylation of tau: A mechanism involved in Alzheimer’s disease. Proc. Natl. Acad. Sci. USA 2004, 101, 10804–10809. [Google Scholar] [CrossRef]
- Constable, S.; Lim, J.M.; Vaidyanathan, K.; Wells, L. O-GlcNAc transferase regulates transcriptional activity of human Oct4. Glycobiology 2017, 27, 927–937. [Google Scholar] [CrossRef]
- Akinbiyi, E.O.; Abramowitz, L.K.; Bauer, B.L.; Stoll, M.S.K.; Hoppel, C.L.; Hsiao, C.P.; Hanover, J.A.; Mears, J.A. Blocked O-GlcNAc cycling alters mitochondrial morphology, function, and mass. Sci. Rep. 2021, 11, 22106. [Google Scholar] [CrossRef] [PubMed]
- Park, S.J.; Bae, J.E.; Jo, D.S.; Kim, J.B.; Park, N.Y.; Fang, J.; Jung, Y.K.; Jo, D.G.; Cho, D.H. Increased O-GlcNAcylation of Drp1 by amyloid-beta promotes mitochondrial fission and dysfunction in neuronal cells. Mol. Brain 2021, 14, 6. [Google Scholar] [CrossRef] [PubMed]
- Shin, H.; Cha, H.J.; Na, K.; Lee, M.J.; Cho, J.Y.; Kim, C.Y.; Kim, E.K.; Kang, C.M.; Kim, H.; Paik, Y.K. O-GlcNAcylation of the Tumor Suppressor FOXO3 Triggers Aberrant Cancer Cell Growth. Cancer Res. 2018, 78, 1214–1224. [Google Scholar] [CrossRef]
- Yu, F.; Guo, S.; Li, T.; Ran, J.; Zhao, W.; Li, D.; Liu, M.; Yan, X.; Yang, X.; Zhu, X.; et al. Ciliary defects caused by dysregulation of O-GlcNAc modification are associated with diabetic complications. Cell Res. 2019, 29, 171–173. [Google Scholar] [CrossRef]
- Si-Tayeb, K.; Noto, F.K.; Sepac, A.; Sedlic, F.; Bosnjak, Z.J.; Lough, J.W.; Duncan, S.A. Generation of human induced pluripotent stem cells by simple transient transfection of plasmid DNA encoding reprogramming factors. BMC Dev. Biol. 2010, 10, 81. [Google Scholar] [CrossRef] [PubMed]
- Wu, H.F.; Zeltner, N. Efficient Differentiation of Postganglionic Sympathetic Neurons using Human Pluripotent Stem Cells under Feeder-free and Chemically Defined Culture Conditions. J. Vis. Exp. 2020, e60843. [Google Scholar] [CrossRef]
- Shi, Y.; Kirwan, P.; Smith, J.; Robinson, H.P.; Livesey, F.J. Human cerebral cortex development from pluripotent stem cells to functional excitatory synapses. Nat. Neurosci. 2012, 15, 477–486. [Google Scholar] [CrossRef]
- Shi, Y.; Kirwan, P.; Livesey, F.J. Directed differentiation of human pluripotent stem cells to cerebral cortex neurons and neural networks. Nat. Protoc. 2012, 7, 1836–1846. [Google Scholar] [CrossRef]
- King, C.R.; AR, A.A.Q.; Chazeau, A.; Saarloos, I.; van der Graaf, A.J.; Verhage, M.; Toonen, R.F. Fbxo41 Promotes Disassembly of Neuronal Primary Cilia. Sci. Rep. 2019, 9, 8179. [Google Scholar] [CrossRef]
- Zachara, N.E.; Hart, G.W. Cell signaling, the essential role of O-GlcNAc! Biochim. Biophys. Acta 2006, 1761, 599–617. [Google Scholar] [CrossRef]
- Gabriel, E.; Wason, A.; Ramani, A.; Gooi, L.M.; Keller, P.; Pozniakovsky, A.; Poser, I.; Noack, F.; Telugu, N.S.; Calegari, F.; et al. CPAP promotes timely cilium disassembly to maintain neural progenitor pool. EMBO J. 2016, 35, 803–819. [Google Scholar] [CrossRef] [PubMed]
- Ma, R.; Kutchy, N.A.; Chen, L.; Meigs, D.D.; Hu, G. Primary cilia and ciliary signaling pathways in aging and age-related brain disorders. Neurobiol. Dis. 2022, 163, 105607. [Google Scholar] [CrossRef]
- Ishii, S.; Sasaki, T.; Mohammad, S.; Hwang, H.; Tomy, E.; Somaa, F.; Ishibashi, N.; Okano, H.; Rakic, P.; Hashimoto-Torii, K.; et al. Primary cilia safeguard cortical neurons in neonatal mouse forebrain from environmental stress-induced dendritic degeneration. Proc. Natl. Acad. Sci. USA 2021, 118, e2012482118. [Google Scholar] [CrossRef] [PubMed]
- Guemez-Gamboa, A.; Coufal, N.G.; Gleeson, J.G. Primary cilia in the developing and mature brain. Neuron 2014, 82, 511–521. [Google Scholar] [CrossRef] [PubMed]
- Tian, J.L.; Gomeshtapeh, F.I. Potential Roles of O-GlcNAcylation in Primary Cilia- Mediated Energy Metabolism. Biomolecules 2020, 10, 1504. [Google Scholar] [CrossRef] [PubMed]
- Han, Y.M.; Kang, G.M.; Byun, K.; Ko, H.W.; Kim, J.; Shin, M.S.; Kim, H.K.; Gil, S.Y.; Yu, J.H.; Lee, B.; et al. Leptin-promoted cilia assembly is critical for normal energy balance. J. Clin. Investig. 2014, 124, 2193–2197. [Google Scholar] [CrossRef] [PubMed]
- Kirk, S.L.; Samuelsson, A.M.; Argenton, M.; Dhonye, H.; Kalamatianos, T.; Poston, L.; Taylor, P.D.; Coen, C.W. Maternal obesity induced by diet in rats permanently influences central processes regulating food intake in offspring. PLoS ONE 2009, 4, e5870. [Google Scholar] [CrossRef]
- Rocha, C.; Prinos, P. Post-transcriptional and Post-translational Modifications of Primary Cilia: How to Fine Tune Your Neuronal Antenna. Front. Cell. Neurosci. 2022, 16, 809917. [Google Scholar] [CrossRef] [PubMed]
- Wang, G.; Krishnamurthy, K.; Chiang, Y.W.; Dasgupta, S.; Bieberich, E. Regulation of neural progenitor cell motility by ceramide and potential implications for mouse brain development. J. Neurochem. 2008, 106, 718–733. [Google Scholar] [CrossRef]
- He, Q.; Wang, G.; Wakade, S.; Dasgupta, S.; Dinkins, M.; Kong, J.N.; Spassieva, S.D.; Bieberich, E. Primary cilia in stem cells and neural progenitors are regulated by neutral sphingomyelinase 2 and ceramide. Mol. Biol. Cell 2014, 25, 1715–1729. [Google Scholar] [CrossRef]
- Thomas, S.; Boutaud, L.; Reilly, M.L.; Benmerah, A. Cilia in hereditary cerebral anomalies. Biol. Cell 2019, 111, 217–231. [Google Scholar] [CrossRef] [PubMed]
- Gerdes, J.M.; Davis, E.E.; Katsanis, N. The vertebrate primary cilium in development, homeostasis, and disease. Cell 2009, 137, 32–45. [Google Scholar] [CrossRef] [PubMed]
- Li, Z.; Li, X.; Nai, S.; Geng, Q.; Liao, J.; Xu, X.; Li, J. Checkpoint kinase 1-induced phosphorylation of O-linked beta-N-acetylglucosamine transferase regulates the intermediate filament network during cytokinesis. J. Biol. Chem. 2017, 292, 19548–19555. [Google Scholar] [CrossRef] [PubMed]


Disclaimer/Publisher’s Note: The statements, opinions and data contained in all publications are solely those of the individual author(s) and contributor(s) and not of MDPI and/or the editor(s). MDPI and/or the editor(s) disclaim responsibility for any injury to people or property resulting from any ideas, methods, instructions or products referred to in the content. |
© 2023 by the authors. Licensee MDPI, Basel, Switzerland. This article is an open access article distributed under the terms and conditions of the Creative Commons Attribution (CC BY) license (https://creativecommons.org/licenses/by/4.0/).
Share and Cite
Tian, J.L.; Huang, C.-W.; Eslami, F.; Mannino, M.P.; Mai, R.L.; Hart, G.W. Regulation of Primary Cilium Length by O-GlcNAc during Neuronal Development in a Human Neuron Model. Cells 2023, 12, 1520. https://doi.org/10.3390/cells12111520
Tian JL, Huang C-W, Eslami F, Mannino MP, Mai RL, Hart GW. Regulation of Primary Cilium Length by O-GlcNAc during Neuronal Development in a Human Neuron Model. Cells. 2023; 12(11):1520. https://doi.org/10.3390/cells12111520
Chicago/Turabian StyleTian, Jie L., Chia-Wei Huang, Farzad Eslami, Michael Philip Mannino, Rebecca Lee Mai, and Gerald W. Hart. 2023. "Regulation of Primary Cilium Length by O-GlcNAc during Neuronal Development in a Human Neuron Model" Cells 12, no. 11: 1520. https://doi.org/10.3390/cells12111520
APA StyleTian, J. L., Huang, C.-W., Eslami, F., Mannino, M. P., Mai, R. L., & Hart, G. W. (2023). Regulation of Primary Cilium Length by O-GlcNAc during Neuronal Development in a Human Neuron Model. Cells, 12(11), 1520. https://doi.org/10.3390/cells12111520