

Cell Proliferation Indices in Regenerating Alitta virens (Annelida, Errantia)


Abstract
1. Introduction
2. Materials and Methods
2.1. Animals
2.2. EdU Incorporation and Detection
2.3. Visualization and Cell Counting
2.4. Cell Cycle Parameters
3. Results
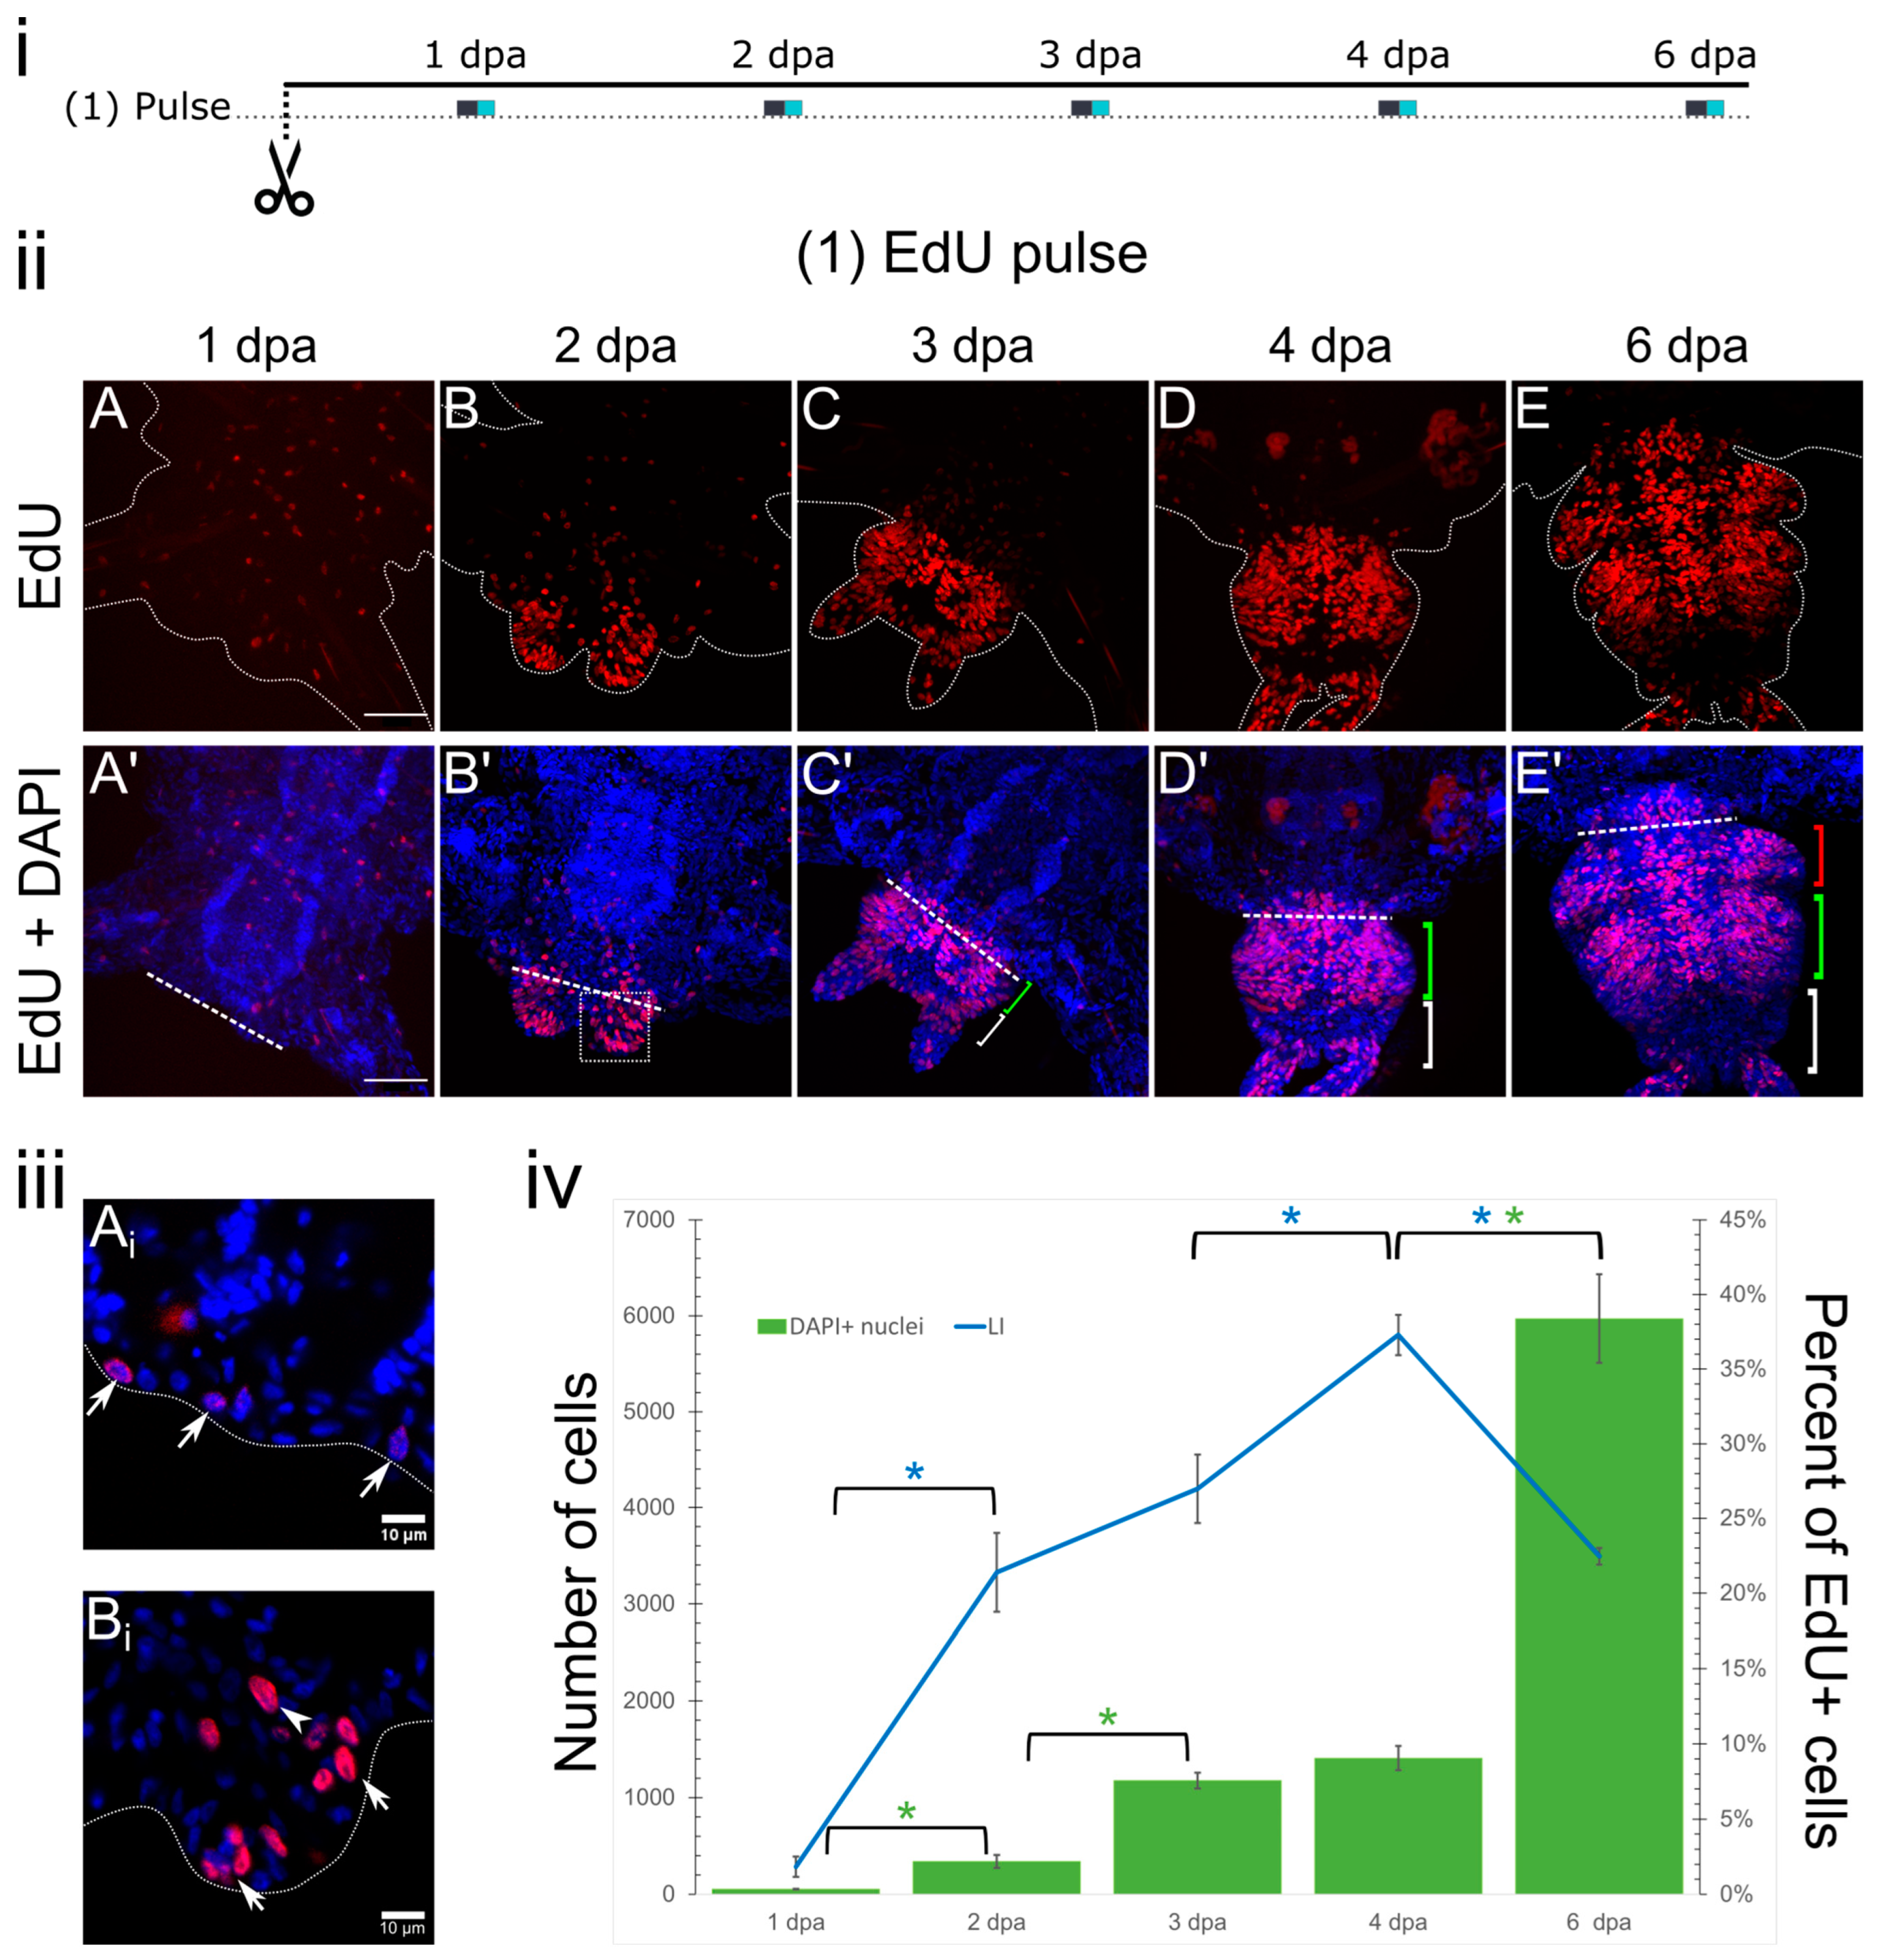
3.1. Pulse Labeling
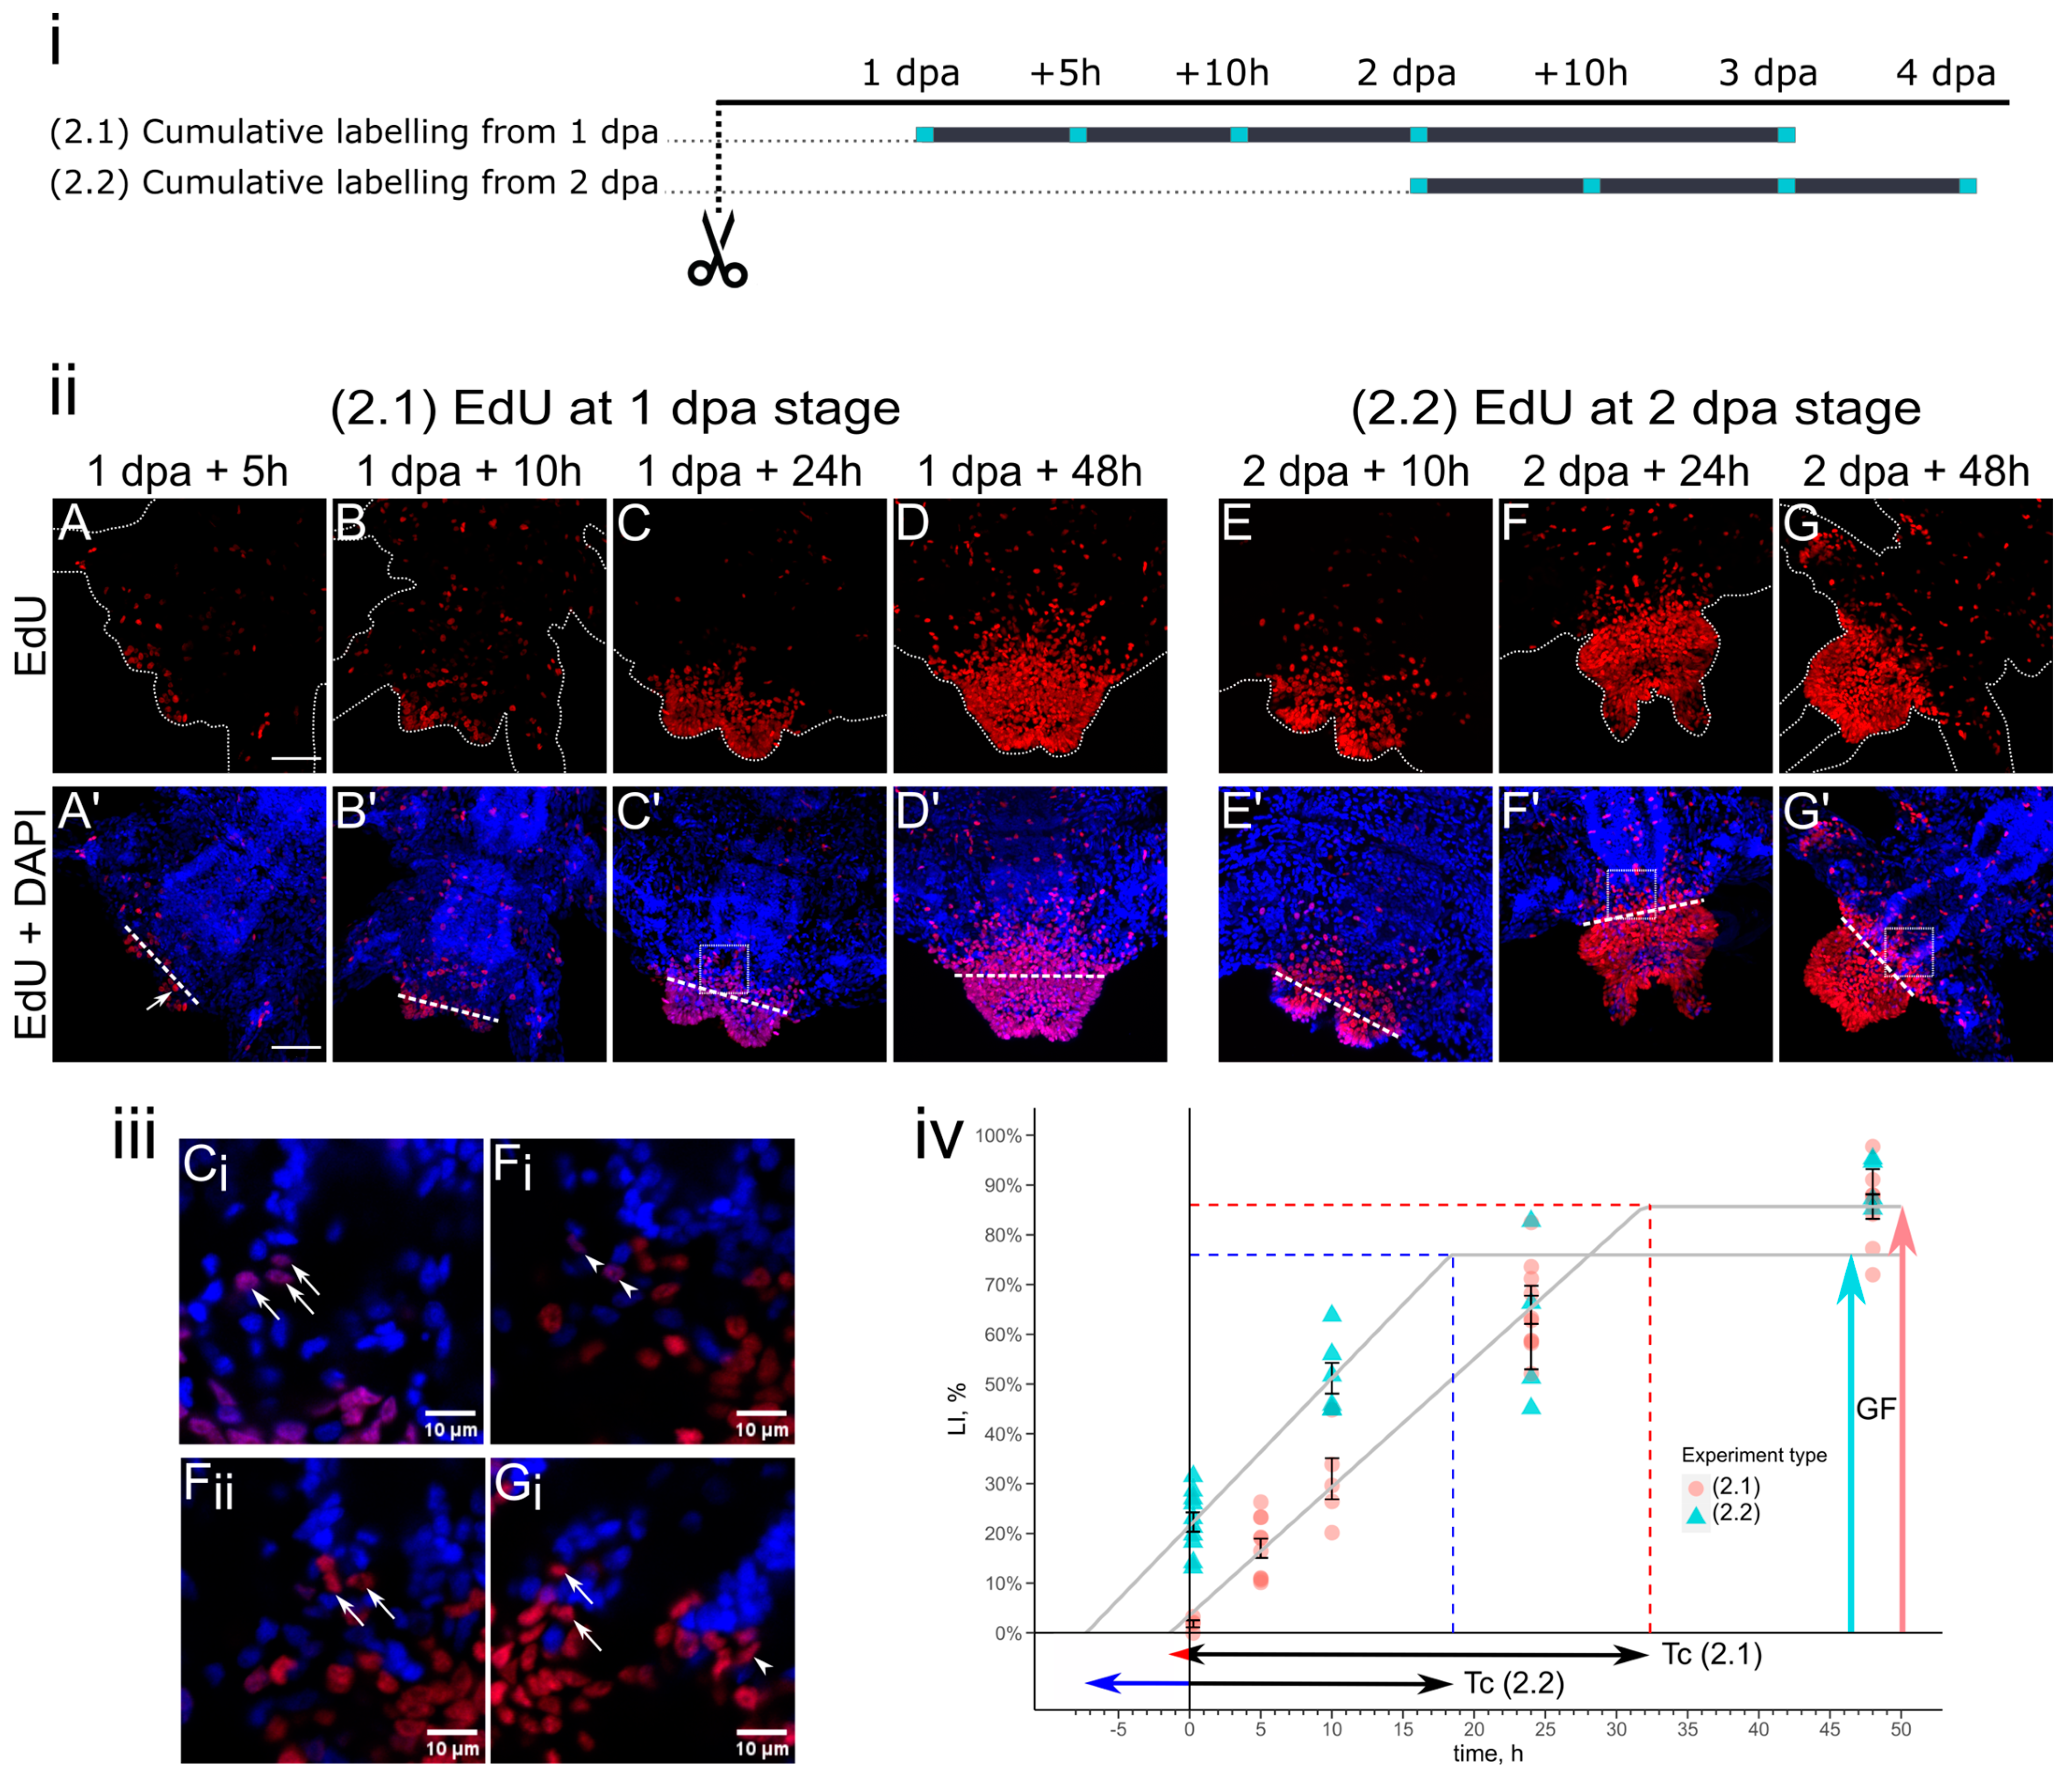
3.2. Cell Kinetics in Cumulative Labeling
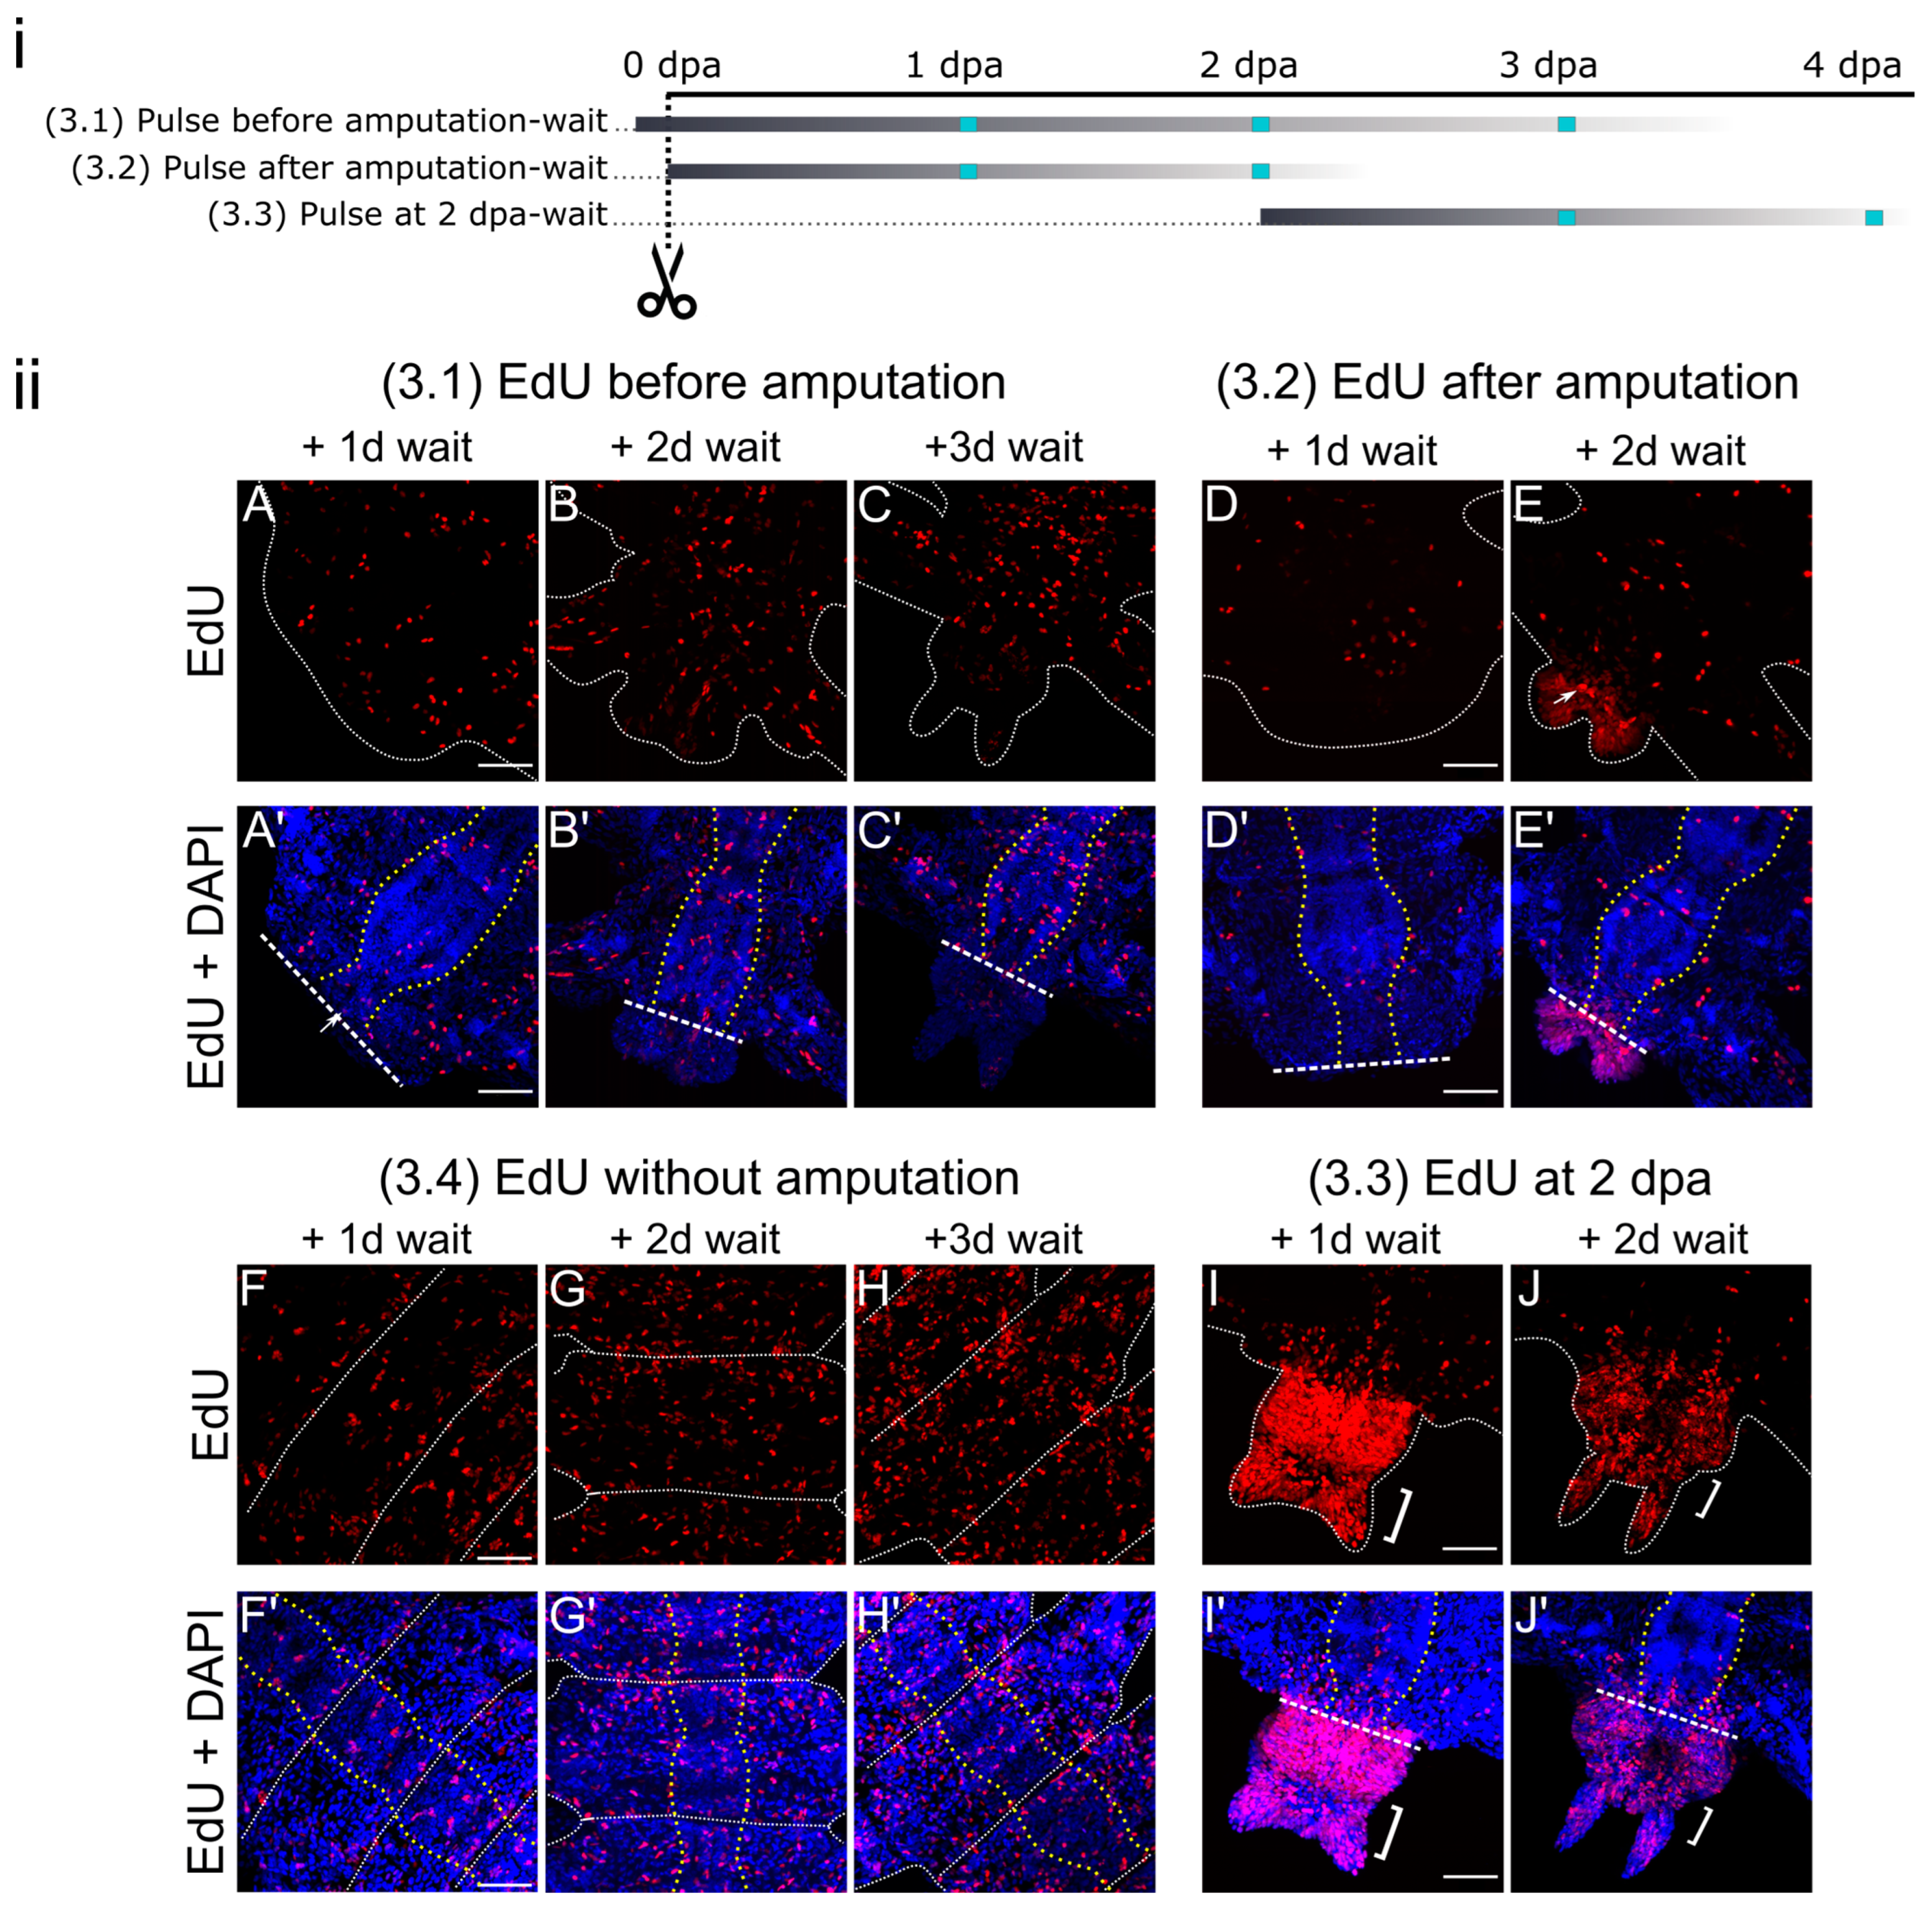
3.3. Pulse-Wait Labeling
4. Discussion
4.1. Spatial and Temporal Dynamics of EdU Incorporation in Regenerative Bud
4.2. Contribution of the Wound-Adjacent Tissues to Formation of the Regenerative Bud
4.3. Cell Cycle and Subpopulations of Proliferating Cells in Blastema
5. Conclusions
Supplementary Materials
Author Contributions
Funding
Institutional Review Board Statement
Informed Consent Statement
Data Availability Statement
Acknowledgments
Conflicts of Interest
References
- Bely, A.E. Early events in annelid regeneration: A cellular perspective. Integr. Comp. Biol. 2014, 54, 688–699. [Google Scholar] [CrossRef] [PubMed]
- Kostyuchenko, R.P.; Kozin, V.V. Comparative aspects of annelid regeneration: Towards understanding the mechanisms of regeneration. Genes 2021, 12, 1148. [Google Scholar] [CrossRef] [PubMed]
- Özpolat, B.D.; Bely, A.E. Developmental and molecular biology of annelid regeneration: A comparative review of recent studies. Curr. Opin. Genet. Dev. 2016, 40, 144–153. [Google Scholar] [CrossRef] [PubMed]
- Randolph, H. The regeneration of the tail in Lumbriculus. J. Morphol. 1892, 7, 317–344. [Google Scholar] [CrossRef]
- Seaver, E.C.; de Jong, D.M. Regeneration in the Segmented Annelid Capitella teleta. Genes 2021, 12, 1769. [Google Scholar] [CrossRef]
- Sugio, M.; Yoshida-Noro, C.; Ozawa, K.; Tochinai, S. Stem cells in asexual reproduction of Enchytraeus japonensis (Oligochaeta, Annelid): Proliferation and migration of neoblasts. Dev. Growth Differ. 2012, 54, 439–450. [Google Scholar] [CrossRef]
- Zattara, E.E.; Turlington, K.W.; Bely, A.E. Long-term time-lapse live imaging reveals extensive cell migration during annelid regeneration. BMC Dev. Biol. 2016, 16, 6. [Google Scholar] [CrossRef]
- De Jong, D.M.; Seaver, E.C. Investigation into the cellular origins of posterior regeneration in the annelid Capitella teleta. Regeneration 2018, 5, 61–77. [Google Scholar] [CrossRef]
- Planques, A.; Malem, J.; Parapar, J.; Vervoort, M.; Gazave, E. Morphological, cellular and molecular characterization of posterior regeneration in the marine annelid Platynereis dumerilii. Dev. Biol. 2019, 445, 189–210. [Google Scholar] [CrossRef]
- Ribeiro, R.P.; Egger, B.; Ponz-Segrelles, G.; Aguado, M.T. Cellular proliferation dynamics during regeneration in Syllis malaquini (Syllidae, Annelida). Front. Zool. 2021, 18, 27. [Google Scholar] [CrossRef]
- Gehrke, A.R.; Srivastava, M. Neoblasts and the evolution of whole-body regeneration. Curr. Opin. Genet. Dev. 2016, 40, 131–137. [Google Scholar] [CrossRef] [PubMed]
- Raz, A.A.; Wurtzel, O.; Reddien, P.W. Planarian Stem Cells Specify Fate yet Retain Potency during the Cell Cycle. Cell Stem Cell 2021, 28, 1307–1322.e5. [Google Scholar] [CrossRef] [PubMed]
- Reddien, P.W. The Cellular and Molecular Basis for Planarian Regeneration. Cell 2018, 175, 327–345. [Google Scholar] [CrossRef] [PubMed]
- Tadokoro, R.; Sugio, M.; Kutsuna, J.; Tochinai, S.; Takahashi, Y. Early Segregation of Germ and Somatic Lineages during Gonadal Regeneration in the Annelid Enchytraeus japonensis. Curr. Biol. 2006, 16, 1012–1017. [Google Scholar] [CrossRef]
- Fontés, M.; Coulon, J.; Delgross, M.-H.; Thouveny, Y. Muscle dedifferentiation and contractile protein synthesis during post-traumatic regeneration by Owenia fusiformis (Polychaete annelid). Cell Differ. 1983, 13, 267–282. [Google Scholar] [CrossRef]
- Arenas Gómez, C.M.; Sabin, K.Z.; Echeverri, K. Wound healing across the animal kingdom: Crosstalk between the immune system and the extracellular matrix. Dev. Dyn. 2020, 249, 834. [Google Scholar] [CrossRef]
- Aztekin, C. Tissues and Cell Types of Appendage Regeneration: A Detailed Look at the Wound Epidermis and Its Specialized Forms. Front. Physiol. 2021, 12, 2047. [Google Scholar] [CrossRef]
- DuBuc, T.Q.; Traylor-Knowles, N.; Martindale, M.Q. Initiating a regenerative response; cellular and molecular features of wound healing in the cnidarian Nematostella vectensis. BMC Biol. 2014, 12, 24. [Google Scholar] [CrossRef]
- Jones, S.M.; Kazlauskas, A. Connecting signaling and cell cycle progression in growth factor-stimulated cells. Oncogene 2000, 19, 5558–5567. [Google Scholar] [CrossRef]
- Wang, Z. Regulation of Cell Cycle Progression by Growth Factor-Induced Cell Signaling. Cells 2021, 10, 3327. [Google Scholar] [CrossRef]
- Mitogawa, K.; Hirata, A.; Moriyasu, M.; Makanae, A.; Miura, S.; Endo, T.; Satoh, A. Ectopic blastema induction by nerve deviation and skin wounding: A new regeneration model in Xenopus laevis. Regeneration 2014, 1, 26–36. [Google Scholar] [CrossRef] [PubMed]
- Müller, M.C.M.; Berenzen, A.; Westheide, W. Experiments on anterior regeneration in Eurythoe complanata (“Polychaeta”, Amphinomidae): Reconfiguration of the nervous system and its function for regeneration. Zoomorphology 2003, 122, 95–103. [Google Scholar] [CrossRef]
- Pirotte, N.; Leynen, N.; Artois, T.; Smeets, K. Do you have the nerves to regenerate? The importance of neural signalling in the regeneration process. Dev. Biol. 2016, 409, 4–15. [Google Scholar] [CrossRef] [PubMed]
- Shibata, E.; Yokota, Y.; Horita, N.; Kudo, A.; Abe, G.; Kawakami, K.; Kawakami, A. Fgf signalling controls diverse aspects of fin regeneration. Development 2016, 143, 2920–2929. [Google Scholar] [CrossRef]
- Stocum, D.L. Nerves and Proliferation of Progenitor Cells in Limb Regeneration. Dev. Neurobiol. 2018, 79, 468–478. [Google Scholar] [CrossRef]
- Heber-Katz, E.; Zhang, Y.; Bedelbaeva, K.; Song, F.; Chen, X.; Stocum, D.L.; Heber-Katz, E.; Zhang, Y.; Bedelbaeva, Á.K.; Song, F.; et al. Cell Cycle Regulation and Regeneration. Curr. Top. Microbiol. Immunol. 2013, 367, 253–276. [Google Scholar] [CrossRef]
- Ornitz, D.M.; Itoh, N. The fibroblast growth factor signaling pathway. Wiley Interdiscip. Rev. Dev. Biol. 2015, 4, 215–266. [Google Scholar] [CrossRef]
- Ricci, L.; Srivastava, M. Wound-induced cell proliferation during animal regeneration. Wiley Interdiscip. Rev. Dev. Biol. 2018, 7, e321. [Google Scholar] [CrossRef]
- Saera-Vila, A.; Kish, P.E.; Kahana, A. Fgf regulates dedifferentiation during skeletal muscle regeneration in adult zebrafish. Cell. Signal. 2016, 28, 1196–1204. [Google Scholar] [CrossRef]
- Sun, G.; Irvine, K.D. Control of Growth During Regeneration. In Current Topics in Developmental Biology; Academic Press Inc.: Cambridge, MA, USA, 2014; Volume 108, pp. 95–120. [Google Scholar] [CrossRef]
- Tasaki, J.; Shibata, N.; Nishimura, O.; Itomi, K.; Tabata, Y.; Son, F.; Suzuki, N.; Araki, R.; Abe, M.; Agata, K.; et al. ERK signaling controls blastema cell differentiation during planarian regeneration. Development 2011, 138, 2417–2427. [Google Scholar] [CrossRef]
- Shalaeva, A.Y.; Kostyuchenko, R.P.; Kozin, V.V. Structural and functional characterization of the FGF signaling pathway in regeneration of the polychaete worm Alitta virens (Annelida, errantia). Genes 2021, 12, 788. [Google Scholar] [CrossRef] [PubMed]
- Nyberg, K.G.; Conte, M.A.; Kostyun, J.L.; Forde, A.; Bely, A.E. Transcriptome characterization via 454 pyrosequencing of the annelid Pristina leidyi, an emerging model for studying the evolution of regeneration. BMC Genom. 2012, 13, 287. [Google Scholar] [CrossRef] [PubMed]
- Shao, Y.; Wang, X.B.; Zhang, J.J.; Li, M.L.; Wu, S.S.; Ma, X.Y.; Wang, X.; Zhao, H.F.; Li, Y.; Zhu, H.H.; et al. Genome and single-cell RNA-sequencing of the earthworm Eisenia andrei identifies cellular mechanisms underlying regeneration. Nat. Commun. 2020, 11, 2526. [Google Scholar] [CrossRef]
- Alexander, B.E.; Achlatis, M.; Osinga, R.; Geest HGVan Der Cleutjens, J.P.M.; Schutte, B. Cell kinetics during regeneration in the sponge Halisarca caerulea: How local is the response to tissue damage? PeerJ 2015, 3, e820. [Google Scholar] [CrossRef] [PubMed]
- Melnikov, N.P.; Bolshakov, F.V.; Frolova, V.S.; Skorentseva, K.V.; Ereskovsky, A.V.; Saidova, A.A.; Lavrov, A.I. Tissue Homeostasis in Sponges: Quantitative Analysis of Cell Proliferation and Apoptosis. J. Exp. Zool. Part B Mol. Dev. Evol. 2022, 338, 360–381. [Google Scholar] [CrossRef] [PubMed]
- Takahashi, T.; Nowakowski, R.S.; Caviness, V.S. Cell cycle parameters and patterns of nuclear movement in the neocortical proliferative zone of the fetal mouse. J. Neurosci. 1993, 13, 820–833. [Google Scholar] [CrossRef]
- Vincent, C.D.; Rost, F.; Masselink, W.; Brusch, L.; Tanaka, E.M. Cellular dynamics underlying regeneration of appropriate segment number during axolotl tail regeneration. BMC Dev. Biol. 2015, 15, 48. [Google Scholar] [CrossRef]
- Quastler, H.; Sherman, F.G. Cell Population Kinetics in the Intestinal Epithelium of the Mouse. Exp. Cell Res. 1959, 17, 420–438. [Google Scholar] [CrossRef]
- Solius, G.M.; Maltsev, D.I.; Belousov, V.V.; Podgorny, O.V. Recent advances in nucleotide analogue-based techniques for tracking dividing stem cells: An overview. J. Biol. Chem. 2021, 297, 101345. [Google Scholar] [CrossRef]
- Kostyuchenko, R.P.; Kozin, V.V.; Filippova, N.A.; Sorokina, E.V. FoxA expression pattern in two polychaete species, Alitta virens and Platynereis dumerilii: Examination of the conserved key regulator of the gut development from cleavage through larval life, postlarval growth, and regeneration. Dev. Dyn. 2019, 248, 728–743. [Google Scholar] [CrossRef]
- Kozin, V.V.; Kostyuchenko, R.P. Vasa, PL10, and Piwi gene expression during caudal regeneration of the polychaete annelid Alitta virens. Dev. Genes Evol. 2015, 225, 129–138. [Google Scholar] [CrossRef] [PubMed]
- Novikova, E.L.; Bakalenko, N.I.; Nesterenko, A.Y.; Kulakova, M.A. Expression of Hox genes during regeneration of nereid polychaete Alitta (Nereis) virens (Annelida, Lophotrochozoa). EvoDevo 2013, 4, 14. [Google Scholar] [CrossRef] [PubMed]
- Paulus, T.; Müller, M.C.M. Cell proliferation dynamics and morphological differentiation during regeneration in Dorvillea bermudensis (Polychaeta, Dorvilleidae). J. Morphol. 2006, 267, 393–403. [Google Scholar] [CrossRef] [PubMed]
- Martinez Acosta, V.G.; Arellano-Carbajal, F.; Gillen, K.; Tweeten, K.A.; Zattara, E.E. It Cuts Both Ways: An Annelid Model System for the Study of Regeneration in the Laboratory and in the Classroom. Front. Cell Dev. Biol. 2021, 9, 3231. [Google Scholar] [CrossRef] [PubMed]
- Kozin, V.V.; Filippova, N.A.; Kostyuchenko, R.P. Regeneration of the nervous and muscular system after caudal amputation in the polychaete Alitta virens (Annelida: Nereididae). Russ. J. Dev. Biol. 2017, 48, 198–210. [Google Scholar] [CrossRef]
- Dondua, A.K. Influence of actinomycin D and sibiromycin upon the embryonic and larval development in Nereis virens (Sars.). Ontogenez 1975, 6, 475–484. [Google Scholar]
- Salic, A.; Mitchison, T.J. A chemical method for fast and sensitive detection of DNA synthesis in vivo. Proc. Natl. Acad. Sci. USA 2008, 105, 2415–2420. [Google Scholar] [CrossRef]
- Zattara, E.E.; Özpolat, B.D. Quantifying Cell Proliferation During Regeneration of Aquatic Worms. In Developmental Biology of the Sea Urchin and Other Marine Invertebrates: Methods and Protocols; Methods in Molecular Biology; Humana Press: New York, NY, USA, 2021; pp. 163–180. [Google Scholar]
- Nowakowski, R.S.; Lewin, S.B.; Miller, M.W. Bromodeoxyuridine immunohistochemical determination of the lengths of the cell cycle and the DNA-synthetic phase for an anatomically defined population. J. Neurocytol. 1989, 18, 311–318. [Google Scholar] [CrossRef]
- Niwa, N.; Akimoto-Kato, A.; Sakuma, M.; Kuraku, S.; Hayashi, S. Homeogenetic inductive mechanism of segmentation in polychaete tail regeneration. Dev. Biol. 2013, 381, 460–470. [Google Scholar] [CrossRef]
- Kulakova, M.; Bakalenko, N.; Novikova, E.; Cook, C.E.; Eliseeva, E.; Steinmetz, P.R.H.; Kostyuchenko, R.P.; Dondua, A.; Arendt, D.; Akam, M.; et al. Hox gene expression in larval development of the polychaetes Nereis virens and Platynereis dumerilii (Annelida, Lophotrochozoa). Dev. Genes Evol. 2007, 217, 39–54. [Google Scholar] [CrossRef]
- Pfeifer, K.; Dorresteijn, A.W.C.; Fröbius, A.C. Activation of Hox genes during caudal regeneration of the polychaete annelid Platynereis dumerilii. Dev. Genes Evol. 2012, 222, 165–179. [Google Scholar] [CrossRef] [PubMed]
- Schenk, S.; Krauditsch, C.; Frühauf, P.; Gerner, C.; Raible, F. Discovery of methylfarnesoate as the annelid brain hormone reveals an ancient role of sesquiterpenoids in reproduction. eLife 2016, 5, e17126. [Google Scholar] [CrossRef] [PubMed]
- Boilly, B. Induction D’Une Queue et de Parapodes Surnumeraires Par Deviation de L’Intestin Chez Les Nereidae (Annelides Polychetes). J. Embryol. Exp. Morphol. 1973, 30, 329–343. [Google Scholar] [CrossRef] [PubMed]
- Combaz, A.; Boilly, B. Étude expérimentale et histologique de la régénération caudale en l’absence de chaine nerveuse chez les Nereidae (Annélides Polychètes). Ann. D’embryologie Morphog. 1974, 7, 171–197. [Google Scholar]
- Herlant-Meewis, H. Regeneration in annelids. Adv. Morphog. 1964, 4, 155–215. [Google Scholar] [CrossRef]
- Kumar, A.; Brockes, J.P. Nerve dependence in tissue, organ, and appendage regeneration. Trends Neurosci. 2012, 35, 691–699. [Google Scholar] [CrossRef]
- Makanae, A.; Satoh, A. Early Regulation of Axolotl Limb Regeneration. Anatomical Record 2012, 295, 1566–1574. [Google Scholar] [CrossRef]
- Satoh, A.; Mitogawa, K.; Makanae, A. Regeneration inducers in limb regeneration. Develop. Growth Differ. 2015, 57, 421–429. [Google Scholar] [CrossRef]
- Tomlinson, B.L.; Goldhamer, D.J.; Barger, P.M.; Tassava, R.A. Models and hypotheses Punctuated cell cycling in the regeneration blastema of urodele amphibians: An hypothesis. Differentiation 1985, 28, 195–199. [Google Scholar] [CrossRef]
- Boilly, B.; Moustafa, Y.; Oudkhir, M. Image analysis of blastema cell proliferation in denervated limb regenerates of the newt, Pleurodeles waltlii M. Differentiation 1986, 32, 208–214. [Google Scholar] [CrossRef]
- Tassava, R.A.; Goldhamer, D.J.; DBruce LTomlinson, A.N. Cell cycle controls and the role of nerves and the regenerate epithelium in urodele forelimb regeneration: Possible modifications of basic concepts. Biochem. Cell Biol. 1987, 65, 739–749. [Google Scholar] [CrossRef] [PubMed]
- Nechiporuk, A.; Keating, M.T. A proliferation gradient between proximal and msxb-expressing distal blastema directs zebrafish fin regeneration. Development 2002, 129, 2607–2617. [Google Scholar] [CrossRef] [PubMed]


Disclaimer/Publisher’s Note: The statements, opinions and data contained in all publications are solely those of the individual author(s) and contributor(s) and not of MDPI and/or the editor(s). MDPI and/or the editor(s) disclaim responsibility for any injury to people or property resulting from any ideas, methods, instructions or products referred to in the content. |
© 2023 by the authors. Licensee MDPI, Basel, Switzerland. This article is an open access article distributed under the terms and conditions of the Creative Commons Attribution (CC BY) license (https://creativecommons.org/licenses/by/4.0/).
Share and Cite
Shalaeva, A.Y.; Kozin, V.V. Cell Proliferation Indices in Regenerating Alitta virens (Annelida, Errantia). Cells 2023, 12, 1354. https://doi.org/10.3390/cells12101354
Shalaeva AY, Kozin VV. Cell Proliferation Indices in Regenerating Alitta virens (Annelida, Errantia). Cells. 2023; 12(10):1354. https://doi.org/10.3390/cells12101354
Chicago/Turabian StyleShalaeva, Alexandra Y., and Vitaly V. Kozin. 2023. "Cell Proliferation Indices in Regenerating Alitta virens (Annelida, Errantia)" Cells 12, no. 10: 1354. https://doi.org/10.3390/cells12101354
APA StyleShalaeva, A. Y., & Kozin, V. V. (2023). Cell Proliferation Indices in Regenerating Alitta virens (Annelida, Errantia). Cells, 12(10), 1354. https://doi.org/10.3390/cells12101354