Article

A Novel Method for Primary Blood Cell Culturing and Selection in Drosophila melanogaster

1
Drosophila Blood Cell Differentiation Group, Institute of Genetics, Biological Research Centre, P.O. Box 521, H-6701 Szeged, Hungary
2
Faculty of Science and Informatics, Doctoral School of Biology, University of Szeged, P.O. Box 427, H-6720 Szeged, Hungary
3
Lysosomal Degradation Research Group, Institute of Genetics, Biological Research Centre, P.O. Box 521, H-6701 Szeged, Hungary
4
Department of Genetics, Faculty of Science and Informatics, University of Szeged, H-6726 Szeged, Hungary
*
Author to whom correspondence should be addressed.
These authors contributed equally to this work.
Cells 2023, 12(1), 24; https://doi.org/10.3390/cells12010024
Submission received: 18 October 2022 / Revised: 12 December 2022 / Accepted: 16 December 2022 / Published: 21 December 2022
(This article belongs to the Special Issue Advances in Cell Culture Technology)

Abstract

:
The blood cells of the fruit fly Drosophila melanogaster show many similarities to their vertebrate counterparts, both in their functions and their differentiation. In the past decades, a wide palette of immunological and transgenic tools and methods have been developed to study hematopoiesis in the Drosophila larva. However, the in vivo observation of blood cells is technically restricted by the limited transparency of the body and the difficulty in keeping the organism alive during imaging. Here we describe an improved ex vivo culturing method that allows effective visualization and selection of live blood cells in primary cultures derived from Drosophila larvae. Our results show that cultured hemocytes accurately represent morphological and functional changes following immune challenges and in case of genetic alterations. Since cell culturing has hugely contributed to the understanding of the physiological properties of vertebrate blood cells, this method provides a versatile tool for studying Drosophila hemocyte differentiation and functions ex vivo.

Graphical Abstract

1. Introduction

The regulation of hematopoiesis involves numerous signaling pathways, as well as epigenetic and transcription factors, which are highly conserved between the fruit fly Drosophila melanogaster and vertebrates. This high level of homology and the availability of a wide range of transgenic markers to trace blood cell lineages and genetic tools to easily manipulate the genome made the fruit fly Drosophila melanogaster an ideal organism for studying the differentiation of blood cells. The blood cells (hemocytes) of Drosophila are the functional counterparts of the myeloid immune cells of vertebrates [1,2,3,4,5,6,7]. Similarly, these cells are confined in hematopoietic compartments that evolve according to the developmental stage [3,8,9]. Such compartments in the larva are the lymph gland, a pair-lobed organ at the anterior part of the dorsal vessel, the sessile hematopoietic compartment consisting of hemocytes attached to the body wall, and the circulation [10,11,12,13,14,15].
The circulating blood cells of the Drosophila larva are categorized into three distinct classes: the phagocytic plasmatocytes, the melanizing crystal cells, and the large flat lamellocytes, which play an indispensable role in encapsulating invaders that are too large to be engulfed by plasmatocytes [4,16,17,18]. While plasmatocytes are predominant in the larval circulation, crystal cells are present in low numbers (~1–5%). Lamellocytes are rarely present in naive larvae but differentiate rapidly following immune induction, such as wasp parasitation or wounding [4,19,20,21]. These cells differentiate either from progenitors located in the lymph gland or via conversion from plasmatocytes, a process similar to the transdifferentiation of Th17 cells in vertebrates [14,21,22,23,24,25,26,27,28]. Dysregulation of signaling pathways controlling hematopoiesis can lead to lamellocyte differentiation without immune induction and, in some cases, cause the formation of melanotic nodules and a leukemia-like condition in the larva [11,29,30,31,32]. With these advantages in mind, it is not surprising that Drosophila melanogaster has emerged as a powerful model organism to study the genetic underpinnings and regulatory mechanisms of both healthy hematopoiesis and immune cell disorders.
To carry out such investigations, a wide variety of tools, including cell-type specific antibodies, transgenic reporters, as well as cutting-edge microscopy techniques, were developed [21,33,34,35,36,37,38,39,40]. While these approaches were instrumental to the description and characterization of the different blood cell classes, the observation of live hemocytes remains challenging. Hemocytes in the larva are often difficult to study through the cuticle, and larval movements are not easily controlled in experiments requiring longer observation periods. Although primary blood cell cultures would offer a solution to these challenges, attempts to establish such cultures have resulted in limited success. Larval blood cells were maintained ex vivo for brief periods of time to investigate lamellocyte transdifferentiation, but no long-term culturing conditions have been developed to date [24,40].
In this report, we describe an optimized method for the ex vivo culturing of Drosophila hemocytes. This method is suitable for studying blood cell function and differentiation, and it utilizes previously developed in vivo markers specific to the different hemocyte clusters. In these ex vivo cell cultures, hemocyte composition differs according to the genotype and the immune state of the larvae, and cells maintain their ability to proliferate and transdifferentiate. Furthermore, we developed a blasticidin resistance-based selection system similar to that previously utilized in vertebrate cell cultures. By employing the ex vivo culturing method, hemocytes originating from multiple reproducible conditions can be studied at the level of both morphology and transgenic marker expression. Moreover, the cell-type-specific selection allows the enrichment of specific hemocyte classes for downstream analysis.

2. Materials and Methods

2.1. Drosophila Stocks and Maintenance

All Drosophila lines used in the study are listed in Table S1. The flies were kept on a standard cornmeal-yeast media at 25 °C. All crosses were performed at 25 °C.

2.2. Wasp Infestation and Wounding

For wasp infestation, 25 Drosophila females were left to lay eggs for 6 h. 72 h after egg laying, early 3rd instar larvae were exposed to 25 female Leptopilina boulardi G486 parasitic wasps for 6 h at 25 °C. Hemocytes were isolated from infested larvae 16 h after infestation. Infested larvae were selected based on the melanized injury site caused by the oviposition.
Non-sterile mechanical wounding was performed on early 3rd instar larvae with a pin (Austerlitz Insect Pin 0.2 mm). Hemocytes were collected 16 h after immune induction for the ex vivo cell cultures.

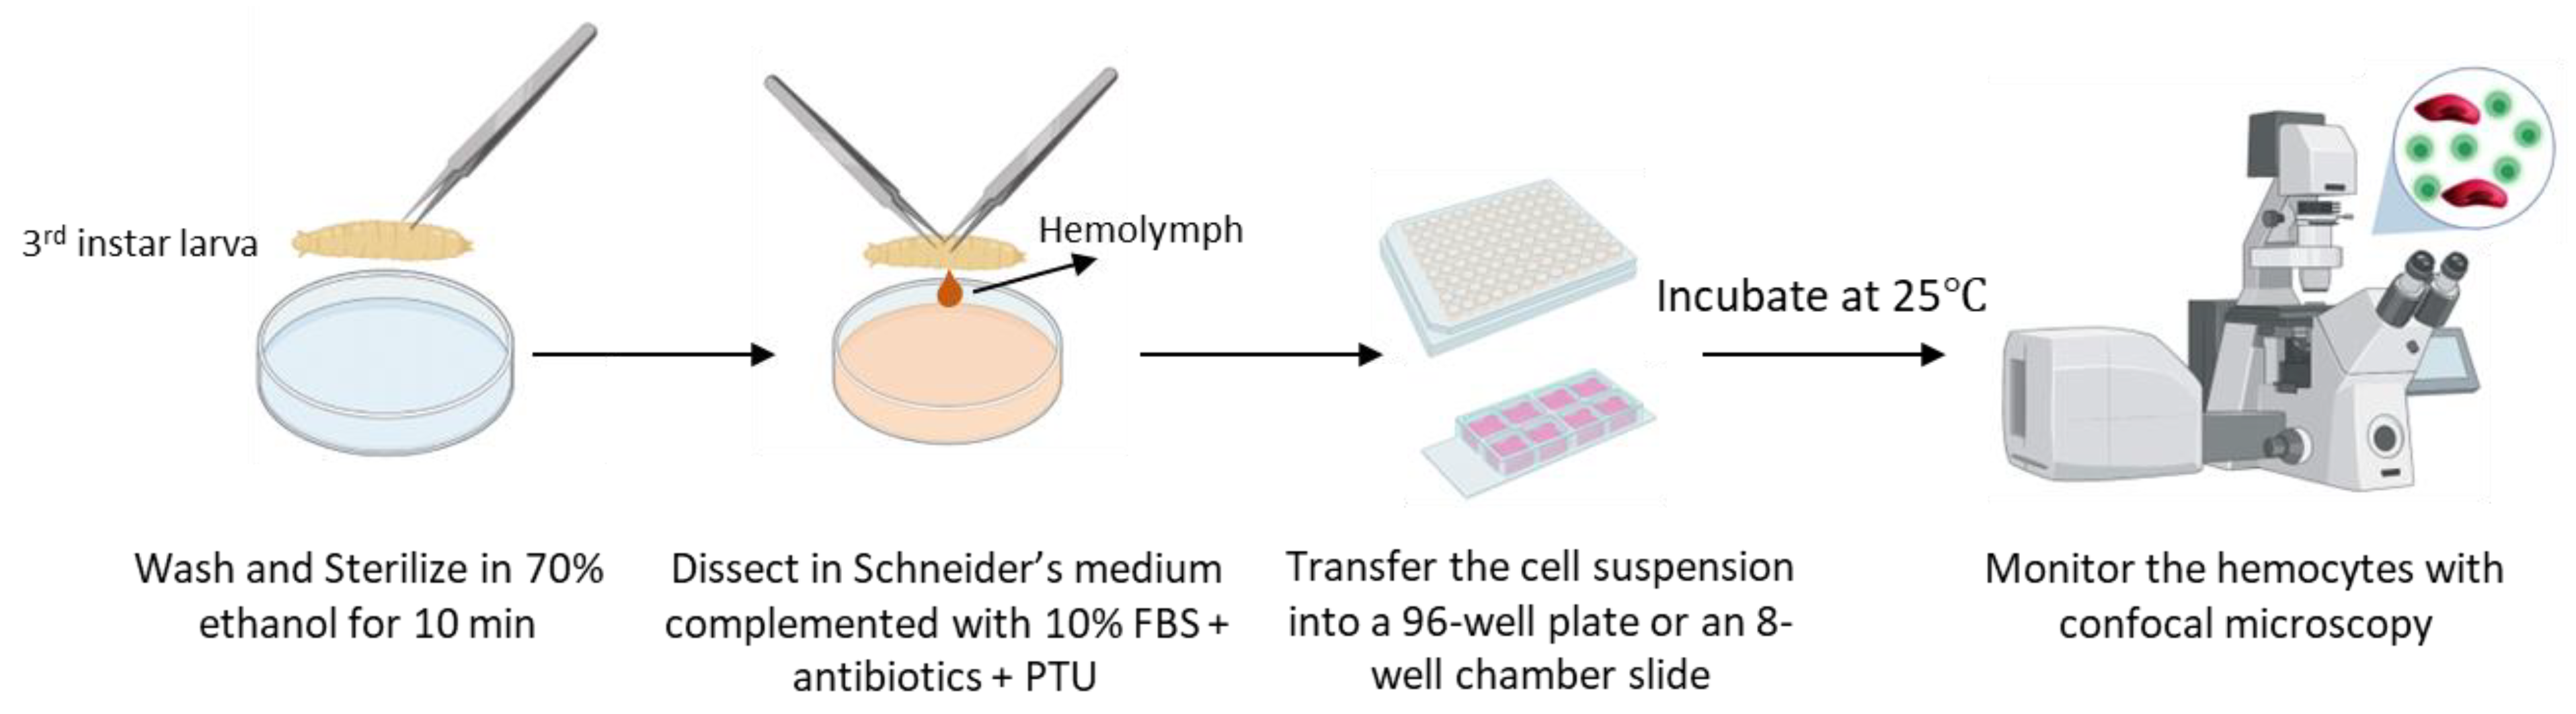
2.3. Ex Vivo Culturing of Isolated Hemocytes

To sterilize and remove food debris from the larval cuticle, 3rd instar larvae were washed out from the food into Millipore water, transferred into 70% ethanol for 10 min, and then to Millipore water again until dissection. To achieve optimal hemocyte confluency, 20 larvae were dissected from naive, wounded, and wasp-infested Me larvae, while 10 larvae were used from the tumorous genotypes (Me,hopTum, Me; l(3)mbn1 and Me; Hml>Pvrλ). The larvae were dissected in 200 μL of Schneider’s Drosophila medium (Lonza, Gampel, Switzerland, CatNo. 0000879623), complemented with 10% heat-inactivated Fetal Bovine Serum (Biosera, Nuaille, France, CatNo. FB-1090/500), 0.01 mg/mL gentamicin (BioConcept, Allschwil, Switzerland, CatNo. 4-07F00-H), 0.1 mg/mL Penicillin-Streptomycin (BioConcept, Allschwil, Switzerland CatNo. 4-01F00-H). To prevent hemocyte melanization, PTU (N-Phenylthiourea, Sigma-Aldrich, St. Louis, MO, USA, CatNo. P7629) was added to the medium. The medium containing the isolated hemocytes was carefully suspended with a sterile cut P200 tip (Greiner bio-one, Kremsmünster, Austria, CatNo. G739295), and 200 μL of the suspension was transferred into a well of a 96-well plate (Costar, Washington, DC, USA, CatNo. 3598). For the lamellocyte heterogeneity experiment, 15 larvae from naive, wounded, and wasp-infested conditions were dissected in 300 μL of culturing medium, and the cell suspension was transferred into a well of an 8-well chamber slide (Ibidi, Gräfelfing, Germany, CatNo. 80826). In all experiments, the cells were left to attach for 1 h before imaging at the Day 0 time point. Cell cultures were incubated at 25 °C, with the culturing medium being changed every two days. To visualize the nuclei, Hoechst 33342 (bisBenzimide H 33342 trihydrochloride, Sigma-Aldrich, St. Louis, MO, USA, CatNo. 14533) was added to the complemented Schneider’s medium at a 0.5 µg/mL final concentration. Images of cultured hemocytes were taken using Olympus Cell-R and Zeiss LSM800 microscopes (Figure 1).

2.4. Video Microscopy

Blood cells and wasp eggs were isolated from wasp-infested larvae 24 h after infestation. The cells were left to attach for 1 h, after which 48 h long videos were recorded using CytoSmart Lux3 FL (Axion BioSystems, Atlanta, GA, USA) fluorescence microscope.

2.5. Generation of the UAS-BsdR Line

The blasticidin resistance gene (BsdR) was amplified with PCR from pCoBlast vector using specific primers with 15-mer homology extension to the linearized vector end: 5′-ACTCTGAATAGGGAATTGGGATGGCCAAGCCTTTGTCTC-3′ and 5′-CGGCCGCAGATCTGTTAACGTTAGCCCTCCCACACATAAC-3′. The PCR fragment was cloned into the EcoRI (New England Biolabs, Ipswich, MA, USA, CatNo. R3101S) digested pUAST-attB vector with the SLIC cloning method [41]. The generated plasmid was injected into Drosophila embryos carrying a vasa-driven ΦC31 integrase and an attP40 site on the second chromosome. Afterward, a homozygous Drosophila line carrying the inducible blasticidin resistance transgene was established.

2.6. Blasticidin Treatment of Cell Cultures

Blood cells from 20 3rd instar larvae were isolated from each genotype, cultured in a 96-well plate, and allowed to adhere overnight. The next day, the culture medium was substituted with a selective medium containing 10 μg/mL blasticidin (Blasticidine S hydrochloride, Sigma-Aldrich, St. Louis, MO, USA, CatNo. 15205). Cells were cultured for 5 days, with the selective medium replaced every second day. For the Hml>GFP + Hml-DsRed co-culture experiment, blood cells from 10 Hml-DsRed larvae were mixed with blood cells from either 10 Hml>GFP larvae or 10 Hml>GFP>BsdR larvae, and the Hml>GFP>BsdR + Hml-DsRed culture was treated with blasticidin according to the protocol mentioned above.

2.7. Cell Counting, Cell Size Measurement and Statistics

Cell counting was performed manually using the multi-point tool in ImageJ/Fiji (US National Institutes of Health, Bethesda, MD, USA) image processing software. The nuclei were counted automatically using the ‘cellcounter’ macro in the same software. Measurement of lamellocyte size was performed using the ‘Measure Cell Surfaces’ macro in ImageJ/Fiji. Cells in three fields of view at a 10× objective were counted from each sample. Since different numbers of larvae were dissected from tumorous and non-tumorous genotypes, cell numbers are represented in percentages. For cell count in Figure S1, the number of cells was normalized for each condition by dividing the total cell number by the number of larvae and represented as fold change compared to the control mean. All experiments were repeated three times. Experiments were evaluated using Microsoft Excel and GraphPad Prism software version 6.0 for Windows. Graphs and illustrations were made using GraphPad Prism and BioRender online tools. Data were analyzed using analysis of variance (ANOVA) with Tukey’s test for multiple comparisons. Values of p ˂ 0.05 were accepted as significant (* p ≤ 0.05, ** p ≤ 0.01, *** p ≤ 0.001, **** p ≤ 0.0001).

3. Results

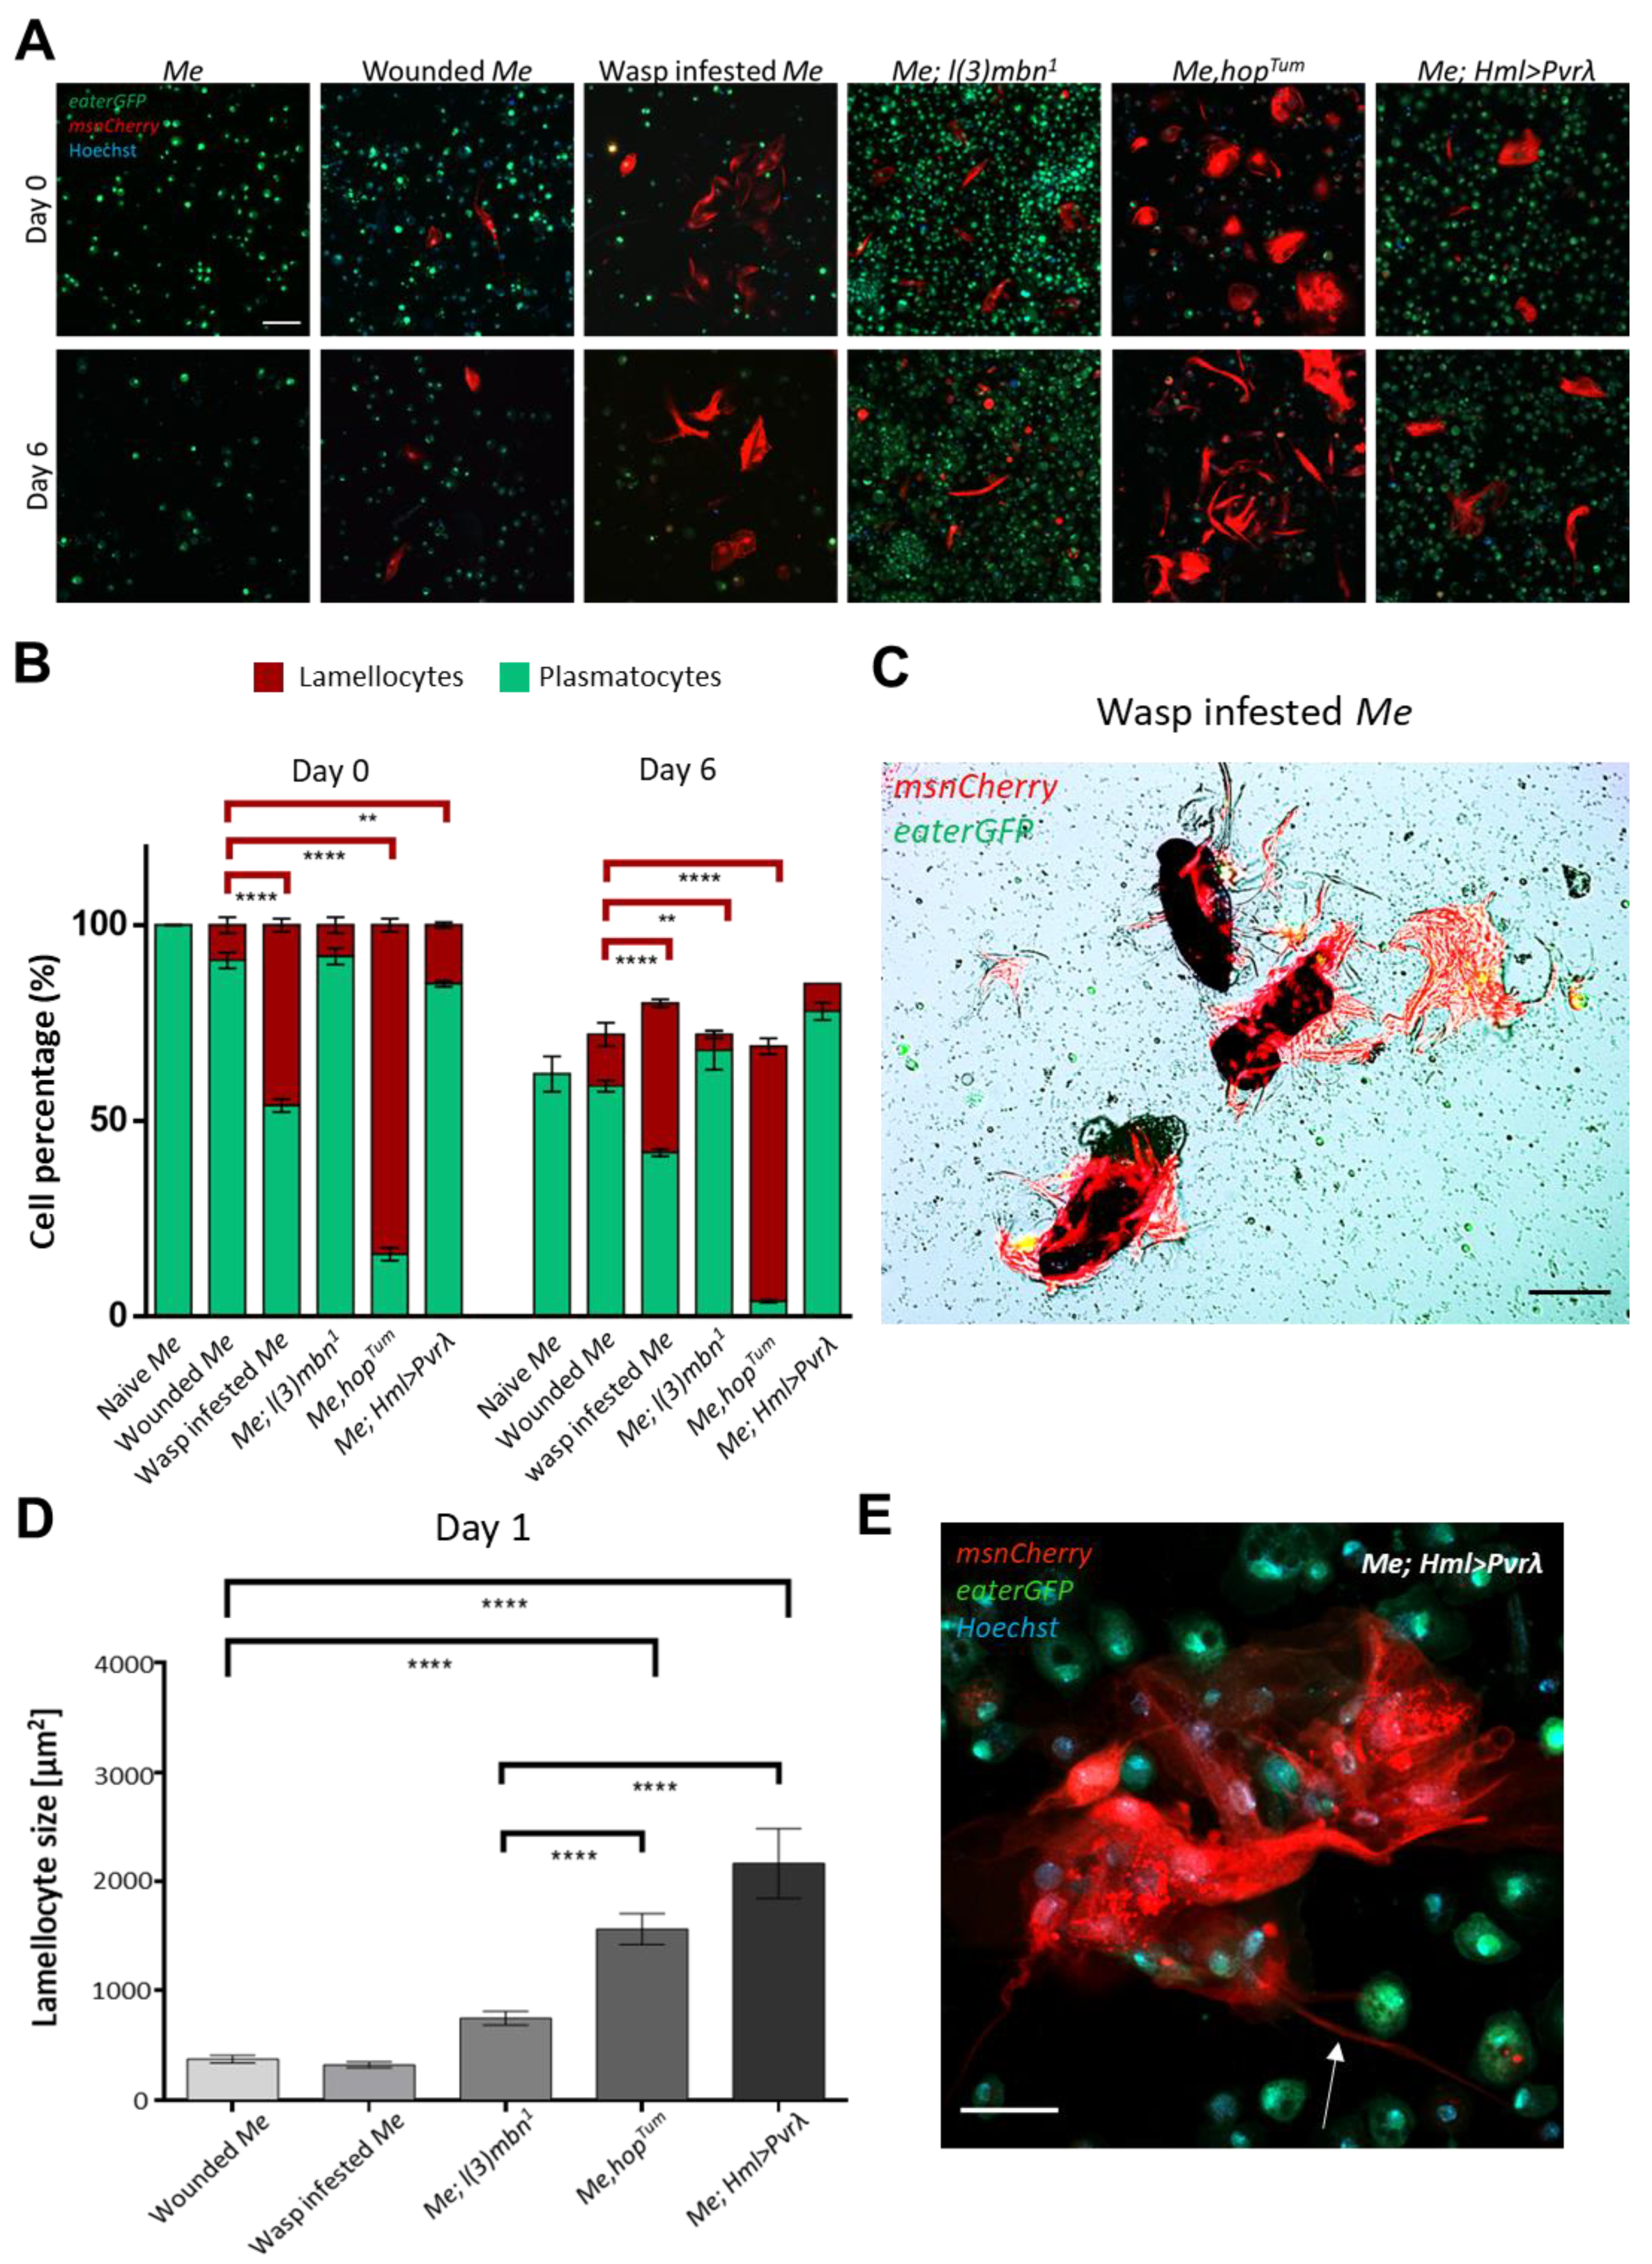
3.1. Hemocyte Composition and Morphology in Primary Cell Cultures Depends on the Genotype and the Immune Condition of the Larva

To facilitate the long-term, high-resolution analysis of live Drosophila immune cells, we set out to establish primary blood cell cultures originating from larval hemocytes. We focused our attention on plasmatocytes and lamellocytes in order to study the predominant immune cell classes under homeostatic and immune-induced conditions. To visualize the different hemocyte types in the culture, we used the Me (msnCherry,eaterGFP) transgenic reporter combination, which marks lamellocytes with red and plasmatocytes with green fluorescence [21,38].
We analyzed the blood cell composition of hemocyte cultures derived from naive, wounded, and parasitized Me larvae on the day of isolation (Day 0) and six days later (Day 6). Furthermore, we assessed three previously described genetically induced leukemia models with hemocyte proliferation and lamellocyte differentiation phenotypes. The tested genotypes were Me; l(3)mbn1, in which the l(3)mbn tumor suppressor gene is mutant, Me,hopTum, carrying constitutively active allele of hopscotch (hop), and Me; Hml>Pvrλ, where the constitutively active form of the receptor tyrosine kinase Pvr is expressed with the hemocyte specific Hemolectin (Hml-Gal4) driver [4,30,31,42]. All cultures could be maintained for six days regardless of the genotype and the immune condition, with cell number not differing significantly between Day 0 and Day 6 of culturing except for Me; l(3)mbn1 and Me,hopTum cultures (Figure S1).
Investigation of the blood cell composition of these cultures revealed that, as expected, the control culture originating from naive 3rd instar larvae contained no lamellocytes either on Day 0 or Day 6 of culturing. However, in cultures derived from immune-induced and tumorous larvae, lamellocytes were observed at both time points (Figure 2A). Although a previous study by Márkus et al. (2005) [43] did not show a difference in lamellocyte differentiation depending on the mode of induction, in our experiments, immune induction with the parasitic wasp Leptopilina boulardi resulted in a significantly higher number of lamellocytes than wounding with an insect pin, with no difference in total cell number (Figure 2A,B and Figure S1). Moreover, in cultures derived from wasp-infested larvae, lamellocytes were present on the surface of the wasp egg two days after dissection in the case of both the wild type and the hopTum mutant (Figure 2C, Supplementary Video S1), suggesting that lamellocytes can retain an attachment to the parasite ex vivo. Interestingly, similar to what has been reported previously in vivo [11,30,31], in cultures derived from tumorous larvae, total hemocyte number and lamellocyte percentage varied depending on the genotype. While wounded and wasp-infested Me cultures did not differ in cell number from the naive Me control, the three examined tumorous cultures (l(3)mbn1, hopTum and Hml>Pvrλ) had a significantly higher cell number with l(3)mbn1 and hopTum cultures containing significantly more cells than Hml>Pvrλ (Figure S1), which resulted in a lower percentage of lamellocytes in l(3)mbn1 (6%) than in Hml>Pvrλ cultures (~15%) (Figure 2A,B and Figure S1). hopTum cultures, on the other hand, contained the highest percentage of lamellocytes (~90%) among the investigated conditions, in addition to a very high total cell number, highlighting the severity of the immune phenotype in these mutants (Figure 2A,B and Figure S1).
Moreover, we also compared the size of lamellocytes in the different cultures after one day. While we found no significant difference in lamellocyte size between cultures originating from wounded, wasp parasitized and l(3)mbn1 larvae, lamellocytes derived from hopTum and Hml>Pvrλ tumourous larvae were significantly larger in size (Figure 2D). Interestingly, lamellocytes of Hml>Pvrλ larvae were not only bigger but also exhibited long filopodia or cytoneme-like structures (Figure 2E). This all indicates that continuous activation of signaling pathways, as in the case of hopTum and Hml>Pvrλ tumorous genotypes, affects not only the number but also the size and morphology of the differentiated lamellocytes.
Taken together, the above demonstrates that immune cell number and composition in ex vivo cultures correlate to the larval immune state and reflect changes induced by immune stimuli or misregulation of regulatory signaling pathways. Our observations also indicate that hemocytes ex vivo mostly retain their number and cell type composition even after six days of culture. We thus propose that the ex vivo conditions can be used in future experiments to monitor hemocyte number, characteristics, and morphology for up to one week after a certain genetic manipulation or drug treatment.

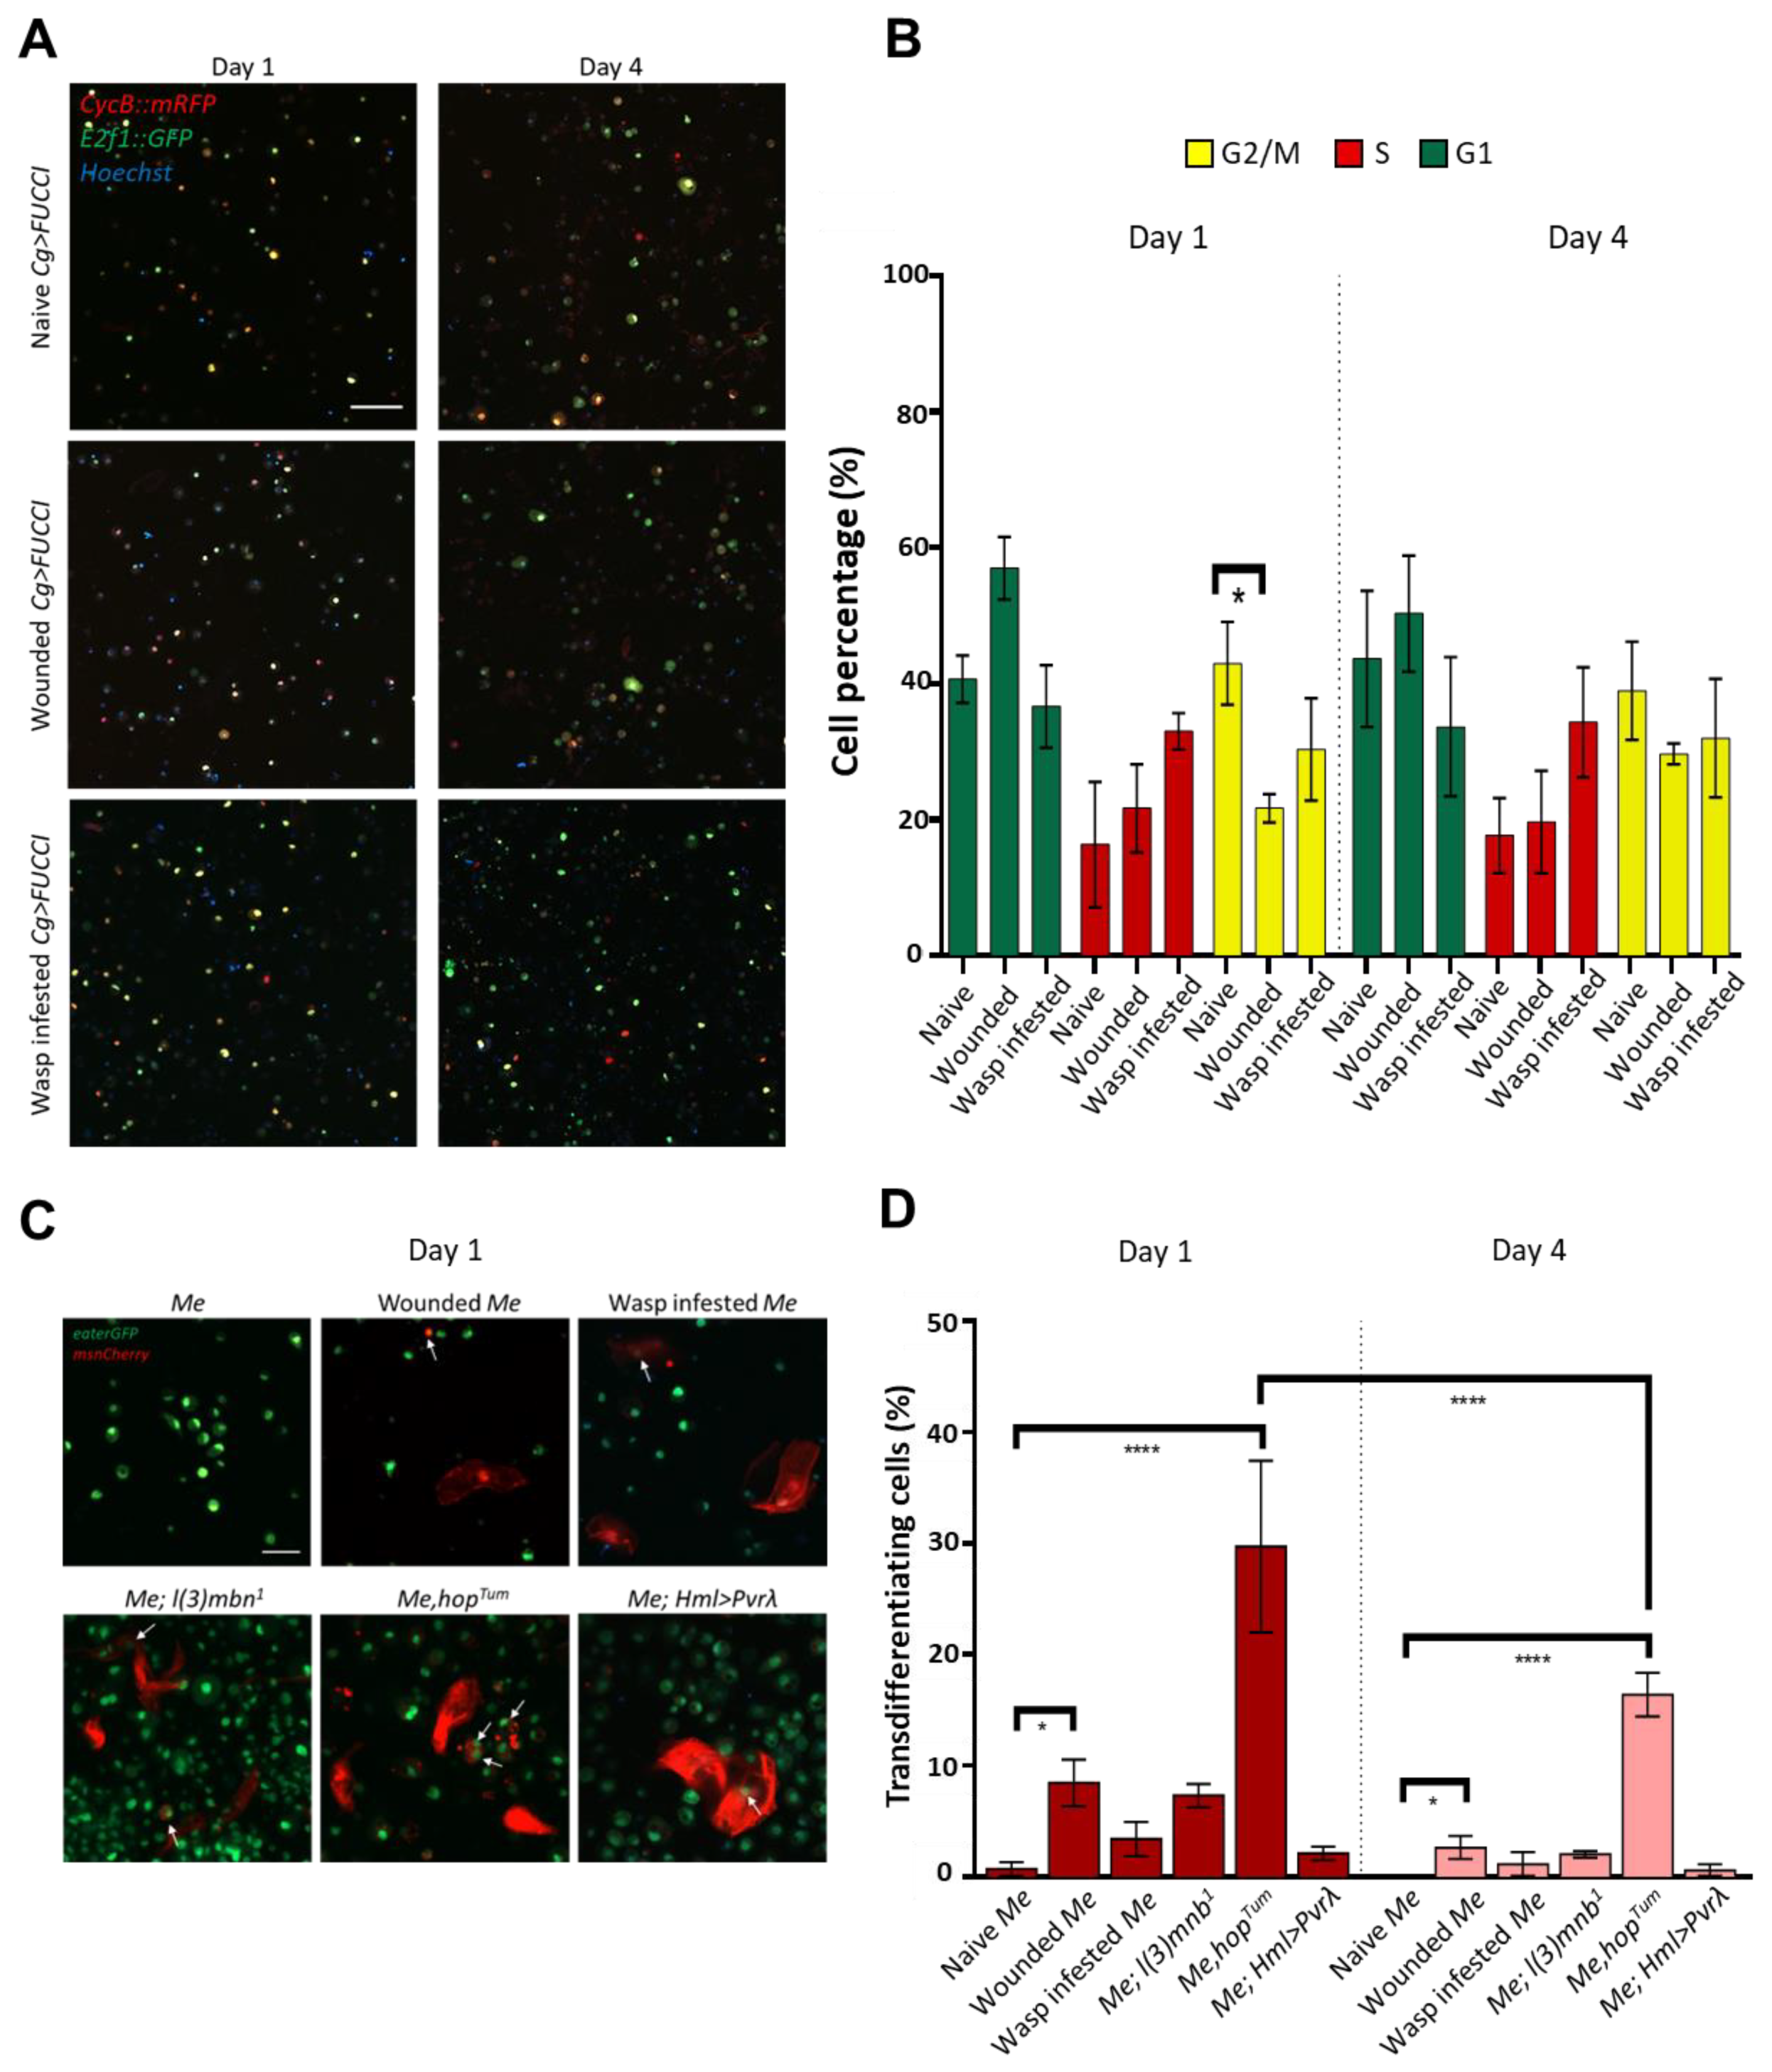
3.2. Cultured Hemocytes Maintain Their Proliferation and Transdifferentiation Capacity

The ability of plasmatocytes to undergo cell division is one of the hallmarks of this cell type [8,13]. To investigate whether cultured hemocytes proliferate, we isolated blood cells from naive, wounded, and wasp-parasitized Cg>Fly-FUCCI larvae, in which the in vivo cell cycle indicator is expressed by a pan-hemocyte driver Collagen (Cg-Gal4) [44,45]. In all three cultures, hemocytes were able to undergo cell division even on the fourth day of the experiment. Unexpectedly, we did not observe a significant difference in cell cycle among the tested immune conditions. This is possibly due to the fact that cultured hemocytes lose the immune trigger present in wounded and parasitized larvae and thus revert to their default developmental proliferation rate.
Following immune challenges and under tumorous conditions, a fraction of circulating plasmatocytes convert into lamellocytes in a process called transdifferentiation [4,21,23,24,27,28]. In these cultures, we indeed observed hemocytes showing intermediate morphology between plasmatocytes and lamellocytes (Figure 3C). These cells expressed the plasmatocyte-specific eaterGFP and the lamellocyte-specific msnCherry markers simultaneously, which suggests they are either “double-positive” type II lamellocytes (as described by Anderl et al., 2016 [21]) originating from eaterGFP expressing cells or plasmatocytes undergoing conversion into lamellocytes. As both of these types originate from eaterGFP hemocytes, we considered them transdifferentiating cells. We found that the ratio of these cells to the total cell number on Day 1 was the highest in the Me,hopTum culture (~29%), followed by cultures derived from wounded Me (~8%), then Me; l(3)mbn1 (~7%), with wasp-infested Me and Me; Hml>Pvrλ containing the lowest ratio of transdifferentiating cells, (~3%) and (~2%), respectively (Figure 3C,D). Interestingly, even on Day 4, transdifferentiating cells could be found in all cases except for naive Me controls, with a significant reduction in their ratio in Me,hopTum cultures. These findings align with the previous results that hopTum cultures are characterized by an extremely high lamellocyte ratio, which increases further on Day 6 (Figure 2A,B), and highlight more how the mode of induction or the genetic background affects the lamellocyte differentiation process.
Taken together, our results suggest that hemocytes preserve their ability to proliferate and transdifferentiate in hemocyte cultures, which makes ex vivo cultures suitable for studying factors playing a role in these processes.

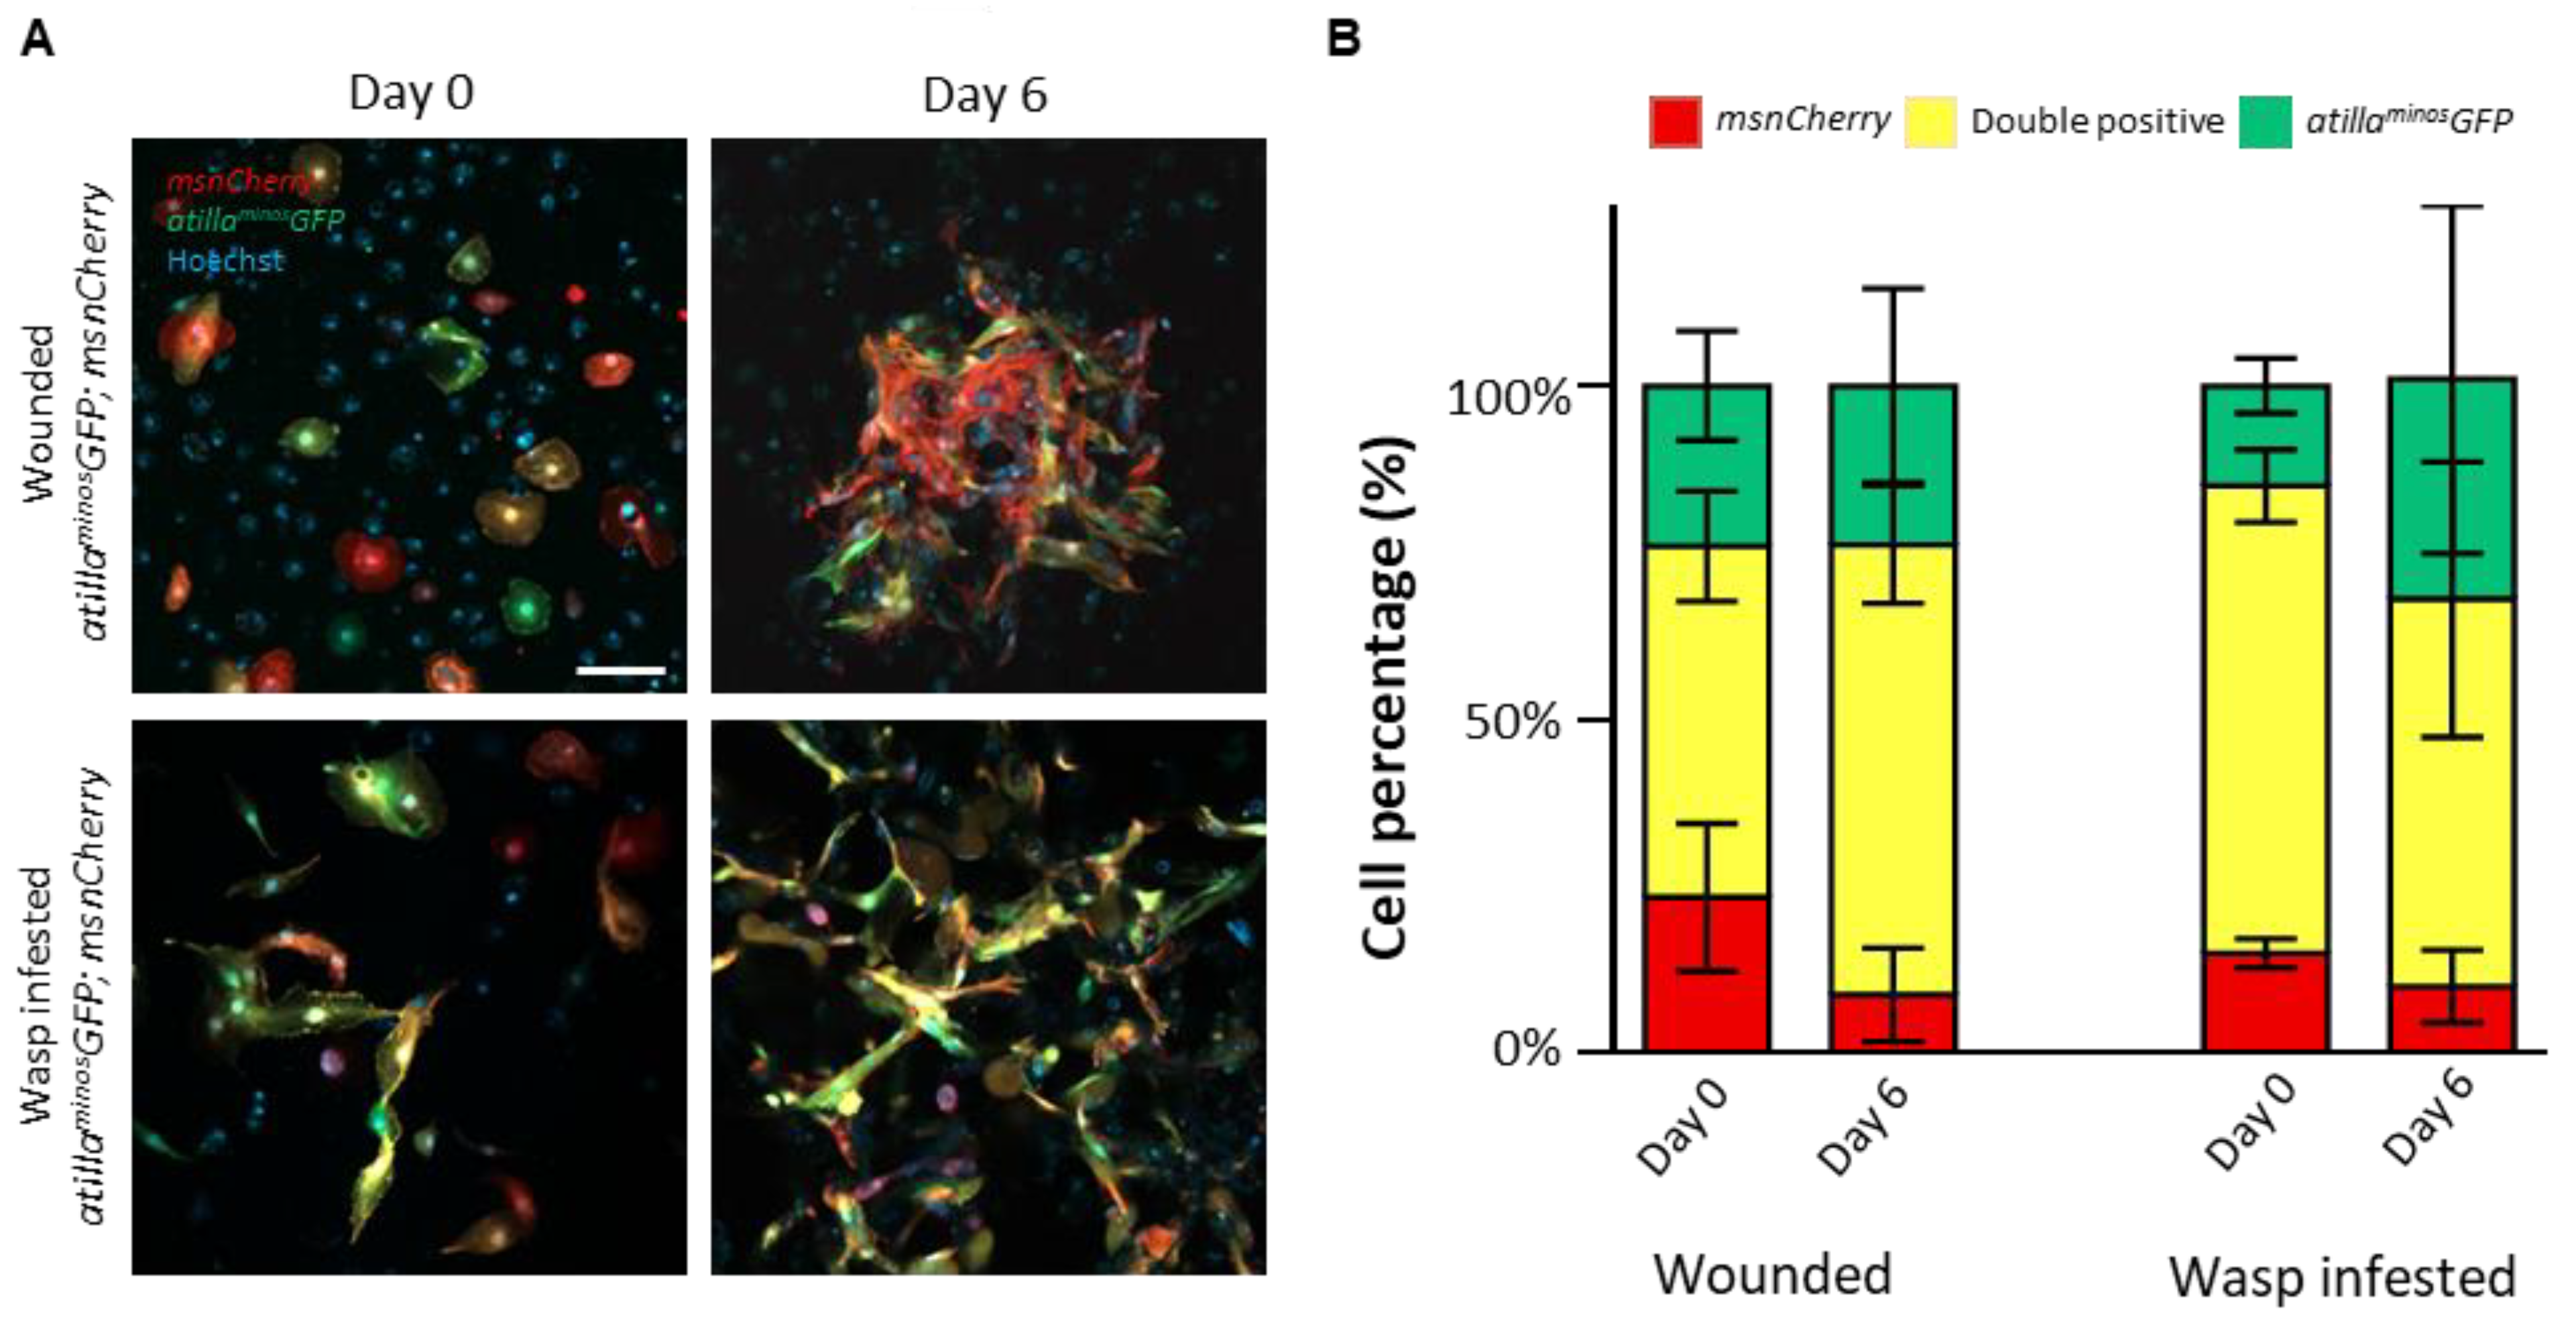
3.3. Primary Hemocyte Cultures Contain Heterogeneous Lamellocyte Subsets

As we observed variation in lamellocyte morphology among the tested conditions and the presence of a subset of lamellocytes that express eaterGFP plasmatocyte marker, we were intrigued to know whether the observed lamellocytes represented heterogeneous cell populations or various states of lamellocyte differentiation. To investigate this, we combined the two most commonly used lamellocyte markers, Atilla/L1 (atillaminosGFP [37]) and Misshapen (msnCherry [38]), in a single fly line (atillaminosGFP; msnCherry), and isolated blood cells from 3rd instar larvae after wounding and wasp infestation. By observing the hemocytes on Day 0 and Day 6 of culturing, we found that in both cultures at both time points, lamellocytes expressing all possible combinations of reporters (GFP only, Cherry only, and GFP-Cherry double positive) were present. However, the relative abundance of these lamellocyte populations did not depend on the mode of induction or the day of observation (Figure 4A,B). These results suggest that atillaminosGFP and msnCherry expression may not represent specific maturation states of lamellocytes but rather mark two overlapping lamellocyte subsets that persist over time.

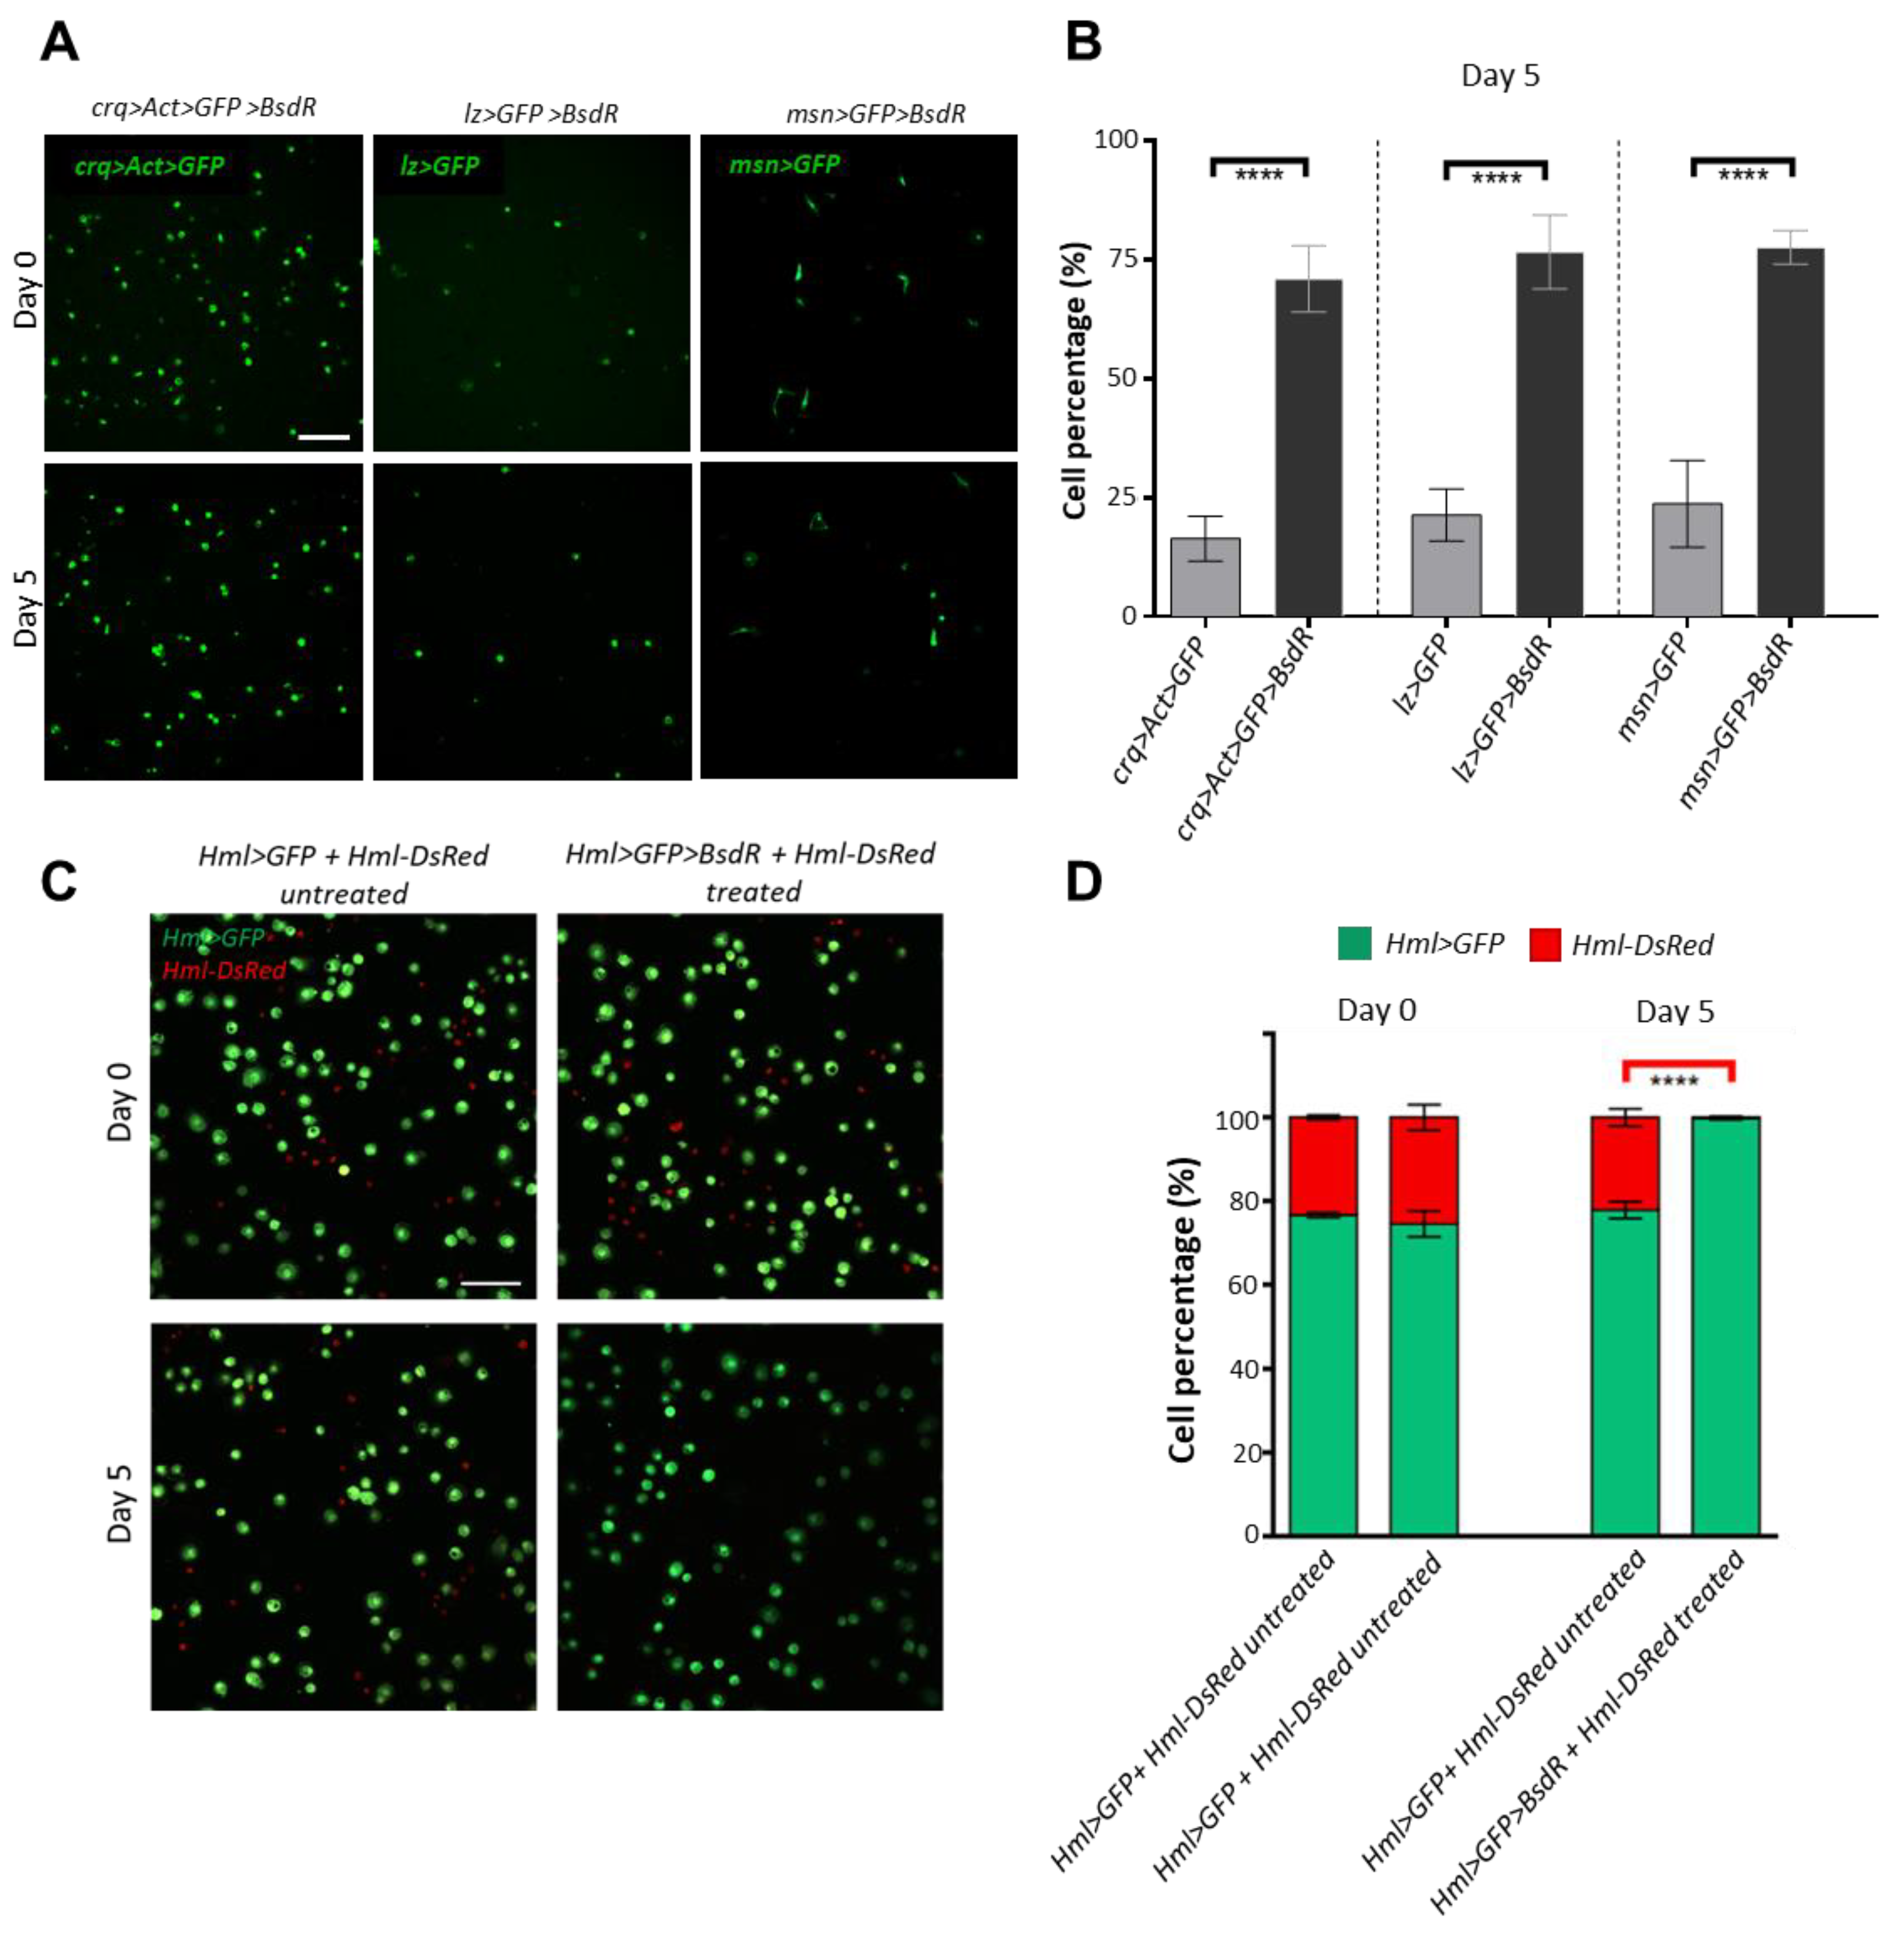
3.4. Construction of a Blasticidin Resistance-Based Blood Cell Selection System

In addition to distinct transgenic markers that can be used to follow the different hemocyte subsets, Drosophila blood cell classes can also be distinguished by the expression of cell type-specific Gal4 drivers [46]. Using these drivers in ex vivo cultures to drive UAS-regulated resistance factors would provide an opportunity to select and enrich specific hemocyte subsets for further investigations. Therefore, we generated Drosophila lines carrying a UAS-Blasticidin Resistance (UAS-BsdR) transgene. We used this resistance transgene in combination with various drivers that represent either a subset of plasmatocytes that originate from circulating/sessile hemocytes (crq>Act>Gal4) [23], crystal cells (lz-Gal4) or lamellocytes and lamellocyte precursors (msn-Gal4). Blood cells were isolated from naive larvae, except for the msn-Gal4 driver, where, in order to induce lamellocyte differentiation, we wounded the larvae and collected the hemocytes 16 h after wounding. We treated the cells with blasticidin on the second day of culturing and cultured them for up to five days in a blasticidin-selective medium. When comparing the number of cells expressing GFP alone or GFP with BsdR on Day 5, we found that most of the cells expressing the BsdR survived (crq>Act>GFP>BsdR: ~71%, lz>GFP>BsdR: ~77%, msn>GFP>BsdR: ~77%), unlike cells that did not express BsdR in control cultures (crq>Act>GFP: ~16%, lz>GFP: ~21%, msn>GFP: ~23%) (Figure 5A,B and Figure S2). This suggests that the UAS-BsdR transgene can be used with Gal4 drivers to select a specific cell type in cultures.
To further validate the ex vivo blasticidin selection system, we co-cultured BsdR-expressing Hml>GFP hemocytes with sensitive Hml-DsRed cells [4,15] and, from the second day of culturing, kept them on a blasticidin selective medium for five days. As expected, we found that Hml-DsRed cells were abolished completely from the treated culture on Day 5, and the cultures almost exclusively consisted of Hml>GFP>BsdR cells (Figure 5C,D). Together, these results show that hemocyte subpopulations can be successfully maintained and selected ex vivo using the blasticidin resistance system. This approach would allow further downstream investigations, such as bulk mRNA sequencing or proteomic studies on specifically enriched hemocyte subpopulations, without the need for FACS-sorting or single-cell sequencing.

4. Discussion

Cell cultures have served as a powerful tool for studying various biological events for decades [47,48,49,50,51,52,53]. The main advantage of using either primary or immortalized cell lines is that they provide a simplified environment to model biological conditions. Therefore, several cell lines have been established from common model organisms, and many of these are also commercially available [54,55,56,57,58,59,60,61,62,63,64,65].
Researchers using Drosophila melanogaster as a model organism can choose from more than 150 unique cell lines depending on the focus of their research [66,67,68,69,70,71,72,73,74]. Embryonic mesodermal cell lines that mostly resemble hemocytes, such as Kc 167, S2, or l(2)mbn, express innate immune response genes and are thus ideal for investigating host-pathogen interactions and identifying new drug targets [67,75,76]. Still, they are not suitable for studying the differentiation and gene expression dynamics of larval hemocytes.
Here, we describe an improved ex vivo culturing approach to maintain and investigate Drosophila larval immune cells. Unlike previous attempts [24,40], our experimental system is suitable for maintaining hemocytes for up to a week. We found that ex vivo cultured hemocyte number and cell types accurately represent the immune state of larvae at the time of isolation. In line with this, hemocytes isolated from naive larvae maintained their uninduced state, suggesting that the isolation procedure itself does not trigger an immune response that would affect our observations in vitro. It is worth noting that total cell numbers decreased over time, which could suggest that the described conditions can be further optimized.
Benefiting from the ex vivo cultures, we observed that infestation by the parasitic wasp L. boulardi results in a higher number of lamellocytes, more dividing cells, and fewer transdifferentiating cells than wounding with an insect pin, with no significant effect on total cell number or lamellocyte size. Recently, Evans and colleagues described that epidermal wounding activates Toll signaling in hemocytes via the production of ROS [76], leading to lamellocyte differentiation. In the case of parasitic wasp infection, the secretion of immunosuppressive venom and the presence of the parasitic eggs inside the larvae, which represent hemocyte attachment surfaces allowing local transdifferentiation, may compound this initial trigger, leading to a difference in immune response [21,77,78].
Furthermore, the maintenance of hemocytes originating from tumorous larvae also revealed that, in line with Zettervall et al., 2004 [31], both total cell numbers and the relative abundance of plasmatocytes and lamellocytes depend on the genotype causing the hematopoietic malignancy. For example, cultures from hopTum larvae contained very few plasmatocytes throughout their culturing, while they were highly abundant in lamellocytes. In contrast, the l(3)mbn1 mutation resulted in a similarly high overall cell number, but the cultures predominantly contained plasmatocytes. The fact that lamellocytes could be found even after six days of culture, irrespective of what triggered their differentiation, is intriguing. Since adult animals developing from parasitized larvae do not harbor lamellocytes in their circulation, they were assumed to be a relatively transient, albeit terminally differentiated cell type [8,79]. Moreover, the lamellocytes that were induced by the hopTum mutation or the Hml>Pvrλ transgene combination were bigger in size and showed more cellular protrusions compared to their counterparts induced by wounding parasite-infestation or the l(3)mbn1 mutation. This difference may be due to the independent effects the genetic background exerts on the cytoskeleton or the signaling pathways regulating cellular morphology.
Culturing immune cells also gave us the opportunity to investigate if the ex vivo environment is suitable for studying hemocyte proliferation and differentiation. We found that isolated hemocytes retained their ability to proliferate and transdifferentiate after four days of culturing. These results suggest that the observed immune cell proliferation and differentiation may be due to an intrinsic program that represents the immune state of the larvae when the hemocytes were isolated.
We used the ex vivo hemocyte cultures to study the composition of the lamellocyte subsets and to investigate whether the expression of the two previously identified atilla and misshapen lamellocyte markers change during lamellocyte maturation. However, our results showed no significant differences in the expression of these markers between Day 0 and Day 6 in cultures derived from both wounded and parasitized larvae. Although previous reports stated that during lamellocyte maturation, the level of atilla expression increases [28], we could not observe this in culture. This may be due to the higher sensitivity of single-cell sequencing to changes in gene expression than transgenic fluorescent reporters. Further investigation of the recently identified lamellocyte markers [27,28] under these culturing conditions would be essential for the characterization of the newly described lamellocyte subsets and for identifying factors that trigger their differentiation.
Finally, to facilitate cell-type-specific downstream analyses, we generated a Drosophila line with a UAS-driven blasticidin resistance transgene. We adapted this technique since using antibiotic-resistance genes to select dedicated cell subsets is a popular approach in mammalian cell culture investigations. The blasticidin selection system, in particular, was shown to be effective in a wide range of mammalian cell lines [80,81,82,83,84]. We observed that hemocytes expressing the resistance gene reliably survived after blasticidin treatment, while cells lacking the resistance gene expression did not. During the past years, several Gal4 drivers were generated that are expressed by specific hemocyte subsets. In addition, recent single-cell transcriptomic studies highlighted several potential genes whose expression is characteristic of hemocyte subclusters [7,27,28,85,86] and thus can also be utilized to create new driver lines. It is, therefore, tempting to speculate if these subpopulations could be maintained and enriched for further analyses ex vivo via specific expression of the blasticidin resistance transgene.
In vitro culturing and differentiation of immune cells provided us with fundamental knowledge of mammalian hematopoiesis, as well as valuable data on blood cell lineages, hematopoietic regulatory mechanisms, and therapeutic approaches. Based on the results presented in this report, we suggest that adapting a similar approach in fly immune cells, combined with the extensive genetic toolkit available in Drosophila, could significantly improve our understanding of hemocyte differentiation. Recent advances in conditional gene expression, optogenetics, and improved lineage tracing techniques, together with the blasticidin selection system, would allow the hand-picking of a single hemocyte subtype or, potentially, a single hemocyte. Within the selected population, gene expression or RNA interference could be induced while monitoring reporter expression changes with high-resolution microscopy. These experiments could ultimately point us toward new genes of interest or drug candidates, which could be investigated in healthy or pathologic hematopoiesis in humans.

5. Conclusions

In this report, we have developed a new culturing system that enables researchers to monitor blood cell development and function ex vivo and to selectively maintain hemocyte subsets with inducible blasticidin resistance, similar to the strategy employed in mammalian cell cultures. By examining cultures derived from larvae with distinct genotypes and immune conditions, we found that these cultures mirror the physiological changes that occur in the larva upon immune activation and that cultured hemocytes retain their ability to divide and transdifferentiate for up to a week. With the described culturing conditions, researchers can investigate more closely how blood cell development and transdifferentiation are regulated and can screen for modulators of these processes, which might be of interest for therapy against blood cell malignancies.

Supplementary Materials

The following supporting information can be downloaded at: https://www.mdpi.com/article/10.3390/cells12010024/s1, Figure S1: Bar graph showing fold change of total cell number in cultures of naive, wounded and wasp infested Me, and tumorous Me; l(3)mbn1, Me,hopTum and Me; Hml>Pvrλ on Day 0 and Day 6 of culturing; Figure S2: Blasticidin treatment of sensitive hemocytes; Table S1: List of Drosophila lines [87,88]; Video S1: Time-lapse movie of lamellocytes on the surface of the wasp eggs. (A) Me lamellocytes on the surface of the wasp eggs 24 h after infestation, scale bar: 200 μm. (B) Lamellocytes originating from the wasp-infested Me,hopTum on the surface of the wasp eggs 24 h after infestation. Scale bar: 200 μm.

Author Contributions

Conceptualization, V.H.; methodology and formal analysis, E.K.-S., E.G., B.K. and R.S.; writing—original draft preparation, E.K.-S., E.G. and V.H.; writing—review and editing, V.H., G.C., B.K., E.G. and E.K.-S.; visualization, E.K.-S. and B.K.; supervision, V.H.; project administration, V.H.; funding acquisition, V.H. All authors have read and agreed to the published version of the manuscript.

Funding

This work was supported by the National Research, Development and Innovation Office OTKA K-131484 (VH) and the 2022-2.1.1-NL-2022-00008 (Biotechnology National Laboratory) grants.

Institutional Review Board Statement

Not applicable.

Informed Consent Statement

Not applicable.

Data Availability Statement

Not applicable.

Acknowledgments

We thank Mónika Ilyés for technical assistance, as well as Dan Hultmark (UCMP, Umeå University, Umeå, Sweden), Bruno Lemaitre (Lausanne, Switzerland), József Mihály (Laboratory of Actin Cytoskeleton Regulation, Biological Research Centre, Szeged, Hungary), the Innate Immunity Group, BRC, Szeged, Hungary for providing us reagents and Drosophila lines. We are grateful to Gábor Steinbach and the members of the Cellular Imaging Laboratory (BRC, Szeged, Hungary) and to László Sipos and the members of the Drosophila Injection Facility (BRC, Szeged, Hungary) for ensuring the facilities required for our experiments. We are thankful for Dr. Rollin D. Hotchkiss Foundation for their support.

Conflicts of Interest

The authors declare no conflict of interest. The funders had no role in the design of the study; in the collection, analyses, or interpretation of data; in the writing of the manuscript; or in the decision to publish the results.

References

  1. Hultmark, D. Insect Immunology. Ancient Relationships. Nature 1994, 367, 116–117. [Google Scholar] [CrossRef] [PubMed]
  2. Evans, C.J.; Hartenstein, V.; Banerjee, U. Thicker than Blood: Conserved Mechanisms in Drosophila and Vertebrate Hematopoiesis. Dev. Cell 2003, 5, 673–690. [Google Scholar] [CrossRef] [PubMed] [Green Version]
  3. Akira, S.; Uematsu, S.; Takeuchi, O. Pathogen Recognition and Innate Immunity. Cell 2006, 124, 783–801. [Google Scholar] [CrossRef] [PubMed] [Green Version]
  4. Honti, V.; Csordás, G.; Kurucz, É.; Márkus, R.; Andó, I. The Cell-Mediated Immunity of Drosophila melanogaster: Hemocyte Lineages, Immune Compartments, Microanatomy and Regulation. Dev. Comp. Immunol. 2014, 42, 47–56. [Google Scholar] [CrossRef]
  5. Kleino, A.; Silverman, N. The Drosophila IMD Pathway in the Activation of the Humoral Immune Response. Dev. Comp. Immunol. 2014, 42, 25–35. [Google Scholar] [CrossRef] [Green Version]
  6. Banerjee, U.; Girard, J.R.; Goins, L.M.; Spratford, C.M. Drosophila as a Genetic Model for Hematopoiesis. Genetics 2019, 211, 367–417. [Google Scholar] [CrossRef] [Green Version]
  7. Hultmark, D.; Andó, I. Hematopoietic Plasticity Mapped in Drosophila and Other Insects. eLife 2022, 11, e78906. [Google Scholar] [CrossRef]
  8. Lanot, R.; Zachary, D.; Holder, F.; Meister, M. Postembryonic Hematopoiesis in Drosophila. Dev. Biol. 2001, 230, 243–257. [Google Scholar] [CrossRef] [Green Version]
  9. Holz, A.; Bossinger, B.; Strasser, T.; Janning, W.; Klapper, R. The Two Origins of Hemocytes in Drosophila. Development 2003, 130, 4955–4962. [Google Scholar] [CrossRef] [Green Version]
  10. Roehrborn, G. Drosophila Tumors and the Structure of Larval Lymph Glands. Experientia 1961, 17, 507–509. [Google Scholar] [CrossRef]
  11. Shrestha, R.; Gateff, E. Ultrastructure and Cytochemistry of the Cell-Types in the Tumorous Hematopoietic Organs and the Hemolymph of the Mutant Lethal (1) Malignant Blood Neoplasm (l(1)Mbn) of Drosophila melanogaster. Dev. Growth Differ. 1982, 24, 83–98. [Google Scholar] [CrossRef]
  12. Jung, S.-H.; Evans, C.J.; Uemura, C.; Banerjee, U. The Drosophila Lymph Gland as a Developmental Model of Hematopoiesis. Development 2005, 132, 2521–2533. [Google Scholar] [CrossRef] [PubMed] [Green Version]
  13. Márkus, R.; Laurinyecz, B.; Kurucz, E.; Honti, V.; Bajusz, I.; Sipos, B.; Somogyi, K.; Kronhamn, J.; Hultmark, D.; Andó, I. Sessile Hemocytes as a Hematopoietic Compartment in Drosophila Melanogaster. Proc. Natl. Acad. Sci. USA 2009, 106, 4805–4809. [Google Scholar] [CrossRef] [PubMed] [Green Version]
  14. Krzemien, J.; Oyallon, J.; Crozatier, M.; Vincent, A. Hematopoietic Progenitors and Hemocyte Lineages in the Drosophila Lymph Gland. Dev. Biol. 2010, 346, 310–319. [Google Scholar] [CrossRef] [Green Version]
  15. Makhijani, K.; Alexander, B.; Tanaka, T.; Rulifson, E.; Brückner, K. The Peripheral Nervous System Supports Blood Cell Homing and Survival in the Drosophila Larva. Development 2011, 138, 5379–5391. [Google Scholar] [CrossRef] [Green Version]
  16. Rizki, T.M.; Rizki, R.M. Properties of the Larval Hemocytes of Drosophila melanogaster. Experientia 1980, 36, 1223–1226. [Google Scholar] [CrossRef] [Green Version]
  17. Letourneau, M.; Lapraz, F.; Sharma, A.; Vanzo, N.; Waltzer, L.; Crozatier, M. Drosophila Hematopoiesis under Normal Conditions and in Response to Immune Stress. FEBS Lett. 2016, 590, 4034–4051. [Google Scholar] [CrossRef]
  18. Csordás, G.; Gábor, E.; Honti, V. There and Back Again: The Mechanisms of Differentiation and Transdifferentiation in Drosophila Blood Cells. Dev. Biol. 2021, 469, 135–143. [Google Scholar] [CrossRef]
  19. Brehélin, M. Comparative Study of Structure and Function of Blood Cells from Two Drosophila Species. Cell Tissue Res. 1982, 221, 607–615. [Google Scholar] [CrossRef]
  20. Dudzic, J.P.; Kondo, S.; Ueda, R.; Bergman, C.M.; Lemaitre, B. Drosophila Innate Immunity: Regional and Functional Specialization of Prophenoloxidases. BMC Biol. 2015, 13, 81. [Google Scholar] [CrossRef]
  21. Anderl, I.; Vesala, L.; Ihalainen, T.O.; Vanha-Aho, L.-M.; Andó, I.; Rämet, M.; Hultmark, D. Transdifferentiation and Proliferation in Two Distinct Hemocyte Lineages in Drosophila melanogaster Larvae after Wasp Infection. PLoS Pathog. 2016, 12, e1005746. [Google Scholar] [CrossRef] [PubMed] [Green Version]
  22. Avet-Rochex, A.; Boyer, K.; Polesello, C.; Gobert, V.; Osman, D.; Roch, F.; Augé, B.; Zanet, J.; Haenlin, M.; Waltzer, L. An in Vivo RNA Interference Screen Identifies Gene Networks Controlling Drosophila melanogaster Blood Cell Homeostasis. BMC Dev. Biol. 2010, 10, 65. [Google Scholar] [CrossRef] [PubMed] [Green Version]
  23. Honti, V.; Csordás, G.; Márkus, R.; Kurucz, E.; Jankovics, F.; Andó, I. Cell Lineage Tracing Reveals the Plasticity of the Hemocyte Lineages and of the Hematopoietic Compartments in Drosophila melanogaster. Mol. Immunol. 2010, 47, 1997–2004. [Google Scholar] [CrossRef] [PubMed] [Green Version]
  24. Stofanko, M.; Kwon, S.Y.; Badenhorst, P. Lineage Tracing of Lamellocytes Demonstrates Drosophila Macrophage Plasticity. PLoS ONE 2010, 5, e14051. [Google Scholar] [CrossRef] [Green Version]
  25. Liu, Z.-Z.; Sun, G.-Q.; Hu, X.-H.; Kwak-Kim, J.; Liao, A.-H. The Transdifferentiation of Regulatory T and Th17 Cells in Autoimmune/Inflammatory Diseases and Its Potential Implications in Pregnancy Complications. Am. J. Reprod. Immunol. 2017, 78, 2. [Google Scholar] [CrossRef]
  26. Agalioti, T.; Villablanca, E.J.; Huber, S.; Gagliani, N. TH17 cell Plasticity: The Role of Dendritic Cells and Molecular Mechanisms. J. Autoimmun. 2018, 87, 50–60. [Google Scholar] [CrossRef]
  27. Cattenoz, P.B.; Sakr, R.; Pavlidaki, A.; Delaporte, C.; Riba, A.; Molina, N.; Hariharan, N.; Mukherjee, T.; Giangrande, A. Temporal Specificity and Heterogeneity of Drosophila Immune Cells. EMBO J. 2020, 39, e104486. [Google Scholar] [CrossRef]
  28. Tattikota, S.G.; Cho, B.; Liu, Y.; Hu, Y.; Barrera, V.; Steinbaugh, M.J.; Yoon, S.-H.; Comjean, A.; Li, F.; Dervis, F.; et al. A Single-Cell Survey of Drosophila Blood. eLife 2020, 9, e54818. [Google Scholar] [CrossRef]
  29. Hanratty, W.P.; Ryerse, J.S. A Genetic Melanotic Neoplasm of Drosophila Melanogaster. Dev. Biol. 1981, 83, 238–249. [Google Scholar] [CrossRef]
  30. Luo, H.; Hanratty, W.P.; Dearolf, C.R. An Amino Acid Substitution in the Drosophila HopTum-l Jak Kinase Causes Leukemia-like Hematopoietic Defects. EMBO J. 1995, 14, 1412–1420. [Google Scholar] [CrossRef]
  31. Zettervall, C.-J.; Anderl, I.; Williams, M.J.; Palmer, R.; Kurucz, E.; Ando, I.; Hultmark, D. A Directed Screen for Genes Involved in Drosophila Blood Cell Activation. Proc. Natl. Acad. Sci. USA 2004, 101, 14192–14197. [Google Scholar] [CrossRef] [PubMed] [Green Version]
  32. Schmid, M.R.; Anderl, I.; Vesala, L.; Vanha-aho, L.-M.; Deng, X.-J.; Rämet, M.; Hultmark, D. Control of Drosophila Blood Cell Activation via Toll Signaling in the Fat Body. PLoS ONE 2014, 9, e102568. [Google Scholar] [CrossRef] [Green Version]
  33. Kurucz, E.; Zettervall, C.-J.; Sinka, R.; Vilmos, P.; Pivarcsi, A.; Ekengren, S.; Hegedüs, Z.; Ando, I.; Hultmark, D. Hemese, a Hemocyte-Specific Transmembrane Protein, Affects the Cellular Immune Response in Drosophila. Proc. Natl. Acad. Sci. USA 2003, 100, 2622–2627. [Google Scholar] [CrossRef] [PubMed] [Green Version]
  34. Sinenko, S.A.; Mathey-Prevot, B. Increased expression of Drosophila tetraspanin, Tsp68C, suppresses the abnormal proliferation of ytr-deficient and Ras/Raf-activated hemocytes. Oncogene 2004, 23, 9120–9128. [Google Scholar] [CrossRef] [PubMed] [Green Version]
  35. Kurucz, E.; Márkus, R.; Zsámboki, J.; Folkl-Medzihradszky, K.; Darula, Z.; Vilmos, P.; Udvardy, A.; Krausz, I.; Lukacsovich, T.; Gateff, E.; et al. Nimrod, a Putative Phagocytosis Receptor with EGF Repeats in Drosophila Plasmatocytes. Curr. Biol. 2007, 17, 649–654. [Google Scholar] [CrossRef] [PubMed] [Green Version]
  36. Kurucz, E.; Váczi, B.; Márkus, R.; Laurinyecz, B.; Vilmos, P.; Zsámboki, J.; Csorba, K.; Gateff, E.; Hultmark, D.; Andó, I. Definition of Drosophila Hemocyte Subsets by Cell-Type Specific Antigens. Acta Biol. Hung. 2007, 58, 95–111. [Google Scholar] [CrossRef] [Green Version]
  37. Honti, V.; Kurucz, E.; Csordás, G.; Laurinyecz, B.; Márkus, R.; Andó, I. In Vivo Detection of Lamellocytes in Drosophila Melanogaster. Immunol. Lett. 2009, 126, 83–84. [Google Scholar] [CrossRef] [Green Version]
  38. Tokusumi, T.; Shoue, D.A.; Tokusumi, Y.; Stoller, J.R.; Schulz, R.A. New Hemocyte-Specific Enhancer-Reporter Transgenes for the Analysis of Hematopoiesis in Drosophila. Genesis 2009, 47, 771–774. [Google Scholar] [CrossRef]
  39. Tokusumi, T.; Tokusumi, Y.; Brahier, M.S.; Lam, V.; Stoller-Conrad, J.R.; Kroeger, P.T.; Schulz, R.A. Screening and Analysis of Janelia FlyLight Project Enhancer-Gal4 Strains Identifies Multiple Gene Enhancers Active During Hematopoiesis in Normal and Wasp-Challenged Drosophila Larvae. G3 Genes Genomes Genet. 2017, 7, 437–448. [Google Scholar] [CrossRef] [Green Version]
  40. Szkalisity, A.; Piccinini, F.; Beleon, A.; Balassa, T.; Varga, I.G.; Migh, E.; Molnar, C.; Paavolainen, L.; Timonen, S.; Banerjee, I.; et al. Regression Plane Concept for Analysing Continuous Cellular Processes with Machine Learning. Nat. Commun. 2021, 12, 2532. [Google Scholar] [CrossRef]
  41. Li, M.Z.; Elledge, S.J. SLIC: A Method for Sequence- and Ligation-Independent Cloning. Methods Mol. Biol. 2012, 852, 51–59. [Google Scholar] [CrossRef] [PubMed]
  42. Konrad, L.; Becker, G.; Schmidt, A.; Klöckner, T.; Kaufer-Stillger, G.; Dreschers, S.; Edström, J.E.; Gateff, E. Cloning, Structure, Cellular Localization, and Possible Function of the Tumor Suppressor Gene Lethal(3)Malignant Blood Neoplasm-1 of Drosophila Melanogaster. Dev. Biol. 1994, 163, 98–111. [Google Scholar] [CrossRef] [PubMed]
  43. Márkus, R.; Kurucz, E.; Rus, F.; Andó, I. Sterile Wounding Is a Minimal and Sufficient Trigger for a Cellular Immune Response in Drosophila Melanogaster. Immunol. Lett. 2005, 101, 108–111. [Google Scholar] [CrossRef]
  44. Asha, H.; Nagy, I.; Kovacs, G.; Stetson, D.; Ando, I.; Dearolf, C.R. Analysis of Ras-Induced Overproliferation in Drosophila Hemocytes. Genetics 2003, 163, 203–215. [Google Scholar] [CrossRef] [PubMed]
  45. Zielke, N.; Korzelius, J.; van Straaten, M.; Bender, K.; Schuhknecht, G.F.P.; Dutta, D.; Xiang, J.; Edgar, B.A. Fly-FUCCI: A Versatile Tool for Studying Cell Proliferation in Complex Tissues. Cell Rep. 2014, 7, 588–598. [Google Scholar] [CrossRef] [PubMed] [Green Version]
  46. Evans, C.J.; Liu, T.; Banerjee, U. Drosophila Hematopoiesis: Markers and Methods for Molecular Genetic Analysis. Methods 2014, 68, 242–251. [Google Scholar] [CrossRef] [Green Version]
  47. Verfaillie, C.M. Can Human Hematopoietic Stem Cells Be Cultured Ex Vivo? Stem Cells 1994, 12, 466–476. [Google Scholar] [CrossRef]
  48. Amsellem, S.; Fichelson, S. Ex vivo expansion of human hematopoietic stem cells by passive transduction of the HOXB4 homeoprotein. J. Soc. Biol. 2006, 200, 235–241. [Google Scholar] [CrossRef]
  49. Centenera, M.M.; Raj, G.V.; Knudsen, K.E.; Tilley, W.D.; Butler, L.M. Ex Vivo Culture of Human Prostate Tissue and Drug Development. Nat. Rev. Urol. 2013, 10, 483–487. [Google Scholar] [CrossRef]
  50. Dumont, J.; Euwart, D.; Mei, B.; Estes, S.; Kshirsagar, R. Human Cell Lines for Biopharmaceutical Manufacturing: History, Status, and Future Perspectives. Crit. Rev. Biotechnol. 2016, 36, 1110–1122. [Google Scholar] [CrossRef]
  51. Sugimoto, N.; Eto, K. Platelet Production from Induced Pluripotent Stem Cells. J. Thromb. Haemost. 2017, 15, 1717–1727. [Google Scholar] [CrossRef] [PubMed]
  52. Zonari, E.; Desantis, G.; Petrillo, C.; Boccalatte, F.E.; Lidonnici, M.R.; Kajaste-Rudnitski, A.; Aiuti, A.; Ferrari, G.; Naldini, L.; Gentner, B. Efficient Ex Vivo Engineering and Expansion of Highly Purified Human Hematopoietic Stem and Progenitor Cell Populations for Gene Therapy. Stem Cell Rep. 2017, 8, 977–990. [Google Scholar] [CrossRef] [PubMed] [Green Version]
  53. Demers, I.; Donkers, J.; Kremer, B.; Speel, E.J. Ex Vivo Culture Models to Indicate Therapy Response in Head and Neck Squamous Cell Carcinoma. Cells 2020, 9, 2527. [Google Scholar] [CrossRef]
  54. Walsh, A.J.; Poole, K.M.; Duvall, C.L.; Skala, M.C. Ex Vivo Optical Metabolic Measurements from Cultured Tissue Reflect in Vivo Tissue Status. J. Biomed. Opt. 2012, 17, 116015. [Google Scholar] [CrossRef] [PubMed] [Green Version]
  55. Housden, B.E.; Valvezan, A.J.; Kelley, C.; Sopko, R.; Hu, Y.; Roesel, C.; Lin, S.; Buckner, M.; Tao, R.; Yilmazel, B.; et al. Identification of Potential Drug Targets for Tuberous Sclerosis Complex by Synthetic Screens Combining CRISPR-Based Knockouts with RNAi. Sci. Signal 2015, 8, rs9. [Google Scholar] [CrossRef] [Green Version]
  56. Kunzelmann, S.; Böttcher, R.; Schmidts, I.; Förstemann, K. A Comprehensive Toolbox for Genome Editing in Cultured Drosophila Melanogaster Cells. G3 Genes Genomes Genet. 2016, 6, 1777–1785. [Google Scholar] [CrossRef] [Green Version]
  57. Franz, A.; Brunner, E.; Basler, K. Generation of Genome-Modified Drosophila Cell Lines Using SwAP. Fly 2017, 11, 303–311. [Google Scholar] [CrossRef] [Green Version]
  58. Meijer, T.G.; Naipal, K.A.; Jager, A.; van Gent, D.C. Ex Vivo Tumor Culture Systems for Functional Drug Testing and Therapy Response Prediction. Future Sci. OA 2017, 3, FSO190. [Google Scholar] [CrossRef] [Green Version]
  59. Zhao, E.; Jiang, X.; Cui, H. Bombyx mori Dihydroorotate Dehydrogenase: Knockdown Inhibits Cell Growth and Proliferation via Inducing Cell Cycle Arrest. Int. J. Mol. Sci. 2018, 19, 2581. [Google Scholar] [CrossRef] [Green Version]
  60. Shi, D.; Mi, G.; Wang, M.; Webster, T.J. In Vitro and Ex Vivo Systems at the Forefront of Infection Modeling and Drug Discovery. Biomaterials 2019, 198, 228–249. [Google Scholar] [CrossRef]
  61. Kayukawa, T.; Furuta, K.; Nagamine, K.; Shinoda, T.; Yonesu, K.; Okabe, T. Identification of a Juvenile-Hormone Signaling Inhibitor via High-Throughput Screening of a Chemical Library. Sci. Rep. 2020, 10, 18413. [Google Scholar] [CrossRef] [PubMed]
  62. Obaldía, N.; Nuñez, M. On the Survival of 48 h Plasmodium Vivax Aotus Monkey-Derived Ex Vivo Cultures: The Role of Leucocytes Filtration and Chemically Defined Lipid Concentrate Media Supplementation. Malar. J. 2020, 19, 278. [Google Scholar] [CrossRef] [PubMed]
  63. Mbye, H.; Bojang, F.; Jawara, A.S.; Njie, B.; Mohammed, N.I.; Okebe, J.; D’Alessandro, U.; Amambua-Ngwa, A. Tolerance of Gambian Plasmodium Falciparum to Dihydroartemisinin and Lumefantrine Detected by Ex Vivo Parasite Survival Rate Assay. Antimicrob. Agents Chemother. 2020, 65, e00720-20. [Google Scholar] [CrossRef] [PubMed]
  64. Watanabe, K.; Yoshiyama, M.; Akiduki, G.; Yokoi, K.; Hoshida, H.; Kayukawa, T.; Kimura, K.; Hatakeyama, M. A Simple Method for Ex Vivo Honey Bee Cell Culture Capable of in Vitro Gene Expression Analysis. PLoS ONE 2021, 16, e0257770. [Google Scholar] [CrossRef] [PubMed]
  65. Wilkinson, A.C.; Ishida, R.; Nakauchi, H.; Yamazaki, S. Long-Term Ex Vivo Expansion of Mouse Hematopoietic Stem Cells. Nat. Protoc. 2020, 15, 628–648. [Google Scholar] [CrossRef]
  66. Echalier, G.; Ohanessian, A. Isolation, in tissue culture, of Drosophila melangaster cell lines. C. R. Acad. Hebd. Seances Acad. Sci. D 1969, 268, 1771–1773. [Google Scholar]
  67. Samakovlis, C.; Asling, B.; Boman, H.G.; Gateff, E.; Hultmark, D. In Vitro Induction of Cecropin Genes--an Immune Response in a Drosophila Blood Cell Line. Biochem. Biophys. Res. Commun. 1992, 188, 1169–1175. [Google Scholar] [CrossRef]
  68. Ui, K.; Nishihara, S.; Sakuma, M.; Togashi, S.; Ueda, R.; Miyata, Y.; Miyake, T. Newly Established Cell Lines from Drosophila Larval CNS Express Neural Specific Characteristics. In Vitro Cell. Dev. Biol. Anim. 1994, 30A, 209–216. [Google Scholar] [CrossRef]
  69. Echalier, G. Drosophila Cells in Culture; Academic Press: Cambridge, MA, USA, 1997. [Google Scholar]
  70. Niki, Y.; Yamaguchi, T.; Mahowald, A.P. Establishment of Stable Cell Lines of Drosophila Germ-Line Stem Cells. Proc. Natl. Acad. Sci. USA 2006, 103, 16325–16330. [Google Scholar] [CrossRef] [Green Version]
  71. Cherbas, L.; Gong, L. Cell Lines. Methods 2014, 68, 74–81. [Google Scholar] [CrossRef]
  72. Ishizu, H.; Sumiyoshi, T.; Siomi, M.C. Use of the CRISPR-Cas9 System for Genome Editing in Cultured Drosophila Ovarian Somatic Cells. Methods 2017, 126, 186–192. [Google Scholar] [CrossRef] [PubMed]
  73. Luhur, A.; Klueg, K.M.; Zelhof, A.C. Generating and Working with Drosophila Cell Cultures: Current Challenges and Opportunities. Wiley Interdiscip. Rev. Dev. Biol. 2019, 8, e339. [Google Scholar] [CrossRef] [PubMed]
  74. Liu, B.; Zheng, Y.; Yin, F.; Yu, J.; Silverman, N.; Pan, D. Toll Receptor-Mediated Hippo Signaling Controls Innate Immunity in Drosophila. Cell 2016, 164, 406–419. [Google Scholar] [CrossRef] [Green Version]
  75. Nonaka, S.; Ando, Y.; Kanetani, T.; Hoshi, C.; Nakai, Y.; Nainu, F.; Nagaosa, K.; Shiratsuchi, A.; Nakanishi, Y. Signaling Pathway for Phagocyte Priming upon Encounter with Apoptotic Cells. J. Biol. Chem. 2017, 292, 8059–8072. [Google Scholar] [CrossRef] [Green Version]
  76. Evans, C.J.; Liu, T.; Girard, J.R.; Banerjee, U. Injury-Induced Inflammatory Signaling and Hematopoiesis in Drosophila. Proc. Natl. Acad. Sci. USA 2022, 119, e2119109119. [Google Scholar] [CrossRef] [PubMed]
  77. Dubuffet, A.; Colinet, D.; Anselme, C.; Dupas, S.; Carton, Y.; Poirié, M. Variation of Leptopilina Boulardi Success in Drosophila Hosts: What Is inside the Black Box? Adv. Parasitol. 2009, 70, 147–188. [Google Scholar] [CrossRef]
  78. Heavner, M.E.; Hudgins, A.D.; Rajwani, R.; Morales, J.; Govind, S. Harnessing the Natural Drosophila-Parasitoid Model for Integrating Insect Immunity with Functional Venomics. Curr. Opin. Insect Sci. 2014, 6, 61–67. [Google Scholar] [CrossRef] [Green Version]
  79. Boulet, M.; Renaud, Y.; Lapraz, F.; Benmimoun, B.; Vandel, L.; Waltzer, L. Characterization of the Drosophila Adult Hematopoietic System Reveals a Rare Cell Population With Differentiation and Proliferation Potential. Front. Cell Dev. Biol. 2021, 9, 739357. [Google Scholar] [CrossRef]
  80. Izumi, M.; Miyazawa, H.; Kamakura, T.; Yamaguchi, I.; Endo, T.; Hanaoka, F. Blasticidin S-Resistance Gene (Bsr): A Novel Selectable Marker for Mammalian Cells. Exp. Cell Res. 1991, 197, 229–233. [Google Scholar] [CrossRef] [Green Version]
  81. Karreman, C. New Positive/Negative Selectable Markers for Mammalian Cells on the Basis of Blasticidin Deaminase-Thymidine Kinase Fusions. Nucleic Acids Res. 1998, 26, 2508–2510. [Google Scholar] [CrossRef] [Green Version]
  82. Ruan, J.; Ping, C.-Y.; Sun, S.; Cheng, X.; Han, P.-Y.; Zhang, Y.-G.; Sun, D.-X. Construction of a Replication-Competent Hepatitis B Virus Vector Carrying Secreted Luciferase Transgene and Establishment of New Hepatitis B Virus Replication and Expression Cell Lines. World J. Gastroenterol. 2019, 25, 5961–5972. [Google Scholar] [CrossRef]
  83. Li, Y.-M.; Wang, M.; Wang, T.-Y.; Wei, Y.-G.; Guo, X.; Mi, C.-L.; Zhao, C.-P.; Cao, X.-X.; Dou, Y.-Y. Effects of Different 2A Peptides on Transgene Expression Mediated by Tricistronic Vectors in Transfected CHO Cells. Mol. Biol. Rep. 2020, 47, 469–475. [Google Scholar] [CrossRef] [PubMed]
  84. Tsai, S.J.; Ai, Y.; Guo, C.; Gould, S.J. Degron Tagging of BleoR and Other Antibiotic-Resistance Genes Selects for Higher Expression of Linked Transgenes and Improved Exosome Engineering. J. Biol. Chem. 2022, 298, 101846. [Google Scholar] [CrossRef]
  85. Fu, Y.; Huang, X.; Zhang, P.; van de Leemput, J.; Han, Z. Single-Cell RNA Sequencing Identifies Novel Cell Types in Drosophila Blood. J. Genet. Genom. 2020, 47, 175–186. [Google Scholar] [CrossRef]
  86. Kharrat, B.; Csordás, G.; Honti, V. Peeling Back the Layers of Lymph Gland Structure and Regulation. Int. J. Mol. Sci. 2022, 23, 7767. [Google Scholar] [CrossRef] [PubMed]
  87. Duchek, P.; Somogyi, K.; Jékely, G.; Beccari, S.; Rørth, P. Guidance of Cell Migration by the Drosophila PDGF/VEGF Receptor. Cell 2001, 107, 17–26. [Google Scholar] [CrossRef] [PubMed] [Green Version]
  88. Lam, V.K.; Tokusumi, T.; Cerabona, D.; Schulz, R.A. Specific Cell Ablation in Drosophila Using the Toxic Viral Protein M2(H37A). Fly 2010, 4, 338–343. [Google Scholar] [CrossRef]
Figure 1. A schematic illustration of the Drosophila hemocyte culturing method.
Cells 12 00024 g001
Figure 2. Hemocyte composition and morphology in primary larval blood cell cultures. (A) Representative images of hemocyte cultures of naive, wounded, and wasp-infested Me, and tumorous Me; l(3)mbn1, Me,hopTum and Me; Hml>Pvrλ at the day of isolation (Day 0, 16 h after immune induction in case of wounded and wasp infested Me) and 6six days after (Day 6) (blue: nuclei, green: plasmatocytes, red: lamellocytes). Scale bar: 20 μm. (B) Bar graph showing the percentage of plasmatocytes and lamellocytes (ratio of GFP or Cherry positive cells on Day 0 or 6 to the GFP+Cherry positive cells on Day 0 in the same culture) in naive, wounded, and wasp infested Me, and tumorous Me; l(3)mbn1, Me,hopTum and Me; Hml>Pvrλ cultures on Day 0 and Day 6. Cells in three fields of view at a 10× objective were counted from each sample (n = 3), and the data are the mean ± SD of three independent experiments. Data were analyzed using ANOVA with Tukey’s test for multiple comparisons, ** p ≤ 0.01, **** p ≤ 0.0001. (C) Lamellocytes on the surface of isolated parasitoid wasp eggs in a wasp-infested Me culture 48 h after culturing (green: plasmatocytes, red: lamellocytes). Scale bar: 100 μm. (D) Bar graph showing lamellocyte size in hemocyte cultures of wounded and wasp infested Me, and tumorous Me; l(3)mbn1, Me,hopTum and Me; Hml>Pvrλ, data are mean ± SD of the size of 50 lamellocytes. Data were analyzed using ANOVA with Tukey’s test for multiple comparisons, **** p ≤ 0.0001. (E) Filopodium-like structures typical of lamellocytes in blood cell cultures of Me; Hml>Pvrλ larvae on Day 1 of culturing (blue: nuclei, green: plasmatocytes, red: lamellocytes, arrow indicates filopodium). Scale bar: 20 μm.
Cells 12 00024 g002
Figure 3. Proliferation and transdifferentiation in ex vivo hemocyte cultures. (A) Representative images of naive, wounded, and wasp-infested Cg>Fly-FUCCI cultures on Day 1 and Day 4 (green: cells in G1 phase, red: cells in S phase, yellow: cells in G2/M phase). Scale bar: 50 μm. (B) Bar graph showing the percentage of cells in G1, S, and G2/M phase in hemocyte cultures derived from naive, wounded, and wasp-infested Cg>Fly-FUCCI larvae. Cells in three fields of view at a 10× objective were counted from each sample (n = 3), and the data are the mean ± SD of three independent experiments. Data were analyzed using ANOVA with Tukey’s test for multiple comparisons, * p ≤ 0.05. (C) Representative images of hemocyte cultures of naive, wounded and wasp infested Me, and tumorous Me; l(3)mbn1, Me,hopTum and Me; Hml>Pvrλ on Day 1 of culturing (green: plasmatocytes, red: lamellocytes), arrows indicate transdifferentiating cells expressing both eaterGFP and msnCherry. Scale bar: 20 μm. (D) Bar graph showing the percentage of transdifferentiating cells (ratio of eaterGFP and msnCherry double positive cells to the total cell number in the culture) in naive, wounded, and wasp infested Me, and tumorous Me; l(3)mbn1, Me,hopTum and Me; Hml>Pvrλ on Day 1 and Day 4 of culturing. Cells in three fields of view at a 10x objective were counted from each sample (n = 3), and the data are the mean ± SD of three independent experiments. Data were analyzed using ANOVA with Tukey’s test for multiple comparisons, * p ≤ 0.05, **** p ≤ 0.0001.
Cells 12 00024 g003
Figure 4. Lamellocyte composition in wounded and wasp-infested atillaminosGFP; msnCherry hemocyte cultures. (A) Representative images of lamellocytes in wounded and wasp-infested atillaminosGFP; msnCherry on Day 0 and Day 6 of culturing (green: atillaminosGFP, red: msnCherry, blue: nuclei). Scale bar: 100 μm. (B) Bar graph showing the percentage of Cherry positive, GFP positive, and GFP+Cherry double positive lamellocytes in wounded and wasp infested atillaminosGFP; msnCherry cultures on Day 0 and Day 6 of culturing. Cells in three fields of view at a 10x objective were counted from each sample (n = 3), and the data are the mean ± SD of three independent experiments. Data were analyzed using ANOVA with Tukey’s test for multiple comparisons.
Cells 12 00024 g004
Figure 5. A blasticidin selection system for hemocyte subsets cultured ex vivo. (A) Representative images of crq>Act>GFP>BsdR, lz>GFP>BsdR and msn>GFP>BsdR cultures on Day 0 and Day 5 after treatment with blasticidin (green: crq>Act>GFP, lz>GFP and msn>GFP, respectively). Scale bar: 100 μm. (B) Bar graph showing the percentage of surviving cells (ratio of GFP positive cells on Day 5 to the GFP positive cells on Day 0 in the same culture) after blasticidin treatment in crq>Act>GFP, crq>Act>GFP>BsdR, lz>GFP, lz>GFP>BsdR, msn>GFP, and msn>GFP>BsdR cultures. Cells in three fields of view at a 10× objective were counted from each sample (n = 3), and the data are the mean ± SD of three independent experiments. Data were analyzed using ANOVA with Tukey’s test for multiple comparisons, **** p ≤ 0.0001. (C) Representative images of untreated Hml>GFP + Hml-DsRed and treated Hml>GFP>BsdR + Hml-DsRed cultures on Day 0 and Day 5 of culturing. (green: Hml>GFP, red: Hml-DsRed). Scale bar: 50 μm. (D) Bar graph showing the percentage of surviving Hml>GFP and Hml-DsRed cells (ratio of GFP or DsRed positive cells, respectively, to the total GFP+DsRed positive cells in the same culture) in untreated Hml>GFP + Hml-DsRed and treated Hml>GFP>BsdR + Hml-DsRed cultures on Day 0 and Day 5 of culturing. Cells in three fields of view of a 10× objective were counted from each sample (n = 3), and the data are the mean ± SD of three independent experiments. Data were analyzed using ANOVA with Tukey’s test for multiple comparisons, **** p ≤ 0.0001.
Cells 12 00024 g005
Disclaimer/Publisher’s Note: The statements, opinions and data contained in all publications are solely those of the individual author(s) and contributor(s) and not of MDPI and/or the editor(s). MDPI and/or the editor(s) disclaim responsibility for any injury to people or property resulting from any ideas, methods, instructions or products referred to in the content.

