Article

HSP90 Modulates T2R Bitter Taste Receptor Nitric Oxide Production and Innate Immune Responses in Human Airway Epithelial Cells and Macrophages

1
Department of Otorhinolaryngology—Head and Neck Surgery, Perelman School of Medicine, University of Pennsylvania, Philadelphia, PA 19104, USA
2
Department of Physiology, Perelman School of Medicine, University of Pennsylvania, Philadelphia, PA 19104, USA
*
Authors to whom correspondence should be addressed.
Cells 2022, 11(9), 1478; https://doi.org/10.3390/cells11091478
Submission received: 1 April 2022 / Revised: 22 April 2022 / Accepted: 26 April 2022 / Published: 27 April 2022

Abstract

:
Bitter taste receptors (T2Rs) are G protein-coupled receptors (GPCRs) expressed in various cell types including ciliated airway epithelial cells and macrophages. T2Rs in these two innate immune cell types are activated by bitter products, including those secreted by Pseudomonas aeruginosa, leading to Ca2+-dependent activation of endothelial nitric oxide (NO) synthase (eNOS). NO enhances mucociliary clearance and has direct antibacterial effects in ciliated epithelial cells. NO also increases phagocytosis by macrophages. Using biochemistry and live-cell imaging, we explored the role of heat shock protein 90 (HSP90) in regulating T2R-dependent NO pathways in primary sinonasal epithelial cells, primary monocyte-derived macrophages, and a human bronchiolar cell line (H441). Immunofluorescence showed that H441 cells express eNOS and T2Rs and that the bitter agonist denatonium benzoate activates NO production in a Ca2+- and HSP90-dependent manner in cells grown either as submerged cultures or at the air–liquid interface. In primary sinonasal epithelial cells, we determined that HSP90 inhibition reduces T2R-stimulated NO production and ciliary beating, which likely limits pathogen clearance. In primary monocyte-derived macrophages, we found that HSP-90 is integral to T2R-stimulated NO production and phagocytosis of FITC-labeled Escherichia coli and pHrodo-Staphylococcus aureus. Our study demonstrates that HSP90 serves as an innate immune modulator by regulating NO production downstream of T2R signaling by augmenting eNOS activation without impairing upstream Ca2+ signaling. These findings suggest that HSP90 plays an important role in airway antibacterial innate immunity and may be an important target in airway diseases such as chronic rhinosinusitis, asthma, or cystic fibrosis.

1. Introduction

Bitter taste receptors (also known as taste family 2 receptors, or T2Rs, encoded by TAS2R genes) are G protein-coupled receptors (GPCRs) used by the tongue to detect bitter compounds [1,2]. However, many of the 25 human T2R isoforms are also expressed in other organs [1,2,3,4], including the nose, sinuses, and lungs [5]. These receptors regulate diverse processes such as airway smooth muscle contraction [6,7,8,9] and innate immune responses in the oral epithelium [10]. T2R receptors are also expressed in immune cells such as monocytes and macrophages (MΦs) [11,12,13], which are important players in airway innate immunity [14,15]. In the airway epithelium, T2R isoforms 4, 14, 16, 38, and possibly others are expressed in bronchial and nasal motile cilia [5]. These T2Rs are activated in response to acyl-homoserine lactone (AHL) and quinolone quorum-sensing molecules secreted by the common airway pathogen Pseudomonas aeruginosa [5,16,17].
Activation of the T2Rs in sinonasal cilia or unprimed (M0) MΦs causes Ca2+-dependent activation of nitric oxide (NO) synthase (NOS) [5], likely the endothelial NOS (eNOS) isoform expressed in both airway ciliated cells [18,19,20,21,22] and M0 MΦs [23]. In ciliated cells, NO activates soluble guanylyl cyclase to produce cyclic GMP (cGMP). NO activates protein kinase G (PKG) to elevate ciliary frequency to increase mucociliary clearance, the major physical defense of the airway. The T2R-activated NO also directly diffuses into the airway surface liquid (ASL), where it can have antibacterial effects [5]. NO can damage bacterial cell walls and/or DNA [24,25]. NO can also inhibit the replication of many respiratory viruses, including influenza, parainfluenza, rhinovirus [26], and SARS-CoV-1 and -2 [27,28,29,30]. In MΦs, T2R-stimulated NO production and cGMP production acutely increase phagocytosis [31]. Thus, T2R to NO signaling may also be an important therapeutic target in infectious diseases beyond the airway. As NOS and NO have been implicated in chronic rhinosinusitis [32] as well as asthma and other lung diseases [33], a better understanding of the mechanisms of NOS activation in airway epithelial cells may have implications beyond T2Rs.
The importance of T2Rs in upper airway defense is supported by observations that patients homozygous for the AVI TAS2R38 polymorphism, which renders the T2R38 receptor non-functional, have an increased frequency of Gram-negative bacterial infection [34], higher levels of sinonasal bacteria in general [35,36] and specifically biofilm-forming bacteria [37], a higher frequency of chronic rhinosinusitis [38,39,40,41], and worse outcomes after functional endoscopic sinus surgery [42]. One study has suggested that TAS2R38 genetics may also play a role in cystic fibrosis (CF) P. aeruginosa infection [43], though other studies have suggested that TAS2R38 may not be a modifier gene in CF [44,45]. Recently, the TAS2R38 PAV (functional) genotype has been associated with a lower mortality of SARS-CoV-2 compared with the AVI (non-functional) genotype [46]. A better understanding of the role of T2R38 and other T2Rs in airway innate immunity is important for determining if and how to leverage these receptors as therapeutic targets or predictive biomarkers. An important component of this is to better understand the T2R signaling pathway.
In this study, we explored the role of heat shock protein 90 (HSP90) in T2R function in two types of cells important for airway innate immunity: ciliated epithelial cells and MΦs. The members of the HSP90 class of molecular chaperones are highly conserved and ubiquitously expressed [47]. In addition to promoting protein folding, HSP90 regulates signaling by facilitating trafficking or localization of signaling proteins and/or functioning as molecular scaffolds to bring signaling molecules together. Because HSP90 is critical for endothelial cell NO production via eNOS as well as alcohol-stimulated NO-driven cilia beating in the airway [48], we tested if HSP90 is involved in T2R-dependent NO generation. HSP90 proteins can facilitate eNOS activation via scaffolding of eNOS with activating kinases such as Akt or Ca2+-bound calmodulin (CaM) kinases [49,50,51,52,53]. HSP90 has been localized to the base of airway cell cilia [48,54,55], suggesting that HSP90 may be localized close to T2Rs in airway ciliated cells and may help facilitate their signal transduction to eNOS. HSP90 may even shuttle between the cilia base and the cilia axoneme in airway ciliated cells during alcohol exposure [48]. We hypothesized that HSP90 may likewise be involved in T2R/bacterial-driven NO production and regulate this innate immune pathway. Furthermore, it was recently proposed that HSP90 inhibition by geldanamycin can revert Th2- and Th17-induced airway epithelial goblet cell metaplasia [56]. If HSP90 inhibition reduces T2R NO responses, this may have unwanted effects of reducing T2R/NO-mediated innate immunity.
To test the requirement for HSP90 in T2R signaling, we combined biochemistry and live-cell imaging with a human bronchiolar cell line, primary sinonasal epithelial cells, and primary monocyte-derived MΦs. Results below reveal important molecular insights into the T2R signaling pathway in both airway epithelial and immune cells and identify a specific role for HSP90 in airway epithelial NO-mediated innate immunity.

2. Materials and Methods

2.1. Cell Culture

HEK293T human embryonic kidney cells were obtained from ATCC (ATCC Cat# CRL-3216, RRID:CVCL_0063) and cultured in high-glucose DMEM (Thermo Fisher Scientific, Waltham, MA, USA) plus 10% FetalPlex serum substitute (Gemini Biosciences, West Sacramento, CA, USA) and 1× cell culture penicillin/streptomycin (Thermo Fisher Scientific) as described [57]. For transfection, cells were seeded onto 8-well chambered glass coverslips (CellVis, Mountain View, CA, USA; precoated with poly-D-lysine) and transfected with eNOS-RFP, Wt HSP90, and/or D88N HSP90, kindly provided by W. Sessa (plasmids # 22497 [RRID:Addgene_22497], #22487 [RRID:Addgene_22487], and/or #22480 [RRID:Addgene_22480], respectively; Addgene, Watertown, MA, USA). S1179D and S1179A eNOS-RFP was generated by site directed mutagenesis from Wt eNOS-RFP and verified by sequencing (University of Pennsylvania Penn Genomic Analysis Core DNA Sequencing Facility). Mutation of the S to D introduces a negative charge and acts as a phosphomimetic of phosphoserine, creating an eNOS that functions as if constitutively phosphorylated at S1179. Mutations of the S to A prevents phosphorylation at that site. Cells were stimulated with 10 µg/mL SC79 (Cayman Chemical, Ann Arbor, MI, USA) that was made from 10 mg/mL SC79 stock in DMSO. Control solutions had 0.1% DMSO as vehicle control. No effects of DMSO alone were observed. RFP fluorescence was used to verify similar transfection efficiencies in all experiments.
H441 small airway human club-like epithelial cells (American Type Culture Collection [ATCC], Manassas, VA, USA; Cat# HTB-174, RRID:CVCL_1561) were cultured in Minimal Essential Medium (MEM; Thermo Fisher Scientific) with Earle’s salts plus 10% FetalPlex serum substitute and 1× cell culture penicillin/streptomycin. Cells were seeded and imaged on plastic 48-well plates as they stuck very poorly to glass. For air–liquid interface (ALI) cultures, H441 cells were seeded onto collagen-coated 1.1 cm2 Transwell filters (for intracellular DAF-FM) or 0.33 cm2 Transwell filters (for extracellular Daf-2) both with 0.4 µm pore size (transparent; Corning, Corning, NY, USA) and grown to confluence for 5 days before exposing the apical side to air, as described previously for 16HBE and Calu-3 cells [58,59]. H441 ALIs were switched to bronchial epithelial cell basal medium (BEBM; Lonza, Walkersville, MD, USA) plus Lonza Singlequot supplements (differentiation medium) upon confluence and exposure to air. When the culture medium was removed from the upper compartment, basolateral medium was changed to differentiation medium (1:1 DMEM:BEBM) containing hEGF (0.5 ng/ mL), epinephrine (5 ng/mL), BPE (0.13 mg/mL), hydrocortisone (0.5 ng/mL), insulin (5 ng/mL), triiodothyronine (6.5 ng/mL), and transferrin (0.5 ng/mL), supplemented with 100 U/mL penicillin, 100 g/mL streptomycin, 0.1 nM retinoic acid, and 2% NuSerum (BD Biosciences, San Jose, CA, USA) all from the Lonza Singlequot supplements as described [22]. Cells were fed from the basolateral side only with differentiation medium for ~21 days before use.
Submerged H441 cells were infected with Green GENIe-expressing BacMam (Montana Molecular, Bozeman, MT, USA) as per the manufacturer’s protocol for adherent cells; the medium was changed 4–6 h after infection to BacMam-free medium containing 2 mM NaButyrate to maintain expression. For siRNA, H441s were treated with Acell SMARTPool siRNAs (Horizon Discovery, Waterbeach, UK) for human eNOS (NOS3; Catalog ID:E-006490-00-0005), nNOS (NOS1; Catalog ID: E-009496-00-0005), PAR-2 (Catalog ID:E-005095-00-0005), or non-targeting pool (Catalog ID: D-001910-10-05) as per the manufacturer’s instructions and as previously described [31]. H441 cells were transfected with Wt or D88N HSP90 (Kindly provided by W. Sessa, Addgene plasmids #22487 or #22480, respectively) using lipofectamine 3000 and the specific H441 protocol provided on the Thermo Fisher Scientific website. We used 5 µL of lipofectamine and 2 µg DNA per 8-well chambered coverglass (CellVis), equating to 0.25 µg DNA/well, with each well approximately equivalent to a 48-well plate in surface area.
A549 human adenocarcinoma alveolar type-2-like cells (NCI-DTP Cat# A549, RRID:CVCL_0023) were identically transfected with GFP-eNOS (provided by W. Sessa, Addgene plasmid #22444; RRID:Addgene_22444) and/or mCherry-HSP90 (provided by D. Picard, Addgene plasmid #108223; RRID:Addgene_108223). Cells were cultured in Ham’s F12K medium (Thermo Fisher Scientific) containing 10% FetalPlex and 1% penicillin/streptomycin mix and imaged in 20 mM HEPES-buffered Hank’s Balanced Salt Solution (HBSS). Cells were transfected and imaged on 8-well chambered coverglass (uncoated) using 470/20 nM band pass (bp) filter (for GFP excitation), 490 lp dichroic beamsplitter, and 520/40 nm bp filter (for GFP emission) or 600/50 nm bp filter (for mCherry emission). Lack of bleed-through of GFP emission with the mCherry emission filter was observed in pilot experiments imaging GFP transfection only and is demonstrated with no fluorescence when GFP-eNOS is expressed with mCherry alone (described in the main text). Imaging of A549 cells was carried out using a 40× 0.75 NA objective on in Olympus (Tokyo, Japan) IX-83 microscope with Hammamatsu (Tokyo, Japan) Orca Flash 4.0 sCMOS camera and XCite 120 Boost LED illumination source (Excelitas, Waltham, MA, USA) and MetaMorph (Molecular Devices, San Jose, CA, USA).
Primary human M0 MΦs were cultured as previously described [31] in high-glucose RPMI2650 medium with 10% human serum and 1x cell culture penicillin/streptomycin. De-identified monocytes from healthy apheresis donors were obtained from the University of Pennsylvania Human Immunology core with written informed consent of every participant and institutional review board approval. Cells isolated from 10 different individuals were used. As all samples were de-identified for race, age, sex, etc., samples were used in a blinded fashion. MΦs were differentiated by adherence culture for 12 days in 8-well chamber slides (CellVis) as described [31]. Our prior studies suggest no differences in T2R responses among MΦs differentiated by adherence alone or by adherence plus M-CSF [31], and thus adherence only was used for these studies. MΦs were treated with Acell SMARTPool siRNAs as described [31].
Primary human nasal epithelial cells were obtained in accordance with The University of Pennsylvania guidelines regarding use of residual clinical material from patients undergoing sinonasal surgery at the University of Pennsylvania with institutional review board approval (#800614) and written informed consent from each patient in accordance with the U.S. Department of Health and Human Services code of federal regulation Title 45 CFR 46.116. Inclusion criteria were patients ≥ 18 years of age undergoing sinonasal surgery for sinonasal disease (CRS) or other procedures (e.g., trans-nasal approaches to the skull base). Exclusion criteria included history of systemic inheritable disease (e.g., granulomatosis with polyangiitis, cystic fibrosis, and systemic immunodeficiencies) or use of antibiotics, oral corticosteroids, or anti-biologics (e.g., Xolair) within one month of surgery. Individuals ≤ 18 years of age, pregnant women, and cognitively impaired persons were not included. Tissue was transported to the lab in saline on ice and mucosal tissue was immediately removed for cell isolation.
Sinonasal epithelial cells were enzymatically dissociated and grown to confluence in proliferation medium (50% DMEM/Ham’s F-12 plus 50% BEBM plus Lonza Singlequot supplements) for 7 days [22]. Confluent cells were dissociated and seeded on Corning Transwells (0.33 cm2, 0.4 µm pore size; transparent; corning) coated with BSA, type I bovine collagen, and fibronectin (Corning). When culture medium was removed from the upper compartment, basolateral medium was changed to differentiation medium as described above for H441 ALIs. Primary ALI cultures were genotyped for TAS2R38 PAV (functional) or AVI (non-functional) polymorphims [60,61] as described [22]. Cell identity was verified based airway epithelial morphology (formation of motile cilia, goblet cells, transepithelial electrical resistance, etc.) observed after differentiation.

2.2. Live-Cell Imaging of Ca2+, NO, and cGMP

Unless indicated, all regents were from MilliporeSigma (St. Louis, MO, USA). Adherent, submerged HEK293Ts in 20 mM HEPES-buffered Hank’s Balanced Salt solution (HBSS) were simultaneously loaded and stimulated for 30 min in the presence of 10 µM DAF-FM-diacetate (Thermo Fisher Scientific) ± SC79 (Cayman Chemical, Ann Arbor, MI, USA) as indicated. HEK293Ts were then immediately washed three times in HBSS and imaged as below. Submerged H441 cells were loaded for 30 min with 10 µM DAF-FM-diacetate (Thermo Fisher Scientific) in 20 mM HEPES-buffered HBSS supplemented with 1× MEM amino acids followed by washing with HBSS + 1× MEM amino acids. Calbryte 590 AM (AAT Bioquest, Sunnyvale, CA, USA) was loaded identically. When used, L-NAME (10 µM), D-NAME (10 µM), U73122 (1 µM), U73343 (1 µM), or geldanamycin (all from Cayman Chemical, Ann Arbor, MI, USA) were included in the loading solution as 30 min pretreatment; cPTIO (10 µM) was only added after loading. Cells were then washed out of DAF-FM into HBSS with the continued presence of inhibitor for the start of the experiment. Transwells were loaded with DAF-FM-diacetate for 60 min and placed into a glass-bottom 12-well dish (CellVis) prior to imaging. MΦs were loaded with 5 µM fura-2-AM or DAF-FM DA for 45 min as previously described [31]. Primary human ALIs were loaded for 90 min with DAF-FM-diacetate as previously described [22]. Denatonium benzoate, sodium benzoate, and phenylthiocarbamide were from Sigma Aldrich (St. Louis, MO, USA) and N-(acetyloxy)-3-nitrosothiovaline SNAP, BIIB021, and VER-155008 were from Cayman Chemical (St. Louis, MO, USA).
DAF-FM, fura-2, and cGMP were imaged as previously described [22,62]. DAF-FM was imaged on a TS100 microscope (20× 0.75 PlanApo objective for MΦs on glass and 10× 0.3 NA PlanFluor objective for H441 cells submerged on plastic or grown on Transwells; Nikon, Tokyo, Japan) GFP filter set, XCite 110 LED (Excelitas Technologies, Waltham, MA, USA), and Retiga R1 Camera (Teledyne QImaging, Surrey, BC, Canada). Calbryte 590 was imaged using the same microscope plus TRITC filter set and 10× 0.3 NA PlanFluor objective, as submerged H441s on plastic necessitated a longer working distance. Images were acquired using Micromanager [63]. Fura-2 was imaged using MetaFluor (Molecular Devices, Sunnyvale, CA, USA) and standard fura-2 dual excitation filter set on IX-83 microscope (20× 0.75 NA PlanApo objective for MΦs on glass, 10× 0.4 NA PlanApo objective for H441 cells on plastic; Olympus, Tokyo, Japan) equipped with a fluorescence xenon lamp (Sutter Lambda LS, Sutter Instruments, Novato, CA, USA), excitation and emission filter wheels (Sutter Lambda 2), and Orca Flash 4.0 sCMOS camera (Hamamatsu, Tokyo, Japan). Green GENIe cGMP construct was imaged using a FITC filter set, IX83 microscope, 10× 0.4 NA PlanApo objective, XCite 120Boost LED illumination, and MetaMorph.

2.3. Measurement of Ciliary Beat Frequency (CBF)

Whole-field CBF was measured using the Sisson-Ammons Video Analysis system [64] as previously described [22] at ~26–28 °C, with the exception of bacterial cHBSS experiments, which were carried out at room temperature. Cultures were imaged at 120 frames/s using a Leica DM-IL microscope (20×/0.8 NA objective) with Hoffman modulation contrast in a custom glass-bottom chamber. Experiments utilized Dulbecco’s PBS (+1.8 mM Ca2+) on the apical side and 20 mM HEPES-buffered Hank’s Balanced Salt Solution supplemented with 1× MEM vitamins and amino acids on the basolateral side. As typically performed with CBF measurements [22], changes in CBF were normalized to baseline CBF. This was validated by measurements of raw baseline CBF (in Hz) between control and experimental cultures showing no significant differences, as indicated in the text.

2.4. Bacteria Culture

For ciliary beating experiments, PAO-1 (ATCC 15692) and PAO-JP2 (ΔlasI, ΔrhlI; Tcr, HgCl2r) [65,66] were cultured in LB medium as described [34]. Conditioned HBSS (cHBSS) was prepared by taking the pellet of an overnight culture and resuspending to OD 0.1 in HBSS and incubating overnight with shaking. We used cHBSS over conditioned LB due to the slight stimulatory effects of LB alone on CBF at dilutions > 10% [34]. After centrifuging (5000× g, 15 min, 4 °C) to pellet bacteria, cHBSS was filtered through a 0.2 µm filter then diluted as indicated with unconditioned (unmodified) HBSS.
For antibacterial assays (as described in [34]), P. aeruginosa strain PAO1 was grown to log phase (OD = 0.1) and resuspended in a buffer designed to mimic physiological nasal airway surface liquid (ASL) conditions (50% saline containing 1 mM HEPES and 0.5 mM glucose with pH = 6.5). Nasal ALIs were placed in 24-well plates in antibiotic-free F12K medium (Thermo Fisher Scientific) plus glutamate on the basolateral side. Bacteria in 30 µL of this solution were placed on the apical side of the ALI and allowed to settle for ~10 min, at which point the bulk ASL fluid was aspirated. After 2 h at 37 °C, residual bacteria were removed by washing. For live/dead staining, bacteria were incubated with 2× solution of BacLight Bacterial Viability Kit (Thermo Fisher Scientific) containing SYTO9 (to stain live cells) and propidium iodide (to stain dead cells). Control experiments were similarly performed with incubation of Transwell filters containing no nasal cells with bacteria in saline solution or saline plus anti-Gram-negative antibiotic colistin sulfate (10 µg/mL). Live/dead (green/red) ratio was subsequently quantified in a Spark 10M (Tecan, Männedorf, Switzerland) using 485 ± 10 nm excitation with 530 ± 12 nm and 620 ± 20 nm emission. CFUs counts were obtained by taking aliquots of the live dead mix, diluting with saline, and spotting on LB plates.

2.5. Immunofluorescence (IF) Microscopy

IF was carried out as previously described [22]. ALI cultures were fixed in 4% formaldehyde for 20 min at room temperature, followed by blocking and permeabilization in phosphate-buffered saline (PBS) containing 1% bovine serum albumin (BSA), 5% normal donkey serum (NDS), 0.2% saponin, and 0.3% triton X-100 for 1 h at 4 °C. H441 cells were fixed in 4% formaldehyde for 20 min at room temp, followed by blocking and permeabilization in PBS containing 1% BSA, 5% NDS, 0.2% saponin, and 0.1% triton X-100 for 30 min at 4 °C. Primary antibody incubation (1:100 for anti-T2R antibodies, 1:250 for tubulin antibodies) were carried out at 4°C overnight. Incubation with AlexaFluor (AF)-labeled donkey anti-mouse and rabbit secondary antibody incubation (1:1000) was carried out for 2 h at 4 °C. Transwell filters were removed from the plastic mounting ring and mounted with Fluoroshield with DAPI (Abcam; Cambridge, MA, USA)). For co-staining of T2R14 and T2R38, Zenon antibody labeling kits (Thermo Fisher Scientific) were used to directly label primary antibodies with either AF546 or AF647 as described [22]. Images of ALIs were taken on an Olympus Fluoview confocal system with IX-73 microscope and 60× (1.4 NA) objective and analyzed in FIJI [67]. Images of submerged H441 cells were taken on an Olympus IX-83 microscope with 60× (1.4 NA) objective using Metamorph. Anti-T2R38 (ab130503; rabbit polyclonal; RRID:AB_11156286) and anti-beta-tubulin IV (ab11315; mouse monoclonal; RRID:AB_297919) antibodies were from Abcam. Anti-T2R14 (PA5-39710; rabbit polyclonal; RRID:AB_2556261) primary antibody and conjugated secondary antibodies (donkey anti-rabbit AlexaFluor 546 [RRID:AB_2534016] and donkey anti-mouse AlexaFluor 488 [RRID:AB_141607]) were from Thermo Fisher Scientific. Alpha-tubulin antibody was from Developmental Studies Hybridoma Bank (12G10; mouse monoclonal; University of Iowa, Iowa City; RRID:AB_1157911). Anti-eNOS antibody (NB-300-605; rabbit polyclonal; RRID:AB_10002794) was from Novus (Littleton, CO, USA). Immunofluorescence images were analyzed in FIJI [67] using only linear adjustments (min and max), set equally between images that are compared. Compared images were always taken with the same exposure, objective, and other camera and microscope settings. Both conventional (0 = black) and inverted (0 = white) lookup tables (LUTs) were shown in this study to illustrate localizations as clearly as possible, since inverted LUTs can be useful for visualizing high-dynamic-range fluorescence data. Inverted LUTs used were from ChrisLUTs FIJI package [68] (C. Leterrier, Neuropathophysiology Institute, Marseille University).

2.6. Phagocytosis Assays

Phagocytosis assays were carried out as descried [31]. MΦs were incubated with heat-killed FITC-labeled Escherichia coli at 250 µg/mL (strain K-12; reagents from Vybrant phagocytosis assay kit; Thermo Fisher Scientific; Cat # E2861) in phenol red-free, low-glucose DMEM (Thermo Fisher Scientific) ± denatonium benzoate or other agonists or inhibitors for 15 min at 37 °C. As we found that phagocytosis was negligible from temperatures of 4 °C up to room temp in these assays [31], we recorded fluorescence from living cells at room temperature immediately after the 15 min 37 °C incubation with FITC-E. coli. Extracellular FITC was quenched with trypan blue per the manufacturer’s instructions, and fluorescence was recorded on a Spark 10M plate reader (Tecan; 485 nm excitation, 535 nm emission). For representative micrograph shown, MΦs on glass were incubated as above, and extracellular FITC was quenched with trypan blue and cells were washed ≥5× in PBS to remove residual extracellular FITC-E. coli. Remaining adherent MΦs were fixed in 4% formaldehyde (Electron Microscopy Sciences, Hatfield, PA, USA) for 10 min followed by DAPI staining in mounting medium (Fluoroshield with DAPI, Abcam). FITC-E. coli were then imaged using standard FITC filter set (Semrock, Rochester, NY, USA) on an inverted Olympus IX-83 microscope with 20× (0.8 NA) objective, XCite 120LEDBoost illumination source, and Hammamatsu Orca Flash 4.0 sCMOS camera.
Phagocytosis assays were also carried out similarly using 125 µg/mL pHrodo red-labeled S. aureus (strain Wood 46; Thermo Fisher Scientific, cat # A10010) [31]. As pHrodo dyes only fluoresce when particles are internalized into low pH endosomes (previously demonstrated in [31]), this assay does not require washing or quenching of the extracellular pHrodo S. aureus. MΦs were incubated with pHrodo-S. aureus for 30 min at 37 °C as described [31] with excitation at 555 nm and emission at 595 nm measured on the Tecan Spark 10M plate reader. Background measurements were made using wells containing fluorescent S. aureus in the absence of MΦs. Representative images were taken as above except using a standard TRITC filter set (Semrock).

2.7. Data Analysis and Statistics

Multiple comparisons were made with one-way ANOVA with Bonferroni (pre-selected pairwise comparisons), Tukey–Kramer (comparing all values), or Dunnett’s (comparing to control value) post-tests; p < 0.05 was considered statistically significant. Asterisks (* and **) indicate p < 0.05 and p < 0.01, respectively. All data in bar graphs are shown as the mean ± SEM with n derived from biological replicates (separate experiments conducted with different passage/patient cells on different days). Images shown for comparison were collected on the same day under identical conditions with identical min/max settings. No non-linear (e.g., gamma) adjustments were made to any images for either display or analysis. Raw unprocessed image data were analyzed in FIJI [67] and resulting numerical data were analyzed in Excel (Microsoft) and/or Prism (GraphPad software, La Jolla, CA, USA). All data used to generate bar graphs and traces are available upon request.

3. Results

3.1. HSP90 Inhibition Reduces Heterologously Expressed eNOS Function in HEK293Ts and A549s

To first determine if we could recapitulate prior results that HSP90 is important for eNOS function [51,53,69,70,71] in a reductionist model, we expressed eNOS-RFP in HEK293Ts, an eNOS null cell line [72]. We measured NO production using reactive nitrogen species (RNS)-sensitive dye DAF-FM over 30 min. One mechanism by which eNOS can be activated is phosphorylation at S1177 (S1179 in bovine eNOS). We found that expression of phosphomimetic S1179D mutated eNOS dramatically increased DAF-FM fluorescence compared with Wt eNOS-RFP or S1179A eNOS-RFP, which cannot be phosphorylated at that site (Supplementary Figure S1A,B). HSP90 inhibitor geldanamycin (10 µM; 30 min pretreatment then continued throughout the 30 min experiment) reduced DAF-FM fluorescence in S1179D eNOS-RFP-expressing cells. Supporting that the role of HSP90 inhibition, we also found that co-transfection of a dominant negative (DN) HSP90 isoform (D88N) [71] reduced DAF-FM fluorescence (Supplementary Figure S1B). These results support prior studies that HSP90 is important for the function of eNOS itself independent of upstream signaling.
Small-molecule Akt activator SC79 induces eNOS phosphorylation and NO production in airway epithelial cells [73]. SC79 activated DAF-FM fluorescence increases in HEK293Ts transfected with Wt eNOS but not in untransfected cells (Supplementary Figure S1C). In Wt eNOS-transfected cells, SC79-induced DAF-FM fluorescence increases were reduced by Akt inhibition, co-transfection with dominant negative (K179M) Akt [74], HSP90 inhibitors geldanamycin or BIIB 021, or co-transfection of DN HSP90 (Supplementary Figure S1D,E). All together, these data suggest that HSP90 is important for eNOS-mediated NO production, supporting many prior studies [52,53,71]. When we transfected GFP-tagged eNOS [75] and mCherry-tagged HSP90 [76] into submerged A549 airway cells, Förster resonance energy transfer (FRET) data suggested that heterologously expressed HSP90 and eNOS closely co-localized in an airway cell line, and this association or close co-localization may increase during T2R stimulation (Supplementary Figure S2).

3.2. HSP90 Inhibition Reduces Endogenous T2R-Stimulated eNOS Function in Submerged H441 Cells

We next wanted to test if HSP90 activity affects endogenous eNOS function when activated by endogenous T2R receptors. We started by examining if T2R stimulation activates NO production in H441 small airway epithelial cells, a club cell-like cell line that expresses eNOS similarly to primary bronchial cells [20,77]. H441 cells produce NO in response to estrogen and other types of stimulation [20,77,78,79,80]. We observed positive immunofluorescence (IF) for eNOS in submerged H441s compared with rabbit serum and fluorescent secondary alone (Supplementary Figure S3A–C), confirming that H441s express eNOS as demonstrated previously by others [20,77].
We also noted positive T2R4 and T2R46 immunofluorescence in submerged H441s (Supplementary Figure S3D–F). The rationale for examining T2R4 and 46 was that T2R4 localizes to nasal cilia [5,22] and T2R46 localizes to bronchial cilia [4]. Both are also expressed in human monocyte-derived MΦs [31]. Quantitative PCR (qPCR) of submerged H441s for the T2Rs responsive to denatonium benzoate supported expression of both T2R4 and T2R46, as well as T2R30 (formerly known as T2R47) and possibly T2R13 and T2R10 (Supplementary Figure S4A).
All of these T2R isoforms (4, 46, 10, 13, and 30) are activated by the bitter compound denatonium benzoate, which activates eight out of the 25 human T2R isoforms [81,82]. The denatonium benzoate effective concentrations (ECs) for T2R4 and T2R46 are ~300 and ~30 µM, respectively, with an EC50 of ~240 µM reported for T2R46 in a heterologous HEK293T expression system. To test if denatonium benzoate activated NO production in submerged H441s, we loaded H441s with reactive nitrogen species-sensitive dye DAF-FM to track NO production, as performed previously in primary nasal cells [22]; 1 mM denatonium benzoate increased in intracellular DAF-FM fluorescence that was inhibited by NO scavenger carboxy-PTIO, NOS inhibitor L-NAME, eNOS siRNA, phospholipase C (PLC) inhibitor U73122 (Supplementary Figure S4B–E). DAF-FM increases in response to T2R agonists denatonium, quinine and thujone (1 mM), which activate T2Rs in bronchial [4] and nasal cilia [83], were reduced in cells transfected with a dominant negative HSP90 beta (D88N-HSP90; Supplementary Figure S4F) [71]. Denatonium-induced DAF-FM fluorescence increases were also reduced ≥50% by pretreatment (1 h) with 10 µM HSP-90 inhibitor geldanamycin (Supplementary Figure S4G), suggesting that denatonium-induced (likely T2R-induced) NO production requires HSP90 activity. There was no alteration of the denatonium-induced Ca2+ responses with this concentration of geldanamycin (Supplementary Figure S4H), suggesting that the role of HSP90 is likely downstream of Ca2+ signaling.
NO increases intracellular cGMP by activating soluble guanylyl cyclase. We tested if denatonium stimulation increased cGMP using a cGMP fluorescent biosensor (Green GENie; Montana Molecular). Denatonium caused an increase in cGMP (decrease in Green GENIe F/Fo; plotted inversely in Supplementary Figure S5A,B) that was likewise inhibited by blockade of NOS activity by L-NAME (Supplementary Figure S5A,C) or geldanamycin pretreatment (Supplementary Figure S5B,C). These results all suggest that full activation of eNOS and downstream cGMP production during T2R agonist stimulation in H441 cells requires HSP90 function.

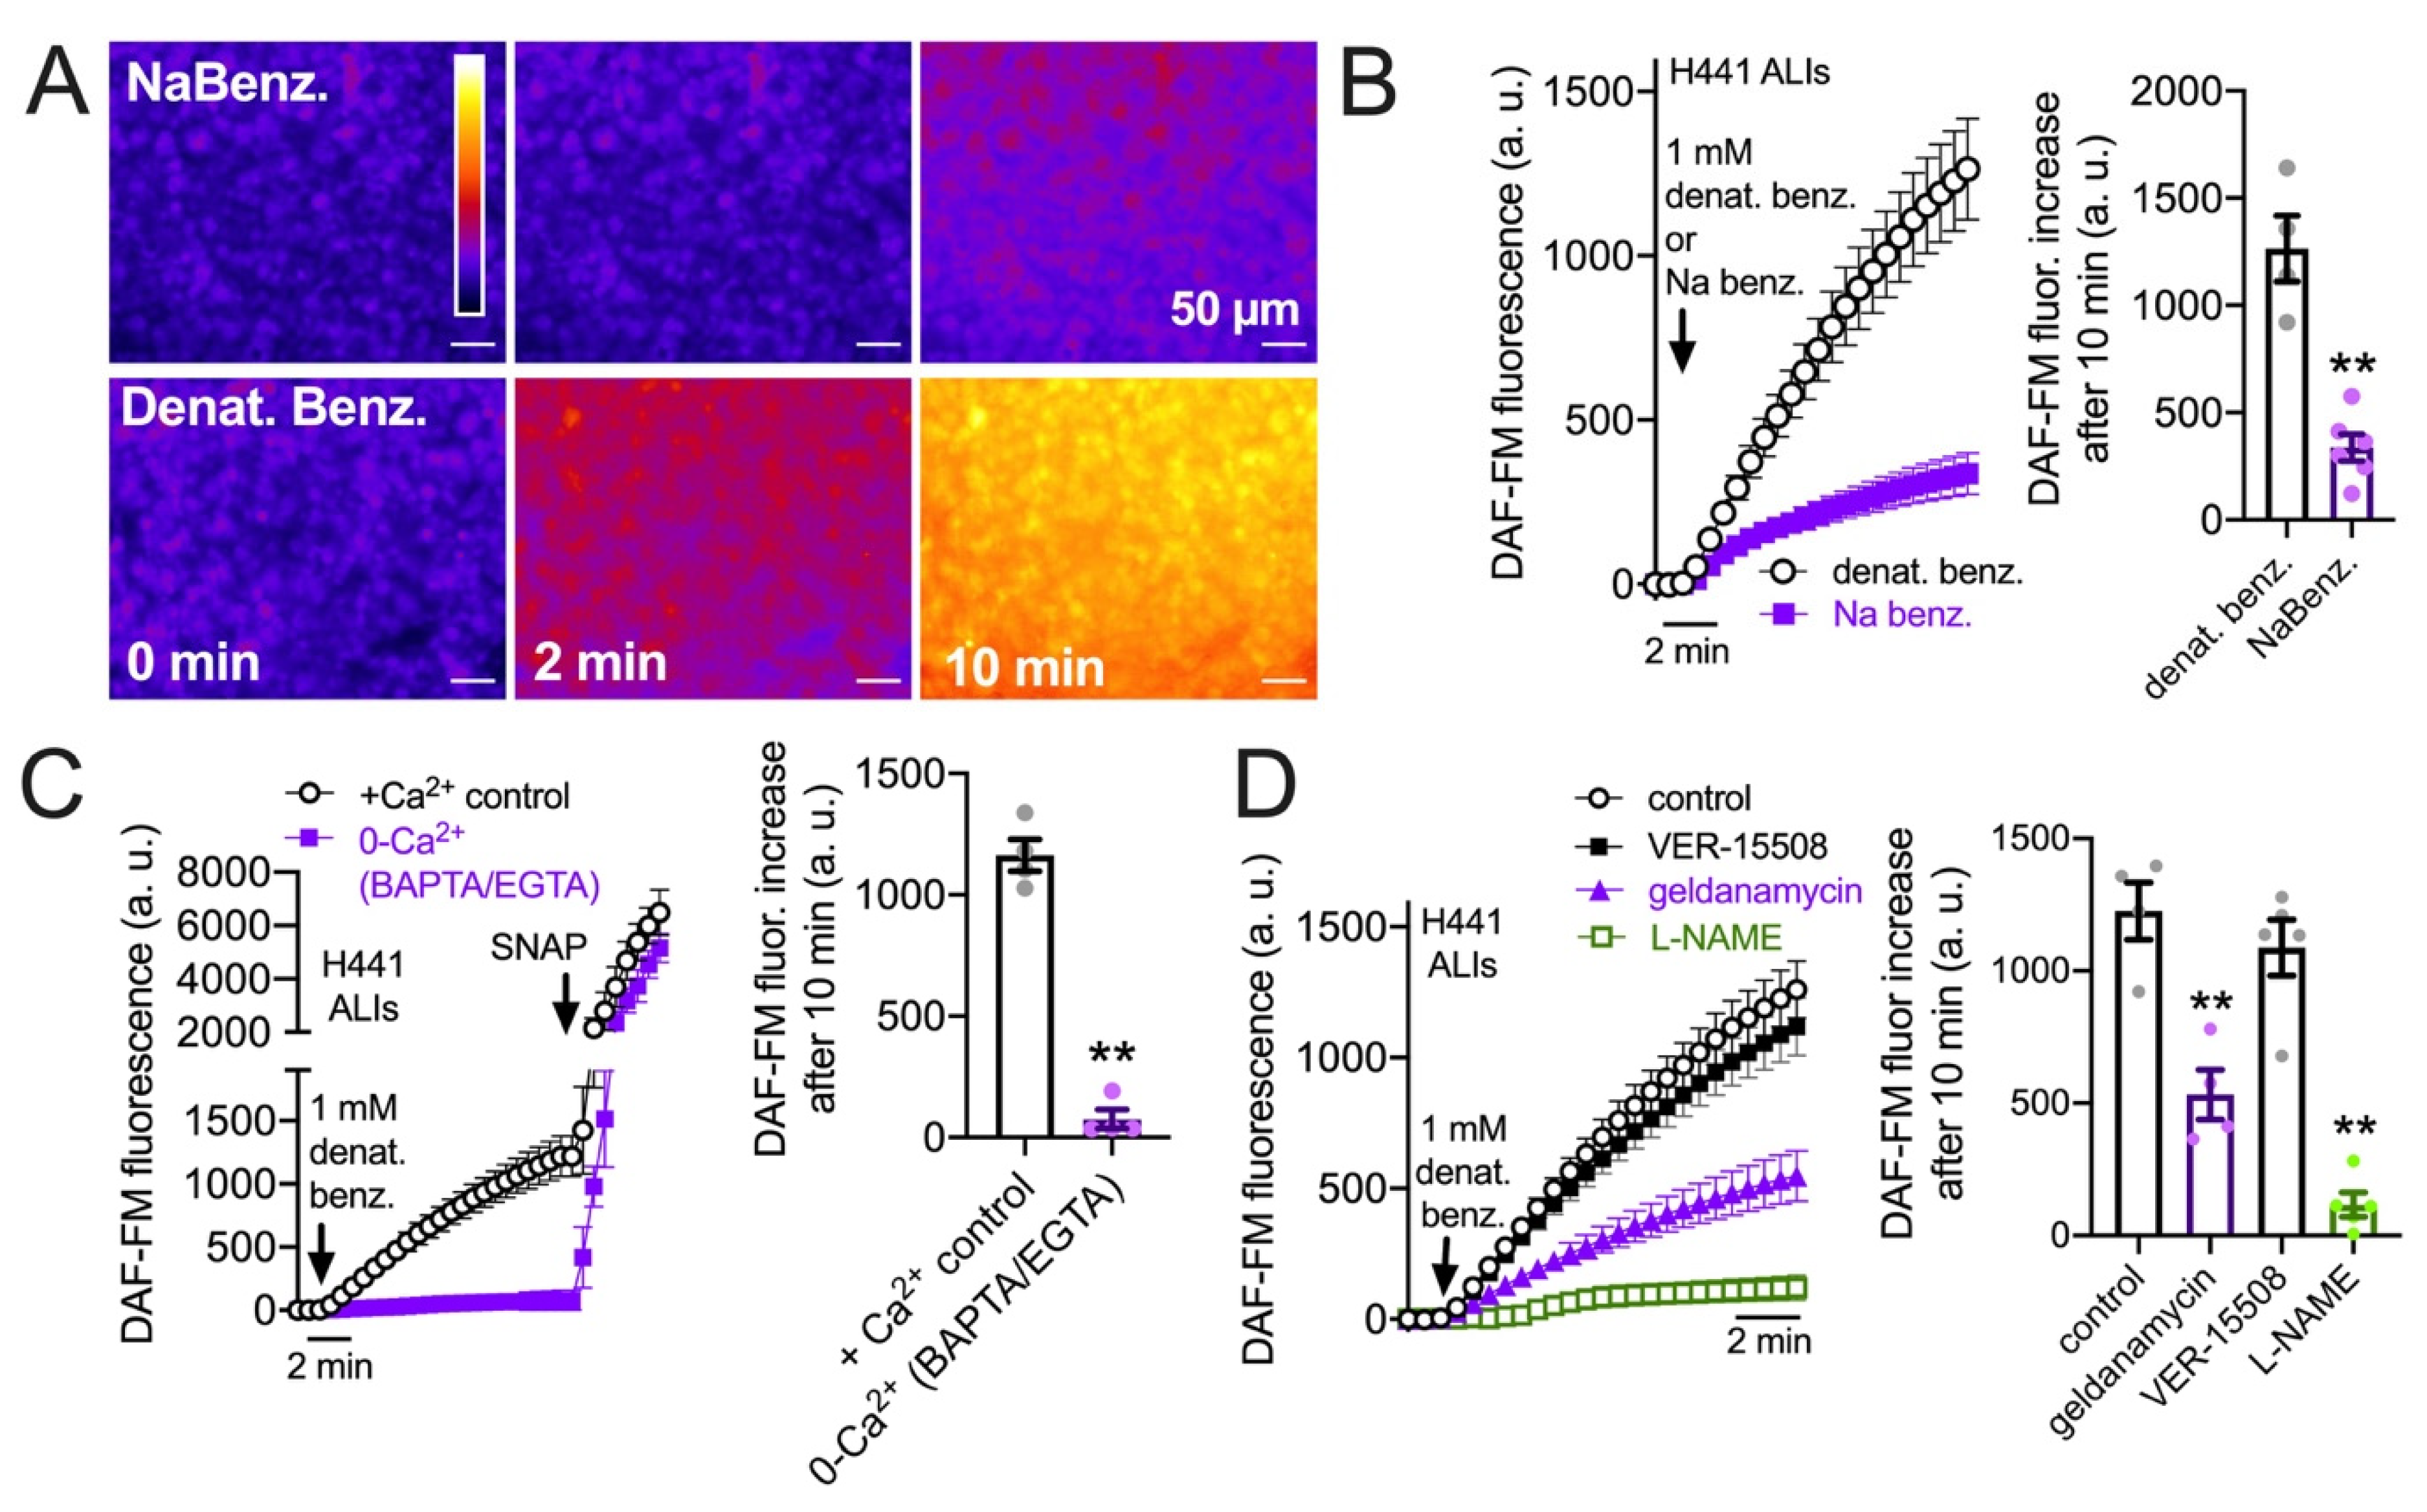
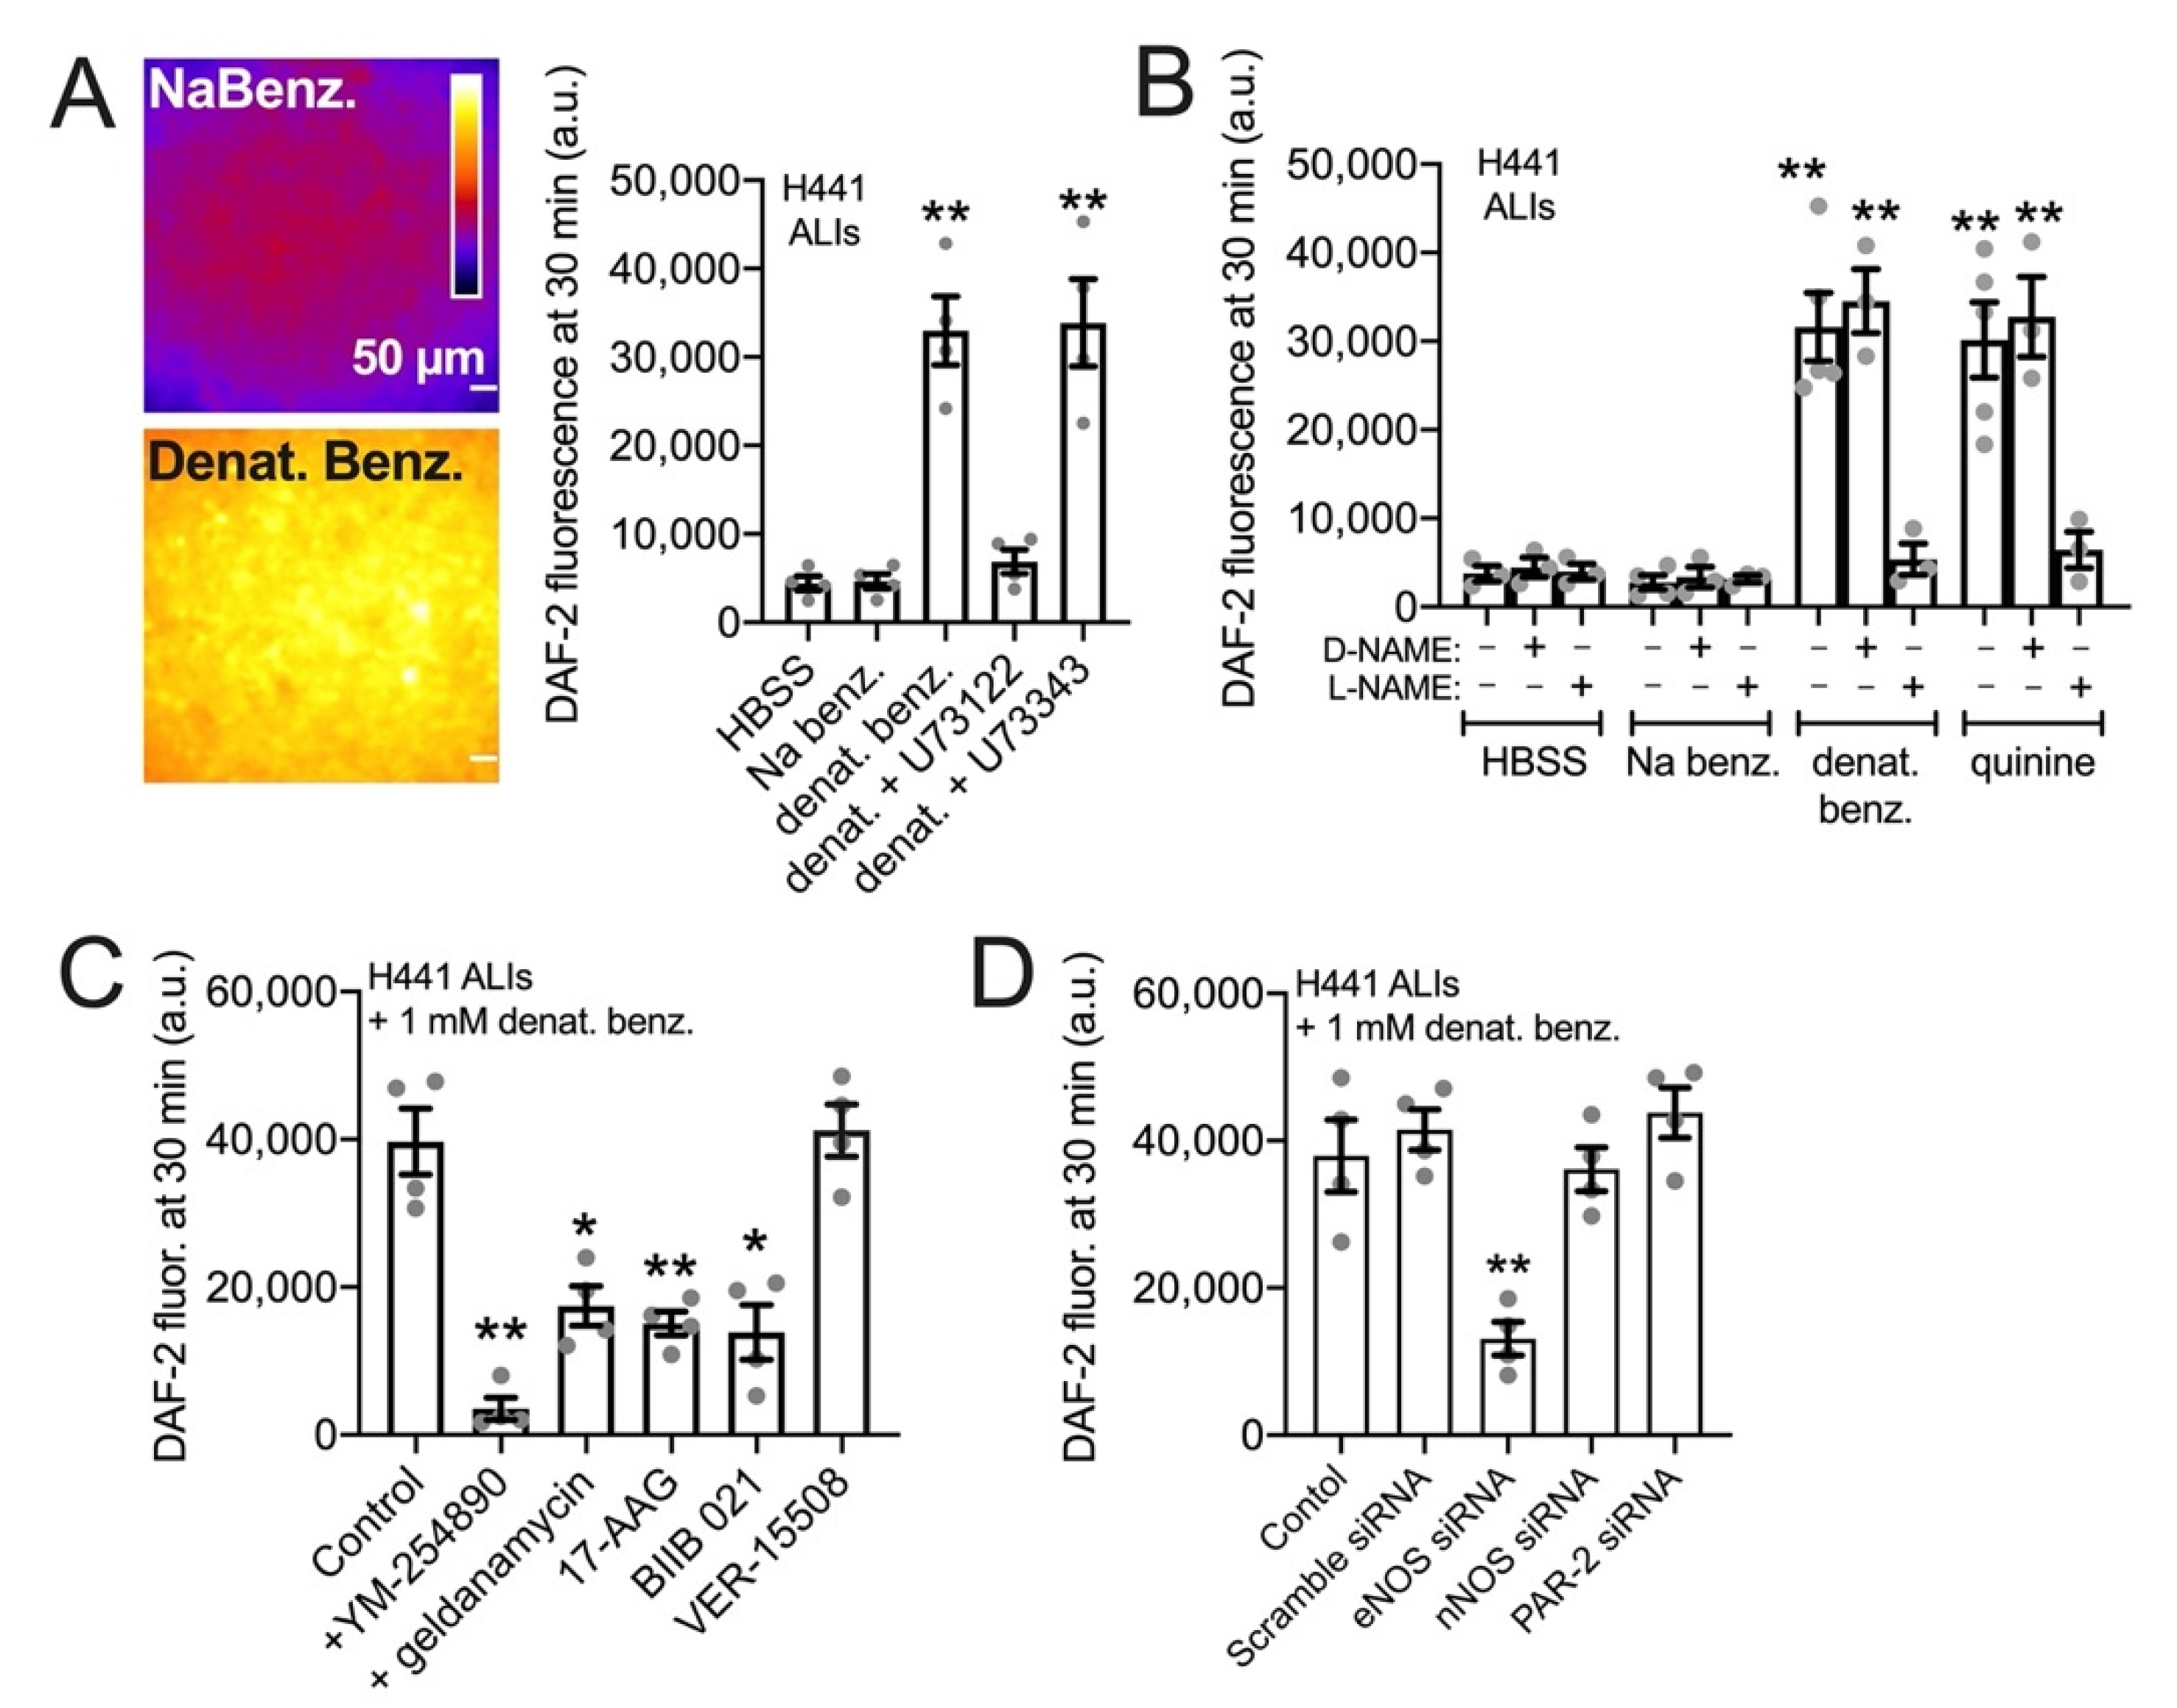
3.3. HSP90 Inhibition Reduces Endogenous T2R-Stimulated eNOS Function in H441 Monolayers Cultured at the Air–Liquid Interface

While T2R/Ca2+-activated NO generation data support a role for HSP90 in submerged cells, submerged cells do not accurately reflect the polarized airway epithelium. We thus also grew H441 cell monolayers at the air–liquid interface (ALI), a more physiological cell culture model for airway epithelial cells than submersion. H441 ALIs have been used to study ion transport and barrier function [84,85,86,87,88]. Denatonium benzoate, but not sodium benzoate, activated NO production in H441 ALIs, measured by intracellular DAF-FM fluorescence (Figure 1A,B). While sodium benzoate does activate some T2Rs, it activates a subset (T2R14 and T2R16) distinct from denatonium benzoate with much lower affinity [81]. Thus, we use sodium benzoate as a control here for osmotic effects and potential pH effects due to permeation of the benzoate moiety. Denatonium-induced DAF-FM fluorescence increases were completely blocked by Ca2+ chelation by intracellular BAPTA-loading (45 min, 10 µM) plus 0-Ca2+ extracellular buffer (containing 2 mM EGTA to chelate trace calcium; Figure 1C). This suggests a requirement for Ca2+ signaling. Like submerged cells, the DAF-FM response was also reduced by 45 min pretreatment with HSP90 inhibitor geldanamycin (10 µM) or NOS inhibitor L-NAME (10 µM) but not HSP70 inhibitor VER-155008 (10 µM; Figure 1D). Thus, HSP90 inhibition reduces T2R-mediated NO production in H441 ALIs.
NO is a highly diffusive gas that can rapidly diffuse across cell membranes [89]. When a small volume (100 uL) of cell impermeant NO indicator DAF-2 (10 µM) was placed on top of the H441 ALIs in the presence of denatonium benzoate or sodium benzoate for 30 min, we observed a 3-fold higher fluorescence of apical DAF-2 in denatonium-treated cultures (Figure 2A). This suggests that NO produced can diffuse into the airway surface liquid, as previously show in primary sinonasal ALIs [34]. The denatonium-induced DAF-2 fluorescence increase was reduced by PLC inhibitor U73122 but not inactive U73343 (Figure 2A), suggesting that it depended on GPCR signaling. We found that T2R agonists denatonium benzoate and quinine, but not sodium benzoate, both increased apical DAF-2 fluorescence in a NOS-dependent manner, as responses were inhibited by L-NAME but not D-NAME (Figure 2B). These DAF-2 responses, likely reflecting NO diffusion into the ASL, were blocked by pretreatment (10 µM, 45 min) with GPCR G protein inhibitor YM-254890 [90,91,92] or HSP90 inhibitors geldanamycin, 17-AAG, or BIIB 021 (Figure 2C) but were not blocked by HSP70 inhibitor VER-15508. Like submerged H441s, we saw inhibition with eNOS siRNA but not with scramble, nNOS, or PAR-2 siRNA (Figure 2D).

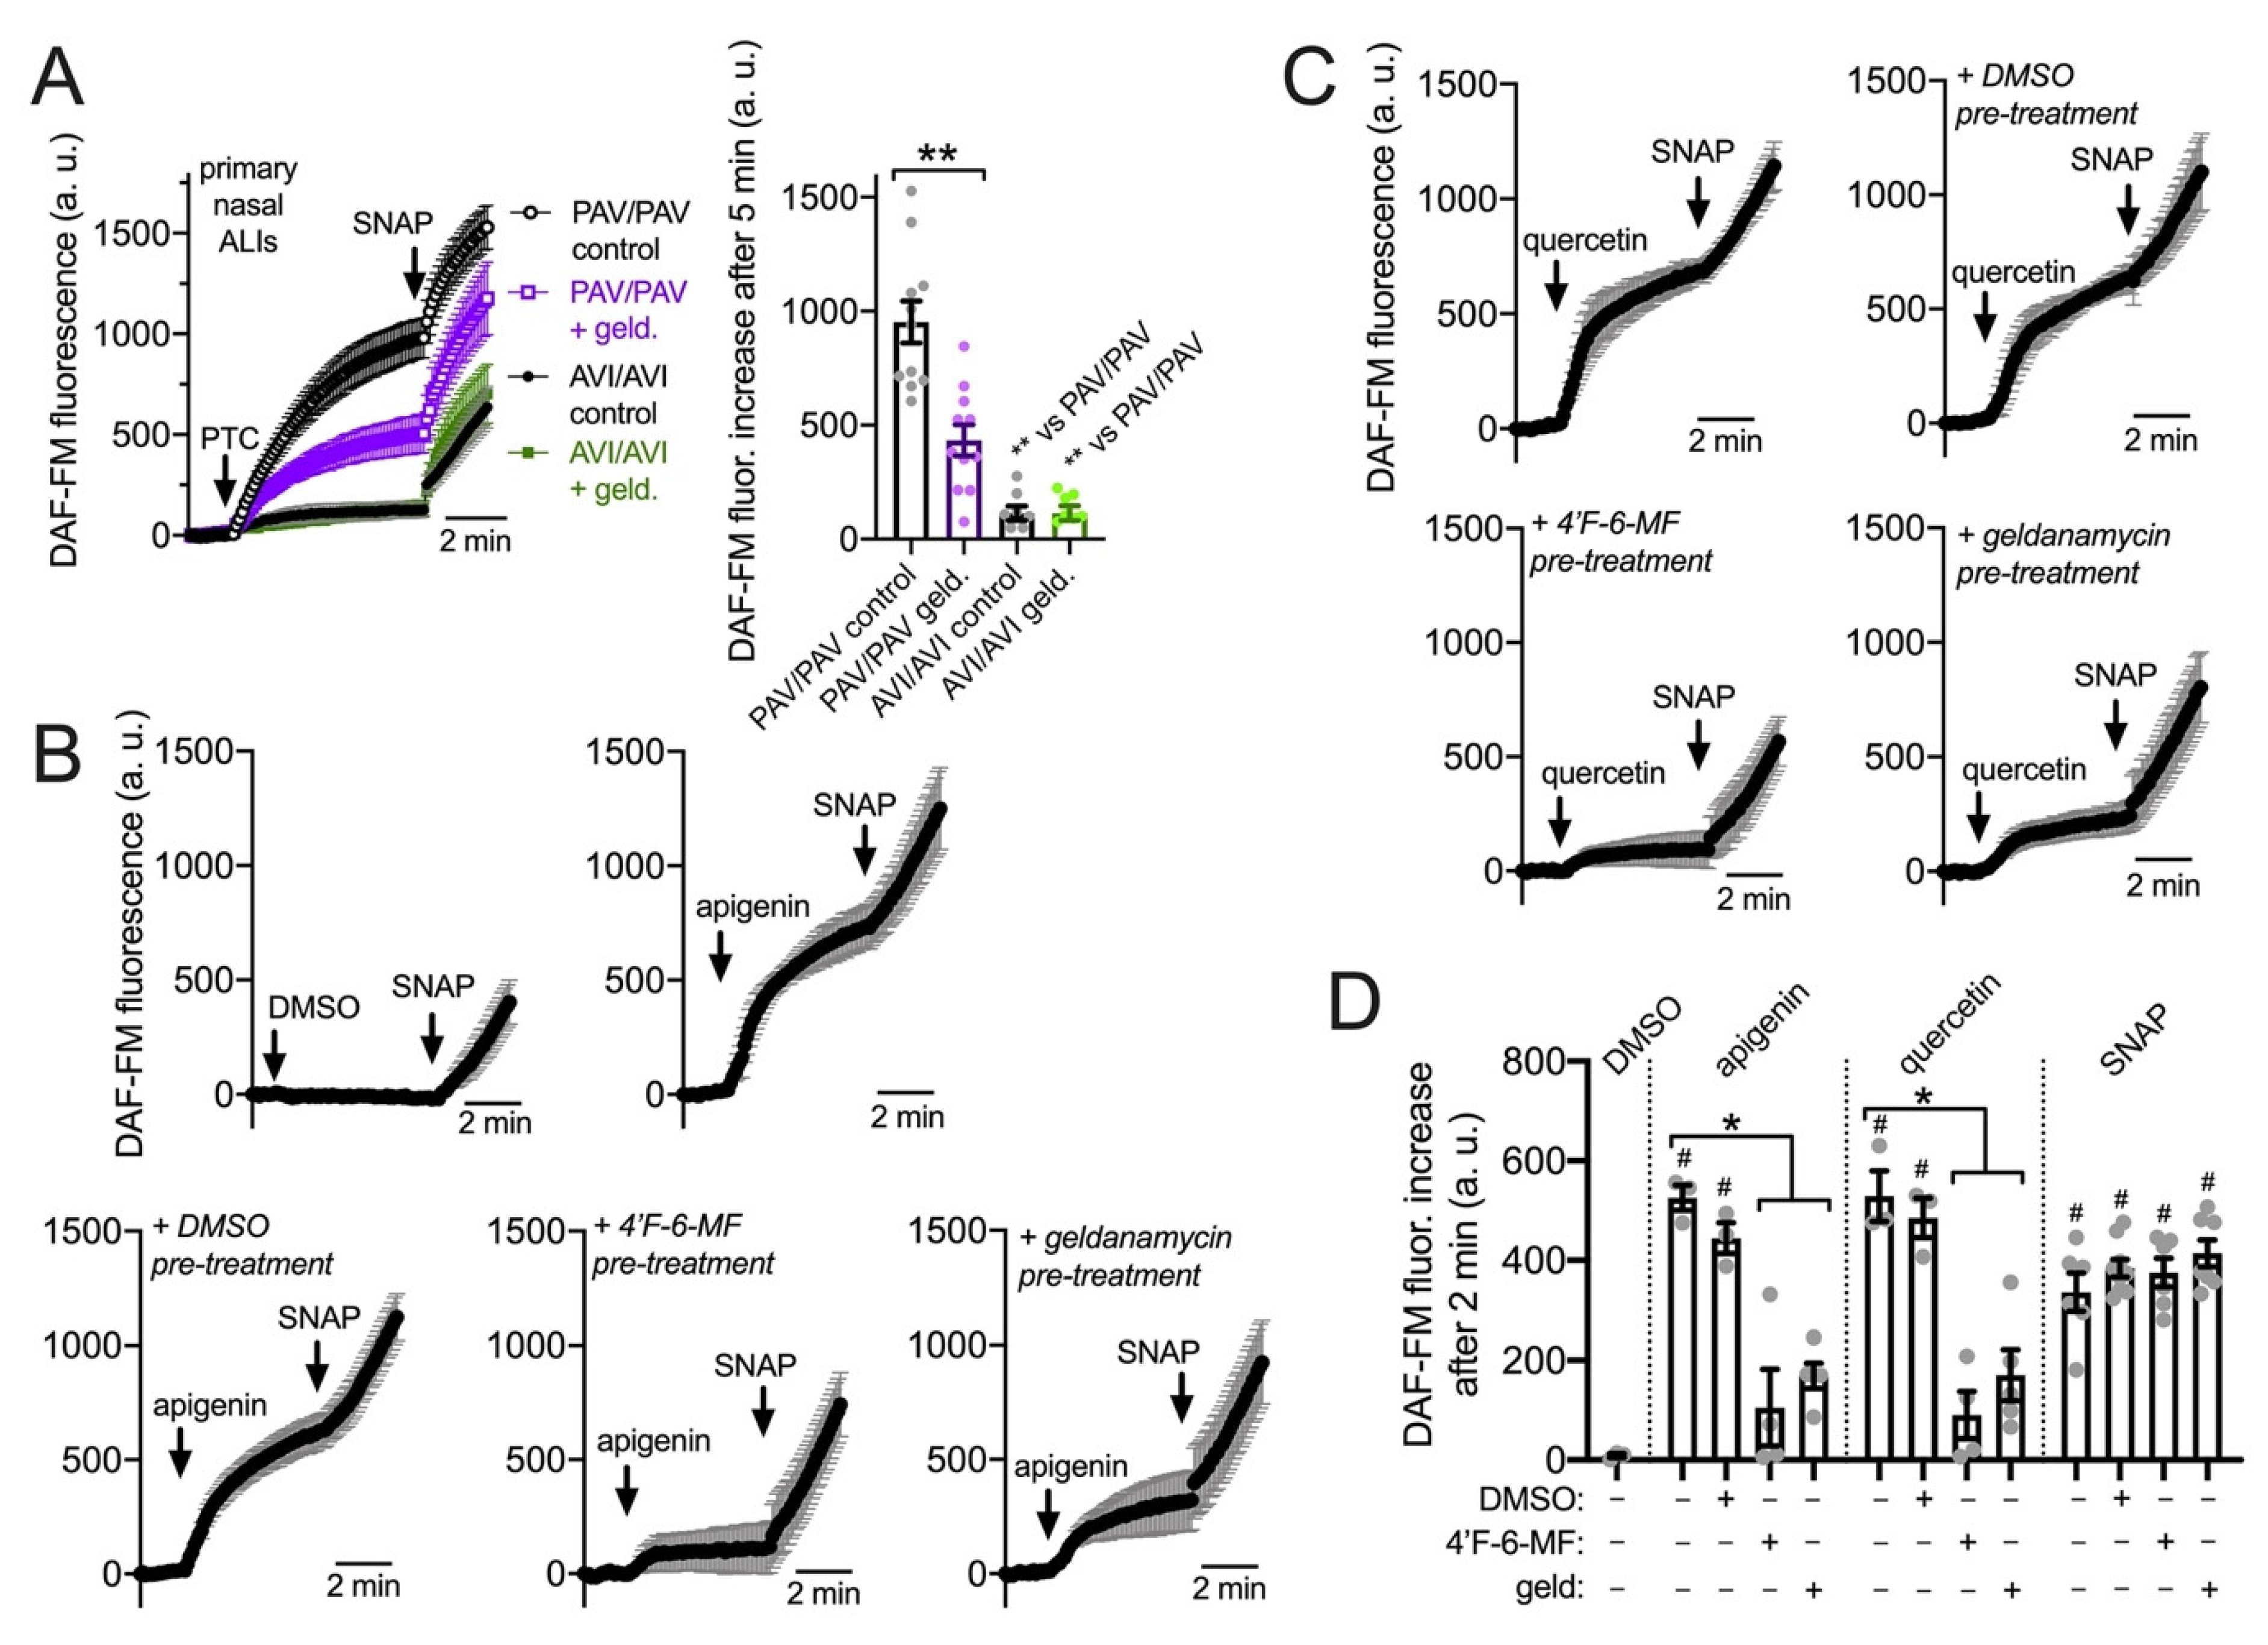
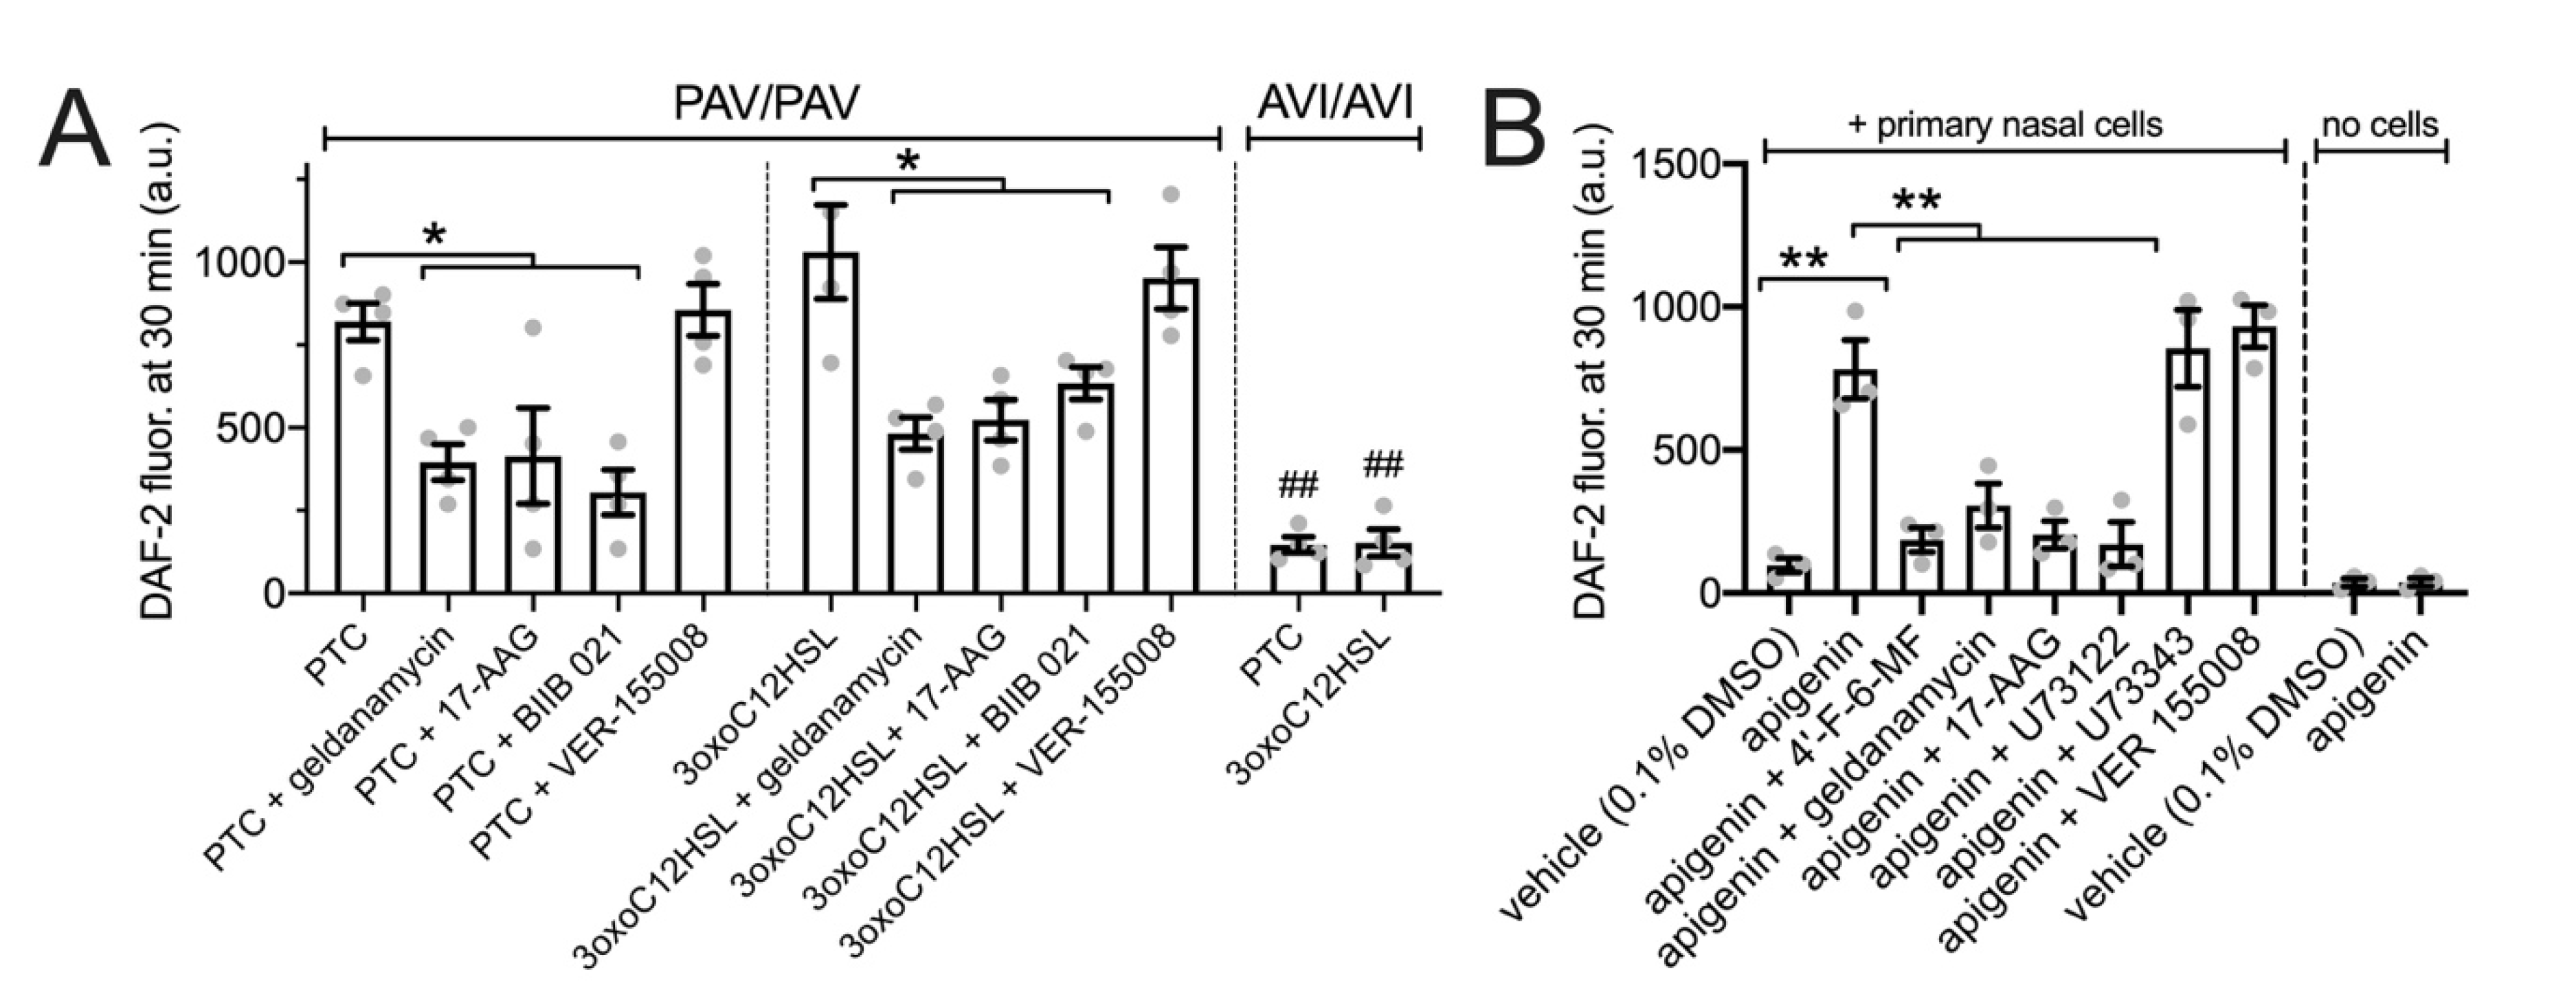
3.4. HSP90 Inhibition Reduces T2R-Driven NO Production in Primary Nasal Epithelial Air–Liquid Interface Cultures

We examined NO production using DAF-FM in primary sinonasal cells grown from residual surgical material and differentiated at ALI as described [22]. These cells express T2R receptors in apical motile cilia (Figure 3 and [22]). Note that, unlike H441 assays, denatonium benzoate was not used in primary nasal cell assays. While primary bronchial ciliated cells respond to denatonium benzoate [4], nasal ciliated cells do not [34], likely due to differential T2R isoform expression between bronchial and nasal cells. For primary nasal cells, we instead used the T2R38-specific agonist phenylthiocarbamide (PTC) [60,61]. We took advantage of primary ALIs genotyped for functional (PAV) or non-functional (AVI) polymorphisms in TAS2R38 encoding the T2R38 receptor [34,61,93]; the AVI/AVI TAS2R38 cultures are de facto human T2R38 knock outs. Homozygous PAV/PAV TAS2R38 cells produced NO in response to 1 mM PTC while AVI/AVI cells did not (Figure 4A). The NO produced during PTC stimulation was inhibited by geldanamycin (10 µM, 45 min pretreatment; Figure 4A).
Apigenin, a T2R14 and 39 agonist [22,94], stimulates NO production and ciliary beat frequency increases in primary nasal ALIs via T2R14 [22]. Apigenin (100 µM) stimulation increased DAF-FM fluorescence in primary nasal ALIs that was reduced by pretreatment with T2R14/39 antagonist 4′-fluoro-6-methoxyflavanone (50 µM; 45 min [22]) as well as HSP90 inhibitor geldanamycin (10 µM 45 min; Figure 4B). We also tested quercetin, another plant flavonoid shown to be a T2R14 agonist in heterologous expression assays [95]. While quercetin was previously shown to increase (CBF) [96] and reduce cAMP signaling [97], a mechanism for these effects was not elucidated. As T2Rs also decrease cAMP through inhibitory G protein signaling in airway cells [98], we hypothesized that quercetin may act as a T2R agonist in airway epithelial cells. Quercetin (50 µM) stimulation likewise increased DAF-FM fluorescence that was blocked by 4′-fluoro-6-methoxyflavanone or geldanamycin (Figure 4C). Apigenin and quercetin-stimulated DAF-FM fluorescence responses are summarized in Figure 4D.
We also performed similar assays as performed with H441s in Figure 5 to measure NO diffusion into the ASL using 30 µL of DAF-2 solution overlaid onto the primary nasal ALIs. Both PTC (1 mM) and P. aeruginosa quorum-sensing molecule 3oxoC12HSL (100 µM) increased apical surface DAF-2 fluorescence in a manner that was T2R38 dependent as it occurred in PAV/PAV (functional T2R38 homozygous) cultures but not AVI/AVI (non-functional T2R38 homozygous) cultures (Figure 5A). PTC- and 3oxoC12HSL-induced increases in DAF-2 fluorescence were inhibited by geldanamycin, 17-AAG, or BIIB 021 but not VER-15008 (all 10 µM for 45 min pretreatment; Figure 5A). Apigenin (100 µM) increased apical DAF-2 fluorescence in a manner that was inhibited by T2R14 antagonist 4′-fluoro-6-methoxyflavanone [99] (50 µM for 45 min pretreatment; Figure 5B) or PLC inhibitor U73122 (10 µM for 45 min pretreatment; Figure 5B). Apigenin-stimulated DAF-2 increases were also reduced by HSP90 inhibitors geldanamycin or 17-AAG but not by HSP70 inhibitor VER 155008 (all 10 µM for 45 min pretreatment) (Figure 5B). Phospholipase C (PLC) inhibitor U73122 (10 µM for 45 min pretreatment) also inhibited the apigenin response while inactive analogue U74434 had no effect. As a control, when apigenin or vehicle was incubated in DAF-2 solution in the absence of cells (just plastic Transwells), no differences in DAF-2 fluorescence were observed (Figure 5B).

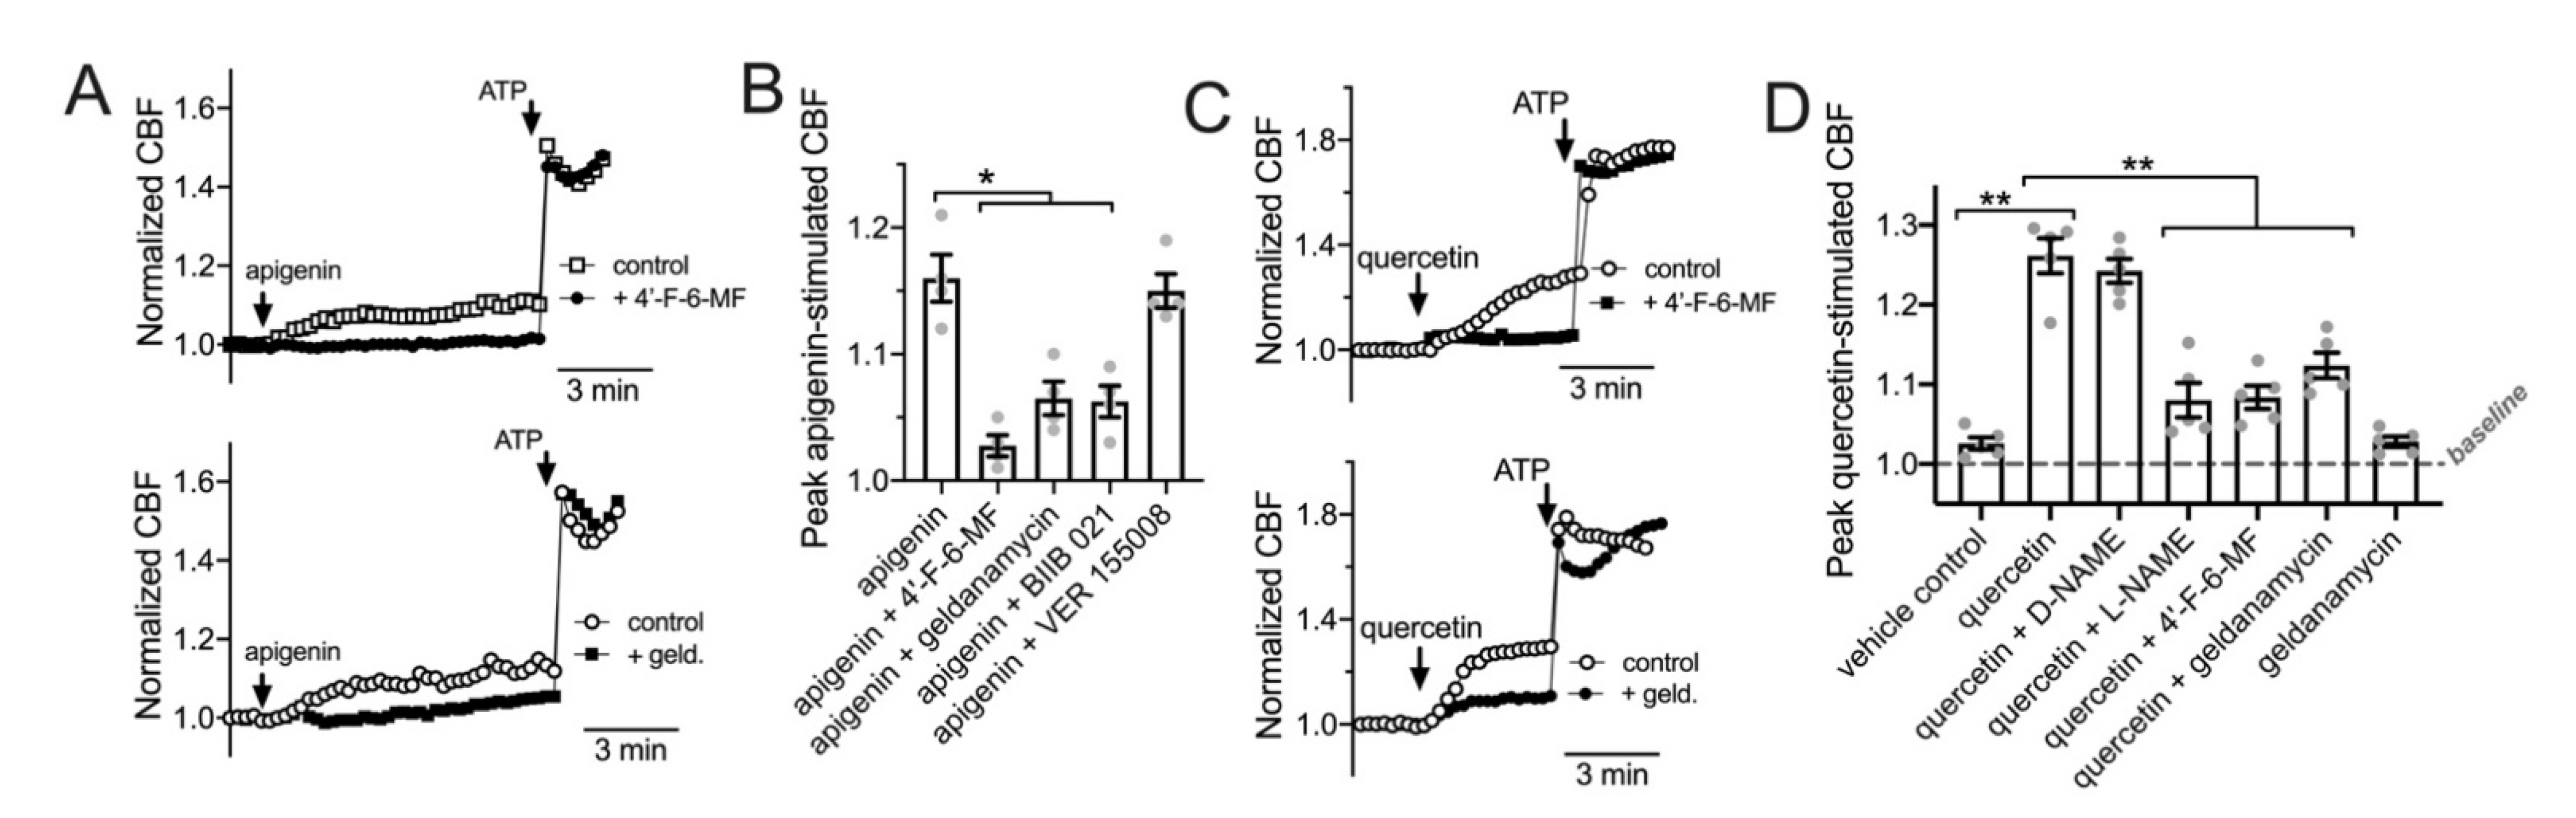
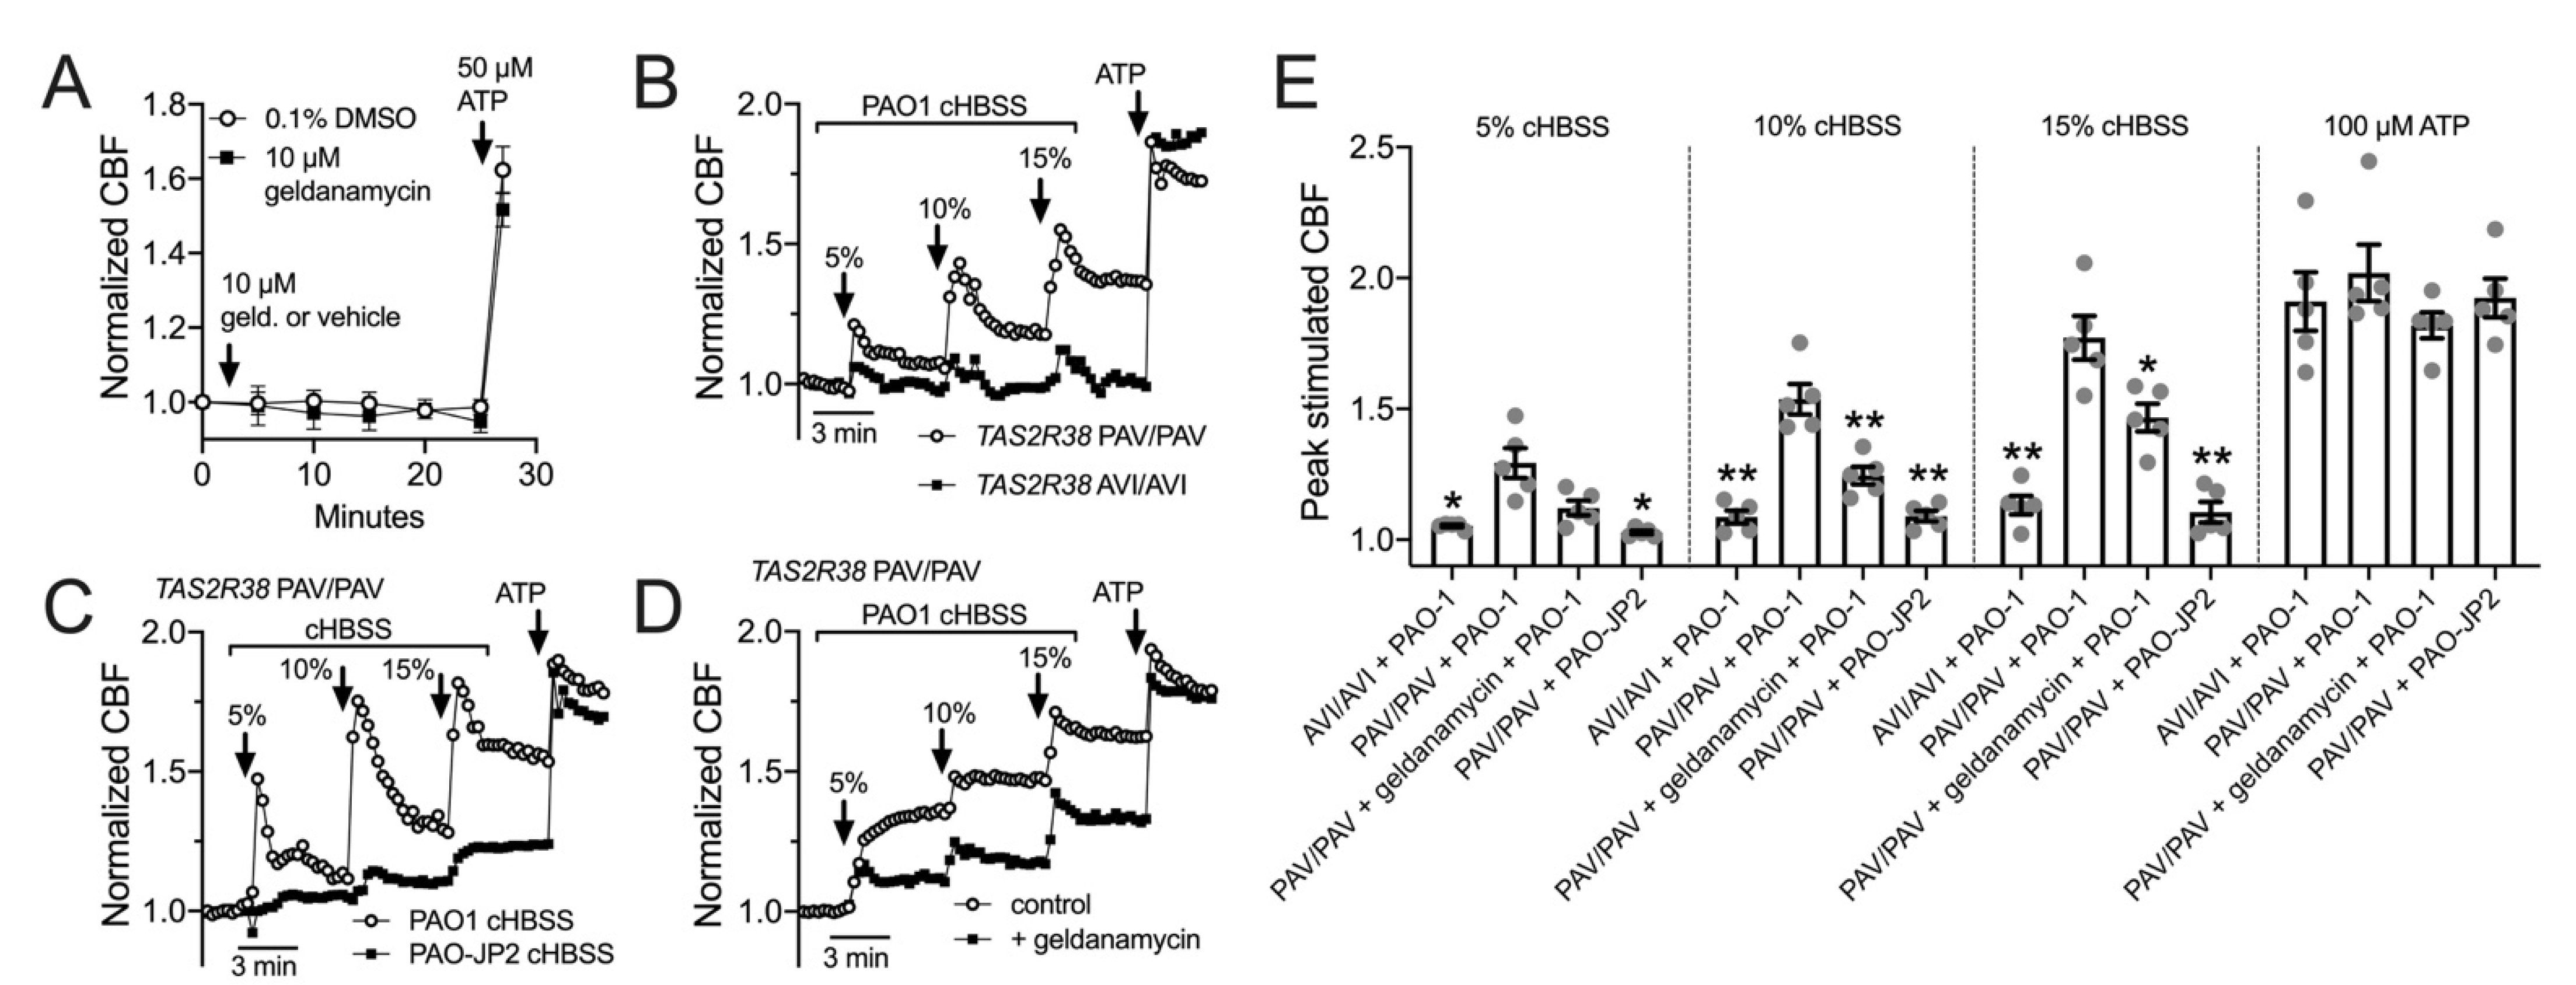
3.5. HSP90 Inhibition Reduces T2R/NO-Driven Nasal Ciliary Beating

Data in Figure 4 and Figure 5 suggest that HSP90 function is required for NO production during T2R38 or T2R14 activation in primary nasal epithelial cells. We tested if this affected ciliary beat frequency (CBF) using the T2R14 agonist apigenin. As previously described [5,22], apigenin increased ciliary beat frequency ~10–15% over 10 min. This was blocked by T2R14 antagonist 4′-fluoro-6-methoxyfavanone or HSP90 inhibitors geldanamycin or BIIB 021 (10 min pretreatment, 10 µM) but not by HSP70 inhibitor VER 1555008 (Figure 6A,B). Thus, HSP90 inhibitors reduced apigenin-stimulated T2R14 CBF responses. We also observed a ~30% increase in CBF with apical application of 25 µM quercetin (Figure 6C) that was reduced by the T2R14 inhibitor 4′-fluoro-6-methoxyflavanone [99] or geldanamycin. There was no inhibition of CBF increases in response to purinergic agonist ATP (50 µM; Figure 6A,C). Quercetin-stimulated increases in CBF were also inhibited by blocking NO signaling with L-NAME (10 µM; Figure 6D). These data suggest that quercetin activation of CBF may occur through T2R activation and NO production.
Importantly, we observed that geldanamycin has no significant effect on baseline CBF after ≥20 min (Figure 7A). This is in contrast to prior studies in mouse tracheal cells, where geldanamycin rapidly reduced CBF to ~75% of basal values, postulated to be due to reduced stability of tubulin polymerization upon HSP90 inhibition [55]. We did not see these effects here in human nasal cultures.
We also tested CBF response to HBSS that had been conditioned by overnight exposure to P. aeruginosa. We previously performed similar experiments with conditioned LB medium and showed that CBF increases in response to dilute (6.25–12%) P. aeruginosa medium was dependent on bitter receptor T2R38, which is expressed in cilia and detects acylhomoserine lactone (AHL) quorum sensing molecules [34]. Here, P. aeruginosa Wt strain PAO-1 was incubated in HBSS for 24 h, and the resulting conditioned HBSS (cHBSS) was diluted and used to stimulated cells. We found that 5–15% cHBSS stimulated robust ciliary responses in nasal ALIs homozygous for the functional polymorphism (PAV) of the TAS2R38 gene encoding the T2R38 receptor (Figure 7B). Cells homozygous for the non-functional (AVI) polymorphism of TAS2R38 responded with much lower CBF increases (Figure 7B), showing the responses were dependent on T2R38. With cHBSS from strain PAO-JP2, which is unable to produce AHLs [65,66,100], we observed minimal CBF responses in PAV/PAV cells compared with PAO-1 Wt cHBSS (Figure 7C), showing the response were dependent on AHL signaling. Notably, AHL signaling also control production of quinolone quorum sensing molecules [101], which can also function as T2R agonists [5,22]. Fitting with a role for HSP90 in T2R function, we observed that geldanamycin reduced the CBF response to PAO-1 cHBSS in PAV/PAV cells (Figure 7D). These data are summarized in Figure 7E and together suggest that geldanamycin can reduce the ability of nasal ALIs to detect P. aeruginosa through T2Rs and increase ciliary beating.

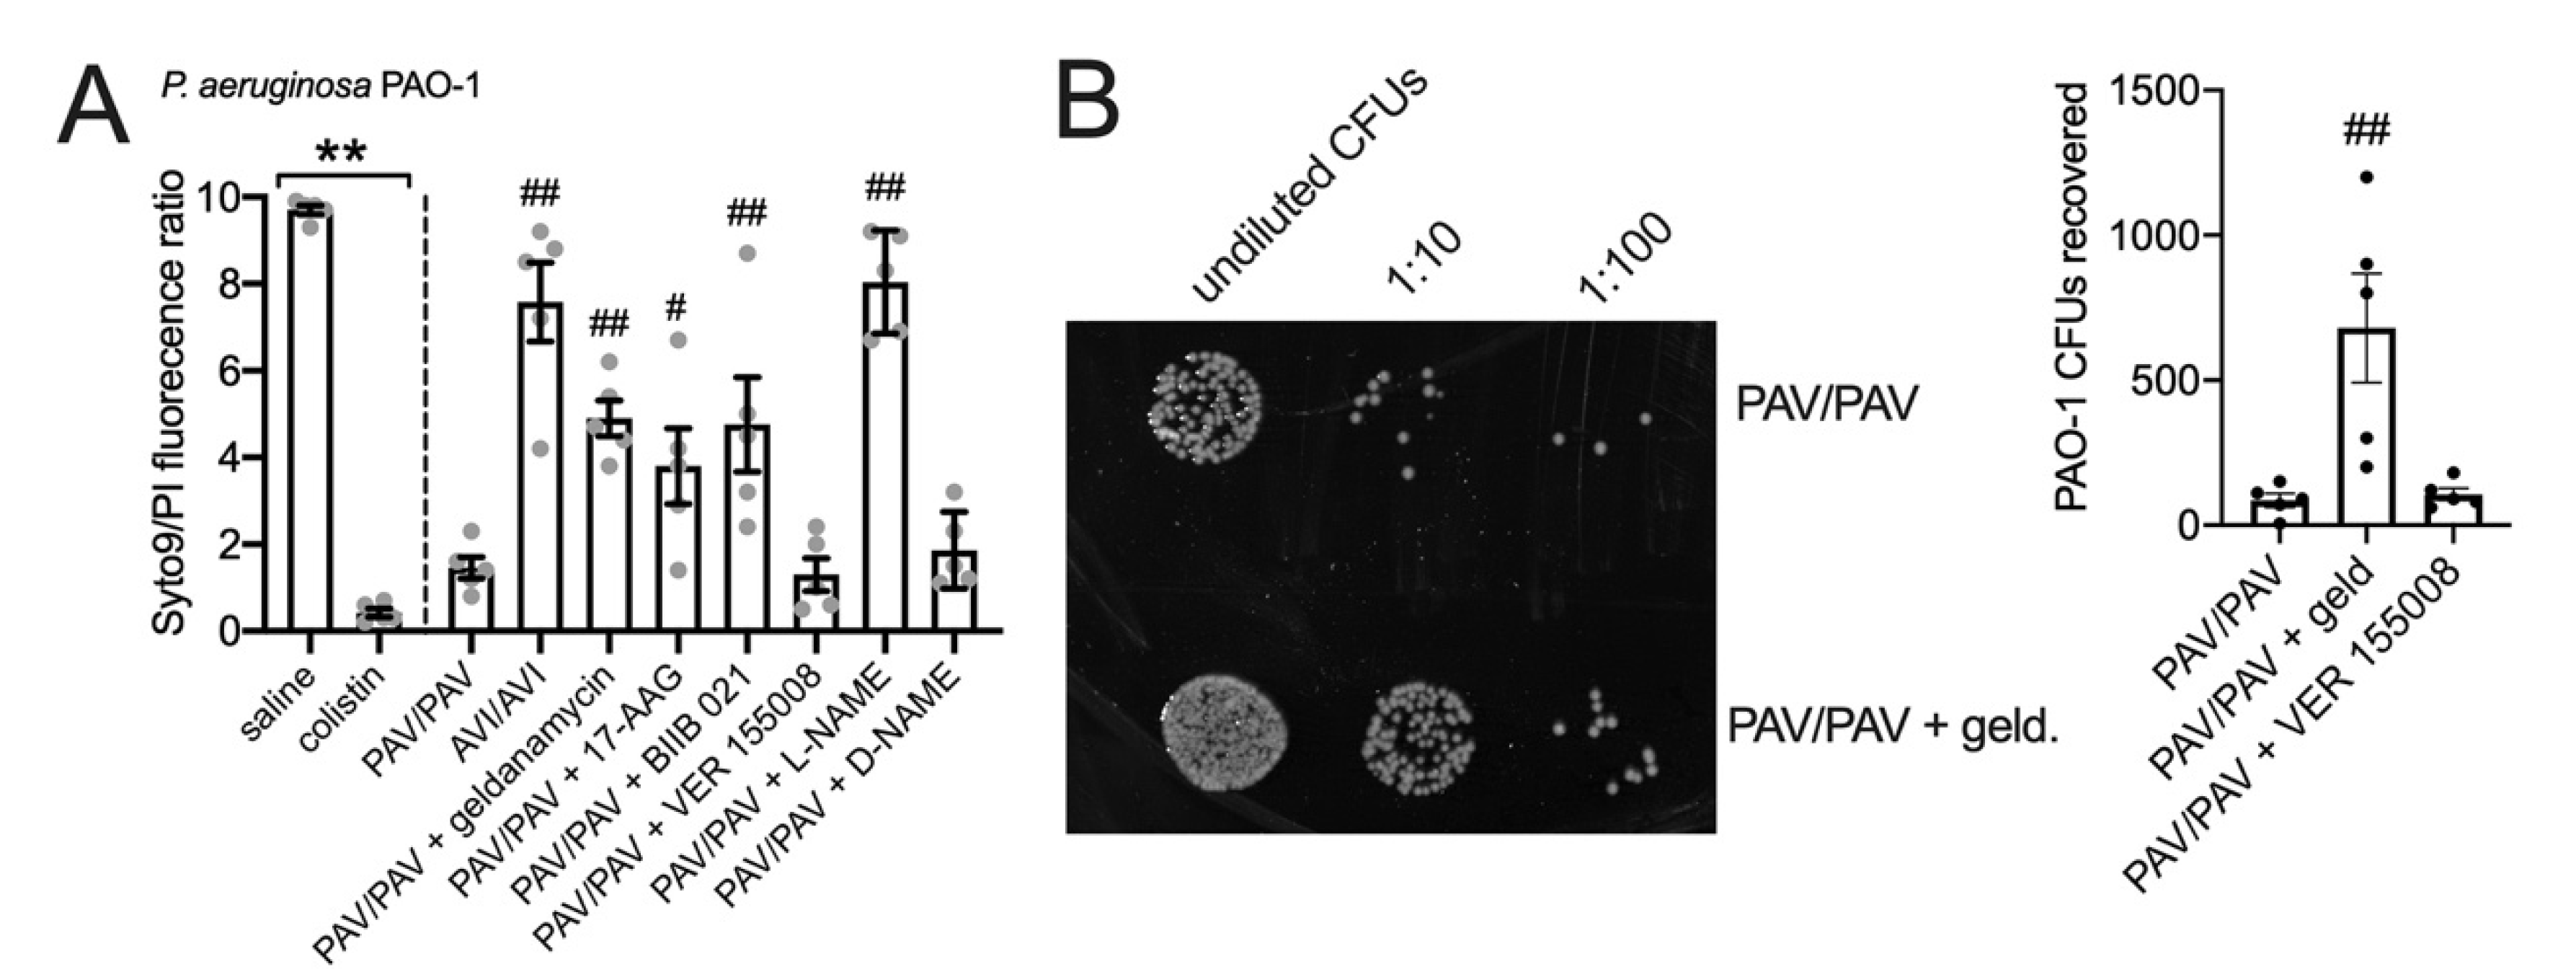
3.6. HSP90 Inhibition Reduces T2R/NO-Driven Bacterial Killing

We used an antibacterial killing assay to test the T2R/NO-dependent bacterial killing of nasal ALI cultures [34]. Two-hour incubation of P. aeruginosa strain PAO1 with nasal ALIs results in bacterial killing that is dependent on T2R38 genotype, as PAV/PAV (functional T2R38) cultures kill bacteria while AVI/AVI (non-functional T2R38) do not (Figure 8A). This occurs because acyl-homoserine lactones (AHLs) in the medium activate T2R38, causing NO production that is bactericidal [34]. Bacterial viability was quantified by a live/dead (Syto9/propidium iodide) stain (Figure 8A) and verified by CFU counting (Figure 8B). NOS inhibitor L-NAME but not inactive D-NAME inhibited bacterial killing (Figure 8A). HSP90 inhibitors geldanamycin, 17-AAG, or BIIB 021 all reduced bacterial killing (Figure 8A,B) while HSP70 inhibitor VER155008 had no effect. These data suggest that HSP90 inhibition reduces airway innate immunity by reducing both bacterial clearance (driven by ciliary beating) and by lowering bactericidal NO production.

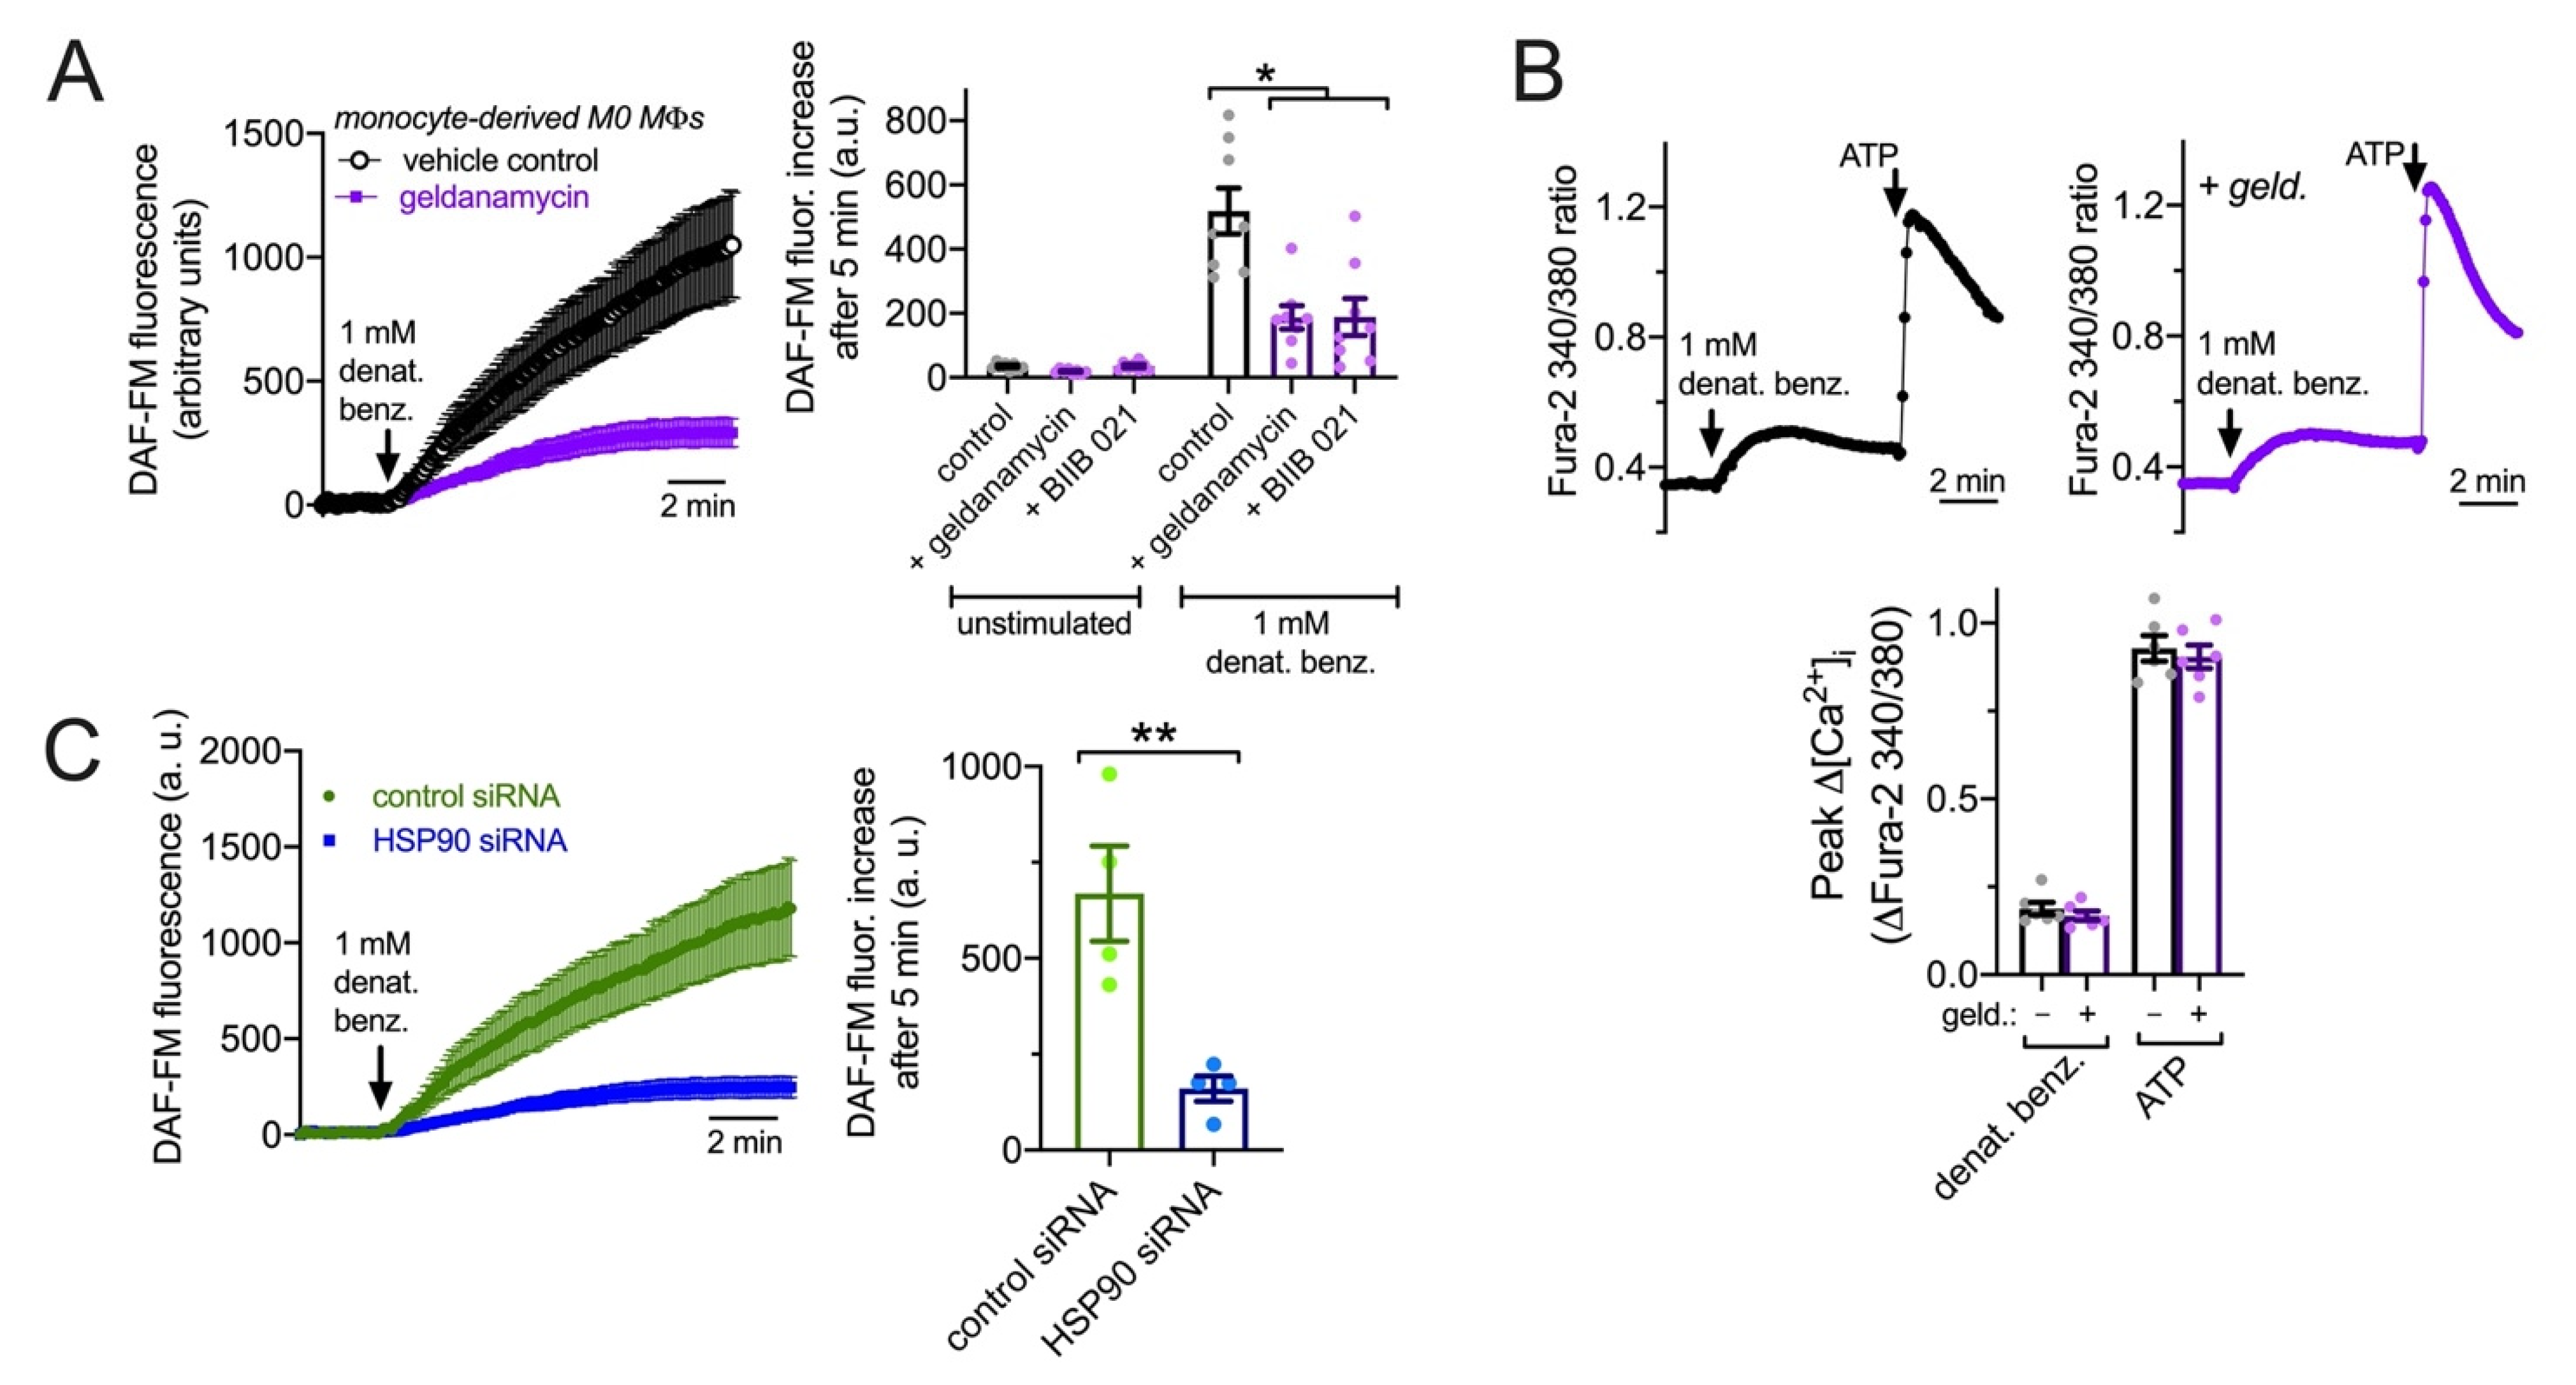
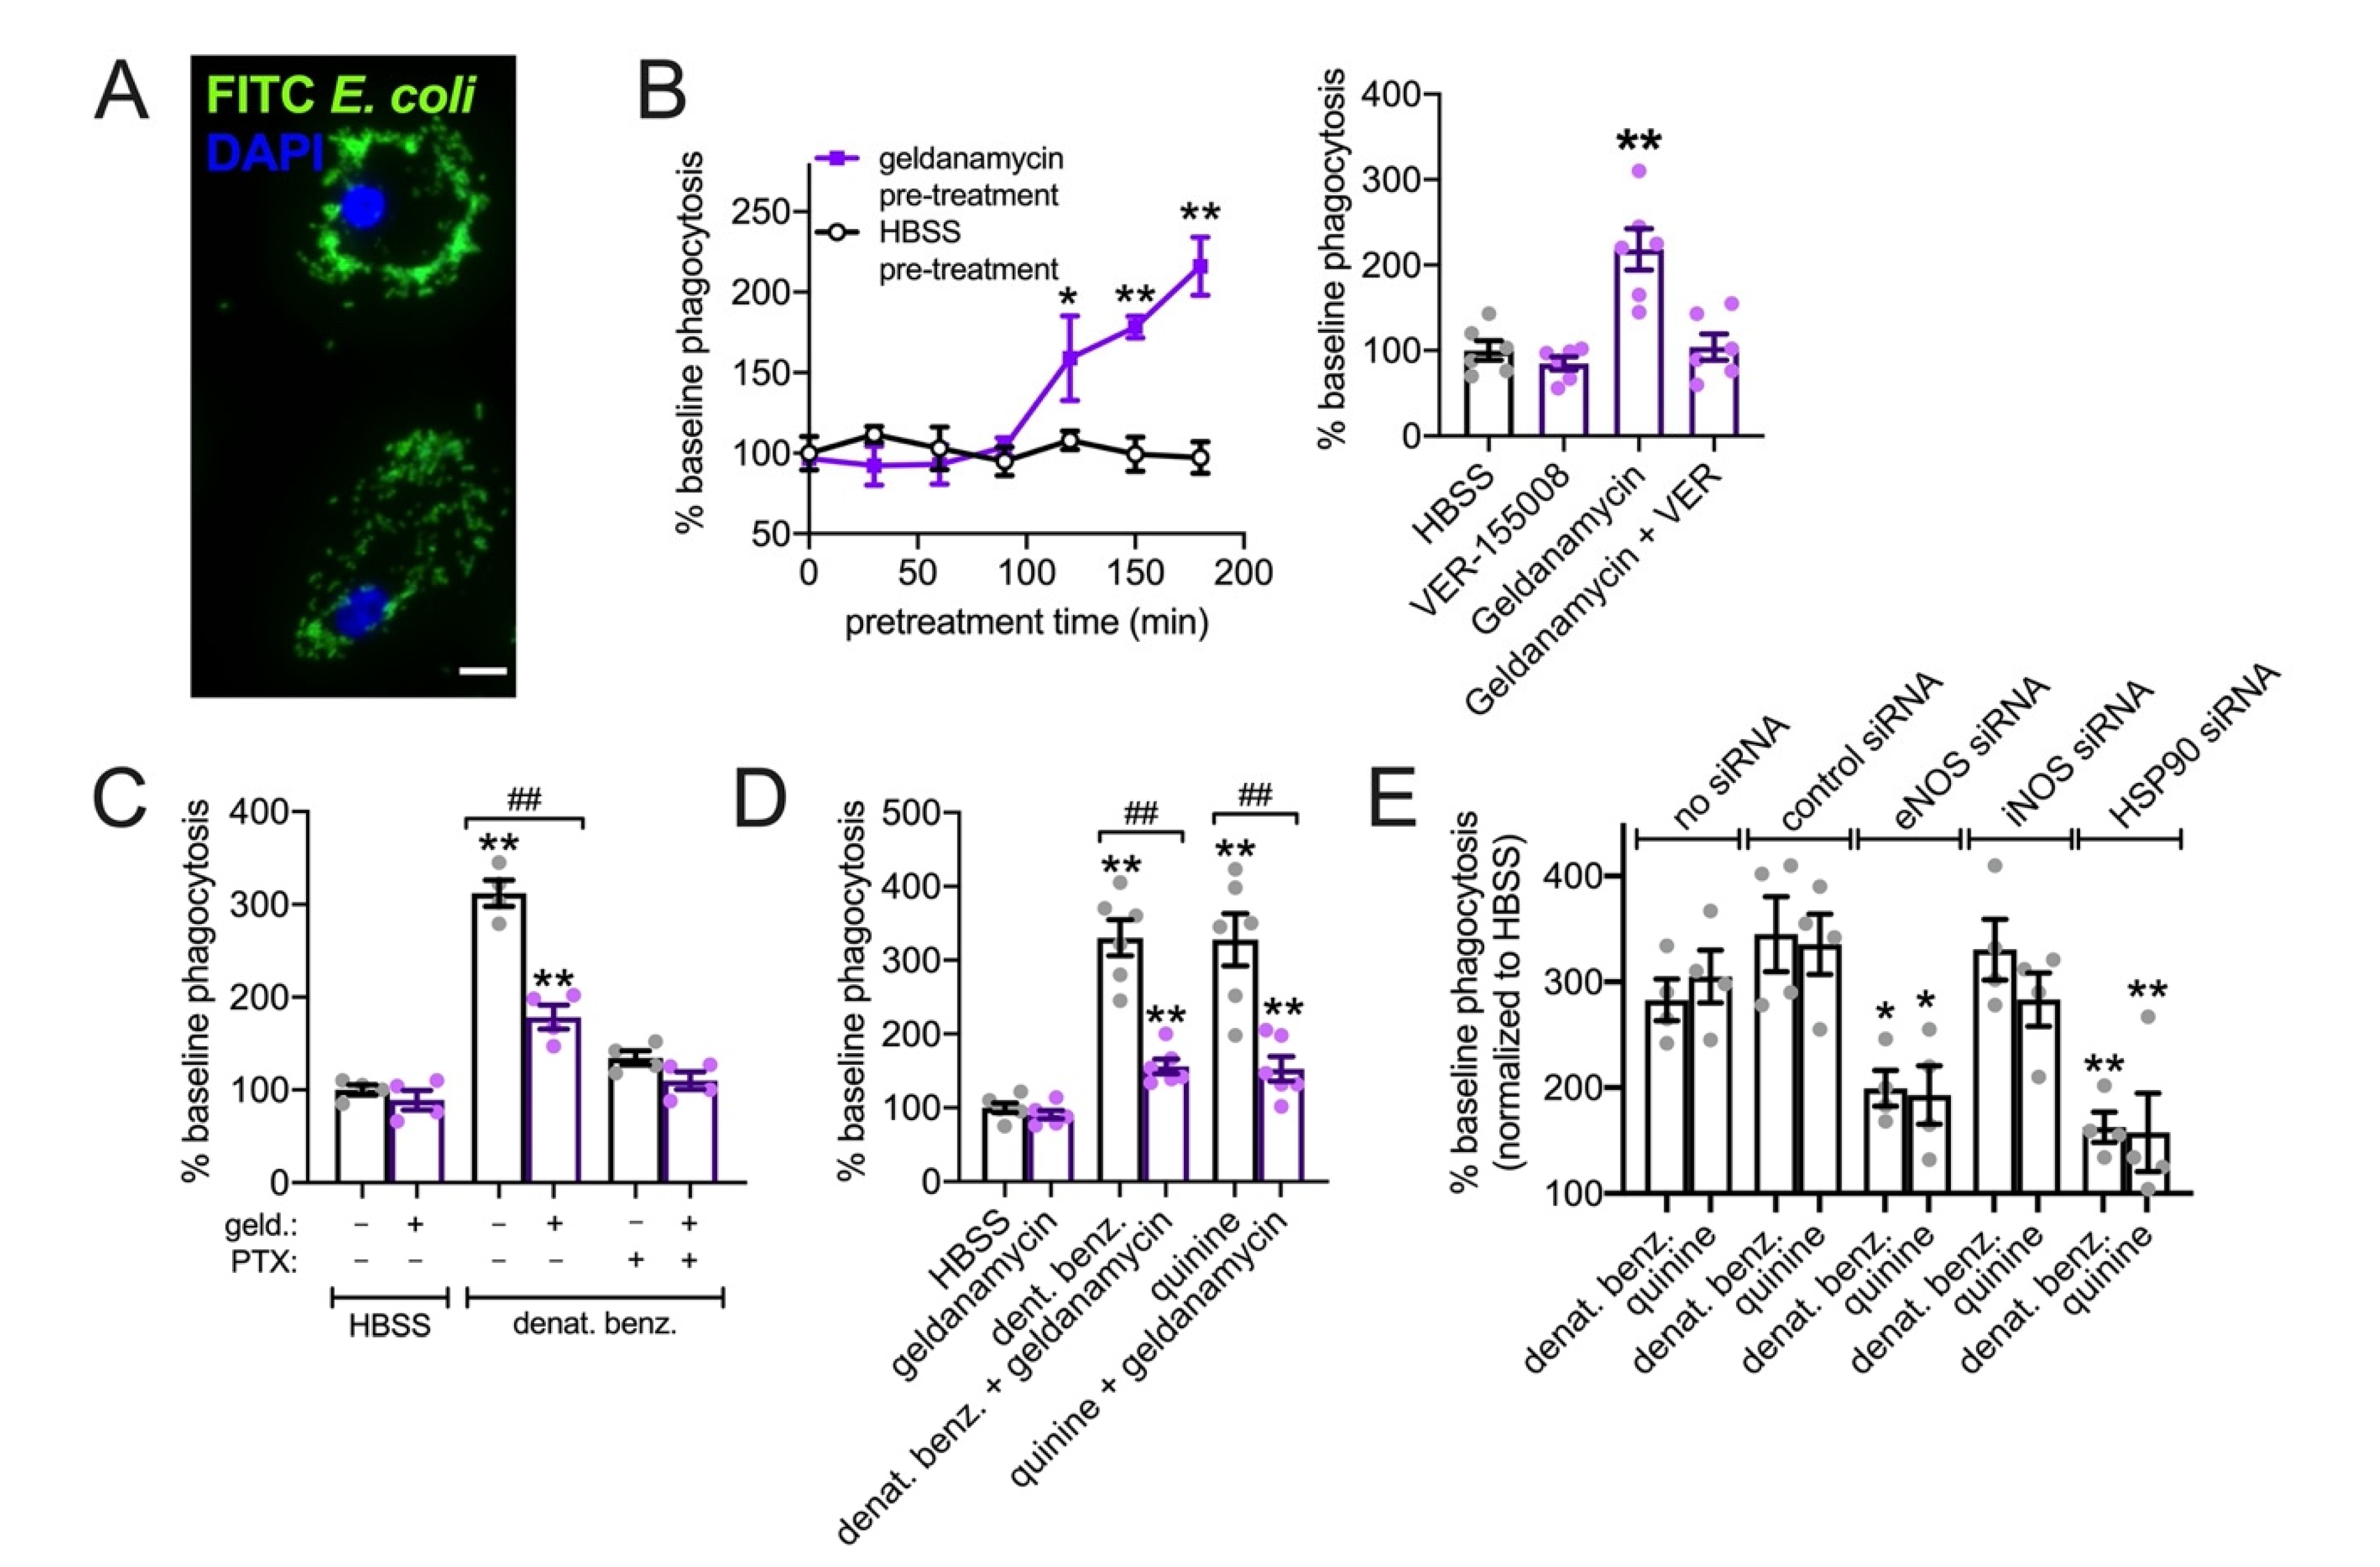
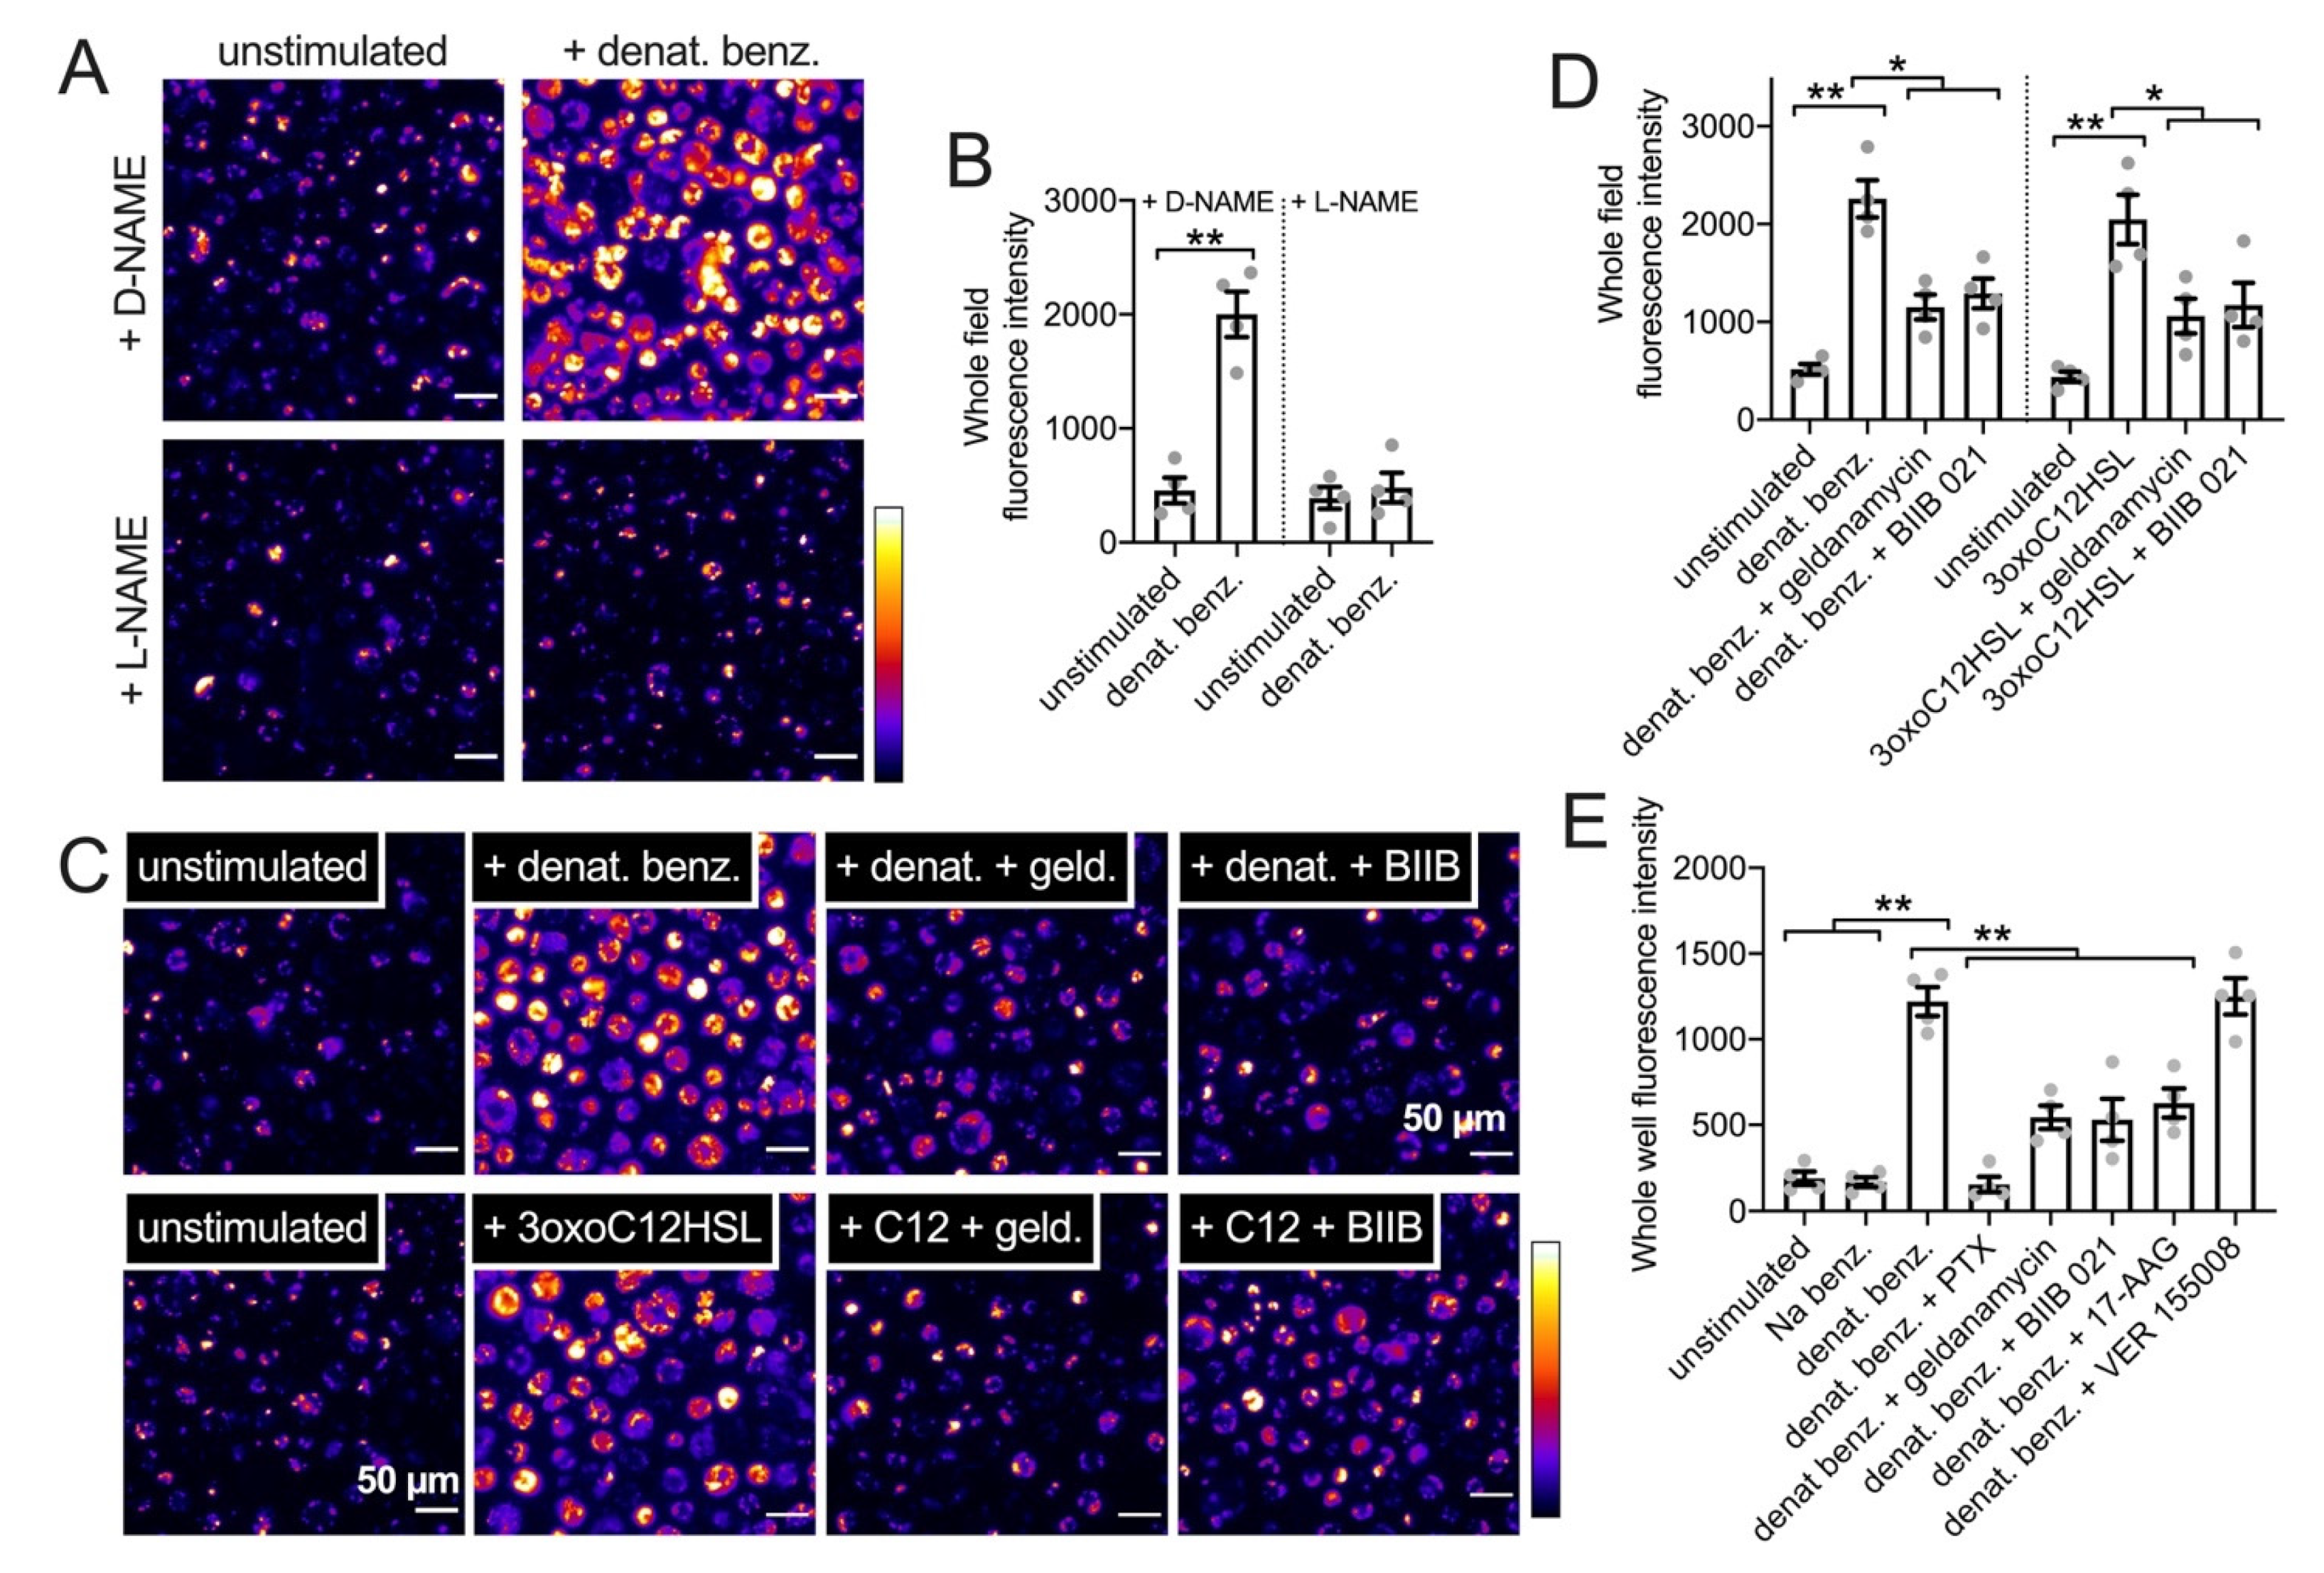
3.7. HSP90 Inhibition Reduces T2R NO Production and Phagocytosis in Primary Human MΦs

We wanted to examine T2R signaling to eNOS in another human primary cell model to test if it requires HSP90 function. Like epithelial cells, MΦs are important players in early innate immunity. Unprimed (M0) monocyte-derived MΦs also express eNOS involved in enhancement of phagocytosis during immune receptor activation [23]. While isolated monocytes differentiate into MΦs that are not exactly the same as alveolar MΦs that populate the airways at baseline [102,103,104], monocyte-derived MΦs are often used as surrogates for alveolar MΦs and are nonetheless themselves important for infections, including during chronic airway inflammation such as CRS, chronic obstructive pulmonary disease (COPD), asthma, and cystic fibrosis [15,105,106]. We previously observed that T2R stimulation in human M0 monocyte-derived MΦs also activates low-level Ca2+ responses that drive NO production to enhance phagocytosis [31]. Macrophage DAF-FM responses to denatonium benzoate were significantly reduced by HSP90 inhibitors geldanamycin and BIIB 021 (10 µM; 30 min pretreatment; Figure 9A) despite no change in denatonium-induced Ca2+ signals (Figure 9B), suggesting that HSP90 is required for activation of eNOS and/or nNOS downstream of the T2R-induced Ca2+ response [31]. To confirm this, we treated MΦs with pooled siRNAs directed against HSP90 or with non-targeting scrambled control siRNAs. We found that HSP90 siRNAs reduced the NO production driven by T2R agonist denatonium benzoate compared with control siRNAs (Figure 9C). Both pharmacological inhibition and genetic knockdown thus suggest that HSP90 is required for maximal NO production downstream of T2Rs in MΦs.
We measured phagocytosis of FITC-labeled Escherichia coli (Figure 10A). First, we had to test effects of geldanamycin alone. It was previously shown that geldanamycin treatment and HSP90 inhibition increase phagocytosis after ~90 min due to transcriptional up-regulation of HSP70 [107,108]. We observed an increase in baseline phagocytosis after ~2 h geldanamycin treatment (Figure 10B); this was inhibited by HSP70 inhibitor VER-155008 (Figure 10B), supporting these prior observations. Thus, to avoid any effects of HSP70 up-regulation, we tested the effects of geldanamycin on denatonium-upregulated phagocytosis after only 30 min geldanamycin pretreatment followed by continued geldanamycin treatment for the 15 min of the phagocytosis assay (45 min total). We observed a ~3-fold increase in phagocytosis in response to 1 mM denatonium benzoate (as we previously reported [31]) that was inhibited by geldanamycin as well as pertussis toxin (Figure 10C), which inactivates the Gi and Ggustducin Gα subunits that can couple to T2R receptors [98,109,110]. We also saw inhibition of denatonium benzoate-induced or quinine (500 µM)-induced phagocytosis of pHrodo-labeled S. aureus with geldanamycin pretreatment (Figure 10D). Together, these data suggest that HSP90 plays a key role in activation of NO production downstream of T2R activation. We found that knockdown of either eNOS or HSP90 by siRNA also reduced phagocytosis activated by T2R agonists denatonium benzoate or quinine (Figure 10E). As a control, knockdown of iNOS had not effect (Figure 10E). Thus, the importance of HSP90 in this process is supported by both pharmacological and genetic approaches.
To confirm that our FITC-E. coli measurements reflected phagocytosis and to test a pathogen with more relevance to the airway epithelium, we also tested pHrodo-labeled Staphylococcus aureus, as previously utilized in [31]. The pHrodo dye fluorescence reacts strongly in acidic environments and thus exhibits a marked increase in fluorescence when internalized into acidic organelles such lysosomes and phagosomes. Assays were carried out similarly to FITC-E. coli assays described above.
We observed that denatonium benzoate (1 mM) increased phagocytosis in a NOS-dependent manner as it was inhibited by L-NAME but not D-NAME (10 µM, 30 min pretreatment; Figure 11A,B). The increased phagocytosis in response to denatonium benzoate or P. aeruginosa 3oxoC12HSL (100 µM) was inhibited by geldanamycin or BIIB 021 (10 µM pretreatment; Figure 11C,D), supporting a reduction in this innate immune response by HSP90 inhibitors. We tested other HSP90 inhibitors using pHrodo S. aureus in the same assay in a plate reader format (as described in the methods and [31]). Well fluorescence increased when MΦs were incubated with 1 mM denatonium benzoate for 15 min (Figure 11E). Equimolar sodium benzoate had no effect (Figure 11E). The stimulatory effect of denatonium benzoate was reduced by pertussis toxin (to block T2R GPCR signaling) or pre-incubation (15 min; 10 µM) with HSP90 inhibitors geldanamycin, BIIB 021, or 17-AAG but not HSP70 inhibitor VER 155008 (Figure 11E).

4. Discussion

HSP90 likely plays a multi-faceted role in airway epithelial physiology beyond facilitating protein folding, but data surrounding its specific contributions are unclear. There has been an increasing interest in heat shock chaperone proteins in immune cell modulation [111], including regulation of immune cell metabolism [112] and immune receptor signaling [113,114]. Here, we show a new innate immune role for HSP90, namely the production of NO downstream of T2R signaling. Specifically, we show that HSP90 inhibition by multiple structurally diverse compounds acutely impairs NO-mediated airway epithelial CBF responses and macrophage phagocytosis without impairing the upstream calcium signaling. Thus, the result of HSP90 inhibition is not simply impaired receptor function, trafficking, or folding. We utilized several models, from heterologous expression in HEK293T and A549 cells to human primary cells differentiated from patient material.
The T2R to eNOS pathway, specifically polymorphisms regulating T2R38 signaling, has been identified as clinically important in terms of increased susceptibility to upper respiratory infections and impaired patient outcomes in chronic rhinosinusitis (CRS) [35,36,37,38,40,41,42,115,116,117]. T2R signaling to eNOS regulates both airway ciliary beating and macrophage phagocytosis. Others have shown that HSP90 is important for scaffolding eNOS with activating proteins such as Akt or Ca2+-bound calmodulin. We hypothesize that this scaffolding function is likewise important for T2R activation of eNOS. This puts HSP90 in a prime role to regulate eNOS output during T2R stimulation. HSP90 transcript levels can be regulated by a host of transcription factors active during inflammation or cell stress, including HSF1, NF-IL6, and NFκB [118]. Various post-transcriptional modifications, from phosphorylation to nitrosylation [48,118,119], can also alter HSP90 activity. We hypothesize that regulation of HSP90 may be one way to modulate airway T2R/eNOS NO output or airway NO output in general. In a myocardial ischemia–reperfusion injury mouse model, transfection of HSP90 is protective by enhancing eNOS S1177 (activating site) phosphorylation and decreasing eNOS T495 (inhibitory site) phosphorylation [120]. We hypothesize that HSP90 expression might be a pathway that could be exploited to increase NO in airway diseases associated with reduced NO levels, including CF [121,122,123,124,125,126,127,128,129] or primary ciliary dyskinesia [130,131,132].
While HSP90 has been shown to be important for baseline motile cilia function [48,54,55] as well as NO-driven alcohol-stimulated cilia function [48], other studies have suggested that HSP90 is necessary for Th2 (IL-13-driven) and Th17 (IL-17-driven) airway goblet cell metaplasia [56]. Many airway diseases, including asthma, COPD, and CF, are characterized by a loss of ciliated cells due to goblet or squamous metaplasia, likely impairing mucociliary clearance both through mucin hypersecretion and loss of cilia [133]. HSP90 inhibition was suggested to be potentially useful in type 2 inflammatory airway disease characterized by airway remodeling, typically goblet cell metaplasia [56], which include asthma and chronic rhinosinusitis. However, outside the airway, HSP90 has been implicated in both pro-inflammatory and anti-inflammatory processes [111]. A better understanding of how HSP90 contributes to the myriad of functions that airway epithelial cells perform, including bacterial surveillance and antimicrobial responses, is needed.
While HSP90 is required for NO production during stimulation of airway and macrophage T2Rs, the inhibition of HSP90 did not affect T2R-mediated Ca2+ signals upstream of the NO production. HSP90 inhibition reduced T2R-mediated cGMP production and reduced T2R-mediated elevation of ciliary beating, bacterial killing, and phagocytosis, all downstream of NO production. Thus, HSP90 inhibition may reduce innate immune responses to bacteria in the airway, through both epithelial cells and dedicated immune cells. The overall effect on airway innate immunity will depend on other pathways that are up or down regulated. It may be that the reversal of goblet metaplasia in asthma with HSP90 inhibition outweighs a side-effect of reduced T2R responses, but the knowledge that these T2R responses are reduced may suggest other supplemental targets/therapies are needed to boost NO production in patients receiving HSP90 inhibitors. Here, we simply show one effect of HSP90 inhibition that would be predicted to be detrimental. Other effects of HSP90 inhibitors in the airway must be studied in more detail to clarify the entire picture of how these drugs may affect the respiratory epithelium and innate defense.
As described above, HSP90 has been localized to the base of airway cilia [48,54] in close proximity to eNOS [18,21,48,134] and T2Rs [4,34]. We found that T2R activation produces more NO in ciliated airway cells than stimulation of purinergic receptors [34] or PAR-2 [135], despite the fact that these other GPCRs generate higher Ca2+ responses than T2Rs. A clearer picture of the T2R signaling pathway is necessary to understand why this occurs. It may be that the close proximity of T2Rs to eNOS and HSP90 creates localized Ca2+ or calmodulin microdomains within the cilia. Another explanation is that other T2R-stimulated pathways downstream or in parallel to the Ca2+ also contribute to these responses. While eNOS can be activated directly through interactions with Ca2+-bound calmodulin [136,137], it can also be activated by phosphorylation at multiple residues by kinases such as Akt, CaMKII, or PKA [138,139,140,141,142,143,144,145,146,147]. Phosphorylation at one or more eNOS residues may be important during T2R activation of NO production. While much work on T2Rs has focused on Ca2+ activation downstream of the Gβγ component of their heterotrimeric G protein signal pathway, little is known about kinases activated during T2R stimulation. Future studies are needed to better elucidate the molecular mechanisms of T2R signaling to eNOS in airway epithelial cells and other cells such as MΦs.

Supplementary Materials

The following supporting information can be downloaded at: https://www.mdpi.com/article/10.3390/cells11091478/s1, Figure S1: Role of HSP90 in NO production by heterologously expressed endothelial nitric oxide synthase (eNOS) in HEK293T cells; Figure S2: Role of HSP90 in NO production by heterologously expressed endothelial nitric oxide synthase (eNOS) in A549 cells; Figure S3: eNOS, T2R4, and T2R46 immunofluorescence in submerged subconfluent H441 cells; Figure S4: T2R agonist denatonium benzoate activates HSP90-dependent NO production in submerged H441; Figure S5: Geldanamycin inhibits NOS-dependent cGMP responses during denatonium benzoate stimulation in H441 cells.

Author Contributions

Conceptualization, R.M.C. and R.J.L.; methodology, R.M.C. and R.J.L.; validation, R.M.C., B.M.H. and R.J.L.; formal analysis, R.M.C., B.M.H. and R.J.L.; investigation, R.M.C., B.M.H. and R.J.L.; resources, R.J.L., N.D.A. and J.N.P.; data curation, R.M.C., B.M.H. and R.J.L.; writing—original draft preparation, R.M.C. and R.J.L.; writing—review and editing, R.M.C., R.J.L., N.D.A. and J.N.P.; visualization, R.J.L.; supervision, R.J.L.; project administration, R.J.L.; funding acquisition, R.J.L. All authors have read and agreed to the published version of the manuscript.

Funding

This research was funded by grants from National Institutes of Health R01DC016309 to R.J.L. and R01AI167971 to N.D.A., J.N.P. and R.J.L. and the American Head and Neck Society to R.M.C. Primary human monocytes were obtained from J. Riley and the UPenn Human Immunology Core, supported by P30CA016520 and P30AI045008.

Institutional Review Board Statement

This study was conducted in accordance with the Declaration of Helsinki and approved by the Institutional Review Board of the University of Pennsylvania (protocol #800614, date of approval 27 July 2021).

Informed Consent Statement

Informed consent was obtained from all subjects involved in this study in accordance with the U.S. Department of Health and Human Services code of federal regulation Title 45 CFR 46.116.

Data Availability Statement

Data are contained within this article or Supplementary Materials. Raw numerical values used to generate bar graphs or traces are available upon request.

Acknowledgments

We thank M. Victoria (University of Pennsylvania) for excellent technical assistance.

Conflicts of Interest

The authors declare no conflict of interest. The funders had no role in the design of the study; in the collection, analyses, or interpretation of data; in the writing of the manuscript, or in the decision to publish the results.

References

  1. Li, F. Taste perception: From the tongue to the testis. Mol. Hum. Reprod. 2013, 19, 349–360. [Google Scholar] [CrossRef] [PubMed] [Green Version]
  2. Yamamoto, K.; Ishimaru, Y. Oral and extra-oral taste perception. Semin. Cell Dev. Biol. 2013, 24, 240–246. [Google Scholar] [CrossRef] [PubMed]
  3. An, S.S.; Liggett, S.B. Taste and smell GPCRs in the lung: Evidence for a previously unrecognized widespread chemosensory system. Cell. Signal. 2017, 41, 82–88. [Google Scholar] [CrossRef] [PubMed]
  4. Shah, A.S.; Ben-Shahar, Y.; Moninger, T.O.; Kline, J.N.; Welsh, M.J. Motile cilia of human airway epithelia are chemosensory. Science 2009, 325, 1131–1134. [Google Scholar] [CrossRef] [PubMed] [Green Version]
  5. Carey, R.M.; Lee, R.J. Taste Receptors in Upper Airway Innate Immunity. Nutrients 2019, 11, 2017. [Google Scholar] [CrossRef] [PubMed] [Green Version]
  6. Deshpande, D.A.; Wang, W.C.; McIlmoyle, E.L.; Robinett, K.S.; Schillinger, R.M.; An, S.S.; Sham, J.S.; Liggett, S.B. Bitter taste receptors on airway smooth muscle bronchodilate by localized calcium signaling and reverse obstruction. Nat. Med. 2010, 16, 1299–1304. [Google Scholar] [CrossRef] [Green Version]
  7. An, S.S.; Wang, W.C.; Koziol-White, C.J.; Ahn, K.; Lee, D.Y.; Kurten, R.C.; Panettieri, R.A., Jr.; Liggett, S.B. TAS2R activation promotes airway smooth muscle relaxation despite beta(2)-adrenergic receptor tachyphylaxis. Am. J. Physiol. Lung. Cell. Mol. Physiol. 2012, 303, L304–L311. [Google Scholar] [CrossRef] [Green Version]
  8. Zhang, C.H.; Lifshitz, L.M.; Uy, K.F.; Ikebe, M.; Fogarty, K.E.; ZhuGe, R. The cellular and molecular basis of bitter tastant-induced bronchodilation. PLoS Biol. 2013, 11, e1001501. [Google Scholar] [CrossRef]
  9. Tan, X.; Sanderson, M.J. Bitter tasting compounds dilate airways by inhibiting airway smooth muscle calcium oscillations and calcium sensitivity. Br. J. Pharmacol. 2014, 171, 646–662. [Google Scholar] [CrossRef] [Green Version]
  10. Medapati, M.R.; Singh, N.; Bhagirath, A.Y.; Duan, K.; Triggs-Raine, B.; Batista, E.L., Jr.; Chelikani, P. Bitter taste receptor T2R14 detects quorum sensing molecules from cariogenic Streptococcus mutans and mediates innate immune responses in gingival epithelial cells. FASEB J. 2021, 35, e21375. [Google Scholar] [CrossRef]
  11. Grassin-Delyle, S.; Salvator, H.; Mantov, N.; Abrial, C.; Brollo, M.; Faisy, C.; Naline, E.; Couderc, L.J.; Devillier, P. Bitter Taste Receptors (TAS2Rs) in Human Lung Macrophages: Receptor Expression and Inhibitory Effects of TAS2R Agonists. Front. Physiol. 2019, 10, 1267. [Google Scholar] [CrossRef]
  12. Tran, H.T.T.; Herz, C.; Ruf, P.; Stetter, R.; Lamy, E. Human T2R38 Bitter Taste Receptor Expression in Resting and Activated Lymphocytes. Front. Immunol. 2018, 9, 2949. [Google Scholar] [CrossRef]
  13. Malki, A.; Fiedler, J.; Fricke, K.; Ballweg, I.; Pfaffl, M.W.; Krautwurst, D. Class I odorant receptors, TAS1R and TAS2R taste receptors, are markers for subpopulations of circulating leukocytes. J. Leukoc. Biol. 2015, 97, 533–545. [Google Scholar] [CrossRef] [Green Version]
  14. Kong, I.G.; Kim, D.W. Pathogenesis of Recalcitrant Chronic Rhinosinusitis: The Emerging Role of Innate Immune Cells. Immune Netw. 2018, 18, e6. [Google Scholar] [CrossRef] [Green Version]
  15. Belchamber, K.B.R.; Donnelly, L.E. Macrophage Dysfunction in Respiratory Disease. Results Probl. Cell Differ. 2017, 62, 299–313. [Google Scholar] [CrossRef]
  16. Jaggupilli, A.; Singh, N.; Jesus, V.C.; Duan, K.; Chelikani, P. Characterization of the Binding Sites for Bacterial Acyl Homoserine Lactones (AHLs) on Human Bitter Taste Receptors (T2Rs). ACS Infect. Dis. 2018, 4, 1146–1156. [Google Scholar] [CrossRef]
  17. Lossow, K.; Hubner, S.; Roudnitzky, N.; Slack, J.P.; Pollastro, F.; Behrens, M.; Meyerhof, W. Comprehensive Analysis of Mouse Bitter Taste Receptors Reveals Different Molecular Receptive Ranges for Orthologous Receptors in Mice and Humans. J. Biol. Chem. 2016, 291, 15358–15377. [Google Scholar] [CrossRef] [Green Version]
  18. Stout, S.L.; Wyatt, T.A.; Adams, J.J.; Sisson, J.H. Nitric oxide-dependent cilia regulatory enzyme localization in bovine bronchial epithelial cells. J. Histochem. Cytochem. 2007, 55, 433–442. [Google Scholar] [CrossRef] [Green Version]
  19. Sherman, T.S.; Chen, Z.; Yuhanna, I.S.; Lau, K.S.; Margraf, L.R.; Shaul, P.W. Nitric oxide synthase isoform expression in the developing lung epithelium. Am. J. Physiol. 1999, 276, L383–L390. [Google Scholar] [CrossRef] [Green Version]
  20. German, Z.; Chambliss, K.L.; Pace, M.C.; Arnet, U.A.; Lowenstein, C.J.; Shaul, P.W. Molecular basis of cell-specific endothelial nitric-oxide synthase expression in airway epithelium. J. Biol. Chem. 2000, 275, 8183–8189. [Google Scholar] [CrossRef] [Green Version]
  21. Salathe, M. Regulation of mammalian ciliary beating. Ann. Rev. Physiol. 2007, 69, 401–422. [Google Scholar] [CrossRef] [PubMed]
  22. Carey, R.M.; Adappa, N.D.; Palmer, J.N.; Lee, R.J. Neuropeptide Y Reduces Nasal Epithelial T2R Bitter Taste Receptor-Stimulated Nitric Oxide Production. Nutrients 2021, 13, 3392. [Google Scholar] [CrossRef] [PubMed]
  23. Huang, Z.; Hoffmann, F.W.; Fay, J.D.; Hashimoto, A.C.; Chapagain, M.L.; Kaufusi, P.H.; Hoffmann, P.R. Stimulation of unprimed macrophages with immune complexes triggers a low output of nitric oxide by calcium-dependent neuronal nitric-oxide synthase. J. Biol. Chem. 2012, 287, 4492–4502. [Google Scholar] [CrossRef] [PubMed] [Green Version]
  24. Marcinkiewicz, J. Nitric oxide and antimicrobial activity of reactive oxygen intermediates. Immunopharmacology 1997, 37, 35–41. [Google Scholar] [CrossRef]
  25. Fang, F.C. Perspectives series: Host/pathogen interactions. Mechanisms of nitric oxide-related antimicrobial activity. J. Clin. Investig. 1997, 99, 2818–2825. [Google Scholar] [CrossRef] [Green Version]
  26. Wink, D.A.; Hines, H.B.; Cheng, R.Y.; Switzer, C.H.; Flores-Santana, W.; Vitek, M.P.; Ridnour, L.A.; Colton, C.A. Nitric oxide and redox mechanisms in the immune response. J. Leukoc. Biol. 2011, 89, 873–891. [Google Scholar] [CrossRef] [Green Version]
  27. Akerstrom, S.; Mousavi-Jazi, M.; Klingstrom, J.; Leijon, M.; Lundkvist, A.; Mirazimi, A. Nitric oxide inhibits the replication cycle of severe acute respiratory syndrome coronavirus. J. Virol. 2005, 79, 1966–1969. [Google Scholar] [CrossRef] [Green Version]
  28. Akerstrom, S.; Gunalan, V.; Keng, C.T.; Tan, Y.J.; Mirazimi, A. Dual effect of nitric oxide on SARS-CoV replication: Viral RNA production and palmitoylation of the S protein are affected. Virology 2009, 395, 1–9. [Google Scholar] [CrossRef] [Green Version]
  29. Akaberi, D.; Krambrich, J.; Ling, J.; Luni, C.; Hedenstierna, G.; Jarhult, J.D.; Lennerstrand, J.; Lundkvist, A. Mitigation of the replication of SARS-CoV-2 by nitric oxide in vitro. Redox. Biol. 2020, 37, 101734. [Google Scholar] [CrossRef]
  30. Hedenstierna, G.; Chen, L.; Hedenstierna, M.; Lieberman, R.; Fine, D.H. Nitric oxide dosed in short bursts at high concentrations may protect against COVID-19. Nitric Oxide 2020, 103, 1–3. [Google Scholar] [CrossRef]
  31. Gopallawa, I.; Freund, J.R.; Lee, R.J. Bitter taste receptors stimulate phagocytosis in human macrophages through calcium, nitric oxide, and cyclic-GMP signaling. Cell. Mol. Life Sci. 2021, 78, 271–286. [Google Scholar] [CrossRef]
  32. Jeong, J.H.; Yoo, H.S.; Lee, S.H.; Kim, K.R.; Yoon, H.J.; Kim, S.H. Nasal and exhaled nitric oxide in chronic rhinosinusitis with polyps. Am. J. Rhinol. Allergy 2014, 28, e11–e16. [Google Scholar] [CrossRef]
  33. Eynott, P.R.; Groneberg, D.A.; Caramori, G.; Adcock, I.M.; Donnelly, L.E.; Kharitonov, S.; Barnes, P.J.; Chung, K.F. Role of nitric oxide in allergic inflammation and bronchial hyperresponsiveness. Eur. J. Pharmacol. 2002, 452, 123–133. [Google Scholar] [CrossRef]
  34. Lee, R.J.; Xiong, G.; Kofonow, J.M.; Chen, B.; Lysenko, A.; Jiang, P.; Abraham, V.; Doghramji, L.; Adappa, N.D.; Palmer, J.N.; et al. T2R38 taste receptor polymorphisms underlie susceptibility to upper respiratory infection. J. Clin. Investig. 2012, 122, 4145–4159. [Google Scholar] [CrossRef] [Green Version]
  35. Adappa, N.D.; Truesdale, C.M.; Workman, A.D.; Doghramji, L.; Mansfield, C.; Kennedy, D.W.; Palmer, J.N.; Cowart, B.J.; Cohen, N.A. Correlation of T2R38 taste phenotype and in vitro biofilm formation from nonpolypoid chronic rhinosinusitis patients. Int. Forum Allergy Rhinol. 2016, 6, 783–791. [Google Scholar] [CrossRef]
  36. Rom, D.I.; Christensen, J.M.; Alvarado, R.; Sacks, R.; Harvey, R.J. The impact of bitter taste receptor genetics on culturable bacteria in chronic rhinosinusitis. Rhinology 2017, 55, 90–94. [Google Scholar] [CrossRef]
  37. Cantone, E.; Negri, R.; Roscetto, E.; Grassia, R.; Catania, M.R.; Capasso, P.; Maffei, M.; Soriano, A.A.; Leone, C.A.; Iengo, M.; et al. In Vivo Biofilm Formation, Gram-Negative Infections and TAS2R38 Polymorphisms in CRSw NP Patients. Laryngoscope 2018, 128, E339–E345. [Google Scholar] [CrossRef]
  38. Adappa, N.D.; Zhang, Z.; Palmer, J.N.; Kennedy, D.W.; Doghramji, L.; Lysenko, A.; Reed, D.R.; Scott, T.; Zhao, N.W.; Owens, D.; et al. The bitter taste receptor T2R38 is an independent risk factor for chronic rhinosinusitis requiring sinus surgery. Int. Forum Allergy Rhinol. 2014, 4, 3–7. [Google Scholar] [CrossRef] [Green Version]
  39. Adappa, N.D.; Howland, T.J.; Palmer, J.N.; Kennedy, D.W.; Doghramji, L.; Lysenko, A.; Reed, D.R.; Lee, R.J.; Cohen, N.A. Genetics of the taste receptor T2R38 correlates with chronic rhinosinusitis necessitating surgical intervention. Int. Forum Allergy Rhinol. 2013, 3, 184–187. [Google Scholar] [CrossRef]
  40. Mfuna Endam, L.; Filali-Mouhim, A.; Boisvert, P.; Boulet, L.P.; Bosse, Y.; Desrosiers, M. Genetic variations in taste receptors are associated with chronic rhinosinusitis: A replication study. Int. Forum Allergy Rhinol. 2014, 4, 200–206. [Google Scholar] [CrossRef]
  41. Dzaman, K.; Zagor, M.; Sarnowska, E.; Krzeski, A.; Kantor, I. The correlation of TAS2R38 gene variants with higher risk for chronic rhinosinusitis in Polish patients. Otolaryngol. Pol. 2016, 70, 13–18. [Google Scholar] [CrossRef]
  42. Adappa, N.D.; Farquhar, D.; Palmer, J.N.; Kennedy, D.W.; Doghramji, L.; Morris, S.A.; Owens, D.; Mansfield, C.; Lysenko, A.; Lee, R.J.; et al. TAS2R38 genotype predicts surgical outcome in nonpolypoid chronic rhinosinusitis. Int. Forum Allergy Rhinol. 2015, 6, 25–33. [Google Scholar] [CrossRef] [Green Version]
  43. Castaldo, A.; Cernera, G.; Iacotucci, P.; Cimbalo, C.; Gelzo, M.; Comegna, M.; Di Lullo, A.M.; Tosco, A.; Carnovale, V.; Raia, V.; et al. TAS2R38 is a novel modifier gene in patients with cystic fibrosis. Sci. Rep. 2020, 10, 5806. [Google Scholar] [CrossRef] [Green Version]
  44. Turnbull, A.R.; Murphy, R.; Behrends, V.; Lund-Palau, H.; Simbo, A.; Mariveles, M.; Alton, E.; Bush, A.; Shoemark, A.; Davies, J.C. Impact of T2R38 Receptor Polymorphisms on Pseudomonas aeruginosa Infection in Cystic Fibrosis. Am. J. Respir. Crit. Care Med. 2018, 197, 1635–1638. [Google Scholar] [CrossRef]
  45. Dalesio, N.M.; Aksit, M.A.; Ahn, K.; Raraigh, K.S.; Collaco, J.M.; McGrath-Morrow, S.; Zeitlin, P.L.; An, S.S.; Cutting, G.R. Cystic fibrosis transmembrane conductance regulator function, not TAS2R38 gene haplotypes, predict sinus surgery in children and young adults with cystic fibrosis. Int. Forum Allergy Rhinol. 2020, 10, 748–754. [Google Scholar] [CrossRef]
  46. Parsa, S.; Mogharab, V.; Ebrahimi, M.; Ahmadi, S.R.; Shahi, B.; Mehramiz, N.J.; Foroughian, M.; Zarenezhad, M.; Kalani, N.; Abdi, M.H.; et al. COVID-19 as a worldwide selective event and bitter taste receptor polymorphisms: An ecological correlational study. Int. J. Biol. Macromol. 2021, 177, 204–210. [Google Scholar] [CrossRef]
  47. Schopf, F.H.; Biebl, M.M.; Buchner, J. The HSP90 chaperone machinery. Nat. Rev. Mol. Cell. Biol. 2017, 18, 345–360. [Google Scholar] [CrossRef]
  48. Simet, S.M.; Pavlik, J.A.; Sisson, J.H. Proteomic analysis of bovine axonemes exposed to acute alcohol: Role of endothelial nitric oxide synthase and heat shock protein 90 in cilia stimulation. Alcohol. Clin. Exp. Res. 2013, 37, 609–615. [Google Scholar] [CrossRef] [PubMed] [Green Version]
  49. Zhou, L.; Zhu, D.Y. Neuronal nitric oxide synthase: Structure, subcellular localization, regulation, and clinical implications. Nitric Oxide 2009, 20, 223–230. [Google Scholar] [CrossRef] [PubMed]
  50. Chatterjee, A.; Black, S.M.; Catravas, J.D. Endothelial nitric oxide (NO) and its pathophysiologic regulation. Vascul. Pharmacol. 2008, 49, 134–140. [Google Scholar] [CrossRef] [PubMed] [Green Version]
  51. Takahashi, S.; Mendelsohn, M.E. Synergistic Activation of Endothelial Nitric-oxide Synthase (eNOS) by HSP90 and Akt. J. Biol. Chem. 2003, 278, 30821–30827. [Google Scholar] [CrossRef] [Green Version]
  52. Fontana, J.; Fulton, D.; Chen, Y.; Fairchild, T.A.; McCabe, T.J.; Fujita, N.; Tsuruo, T.; Sessa, W.C. Domain mapping studies reveal that the M domain of hsp90 serves as a molecular scaffold to regulate Akt-dependent phosphorylation of endothelial nitric oxide synthase and NO release. Circ. Res. 2002, 90, 866–873. [Google Scholar] [CrossRef]
  53. Garcia-Cardena, G.; Fan, R.; Shah, V.; Sorrentino, R.; Cirino, G.; Papapetropoulos, A.; Sessa, W.C. Dynamic activation of endothelial nitric oxide synthase by Hsp90. Nature 1998, 392, 821–824. [Google Scholar] [CrossRef]
  54. Wang, H.; Zou, X.; Wei, Z.; Wu, Y.; Li, R.; Zeng, R.; Chen, Z.; Liao, K. Hsp90alpha forms a stable complex at the cilium neck for the interaction of signalling molecules in IGF-1 receptor signalling. J. Cell Sci. 2015, 128, 100–108. [Google Scholar] [CrossRef] [Green Version]
  55. Takaki, E.; Fujimoto, M.; Nakahari, T.; Yonemura, S.; Miyata, Y.; Hayashida, N.; Yamamoto, K.; Vallee, R.B.; Mikuriya, T.; Sugahara, K.; et al. Heat shock transcription factor 1 is required for maintenance of ciliary beating in mice. J. Biol. Chem. 2007, 282, 37285–37292. [Google Scholar] [CrossRef] [Green Version]
  56. Pezzulo, A.A.; Tudas, R.A.; Stewart, C.G.; Buonfiglio, L.G.V.; Lindsay, B.D.; Taft, P.J.; Gansemer, N.D.; Zabner, J. HSP90 inhibitor geldanamycin reverts IL-13- and IL-17-induced airway goblet cell metaplasia. J. Clin. Investig. 2019, 129, 744–758. [Google Scholar] [CrossRef] [Green Version]
  57. McMahon, D.B.; Kuek, L.E.; Johnson, M.E.; Johnson, P.O.; Horn, R.L.J.; Carey, R.M.; Adappa, N.D.; Palmer, J.N.; Lee, R.J. The bitter end: T2R bitter receptor agonists elevate nuclear calcium and induce apoptosis in non-ciliated airway epithelial cells. Cell Calcium 2022, 101, 102499. [Google Scholar] [CrossRef]
  58. Hariri, B.M.; McMahon, D.B.; Chen, B.; Adappa, N.D.; Palmer, J.N.; Kennedy, D.W.; Lee, R.J. Plant flavones enhance antimicrobial activity of respiratory epithelial cell secretions against Pseudomonas aeruginosa. PLoS ONE 2017, 12, e0185203. [Google Scholar] [CrossRef] [Green Version]
  59. Hariri, B.M.; McMahon, D.B.; Chen, B.; Freund, J.R.; Mansfield, C.J.; Doghramji, L.J.; Adappa, N.D.; Palmer, J.N.; Kennedy, D.W.; Reed, D.R.; et al. Flavones modulate respiratory epithelial innate immunity: Anti-inflammatory effects and activation of the T2R14 receptor. J. Biol. Chem. 2017, 292, 8484–8497. [Google Scholar] [CrossRef] [Green Version]
  60. Guo, S.W.; Reed, D.R. The genetics of phenylthiocarbamide perception. Ann. Hum. Biol. 2001, 28, 111–142. [Google Scholar]
  61. Bufe, B.; Breslin, P.A.; Kuhn, C.; Reed, D.R.; Tharp, C.D.; Slack, J.P.; Kim, U.K.; Drayna, D.; Meyerhof, W. The molecular basis of individual differences in phenylthiocarbamide and propylthiouracil bitterness perception. Curr. Biol. 2005, 15, 322–327. [Google Scholar] [CrossRef] [PubMed] [Green Version]
  62. Carey, R.M.; McMahon, D.B.; Miller, Z.A.; Kim, T.; Rajasekaran, K.; Gopallawa, I.; Newman, J.G.; Basu, D.; Nead, K.T.; White, E.A.; et al. T2R bitter taste receptors regulate apoptosis and may be associated with survival in head and neck squamous cell carcinoma. Mol. Oncol. 2021, 16, 1474–1492. [Google Scholar] [CrossRef] [PubMed]
  63. Edelstein, A.; Amodaj, N.; Hoover, K.; Vale, R.; Stuurman, N. Computer control of microscopes using microManager. Curr. Protoc. Mol. Biol. 2010, 14, 20. [Google Scholar] [CrossRef] [PubMed] [Green Version]
  64. Sisson, J.H.; Stoner, J.A.; Ammons, B.A.; Wyatt, T.A. All-digital image capture and whole-field analysis of ciliary beat frequency. J. Microsc. 2003, 211, 103–111. [Google Scholar] [CrossRef] [PubMed]
  65. Pearson, J.P.; Pesci, E.C.; Iglewski, B.H. Roles of Pseudomonas aeruginosa las and rhl quorum-sensing systems in control of elastase and rhamnolipid biosynthesis genes. J. Bacteriol. 1997, 179, 5756–5767. [Google Scholar] [CrossRef] [PubMed] [Green Version]
  66. Pearson, J.P.; Passador, L.; Iglewski, B.H.; Greenberg, E.P. A second N-acylhomoserine lactone signal produced by Pseudomonas aeruginosa. Proc. Natl. Acad. Sci. USA 1995, 92, 1490–1494. [Google Scholar] [CrossRef] [PubMed] [Green Version]
  67. Schindelin, J.; Arganda-Carreras, I.; Frise, E.; Kaynig, V.; Longair, M.; Pietzsch, T.; Preibisch, S.; Rueden, C.; Saalfeld, S.; Schmid, B.; et al. Fiji: An open-source platform for biological-image analysis. Nat. Methods 2012, 9, 676–682. [Google Scholar] [CrossRef] [Green Version]
  68. Leterrier, C. ChrisLUTs. Available online: https://github.com/cleterrier/ChrisLUTs (accessed on 12 December 2021).
  69. Xu, H.; Shi, Y.; Wang, J.; Jones, D.; Weilrauch, D.; Ying, R.; Wakim, B.; Pritchard, K.A., Jr. A heat shock protein 90 binding domain in endothelial nitric-oxide synthase influences enzyme function. J. Biol. Chem. 2007, 282, 37567–37574. [Google Scholar] [CrossRef] [Green Version]
  70. Vladic, N.; Ge, Z.D.; Leucker, T.; Brzezinska, A.K.; Du, J.H.; Shi, Y.; Warltier, D.C.; Pratt, P.F., Jr.; Kersten, J.R. Decreased tetrahydrobiopterin and disrupted association of Hsp90 with eNOS by hyperglycemia impair myocardial ischemic preconditioning. Am. J. Physiol. Heart Circ. Physiol. 2011, 301, H2130–H2139. [Google Scholar] [CrossRef] [Green Version]
  71. Miao, R.Q.; Fontana, J.; Fulton, D.; Lin, M.I.; Harrison, K.D.; Sessa, W.C. Dominant-negative Hsp90 reduces VEGF-stimulated nitric oxide release and migration in endothelial cells. Arterioscler. Thromb. Vasc. Biol. 2008, 28, 105–111. [Google Scholar] [CrossRef] [Green Version]
  72. Sessa, W.C.; Garcia-Cardena, G.; Liu, J.; Keh, A.; Pollock, J.S.; Bradley, J.; Thiru, S.; Braverman, I.M.; Desai, K.M. The Golgi association of endothelial nitric oxide synthase is necessary for the efficient synthesis of nitric oxide. J. Biol. Chem. 1995, 270, 17641–17644. [Google Scholar] [CrossRef] [Green Version]
  73. Gopallawa, I.; Kuek, L.E.; Adappa, N.D.; Palmer, J.N.; Lee, R.J. Small-molecule Akt-activation in airway cells induces NO production and reduces IL-8 transcription through Nrf-2. Respir. Res. 2021, 22, 267. [Google Scholar] [CrossRef]
  74. Zhou, B.P.; Hu, M.C.; Miller, S.A.; Yu, Z.; Xia, W.; Lin, S.Y.; Hung, M.C. HER-2/neu blocks tumor necrosis factor-induced apoptosis via the Akt/NF-kappaB pathway. J. Biol. Chem. 2000, 275, 8027–8031. [Google Scholar] [CrossRef] [Green Version]
  75. Sowa, G.; Liu, J.; Papapetropoulos, A.; Rex-Haffner, M.; Hughes, T.E.; Sessa, W.C. Trafficking of endothelial nitric-oxide synthase in living cells. Quantitative evidence supporting the role of palmitoylation as a kinetic trapping mechanism limiting membrane diffusion. J. Biol. Chem. 1999, 274, 22524–22531. [Google Scholar] [CrossRef] [Green Version]
  76. Picard, D.; Suslova, E.; Briand, P.A. 2-color photobleaching experiments reveal distinct intracellular dynamics of two components of the Hsp90 complex. Exp. Cell Res. 2006, 312, 3949–3958. [Google Scholar] [CrossRef]
  77. Shaul, P.W.; North, A.J.; Wu, L.C.; Wells, L.B.; Brannon, T.S.; Lau, K.S.; Michel, T.; Margraf, L.R.; Star, R.A. Endothelial nitric oxide synthase is expressed in cultured human bronchiolar epithelium. J. Clin. Investig. 1994, 94, 2231–2236. [Google Scholar] [CrossRef] [Green Version]
  78. Salinas, D.; Sparkman, L.; Berhane, K.; Boggaram, V. Nitric oxide inhibits surfactant protein B gene expression in lung epithelial cells. Am. J. Physiol. Lung Cell. Mol. Physiol. 2003, 285, L1153–L1165. [Google Scholar] [CrossRef] [Green Version]
  79. Kirsch, E.A.; Yuhanna, I.S.; Chen, Z.; German, Z.; Sherman, T.S.; Shaul, P.W. Estrogen acutely stimulates endothelial nitric oxide synthase in H441 human airway epithelial cells. Am. J. Respir. Cell Mol. Biol. 1999, 20, 658–666. [Google Scholar] [CrossRef]
  80. Boggaram, V.; Chandru, H.; Gottipati, K.R.; Thakur, V.; Das, A.; Berhane, K. Transcriptional regulation of SP-B gene expression by nitric oxide in H441 lung epithelial cells. Am. J. Physiol. Lung Cell. Mol. Physiol. 2010, 299, L252–L262. [Google Scholar] [CrossRef] [Green Version]
  81. Meyerhof, W.; Batram, C.; Kuhn, C.; Brockhoff, A.; Chudoba, E.; Bufe, B.; Appendino, G.; Behrens, M. The molecular receptive ranges of human TAS2R bitter taste receptors. Chem. Sens. 2010, 35, 157–170. [Google Scholar] [CrossRef]
  82. Wiener, A.; Shudler, M.; Levit, A.; Niv, M.Y. BitterDB: A database of bitter compounds. Nucleic Acids Res. 2012, 40, D413–D419. [Google Scholar] [CrossRef]
  83. Workman, A.D.; Maina, I.W.; Brooks, S.G.; Kohanski, M.A.; Cowart, B.J.; Mansfield, C.; Kennedy, D.W.; Palmer, J.N.; Adappa, N.D.; Reed, D.R.; et al. The Role of Quinine-Responsive T2Rs in Airway Immune Defense and Chronic Rhinosinusitis. Front. Immunol. 2018, 9, 624. [Google Scholar] [CrossRef] [Green Version]
  84. Schmidt, H.; Michel, C.; Braubach, P.; Fauler, M.; Neubauer, D.; Thompson, K.E.; Frick, M.; Mizaikoff, B.; Dietl, P.; Wittekindt, O.H. Water Permeability Adjusts Resorption in Lung Epithelia to Increased Apical Surface Liquid Volumes. Am. J. Respir. Cell Mol. Biol. 2017, 56, 372–382. [Google Scholar] [CrossRef]
  85. Nickel, S.; Selo, M.A.; Fallack, J.; Clerkin, C.G.; Huwer, H.; Schneider-Daum, N.; Lehr, C.M.; Ehrhardt, C. Expression and Activity of Breast Cancer Resistance Protein (BCRP/ABCG2) in Human Distal Lung Epithelial Cells In Vitro. Pharm. Res. 2017. [Google Scholar] [CrossRef] [PubMed]
  86. Korbmacher, J.P.; Michel, C.; Neubauer, D.; Thompson, K.; Mizaikoff, B.; Frick, M.; Dietl, P.; Wittekindt, O.H. Amiloride-sensitive fluid resorption in NCI-H441 lung epithelia depends on an apical Cl(-) conductance. Physiol. Rep. 2014, 2, e00201. [Google Scholar] [CrossRef] [PubMed]
  87. Chen, L.; Song, W.; Davis, I.C.; Shrestha, K.; Schwiebert, E.; Sullender, W.M.; Matalon, S. Inhibition of Na+ transport in lung epithelial cells by respiratory syncytial virus infection. Am. J. Respir. Cell Mol. Biol. 2009, 40, 588–600. [Google Scholar] [CrossRef] [PubMed] [Green Version]
  88. Aarbiou, J.; Copreni, E.; Buijs-Offerman, R.M.; van der Wegen, P.; Castellani, S.; Carbone, A.; Tilesi, F.; Fradiani, P.; Hiemstra, P.S.; Yueksekdag, G.; et al. Lentiviral small hairpin RNA delivery reduces apical sodium channel activity in differentiated human airway epithelial cells. J. Gene Med. 2012, 14, 733–745. [Google Scholar] [CrossRef]
  89. Jiang, J.; Malavia, N.; Suresh, V.; George, S.C. Nitric oxide gas phase release in human small airway epithelial cells. Respir. Res. 2009, 10, 3. [Google Scholar] [CrossRef] [Green Version]
  90. Takasaki, J.; Saito, T.; Taniguchi, M.; Kawasaki, T.; Moritani, Y.; Hayashi, K.; Kobori, M. A novel Galphaq/11-selective inhibitor. J. Biol. Chem. 2004, 279, 47438–47445. [Google Scholar] [CrossRef] [Green Version]
  91. Peng, Q.; Alqahtani, S.; Nasrullah, M.Z.A.; Shen, J. Functional evidence for biased inhibition of G protein signaling by YM-254890 in human coronary artery endothelial cells. Eur. J. Pharmacol. 2021, 891, 173706. [Google Scholar] [CrossRef]
  92. Nishimura, A.; Kitano, K.; Takasaki, J.; Taniguchi, M.; Mizuno, N.; Tago, K.; Hakoshima, T.; Itoh, H. Structural basis for the specific inhibition of heterotrimeric Gq protein by a small molecule. Proc. Natl. Acad. Sci. USA 2010, 107, 13666–13671. [Google Scholar] [CrossRef] [Green Version]
  93. Wolfle, U.; Elsholz, F.A.; Kersten, A.; Haarhaus, B.; Schumacher, U.; Schempp, C.M. Expression and Functional Activity of the Human Bitter Taste Receptor TAS2R38 in Human Placental Tissues and JEG-3 Cells. Molecules 2016, 21, 306. [Google Scholar] [CrossRef] [Green Version]
  94. Roland, W.S.; van Buren, L.; Gruppen, H.; Driesse, M.; Gouka, R.J.; Smit, G.; Vincken, J.P. Bitter taste receptor activation by flavonoids and isoflavonoids: Modeled structural requirements for activation of hTAS2R14 and hTAS2R39. J. Agric. Food Chem. 2013, 61, 10454–10466. [Google Scholar] [CrossRef]
  95. Levit, A.; Nowak, S.; Peters, M.; Wiener, A.; Meyerhof, W.; Behrens, M.; Niv, M.Y. The bitter pill: Clinical drugs that activate the human bitter taste receptor TAS2R14. FASEB J. 2014, 28, 1181–1197. [Google Scholar] [CrossRef]
  96. Zhang, S.; Smith, N.; Schuster, D.; Azbell, C.; Sorscher, E.J.; Rowe, S.M.; Woodworth, B.A. Quercetin increases cystic fibrosis transmembrane conductance regulator-mediated chloride transport and ciliary beat frequency: Therapeutic implications for chronic rhinosinusitis. Am. J. Rhinol. Allergy 2011, 25, 307–312. [Google Scholar] [CrossRef] [Green Version]
  97. Sun, H.; Niisato, N.; Nishio, K.; Hamilton, K.L.; Marunaka, Y. Distinct action of flavonoids, myricetin and quercetin, on epithelial Cl(-) secretion: Useful tools as regulators of Cl(-) secretion. Biomed. Res. Int. 2014, 2014, 902735. [Google Scholar] [CrossRef]
  98. Kim, D.; Woo, J.A.; Geffken, E.; An, S.S.; Liggett, S.B. Coupling of Airway Smooth Muscle Bitter Taste Receptors to Intracellular Signaling and Relaxation Is via Galphai1,2,3. Am. J. Respir. Cell Mol. Biol. 2017, 56, 762–771. [Google Scholar] [CrossRef]
  99. Roland, W.S.; Gouka, R.J.; Gruppen, H.; Driesse, M.; van Buren, L.; Smit, G.; Vincken, J.P. 6-methoxyflavanones as bitter taste receptor blockers for hTAS2R39. PLoS ONE 2014, 9, e94451. [Google Scholar] [CrossRef]
  100. Pearson, J.P.; Gray, K.M.; Passador, L.; Tucker, K.D.; Eberhard, A.; Iglewski, B.H.; Greenberg, E.P. Structure of the autoinducer required for expression of Pseudomonas aeruginosa virulence genes. Proc. Natl. Acad. Sci. USA 1994, 91, 197–201. [Google Scholar] [CrossRef] [Green Version]
  101. Pesci, E.C.; Milbank, J.B.; Pearson, J.P.; McKnight, S.; Kende, A.S.; Greenberg, E.P.; Iglewski, B.H. Quinolone signaling in the cell-to-cell communication system of Pseudomonas aeruginosa. Proc. Natl. Acad. Sci. USA 1999, 96, 11229–11234. [Google Scholar] [CrossRef] [Green Version]
  102. Liddiard, K.; Rosas, M.; Davies, L.C.; Jones, S.A.; Taylor, P.R. Macrophage heterogeneity and acute inflammation. Eur. J. Immunol. 2011, 41, 2503–2508. [Google Scholar] [CrossRef]
  103. Davies, L.C.; Rosas, M.; Jenkins, S.J.; Liao, C.T.; Scurr, M.J.; Brombacher, F.; Fraser, D.J.; Allen, J.E.; Jones, S.A.; Taylor, P.R. Distinct bone marrow-derived and tissue-resident macrophage lineages proliferate at key stages during inflammation. Nat. Commun. 2013, 4, 1886. [Google Scholar] [CrossRef] [Green Version]
  104. Gordon, S.; Taylor, P.R. Monocyte and macrophage heterogeneity. Nat. Rev. Immunol. 2005, 5, 953–964. [Google Scholar] [CrossRef]
  105. Assani, K.; Shrestha, C.L.; Robledo-Avila, F.; Rajaram, M.V.; Partida-Sanchez, S.; Schlesinger, L.S.; Kopp, B.T. Human Cystic Fibrosis Macrophages Have Defective Calcium-Dependent Protein Kinase C Activation of the NADPH Oxidase, an Effect Augmented by Burkholderia cenocepacia. J. Immunol. 2017, 198, 1985–1994. [Google Scholar] [CrossRef] [Green Version]
  106. Bruscia, E.M.; Bonfield, T.L. Cystic Fibrosis Lung Immunity: The Role of the Macrophage. J. Innate Immun. 2016, 8, 550–563. [Google Scholar] [CrossRef]
  107. Vega, V.L.; De Maio, A. Increase in phagocytosis after geldanamycin treatment or heat shock: Role of heat shock proteins. J. Immunol. 2005, 175, 5280–5287. [Google Scholar] [CrossRef] [Green Version]
  108. Vega, V.L.; Charles, W.; Crotty Alexander, L.E. Rescuing of deficient killing and phagocytic activities of macrophages derived from non-obese diabetic mice by treatment with geldanamycin or heat shock: Potential clinical implications. Cell Stress Chaperones 2011, 16, 573–581. [Google Scholar] [CrossRef] [Green Version]
  109. Ozeck, M.; Brust, P.; Xu, H.; Servant, G. Receptors for bitter, sweet and umami taste couple to inhibitory G protein signaling pathways. Eur. J. Pharmacol. 2004, 489, 139–149. [Google Scholar] [CrossRef]
  110. McLaughlin, S.K.; McKinnon, P.J.; Margolskee, R.F. Gustducin is a taste-cell-specific G protein closely related to the transducins. Nature 1992, 357, 563–569. [Google Scholar] [CrossRef]
  111. Zininga, T.; Ramatsui, L.; Shonhai, A. Heat Shock Proteins as Immunomodulants. Molecules 2018, 23, 2846. [Google Scholar] [CrossRef] [Green Version]
  112. O’Neill, L.A.; Kishton, R.J.; Rathmell, J. A guide to immunometabolism for immunologists. Nat. Rev. Immunol. 2016, 16, 553–565. [Google Scholar] [CrossRef] [PubMed] [Green Version]
  113. Streicher, J.M. The Role of Heat Shock Proteins in Regulating Receptor Signal Transduction. Mol. Pharmacol. 2019, 95, 468–474. [Google Scholar] [CrossRef] [PubMed]
  114. Pai, K.S.; Mahajan, V.B.; Lau, A.; Cunningham, D.D. Thrombin receptor signaling to cytoskeleton requires Hsp90. J. Biol. Chem. 2001, 276, 32642–32647. [Google Scholar] [CrossRef] [PubMed] [Green Version]
  115. Purnell, P.R.; Addicks, B.L.; Zalzal, H.G.; Shapiro, S.; Wen, S.; Ramadan, H.H.; Setola, V.; Siderovski, D.P. Single Nucleotide Polymorphisms in Chemosensory Pathway Genes GNB3, TAS2R19, and TAS2R38 Are Associated with Chronic Rhinosinusitis. Int. Arch. Allergy Immunol. 2019, 180, 72–78. [Google Scholar] [CrossRef]
  116. Lin, C.; Civantos, A.M.; Arnold, M.; Stevens, E.M.; Cowart, B.J.; Colquitt, L.R.; Mansfield, C.; Kennedy, D.W.; Brooks, S.G.; Workman, A.D.; et al. Divergent bitter and sweet taste perception intensity in chronic rhinosinusitis patients. Int. Forum Allergy Rhinol. 2020, 11, 857–865. [Google Scholar] [CrossRef]
  117. Adappa, N.D.; Workman, A.D.; Hadjiliadis, D.; Dorgan, D.J.; Frame, D.; Brooks, S.; Doghramji, L.; Palmer, J.N.; Mansfield, C.; Reed, D.R.; et al. T2R38 genotype is correlated with sinonasal quality of life in homozygous DeltaF508 cystic fibrosis patients. Int. Forum Allergy Rhinol. 2016, 6, 356–361. [Google Scholar] [CrossRef] [Green Version]
  118. Prodromou, C. Mechanisms of Hsp90 regulation. Biochem. J. 2016, 473, 2439–2452. [Google Scholar] [CrossRef] [Green Version]
  119. Mollapour, M.; Neckers, L. Post-translational modifications of Hsp90 and their contributions to chaperone regulation. Biochim. Biophys. Acta. 2012, 1823, 648–655. [Google Scholar] [CrossRef] [Green Version]
  120. Kupatt, C.; Dessy, C.; Hinkel, R.; Raake, P.; Daneau, G.; Bouzin, C.; Boekstegers, P.; Feron, O. Heat shock protein 90 transfection reduces ischemia-reperfusion-induced myocardial dysfunction via reciprocal endothelial NO synthase serine 1177 phosphorylation and threonine 495 dephosphorylation. Arterioscler. Thromb. Vasc. Biol. 2004, 24, 1435–1441. [Google Scholar] [CrossRef] [Green Version]
  121. Zheng, S.; Xu, W.; Bose, S.; Banerjee, A.K.; Haque, S.J.; Erzurum, S.C. Impaired nitric oxide synthase-2 signaling pathway in cystic fibrosis airway epithelium. Am. J. Physiol. Lung Cell. Mol. Physiol. 2004, 287, L374–L381. [Google Scholar] [CrossRef]
  122. Thomas, S.R.; Kharitonov, S.A.; Scott, S.F.; Hodson, M.E.; Barnes, P.J. Nasal and exhaled nitric oxide is reduced in adult patients with cystic fibrosis and does not correlate with cystic fibrosis genotype. Chest 2000, 117, 1085–1089. [Google Scholar] [CrossRef] [Green Version]
  123. Texereau, J.; Marullo, S.; Hubert, D.; Coste, J.; Dusser, D.J.; Dall’Ava-Santucci, J.; Dinh-Xuan, A.T. Nitric oxide synthase 1 as a potential modifier gene of decline in lung function in patients with cystic fibrosis. Thorax 2004, 59, 156–158. [Google Scholar] [CrossRef] [Green Version]
  124. Texereau, J.; Fajac, I.; Hubert, D.; Coste, J.; Dusser, D.J.; Bienvenu, T.; Dall’Ava-Santucci, J.; Dinh-Xuan, A.T. Reduced exhaled NO is related to impaired nasal potential difference in patients with cystic fibrosis. Vascul. Pharmacol. 2005, 43, 385–389. [Google Scholar] [CrossRef]
  125. Steagall, W.K.; Elmer, H.L.; Brady, K.G.; Kelley, T.J. Cystic fibrosis transmembrane conductance regulator-dependent regulation of epithelial inducible nitric oxide synthase expression. Am. J. Respir. Cell Mol. Biol. 2000, 22, 45–50. [Google Scholar] [CrossRef]
  126. Mhanna, M.J.; Ferkol, T.; Martin, R.J.; Dreshaj, I.A.; van Heeckeren, A.M.; Kelley, T.J.; Haxhiu, M.A. Nitric oxide deficiency contributes to impairment of airway relaxation in cystic fibrosis mice. Am. J. Respir. Cell Mol. Biol. 2001, 24, 621–626. [Google Scholar] [CrossRef] [Green Version]
  127. Keen, C.; Olin, A.C.; Edentoft, A.; Gronowitz, E.; Strandvik, B. Airway nitric oxide in patients with cystic fibrosis is associated with pancreatic function, Pseudomonas infection, and polyunsaturated fatty acids. Chest 2007, 131, 1857–1864. [Google Scholar] [CrossRef]
  128. Grasemann, H.; Ratjen, F. Nitric oxide and L-arginine deficiency in cystic fibrosis. Curr. Pharm. Des. 2012, 18, 726–736. [Google Scholar] [CrossRef]
  129. Grasemann, H.; Knauer, N.; Buscher, R.; Hubner, K.; Drazen, J.M.; Ratjen, F. Airway nitric oxide levels in cystic fibrosis patients are related to a polymorphism in the neuronal nitric oxide synthase gene. Am. J. Respir. Crit. Care Med. 2000, 162, 2172–2176. [Google Scholar] [CrossRef] [Green Version]
  130. Pifferi, M.; Bush, A.; Maggi, F.; Michelucci, A.; Ricci, V.; Conidi, M.E.; Cangiotti, A.M.; Bodini, A.; Simi, P.; Macchia, P.; et al. Nasal nitric oxide and nitric oxide synthase expression in primary ciliary dyskinesia. Eur. Respir. J. 2011, 37, 572–577. [Google Scholar] [CrossRef] [Green Version]
  131. Noone, P.G.; Leigh, M.W.; Sannuti, A.; Minnix, S.L.; Carson, J.L.; Hazucha, M.; Zariwala, M.A.; Knowles, M.R. Primary ciliary dyskinesia: Diagnostic and phenotypic features. Am. J. Respir. Crit. Care Med. 2004, 169, 459–467. [Google Scholar] [CrossRef] [Green Version]
  132. Degano, B.; Valmary, S.; Serrano, E.; Brousset, P.; Arnal, J.F. Expression of nitric oxide synthases in primary ciliary dyskinesia. Hum. Pathol. 2011, 42, 1855–1861. [Google Scholar] [CrossRef]
  133. Kuek, L.E.; Lee, R.J. First contact: The role of respiratory cilia in host-pathogen interactions in the airways. Am. J. Physiol. Lung Cell Mol. Physiol. 2020, 319, L603–L619. [Google Scholar] [CrossRef]
  134. Sisson, J.H.; Pavlik, J.A.; Wyatt, T.A. Alcohol stimulates ciliary motility of isolated airway axonemes through a nitric oxide, cyclase, and cyclic nucleotide-dependent kinase mechanism. Alcohol. Clin. Exp. Res. 2009, 33, 610–616. [Google Scholar] [CrossRef] [Green Version]
  135. McMahon, D.B.; Workman, A.D.; Kohanski, M.A.; Carey, R.M.; Freund, J.R.; Hariri, B.M.; Chen, B.; Doghramji, L.J.; Adappa, N.D.; Palmer, J.N.; et al. Protease-activated receptor 2 activates airway apical membrane chloride permeability and increases ciliary beating. FASEB J. 2018, 32, 155–167. [Google Scholar] [CrossRef] [Green Version]
  136. Forstermann, U.; Sessa, W.C. Nitric oxide synthases: Regulation and function. Eur. Heart J. 2012, 33, 829–837. [Google Scholar] [CrossRef] [Green Version]
  137. Ortiz, P.A.; Garvin, J.L. Trafficking and activation of eNOS in epithelial cells. Acta Physiol. Scand. 2003, 179, 107–114. [Google Scholar] [CrossRef]
  138. Dudzinski, D.M.; Michel, T. Life history of eNOS: Partners and pathways. Cardiovasc. Res. 2007, 75, 247–260. [Google Scholar] [CrossRef]
  139. Davis, B.J.; Xie, Z.; Viollet, B.; Zou, M.H. Activation of the AMP-activated kinase by antidiabetes drug metformin stimulates nitric oxide synthesis in vivo by promoting the association of heat shock protein 90 and endothelial nitric oxide synthase. Diabetes 2006, 55, 496–505. [Google Scholar] [CrossRef] [PubMed] [Green Version]
  140. Chen, Z.P.; Mitchelhill, K.I.; Michell, B.J.; Stapleton, D.; Rodriguez-Crespo, I.; Witters, L.A.; Power, D.A.; Ortiz de Montellano, P.R.; Kemp, B.E. AMP-activated protein kinase phosphorylation of endothelial NO synthase. FEBS Lett. 1999, 443, 285–289. [Google Scholar] [CrossRef] [Green Version]
  141. Thors, B.; Halldorsson, H.; Thorgeirsson, G. eNOS activation mediated by AMPK after stimulation of endothelial cells with histamine or thrombin is dependent on LKB1. Biochim. Biophys. Acta 2011, 1813, 322–331. [Google Scholar] [CrossRef] [PubMed] [Green Version]
  142. Dasgupta, B.; Chhipa, R.R. Evolving Lessons on the Complex Role of AMPK in Normal Physiology and Cancer. Trends Pharmacol. Sci. 2016, 37, 192–206. [Google Scholar] [CrossRef] [Green Version]
  143. Murphy, B.A.; Fakira, K.A.; Song, Z.; Beuve, A.; Routh, V.H. AMP-activated protein kinase and nitric oxide regulate the glucose sensitivity of ventromedial hypothalamic glucose-inhibited neurons. Am. J. Physiol. Cell Physiol. 2009, 297, C750–C758. [Google Scholar] [CrossRef] [Green Version]
  144. Morrow, V.A.; Foufelle, F.; Connell, J.M.; Petrie, J.R.; Gould, G.W.; Salt, I.P. Direct activation of AMP-activated protein kinase stimulates nitric-oxide synthesis in human aortic endothelial cells. J. Biol. Chem. 2003, 278, 31629–31639. [Google Scholar] [CrossRef] [Green Version]
  145. El-Mas, M.M.; Fan, M.; Abdel-Rahman, A.A. Facilitation of myocardial PI3K/Akt/nNOS signaling contributes to ethanol-evoked hypotension in female rats. Alcohol. Clin. Exp. Res. 2009, 33, 1158–1168. [Google Scholar] [CrossRef]
  146. Dimmeler, S.; Fleming, I.; Fisslthaler, B.; Hermann, C.; Busse, R.; Zeiher, A.M. Activation of nitric oxide synthase in endothelial cells by Akt-dependent phosphorylation. Nature 1999, 399, 601–605. [Google Scholar] [CrossRef]
  147. Michell, B.J.; Chen, Z.; Tiganis, T.; Stapleton, D.; Katsis, F.; Power, D.A.; Sim, A.T.; Kemp, B.E. Coordinated control of endothelial nitric-oxide synthase phosphorylation by protein kinase C and the cAMP-dependent protein kinase. J. Biol. Chem. 2001, 276, 17625–17628. [Google Scholar] [CrossRef] [Green Version]
Figure 1. HSP90 inhibition reduces T2R-stimulated intracellular NO production in H441 cells grown at the air–liquid interface (ALI). (A): Representative image of DAF-FM-loaded H441 ALIs stimulated for 10 min with 1 mM sodium benzoate (NaBenz.) or denatonium benzoate (denat benz.); fluorescence increased with denatonium benzoate but not sodium benzoate. (B): Average trace and bar graph (mean ± SEM) of four experiments as in (A). Significance determined by Student’s t-test; ** p < 0.01. (C): Average trace and bar graph (mean ± SEM of three experiments) showing response in cultures pre-loaded with BAPTA-AM and stimulated in the absence of extracellular Ca2+ (0-Ca2+o) vs. control cultures pre-incubated with 0.1% DMSO only and stimulated in the presence of extracellular Ca2+. (D): Denatonium-induced DAF-FM fluorescence increases in H441 ALIs were inhibited by pretreatment with geldanamycin or L-NAME but not HSP70 inhibitor VER-15508. Average trace and bar graph of results from four independent experiments are shown. Significance determined by one-way ANOVA with Dunnett’s post-test comparing all values to control (denatonium only); ** p < 0.01.
Cells 11 01478 g001
Figure 2. HSP90 inhibition reduces T2R-stimulated NO diffusion into the airway surface liquid (ASL) in H441 cells grown at the air–liquid interface (ALI) (A): Representative images and bar graph of 4 independent experiments of fluorescence at the apical plane of ALI when 100 µL of solution containing cell impermeable DAF-2 was placed on top (1.1 cm2 Transwell) either containing sodium benzoate (top) or denatonium benzoate (bottom). Cultures were either pretreated with 0.1% DMSO (vehicle control), 10 µM PLC inhibitor U73122, or 10 µM inactive analogue U73343 prior to the experiment. Significance determined by one-way ANOVA with Dunnett’s post-test comparing all values to HBSS only control. (B): Bar graph of experiments performed as in (A) but testing inhibition of denatonium-induced or quinine-induced ASL DAF-2 fluorescence ± NOS inhibitor L-NAME or inactive D-NAME (10 µM). Bar graph shows the mean ± SEM of 3–5 independent experiments imaged at identical conditions. Significance by one-way ANOVA with Bonferroni post-test comparing all values to respective HBSS control; ** p < 0.01. (C): Denatonium-stimulated H441 DAF-2 ASL fluorescence increases were reduced in the presence of GPCR signaling inhibitor YM254890 or HSP90 inhibitors geldanamycin, 17-AAG, or BIIB 021. HSP70 inhibitor VER-15508 had no effect. Bar graph shows the mean ± SEM of four independent experiments. Significance by one-way ANOVA with Dunnett’s post-test comparing all values to control (0.1% DMSO only); * p < 0.05 and ** p < 0.01. (D): H441s were treated with siRNA as described in the methods. ASL DAF-2 responses during denatonium stimulation were reduced by eNOS siRNA but not with scramble, nNOS, or PAR-2 siRNA. Bar graph shows the mean ± SEM of four independent experiments (separate siRNA transfections). Significance by one-way ANOVA with Dunnett’s post-test comparing all values to control; ** p < 0.01.
Cells 11 01478 g002
Figure 3. T2R bitter taste receptor expression in airway cell cilia. Representative images of cilia marker β-tubulin IV (green), T2R38 (cyan) and T2R14 (magenta) immunofluorescence in an apical confocal section of primary human sinonasal ALI. (Left) shows conventional look-up table (LUT) and (right) shows inverted LUT. Scale bar is 20 µm.
Cells 11 01478 g003
Figure 4. HSP90 inhibition reduces T2R-stimulated intracellular NO production in primary sinonasal epithelial cells grown at the air–liquid interface (ALI). (A): Intracellular DAF-FM increases were measured in response to T2R38-agonist PTC (1 mM) followed by NO donor SNAP (25 µM) as positive control. PTC stimulated NO production in ALIs from PAV/PAV (homozygous functional T2R38) but not AVI/AVI (homozygous non-functional T2R38) ALIs (nonfunctional T2R38) patients. Geldanamycin pretreatment inhibited the NO production in PAV/PAV ALIs. Trace and bar graph show the mean ± SEM of 8–10 experiments per condition using ALIs from 4–5 patients. Significance determined by one-way ANOVA with Tukey–Kramer post-test comparing all values; ** p < 0.01. (B): Traces of DAF-FM fluorescence in PAV/AVI (heterozygous T2R38) cultures stimulated with T2R14/39 agonist apigenin (100 µM) shown with 0.1% DMSO vehicle control. Pretreatment with T2R14/39 antagonist 4′-fluoro-6-methoxyflavanone (4′-F-6-MF) or HSP90 inhibitor geldanamycin but not 0.1% DMSO (inhibitor vehicle control) reduced apigenin-induced but not SNAP-induced DAF-FM fluorescence increases. (C): Traces of DAF-FM fluorescence in PAV/AVI (heterozygous T2R38) cultures stimulated with T2R14 agonist quercetin (50 µM). Pretreatment with T2R14/39 antagonist 4′-fluoro-6-methoxyflavanone (4′-F-6-MF) or HSP90 inhibitor geldanamycin but not 0.1% DMSO (inhibitor vehicle control) reduced quercetin-induced but not SNAP-induced DAF-FM fluorescence increases. (D): Bar graph of intracellular DAF-FM fluorescence increases after 2 min stimulation from experiments as in (C,D). Stimulation (DMSO vehicle control, apigenin, quercetin, or SNAP) listed on top and pretreatment (DMSO vehicle control, 4′-F-6-MF, or geldanamycin) listed on the bottom. Each data point is an independent experiment (n = 4–8 per condition). Significance by Bonferroni post-test; * p < 0.05 vs. bracketed bars; # p < 0.05 vs. DMSO alone.
Cells 11 01478 g004
Figure 5. HSP90 inhibition reduces T2R-stimulated NO diffusion into the airway surface liquid (ASL) in primary sinonasal epithelial cells grown at the air–liquid interface (ALI) Experiments were performed as in Figure 2 to measure NO diffusion into the ASL but with primary nasal ALIs. (A): PTC (500 µM) or 3oxoC12HSL (100 µM) stimulated extracellular DAF-2 fluorescence in PAV/PAV and AVI/AVI cultures, as indicated. PAV/PAV cultures were also pretreated with HSP90 inhibitors geldanamycin, 17-AAG, or BIIB 021 or HSP70 inhibitor VER-155008. (B): shows experiments with apigenin ± 4′-F-6-MF, geldanamycin, 17-AAG, or PLC inhibitor U73122 and inactive analogue U73343. Control Transwells containing no cells were similarly incubated with vehicle only or apigenin to test for any cell-independent reaction of apigenin with DAF-2. Significance by one way ANOVA with Bonferroni post-test; * p < 0.05 vs. bracketed bars; ** p < 0.01 vs. bracketed bars; ## p < 0.05 for the same condition in PAV/PAV vs AVI/AVI cultures.
Cells 11 01478 g005
Figure 6. HSP90 inhibition reduces T2R-stimulated ciliary beating in primary sinonasal epithelial cells. (A): Left shows representative normalized CBF responses (representative experiments shown) to T2R14/39 agonist apigenin in human primary sinonasal ALIs ± T2R14/39 inhibitor 4′-fluoro-6-methoxyflavanone. Right shows normalized CBF responses (representative experiments shown) to apigenin ± geldanamycin (10 µM; 5 min pretreatment). Mean baseline CBF was not with vehicle or 4′-fluoro-6-methoxyflavanone pretreatment (7.5 ± 1.1 Hz or 8.2 ± 0.9 Hz, respectively; not significant by Students’ t-test). Mean baseline CBF was also not different before or after vehicle or geldanamycin pretreatment (6.9 ± 1.7 Hz or 7.9 ± 1.2 Hz, respectively; not significant by Students’ t-test). (B): Bar graph of the mean ± SEM of CBF responses from five independent experiments as shown in (A) using ALIs from four different patients. Significance determined by one-way ANOVA with Bonferroni post-test; * p < 0.05. (C): Left shows representative normalized CBF responses (representative experiments shown) to T2R14/39 agonist quercetin in human ALIs ± T2R14/39 inhibitor 4′-fluoro-6-methoxyflavanone. Mean baseline CBF was not with vehicle or 4′-fluoro-6-methoxyflavanone pretreatment (7.3 ± 1.2 Hz or 7.9 ± 0.6 Hz, respectively; not significant by Students’ t-test). Right shows normalized CBF responses (representative experiments shown) to quercetin ± geldanamycin (10 µM; 5 min pretreatment). Mean baseline CBF was not different before or after vehicle or geldanamycin pretreatment (7.4 ± 1.3 Hz or 7.0 ± 0.9 Hz, respectively; not significant by Students’ t-test). (D): Bar graph of the mean ± SEM of CBF responses from five independent experiments as shown in C using ALIs from five different patients. Significance determined by one-way ANOVA with Bonferroni post-test; ** p < 0.01.
Cells 11 01478 g006
Figure 7. HSP90 inhibition reduces epithelial ciliary response to P. aeruginosa conditioned medium. (A): Graph shows real-time measurement of CBF (mean ± SEM of six independent experiments using ALIs from three patients) during prolonged geldanamycin treatment, followed by stimulation with purinergic agonist ATP. (B): Primary nasal ALIs genotyped for functional T2R38 (TAS2R38 PAV/PAV) or non-functional T2R38 (TAS2R38 AVI/AVI) were stimulated with diluted HBSS in which P. aeruginosa PAO-1 had been incubated overnight (conditioned HBSS; cHBSS, diluted with unconditioned HBSS). Peak CBF responses to PAO-1 cHBSS were greater in PAV/PAV cells vs. AVI/AVI cells. Representative trace shown from five experiments using cultures from separate individual patients. (C): PAV/PAV cells were stimulated with cHBSS from PAO-1 or PAO-JP2, which lacks the ability to produce AHLs. PAO-1 cHBSS stimulated CBF increases that were greater than CBF increases observed with PAO-JP2 cHBSS. Representative trace shown from five experiments using cultures from separate individual patients. (D): PAV/PAV cells were stimulated with PAO-1 cHBSS ± geldanamycin pretreatment. Representative trace shown from five experiments using cultures from separate individual patients. (E): Bar graph showing peak CBF (mean ± SEM with individual data points showing individual experiments) observed from experiments as in F-H. Asterisks represent significance compared with PAV/PAV + PAO-1 cHBSS at each individual concentration, determined by Sidak’s multiple comparison test; * p < 0.05 and ** p < 0.01.
Cells 11 01478 g007
Figure 8. HSP90 inhibition reduces nasal epithelial bacterial killing mediated by T2Rs and NO. P. aeruginosa PAO-1 bacteria were incubated with nasal ALI cultures as described in the methods. (A): Bar graph showing live (Syto9)/dead (propidium iodide [PI]) staining quantified by fluorescence plate reader. First two bars represent bacteria incubated in the absence of nasal cells treated with saline only or saline + colistin. This illustrates max (saline) and min (colistin) live/dead ratios. Significance by one way ANOVA with Bonferroni post-test; ** p < 0.01 between bracketed groups; # p < 0.05 and ## p < 0.01 vs. PAV/PAV cultures with no inhibitor. (B): Representative image (left) and bar graph (right) showing CFU counts from experiments as shown in (A). HSP90 inhibitor geldanamycin reduced bacterial killing (increased CFUs) while HSP70 inhibitor VER 155008 did not. Significance by one-way ANOVA with Dunnett’s post test comparing all values to PAV/PAV control (no inhibitor); ## p < 0.01 vs. PAV/PAV control.
Cells 11 01478 g008
Figure 9. HSP90 inhibition reduces T2R-stimulated NO production in primary human M0 MΦs. (A): DAF-FM-loaded MΦs exhibited increases in fluorescence in response to 1 mM denatonium benzoate that were strongly inhibited by geldanamycin. Left shows average traces and right shows bar graphs (mean ± SEM) from eight independent experiments using MΦs from two donors. DAF-FM fluorescence increase was also inhibited by BIIB 021. Control = denatonium benzoate after pretreatment with 0.1% DMSO. Significance by one way ANOVA with Bonferroni posttest; * p < 0.05. (B): Low-level Ca2+ responses to denatonium benzoate were not affected by geldanamycin. Top shows representative traces in the absence or presence of 1 µM geldanamycin. Bottom shows bar graph of six independent experiments using MΦs from three different donors. Response to purinergic agonist ATP shown as control. (C): NO production in MΦs treated with HSP90 or control non-targeting siRNAs. Left shows representative traces and right shows bar graph of data from four independent experiments per condition. Significance by Student’s t-test; ** p < 0.01.
Cells 11 01478 g009
Figure 10. HSP90 inhibition reduces T2R-stimulated FITC-E. coli phagocytosis in primary human M0 MΦs. (A): Representative image of MΦs with phagocytosed FITC-labeled E. coli. (B): Left shows time course of phagocytosis responses during 30 min incubation in HBSS as described in the methods after pretreatment with geldanamycin or HBSS for times indicated on the y-axis. Each data point is the mean ± SEM of three independent experiments using MΦs from three different donors. Right shows separate experiments of baseline phagocytosis over 30 min (HBSS only) of FITC-E. coli after 2 h pretreatment with HBSS only (containing 0.1% DMSO as vehicle control), 1 µM VER-15508, 1 µM geldanamycin, or geldanamycin plus VER-15508. Significance determined by one-way ANOVA with Dunnett’s post-test comparing values to HBSS pretreatment; * p < 0.05, ** p < 0.01. Bar graph shows the mean ± SEM of six experiments using MΦs from three donors. (C): Stimulated 30 min phagocytosis of FITC-E. coli (HBSS only control or 1 mM denat. benz. ± pertussis toxin [PTX]) was measured after pre-incubation with HBSS + 0.1% DMSO or 1 µM geldanamycin. PTX and geldanamycin both inhibited denatonium-induced phagocytosis. Significance determined by one-way ANOVA with Bonferroni post-test; ** p < 0.01 vs. HBSS control and ## p < 0.01 vs. bracketed groups. (D): Geldanamycin reduced phagocytosis increases observed with both denatonium and quinine. Bar graph shows the mean ± SEM of six independent experiments using cells from six different individual patients. Significance by one way ANOVA with Tukey–Kramer post-test comparing all bars; ** p < 0.01 vs. HBSS alone; ## p < 0.01 vs. bracketed bar. (E): Assays were carried out in MΦs previously treated with siRNAs directed against eNOS, iNOS, HSP90, or non-targeting control sequences. Bar graph shows increase in phagocytosis relative to HBSS in the same macrophage background over four independent experiments. Significance compared with no siRNA control using one-way ANOVA with Bonferroni post-test and pairwise comparisons; * p < 0.05 and ** p < 0.01.
Cells 11 01478 g010
Figure 11. HSP90 inhibition reduces T2R-stimulated pHrodo-S. aureus phagocytic responses in primary human M0 MΦs. (A): Representative images of pHrodo-labeled S. aureus phagocytosis in primary human MΦs ± denatonium benzoate (1 mM) stimulation after D-NAME or L-NAME pretreatment (10 µM; 45 min). (B): Bar graph of pHrodo-S. aureus fluorescence after experiments as in A. Significance by Bonferroni post-test with paired comparisons; ** p < 0.01. (C): Representative images of pHrodo-labeled S. aureus phagocytosis in primary human MΦs ± denatonium benzoate (1 mM) or 3oxoC12HSL (100 µM) after no-pretreatment (0.1% DMSO only as vehicle control)) or pretreatment with HSP90 inhibitors geldanamycin or BIIB 021 (pretreatment as in Figure 8). (D): Bar graph of pHrodo-S. aureus phagocytosis during stimulation with HBSS only (unstimulated control), 1 mM denatonium benzoate, or 100 µM 3oxoC12HSL ± geldanamycin or BIIB 021 (pretreatment as in Figure 9). Significance by one-way ANOVA with Bonferroni post-test; * p < 0.05 or ** p < 0.01. (E): Bar graph of pHrodo-S. aureus phagocytosis during stimulation with HBSS only (unstimulated control) or 1 mM denatonium benzoate ± pertussis toxin (PTX), geldanamycin, BIIB 021, 17-AAG, or VER 15508. PTX (500 ng/mL) pretreatment was 18 h. MΦs were pretreated with other inhibitors as in Figure 9. Significance by one-way ANOVA with Bonferroni post-test; ** p < 0.01.
Cells 11 01478 g011
Publisher’s Note: MDPI stays neutral with regard to jurisdictional claims in published maps and institutional affiliations.

