
Cytotoxicity and Wound Closure Evaluation in Skin Cell Lines after Treatment with Common Antiseptics for Clinical Use


 ,
,  , ,
, ,  and
and 
Abstract
:
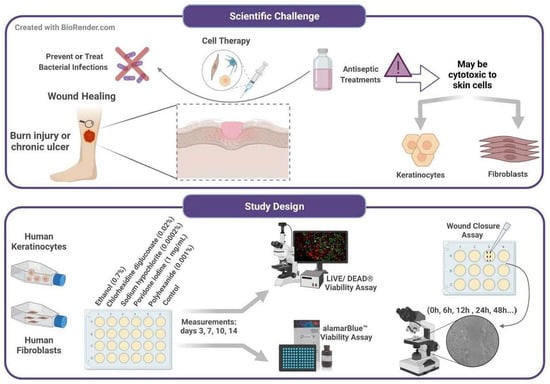
1. Introduction
2. Materials and Methods
2.1. Cell Isolation and Culture
2.2. Cell Viability Assays with Antiseptics
2.2.1. Live/Dead® Cell Viability Assay
2.2.2. AlamarBlue Cell Proliferation Assay
2.3. Wound Closure Assay
2.4. Statistical Analysis
3. Results
3.1. High Concentrations of Antiseptics Cause a Total Reduction of Cell Viability in Skin Cell Lines
3.2. Common Antiseptics for Clinical Use Diluted to 1% Affect Cell Viability in Skin Cell Lines
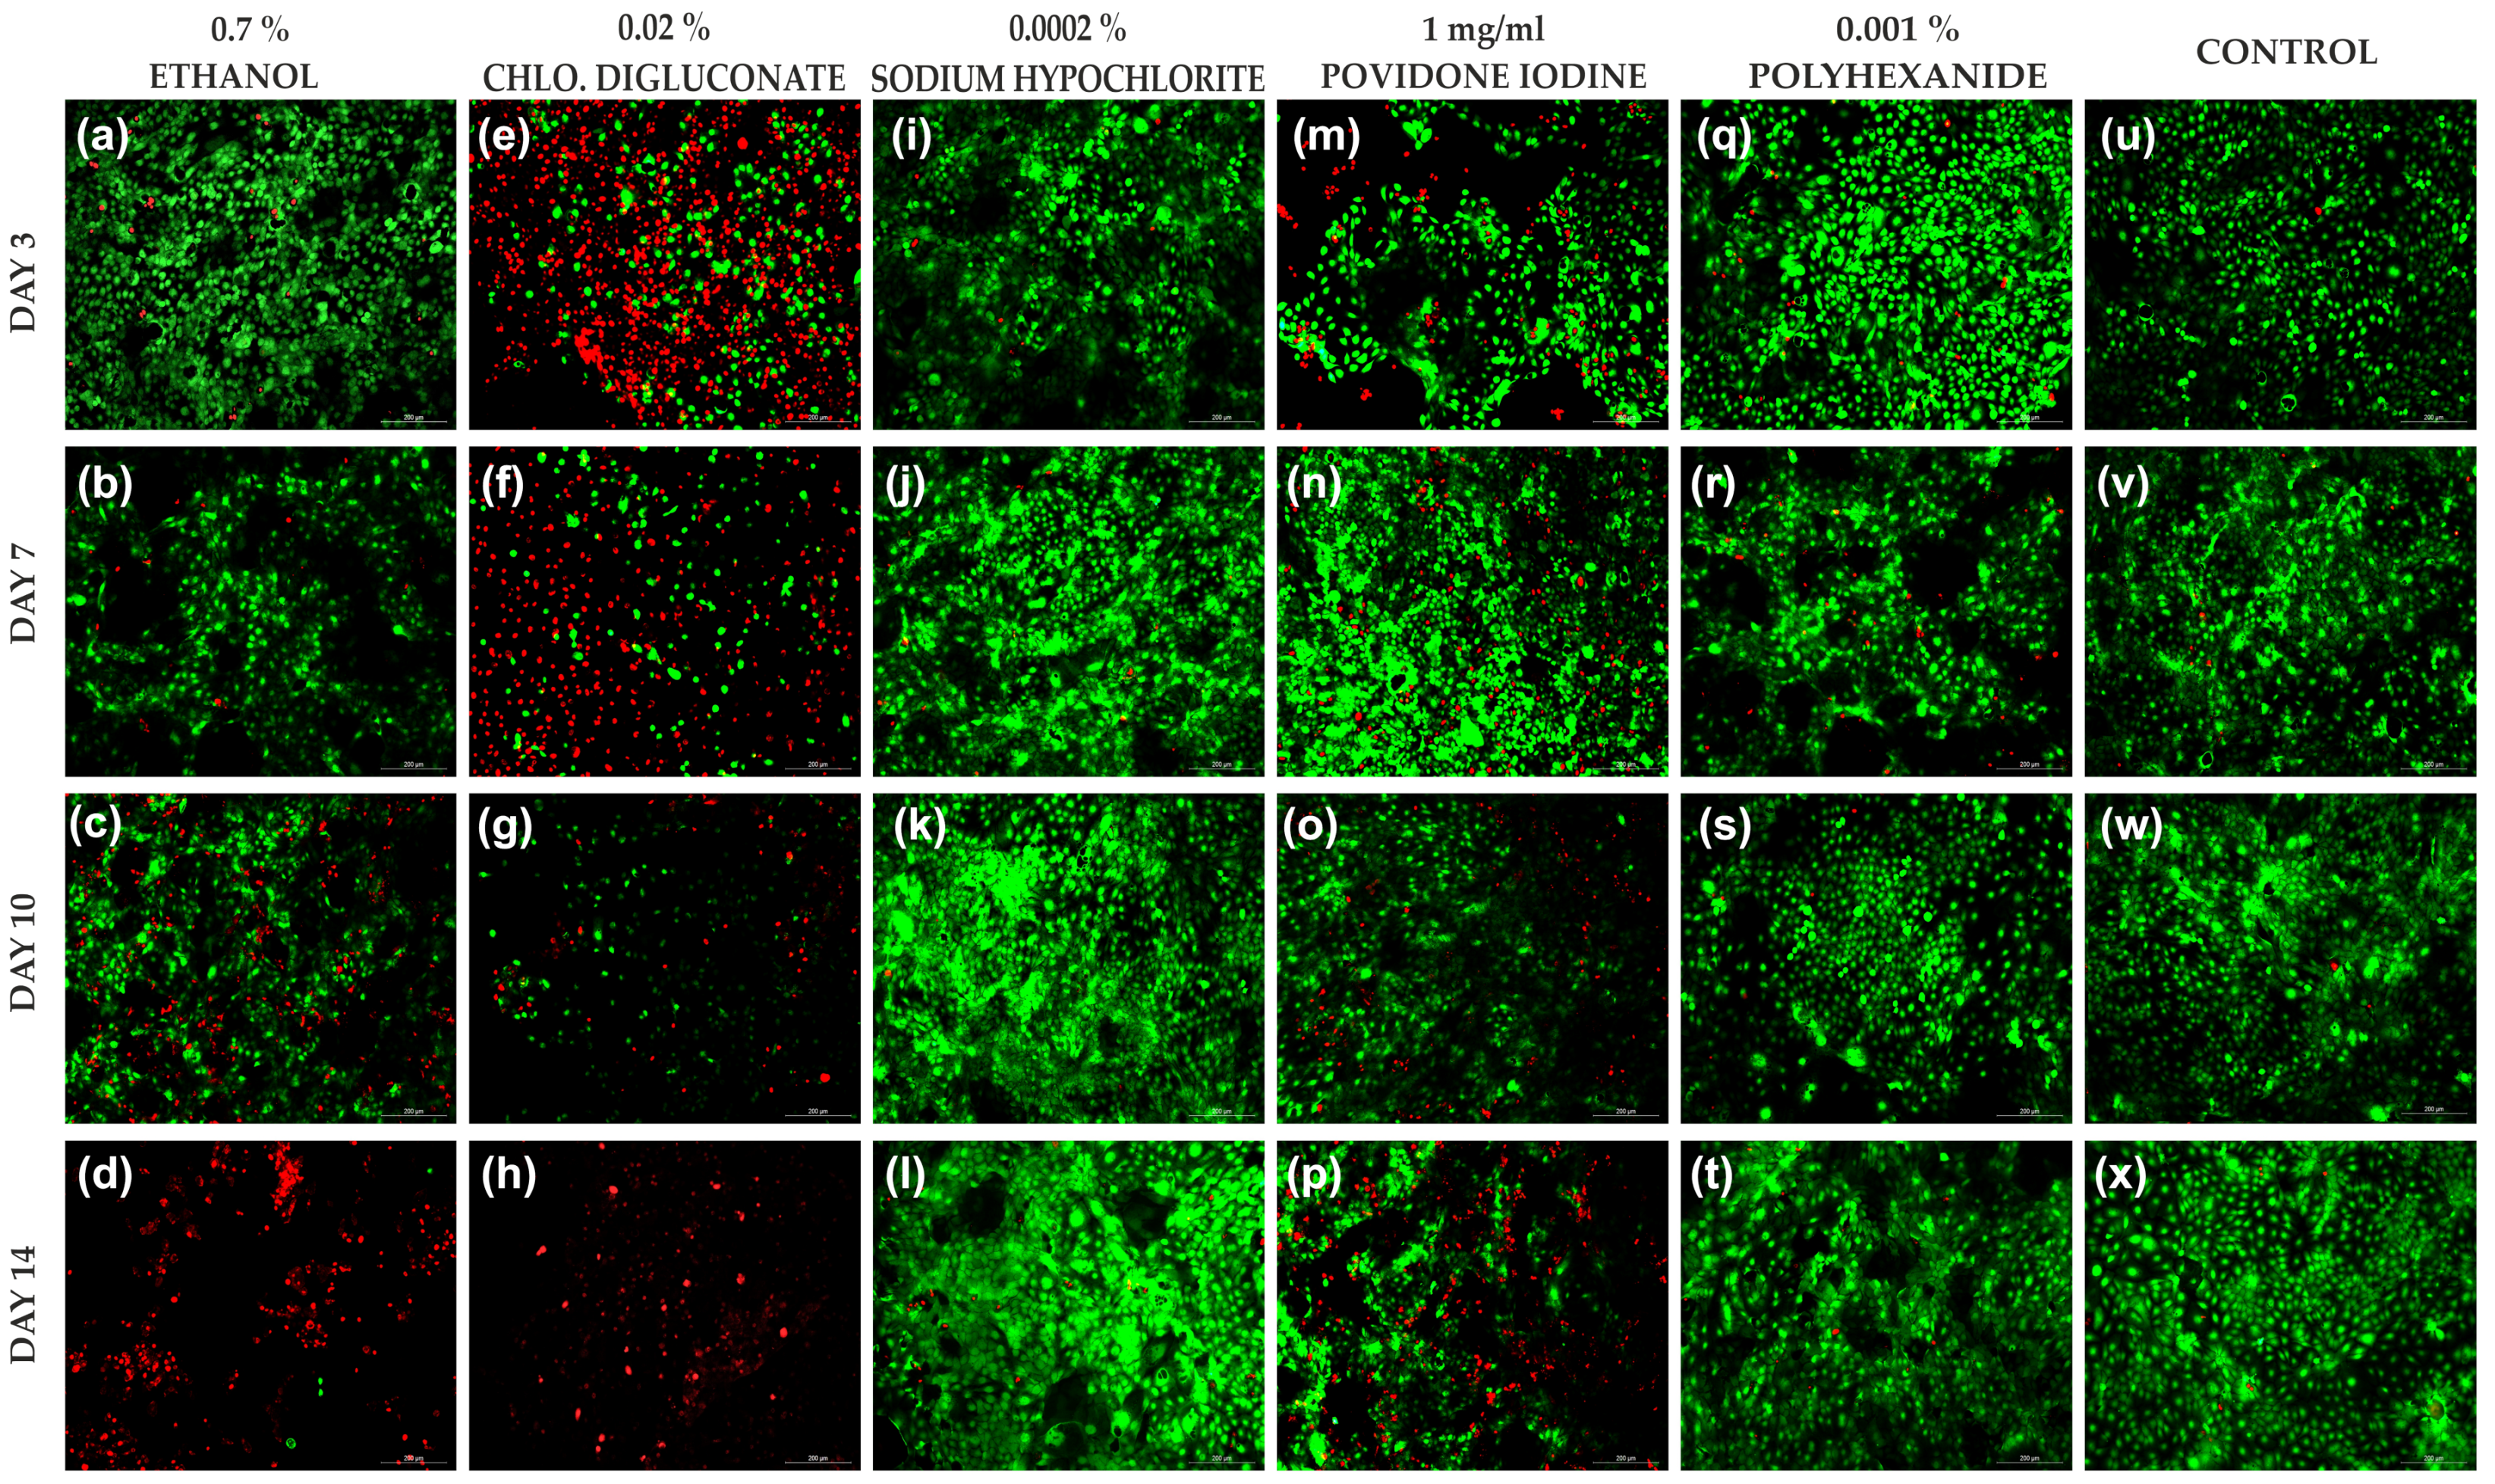
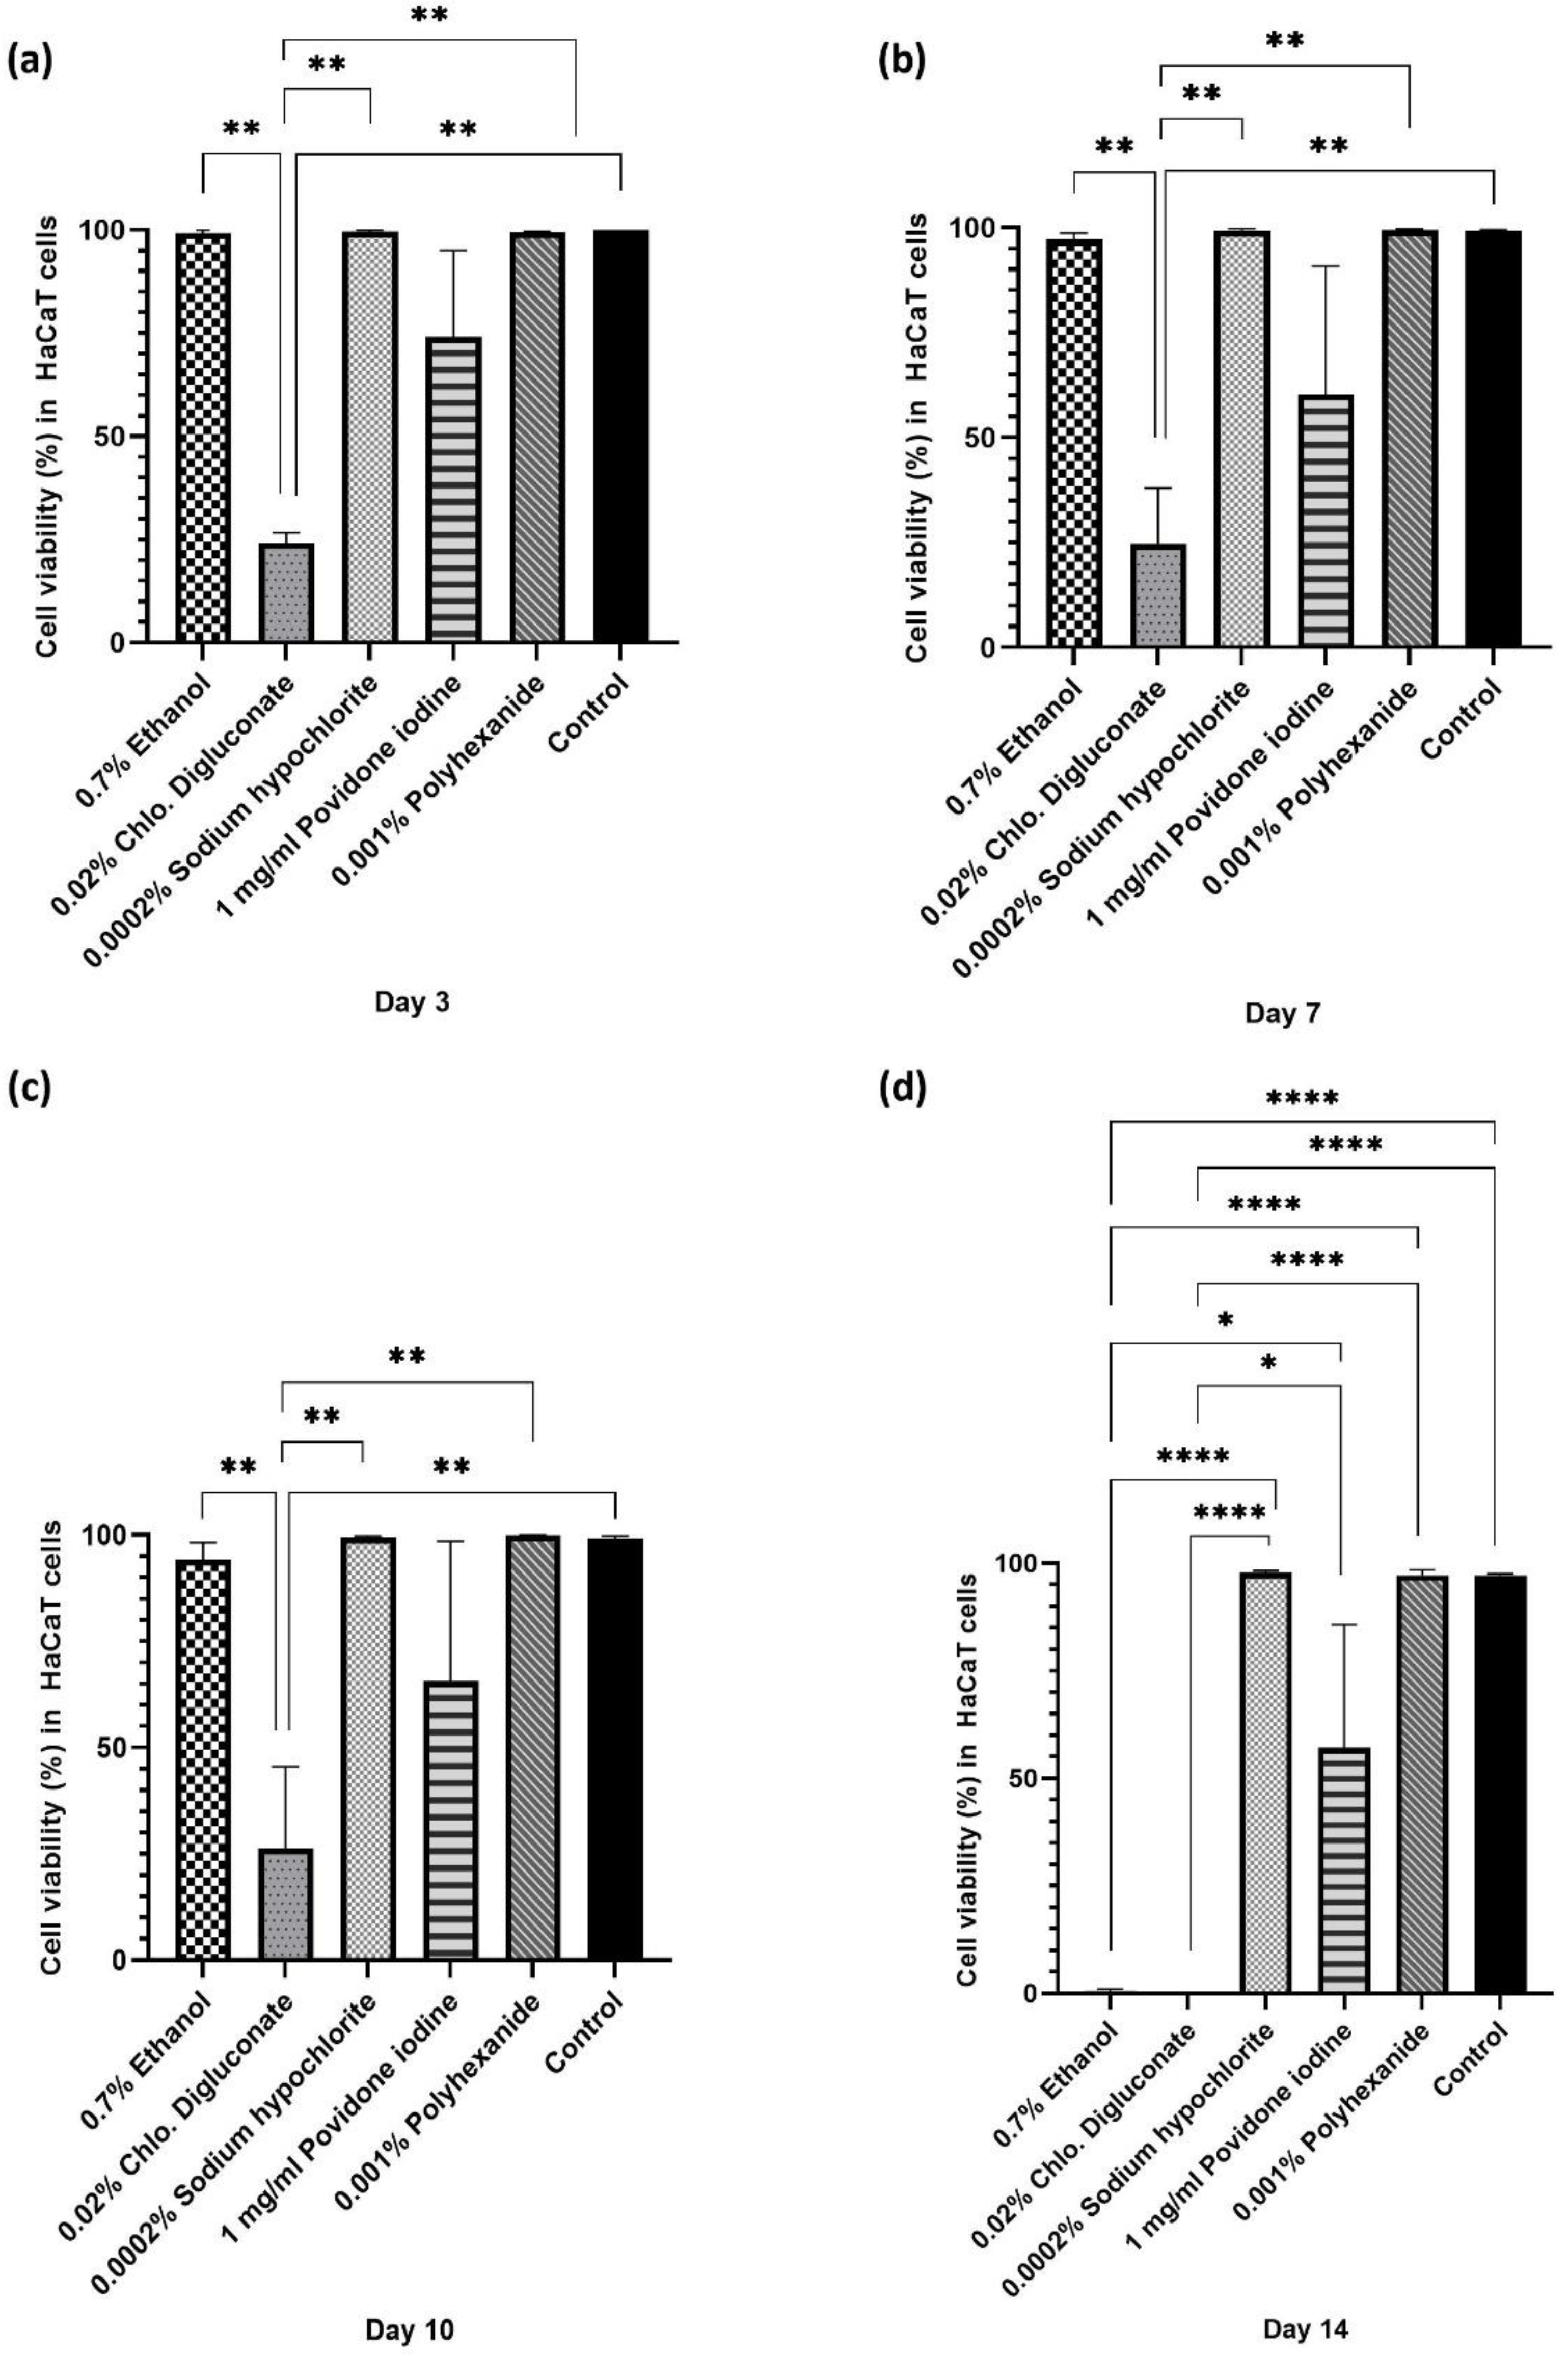
3.2.1. Chlorhexidine Digluconate and Ethanol Affected the Viability of HaCaT Cells More Than the Other Treatments
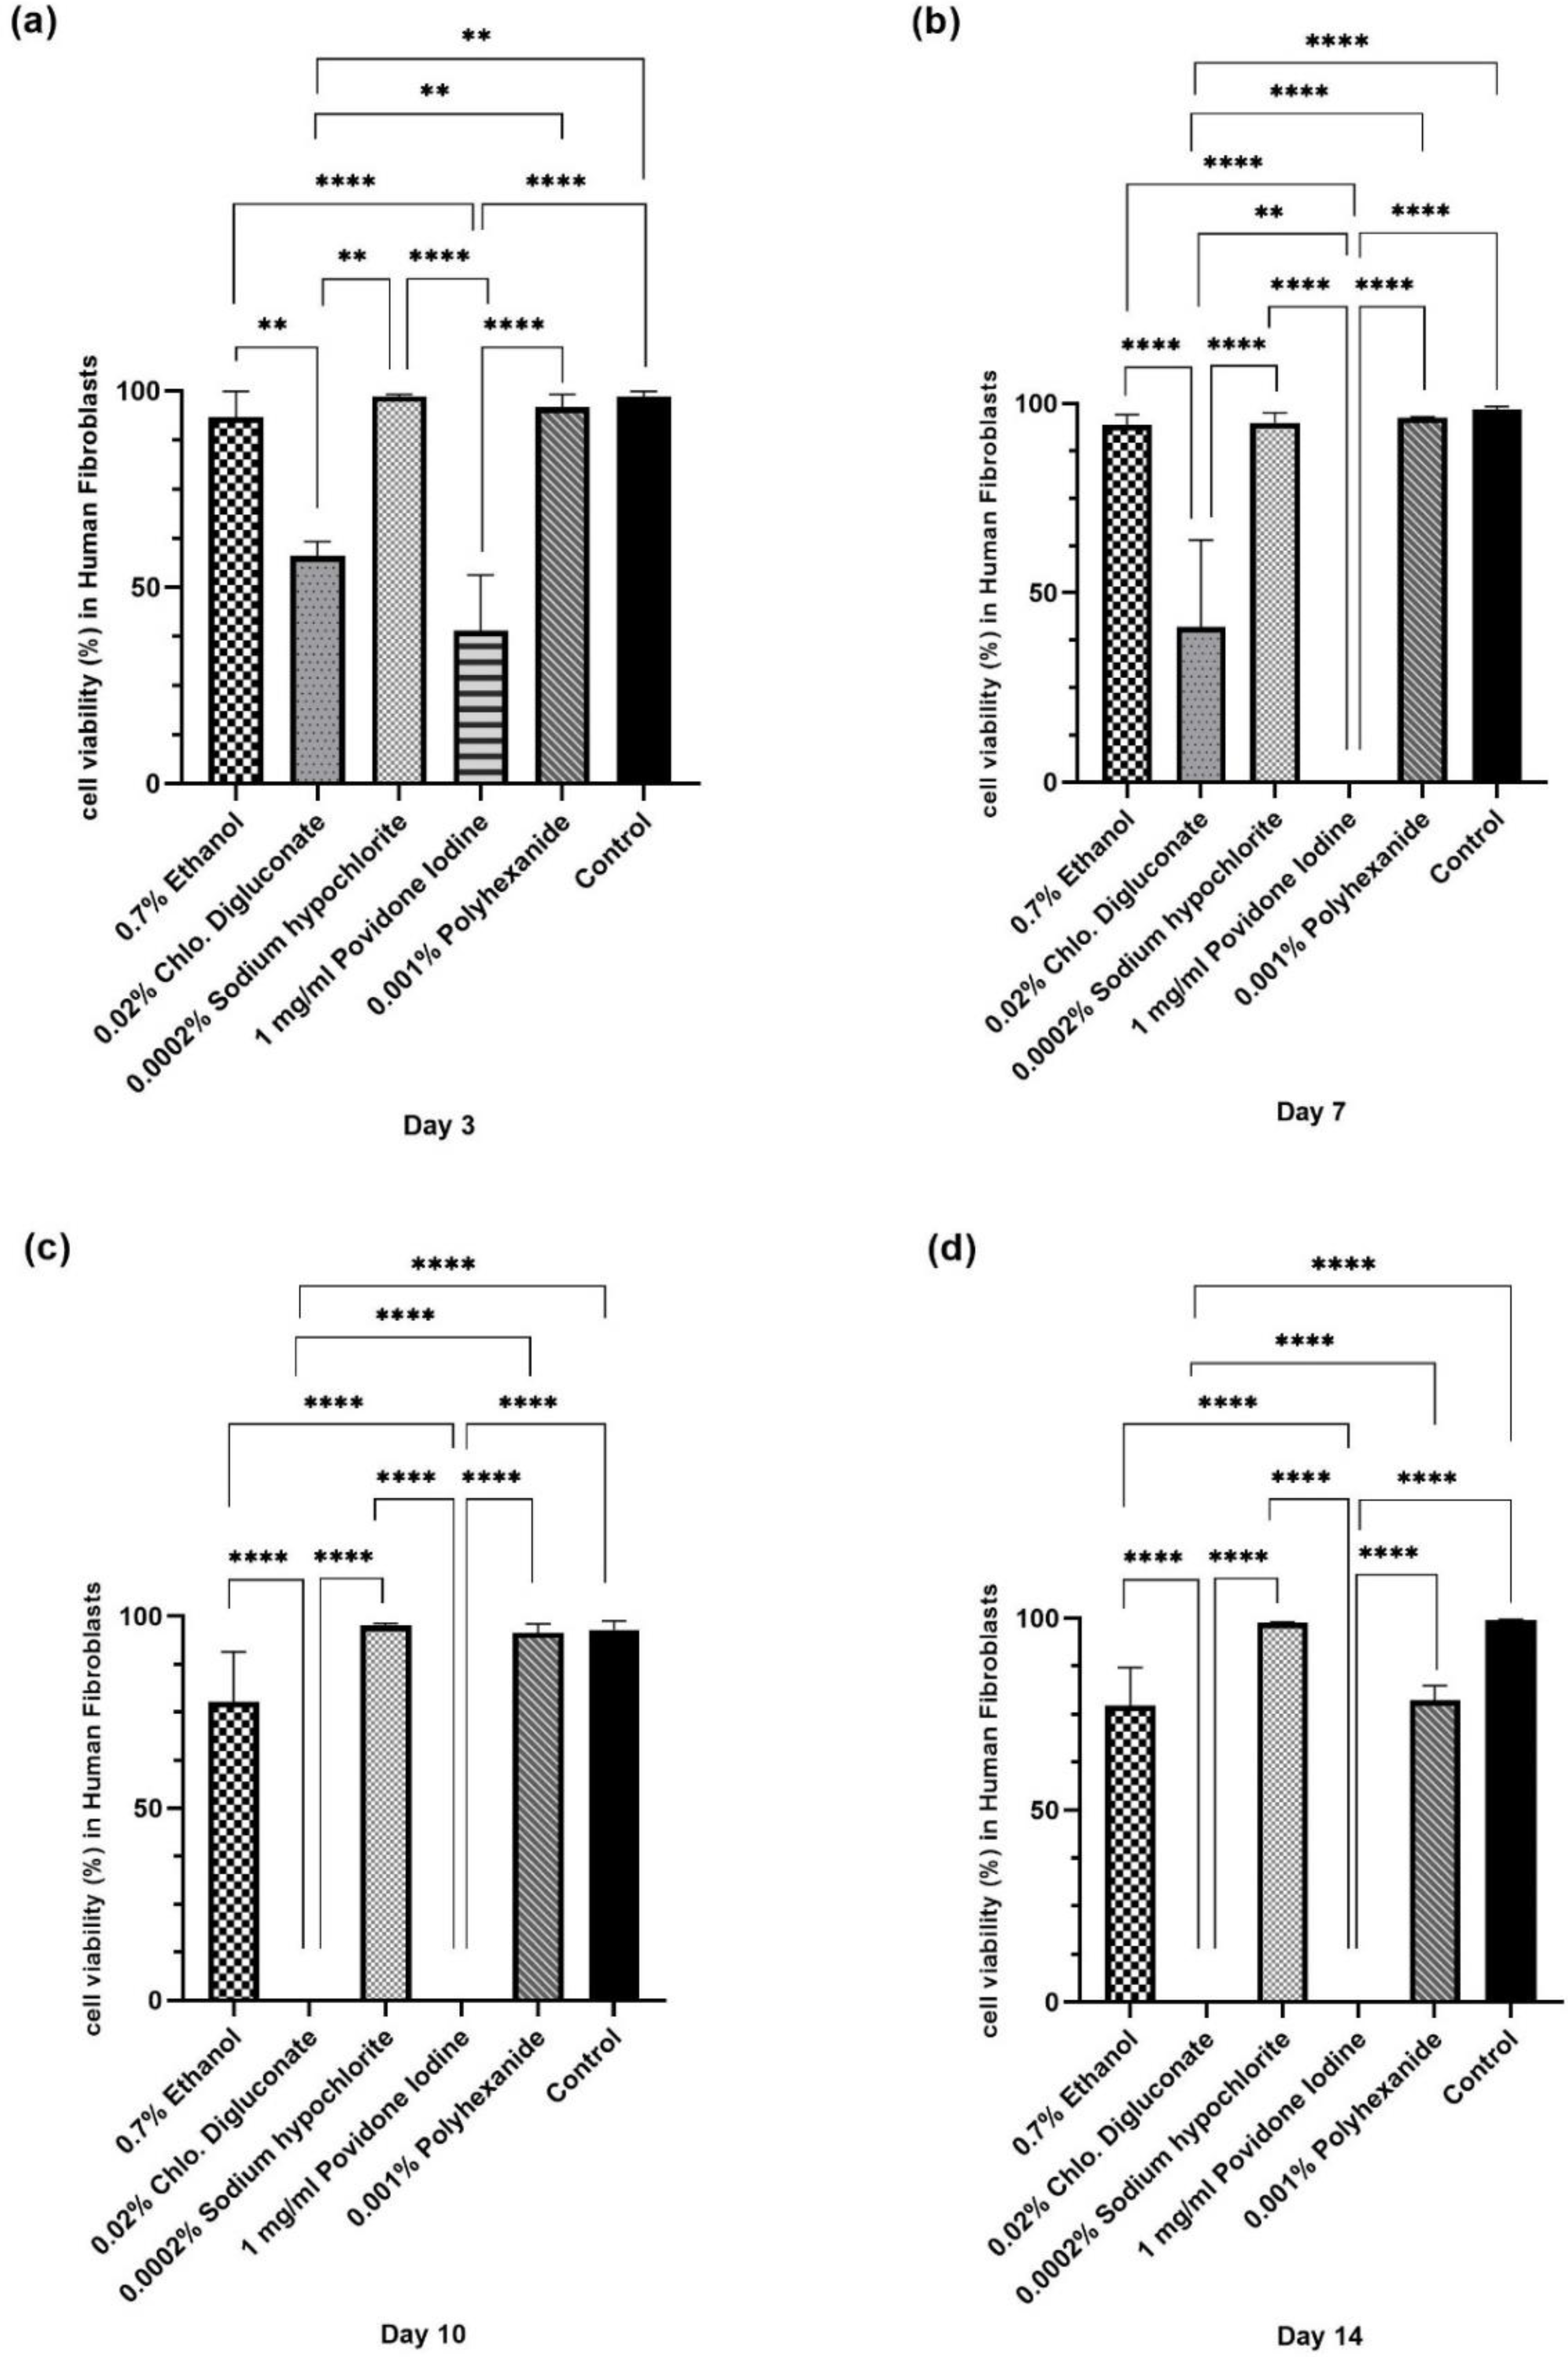
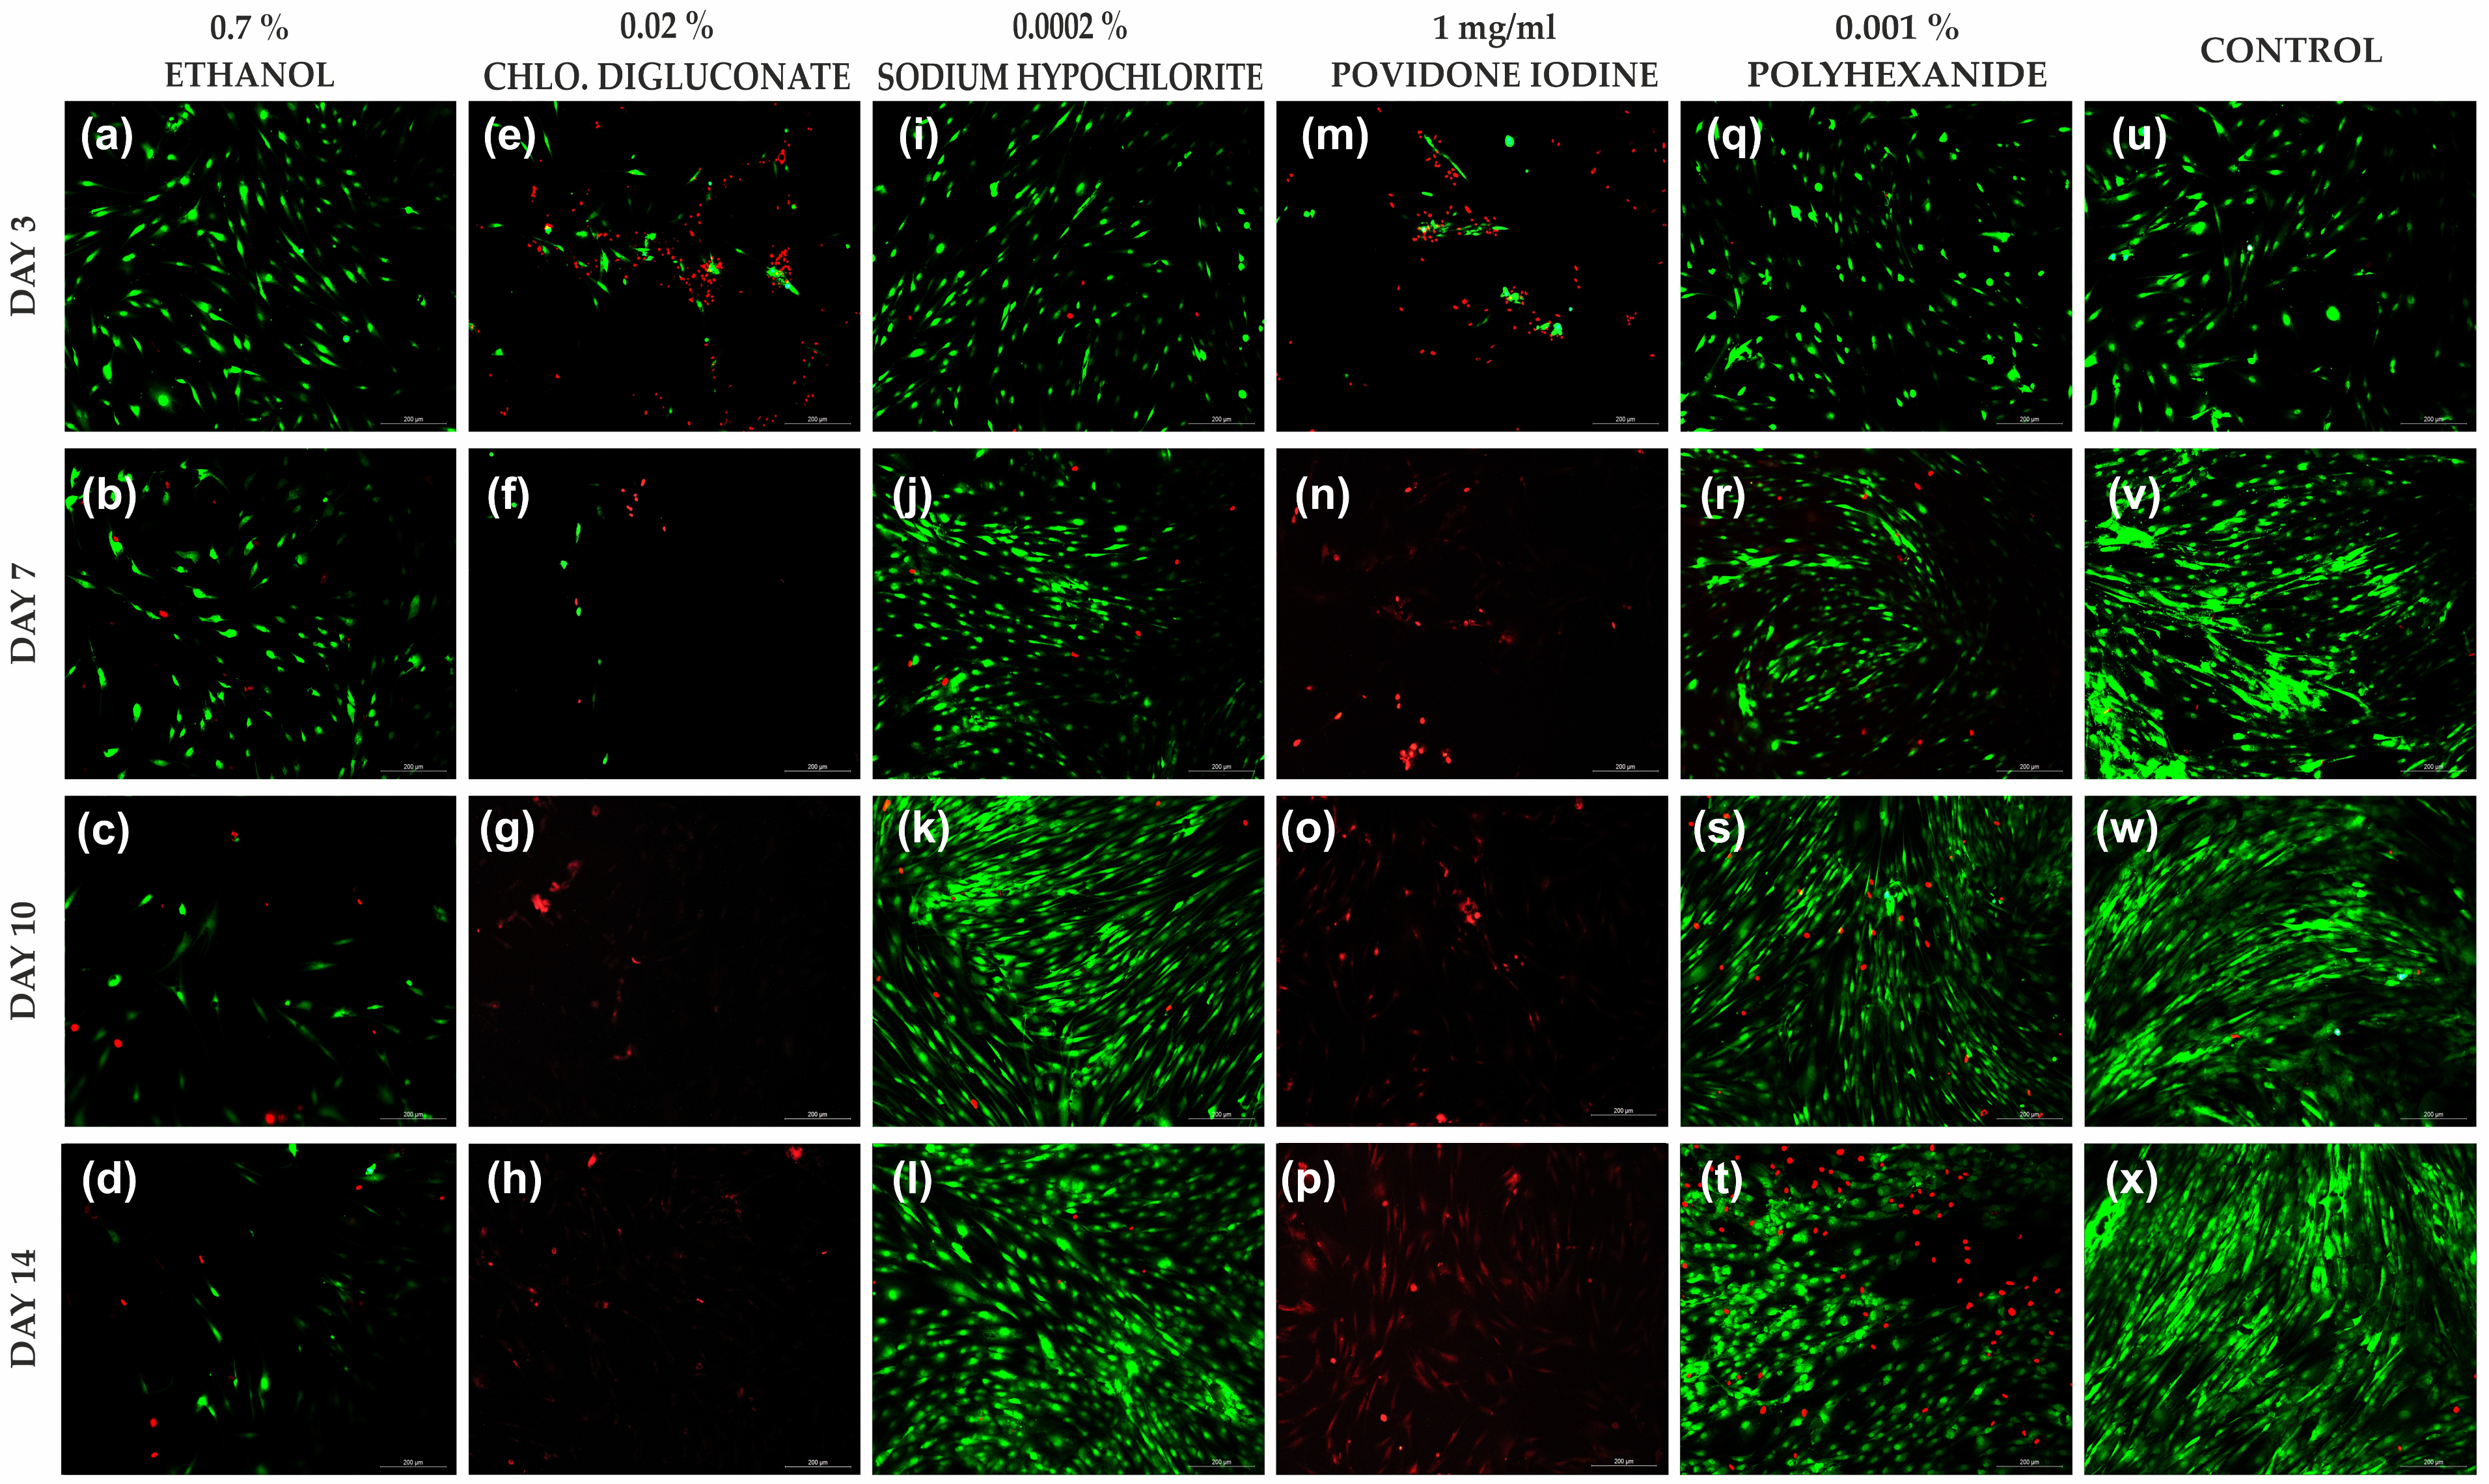
3.2.2. Povidone Iodine and Chlorhexidine Digluconate Reduced HFs Cell Viability Compared to the Other Treatments
3.3. Common Antiseptics for Clinical Use Reduce Cell Growth and Proliferation in Skin Cell Lines
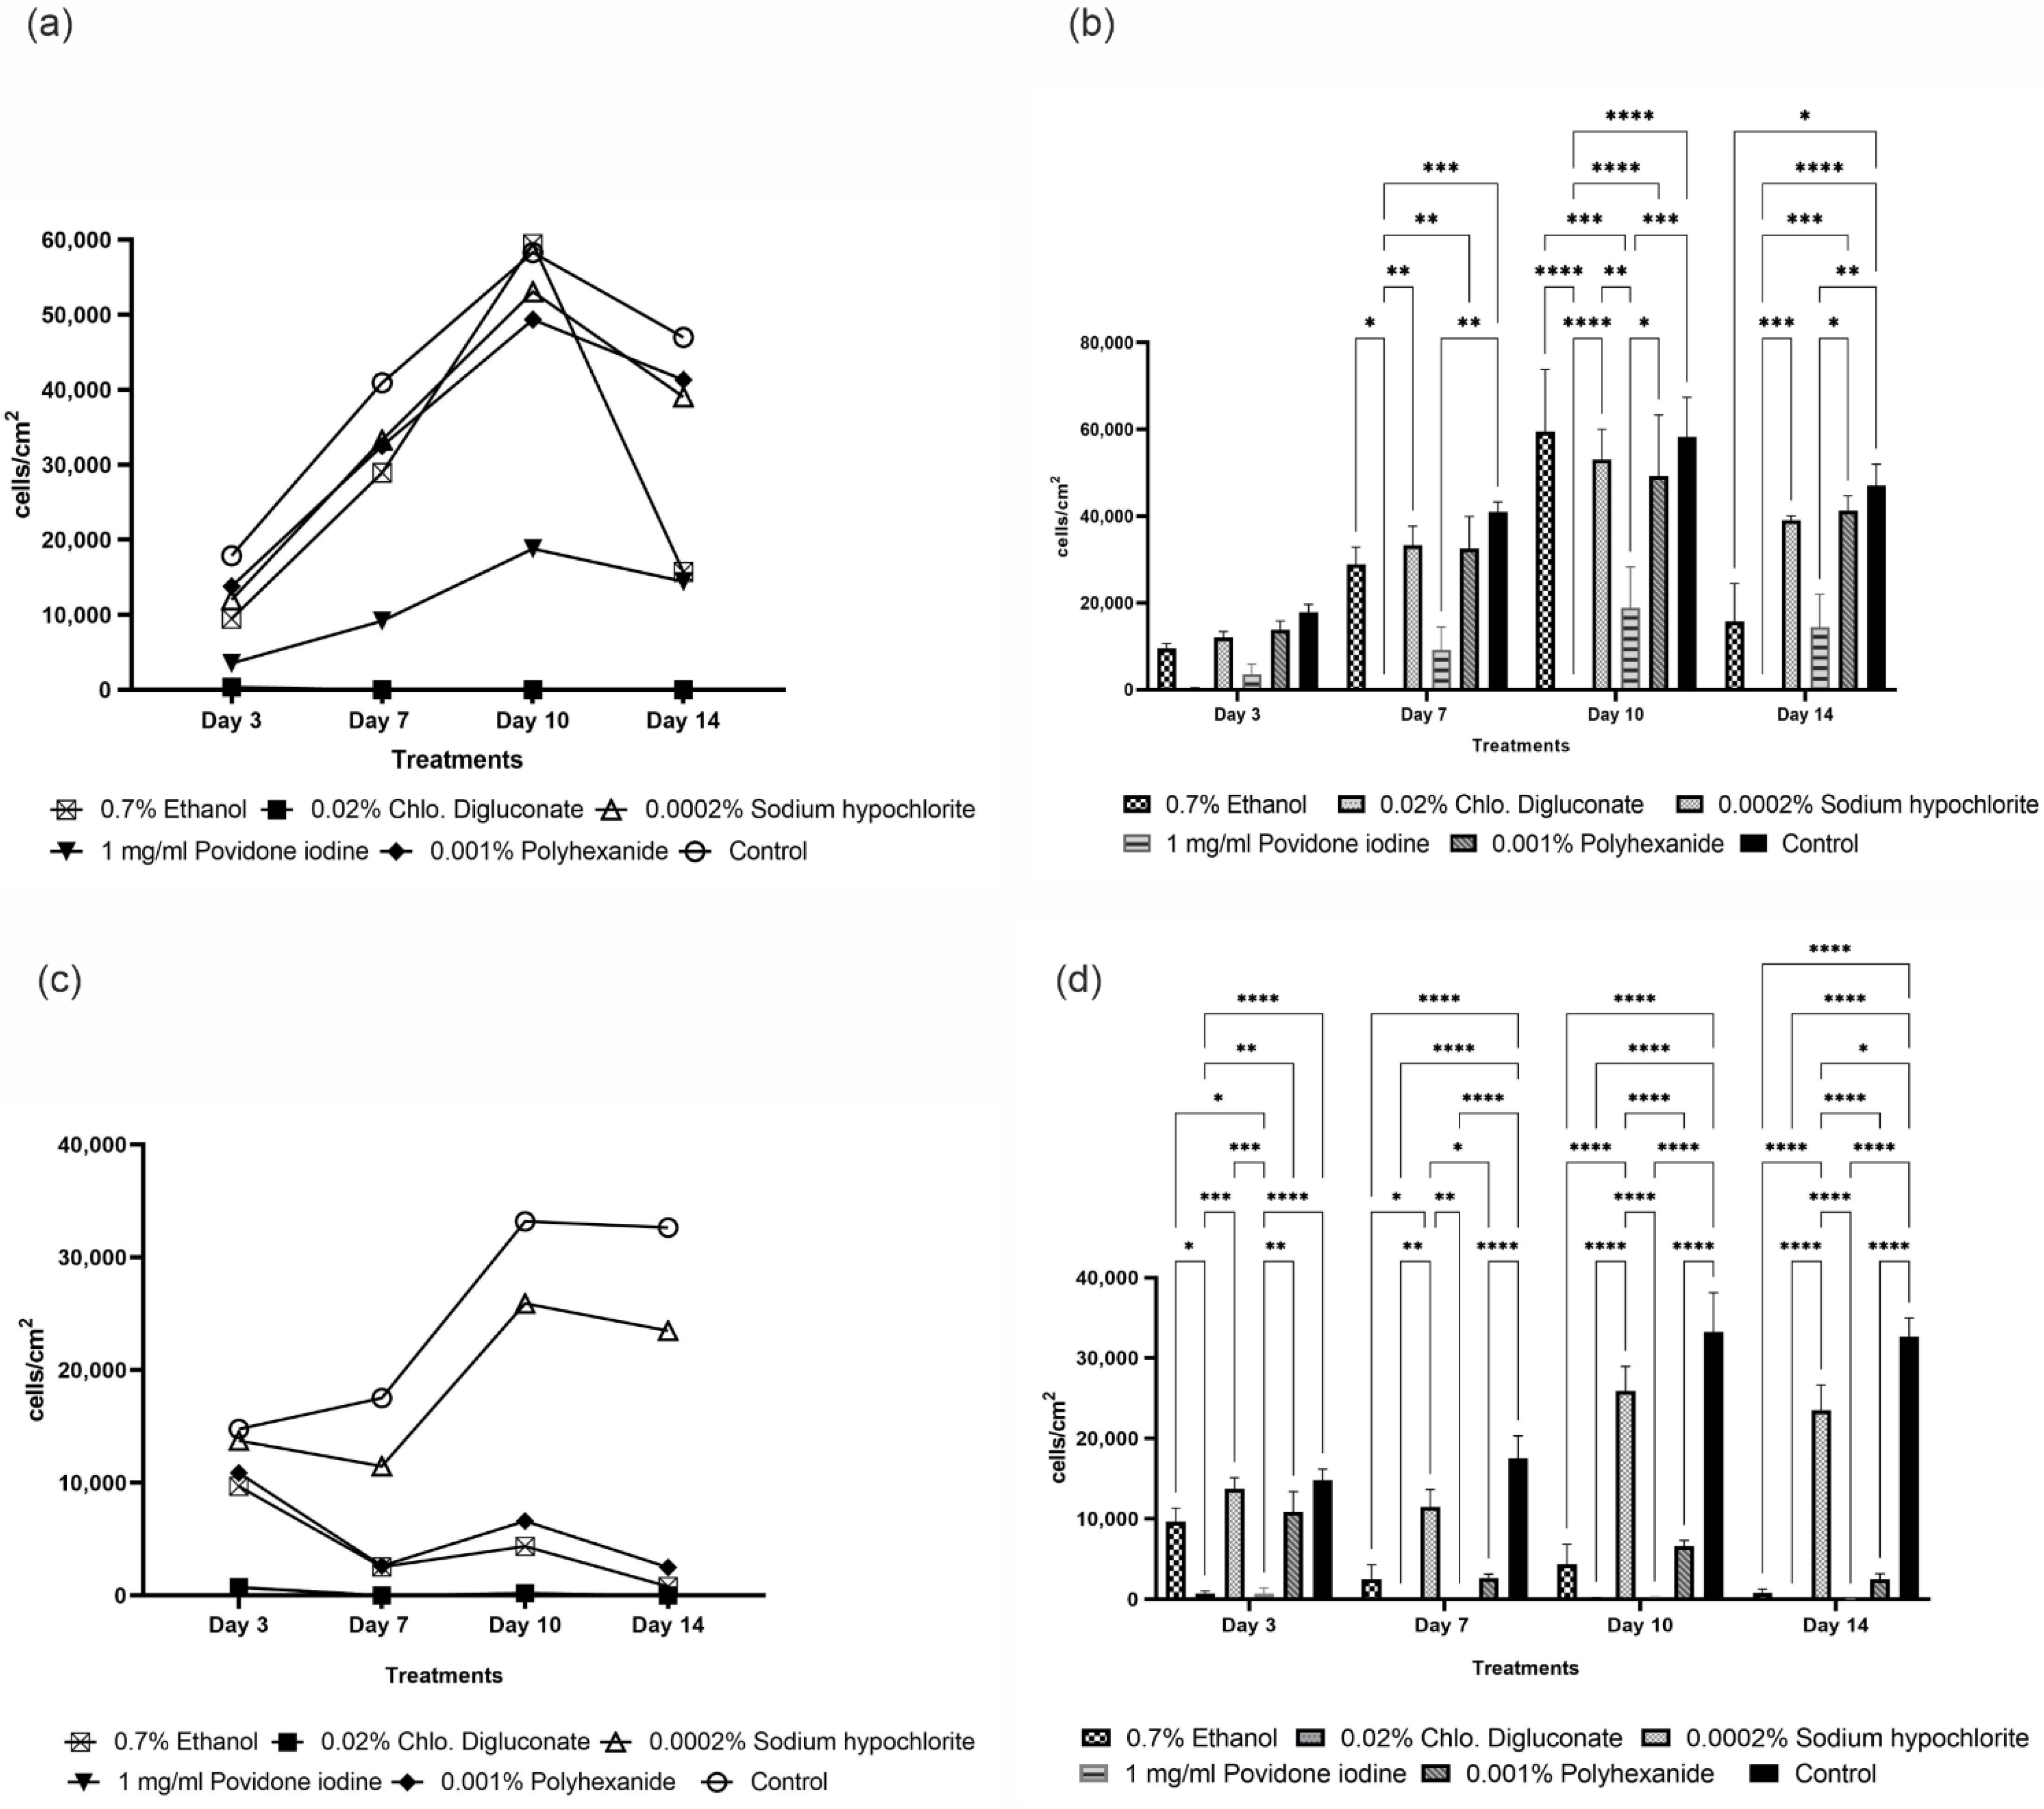
3.3.1. Chlorhexidine Digluconate and Povidone Iodine Significantly Affect HaCaT Cells Growth Compared to the Other Treatments
3.3.2. Chlorhexidine Digluconate and Povidone Iodine and Ethanol Had Greater Impact on HF Proliferation Compared to the Other Treatments
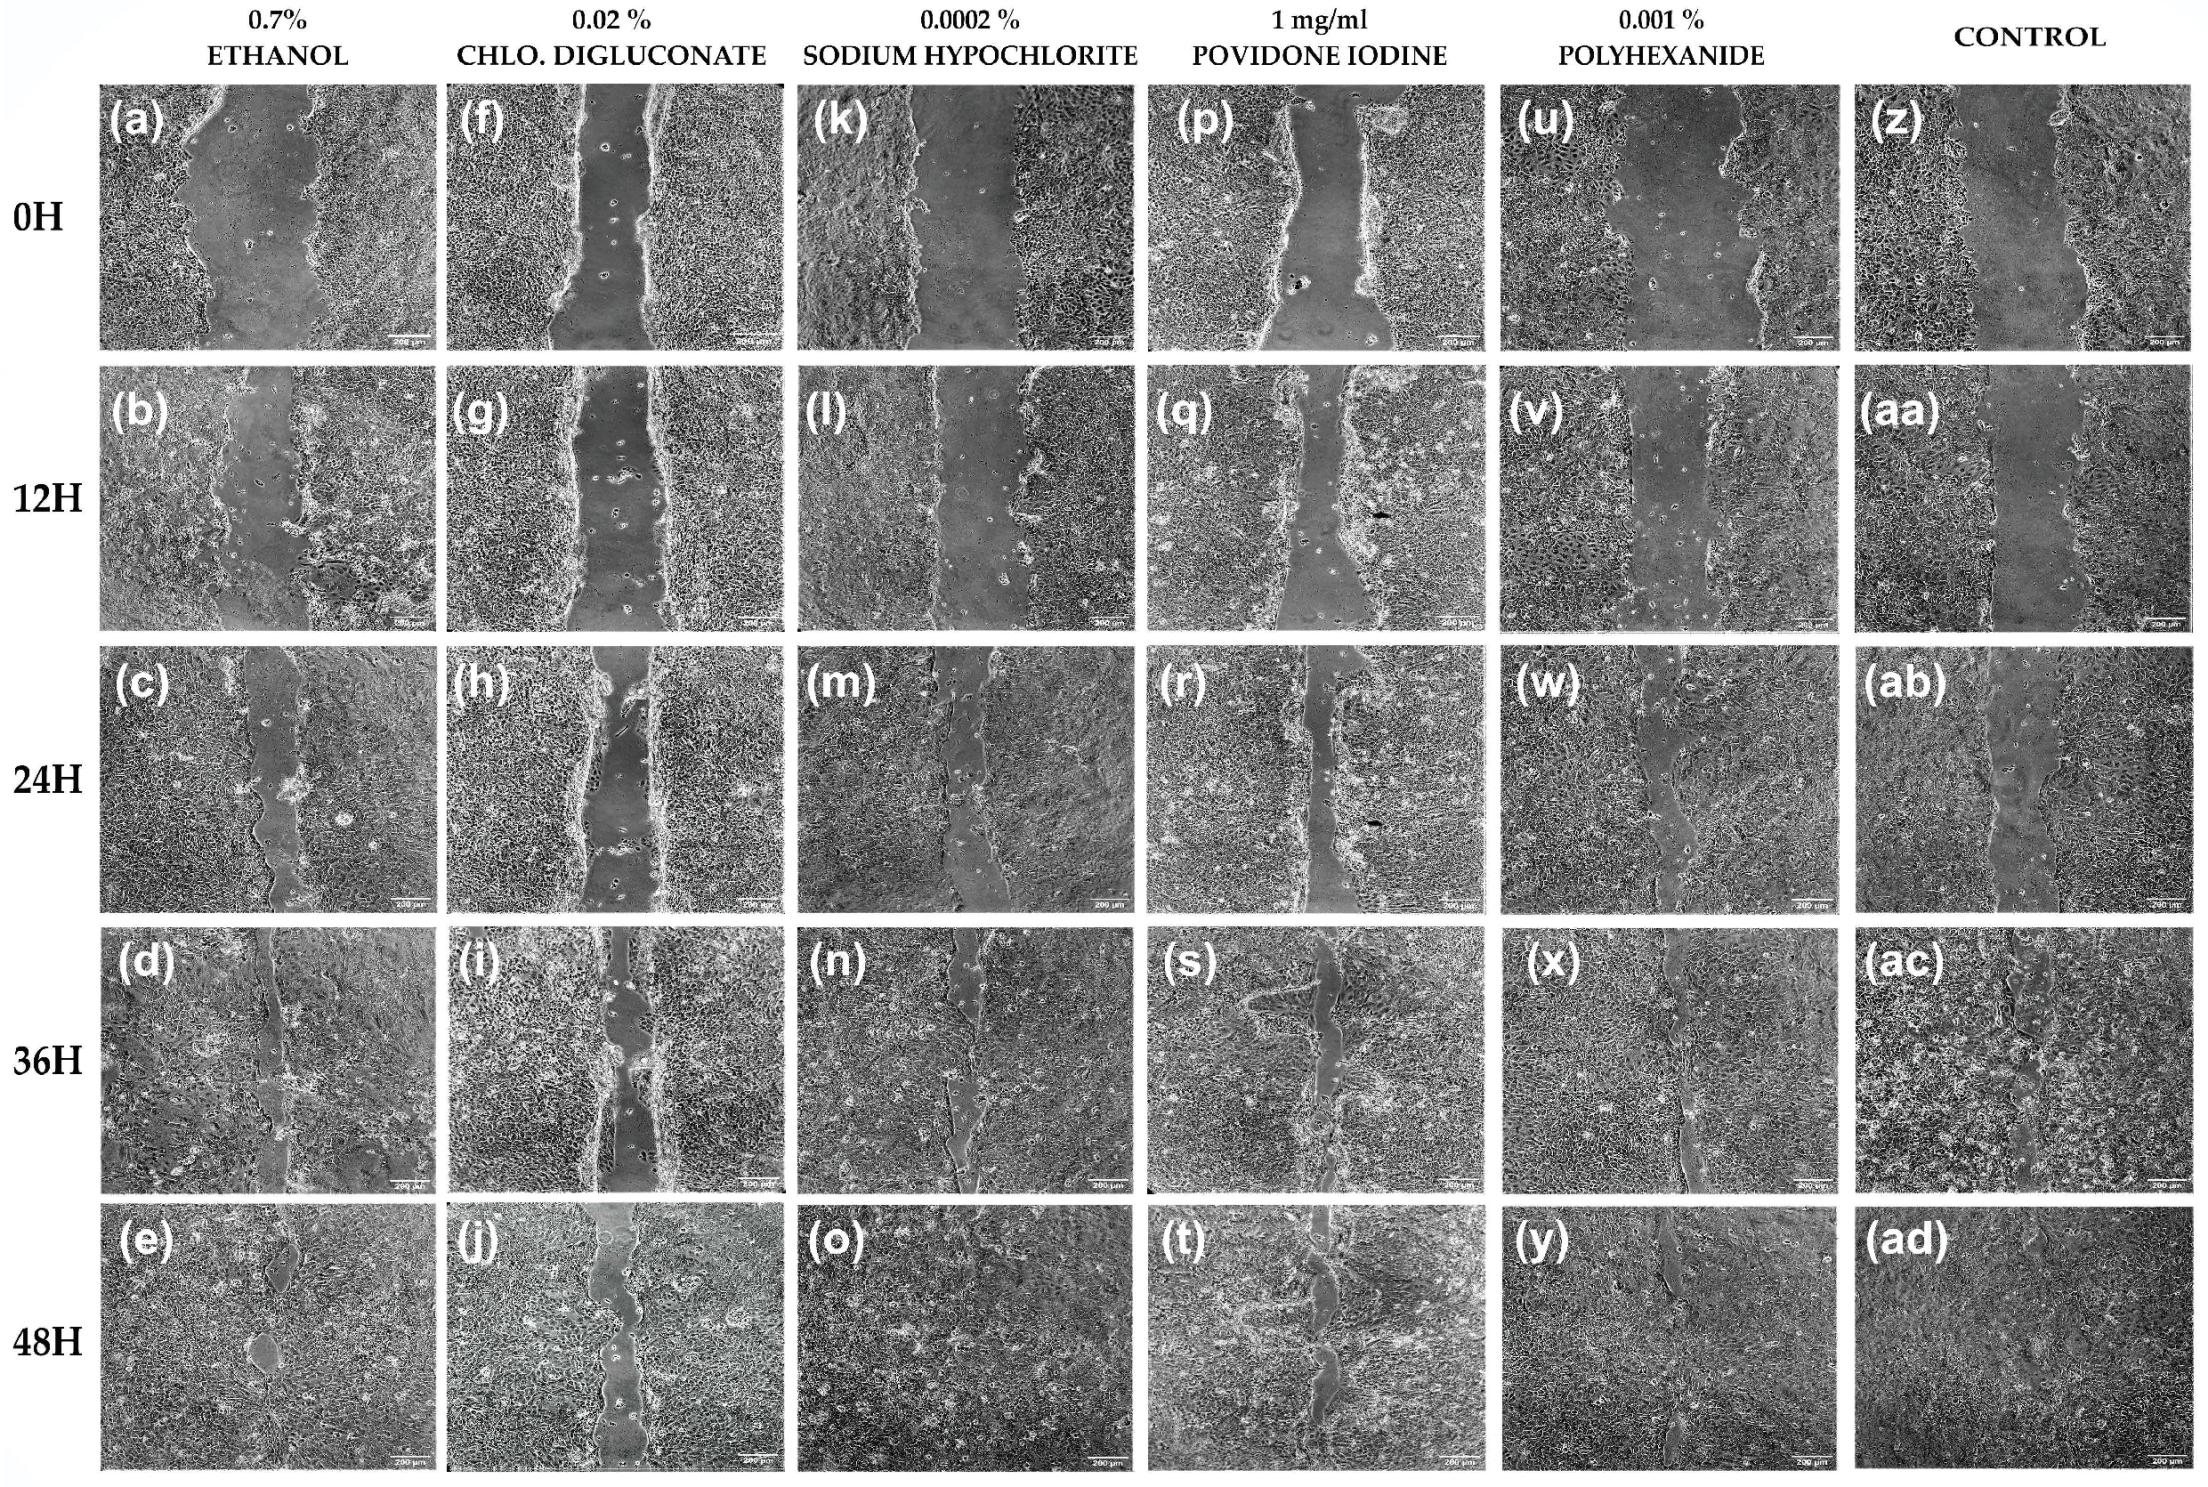
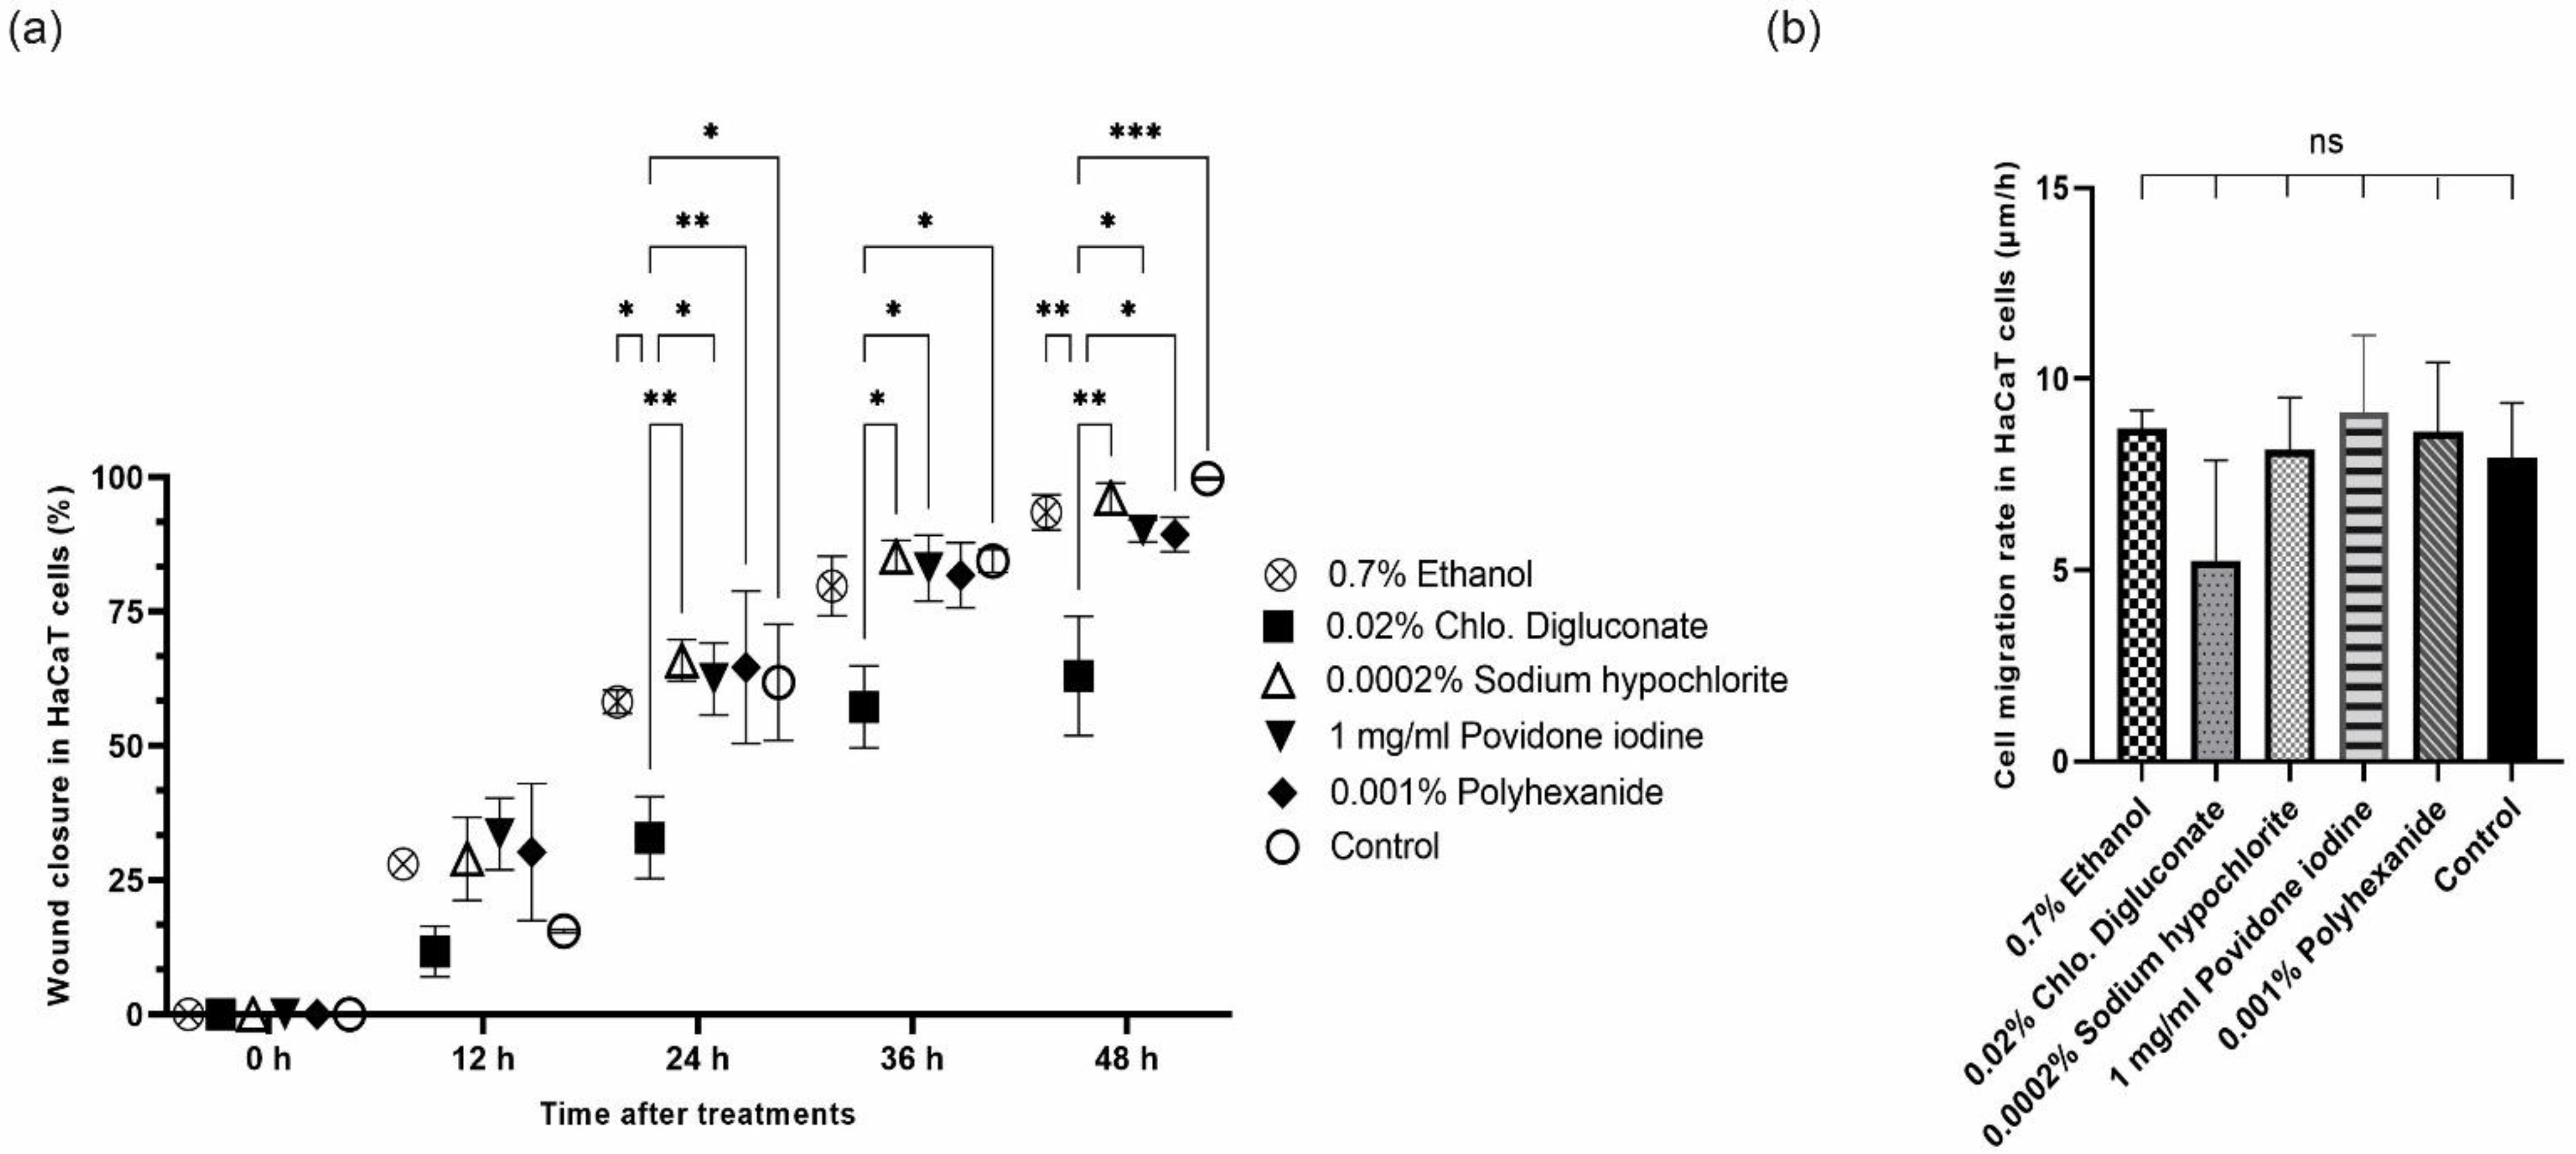
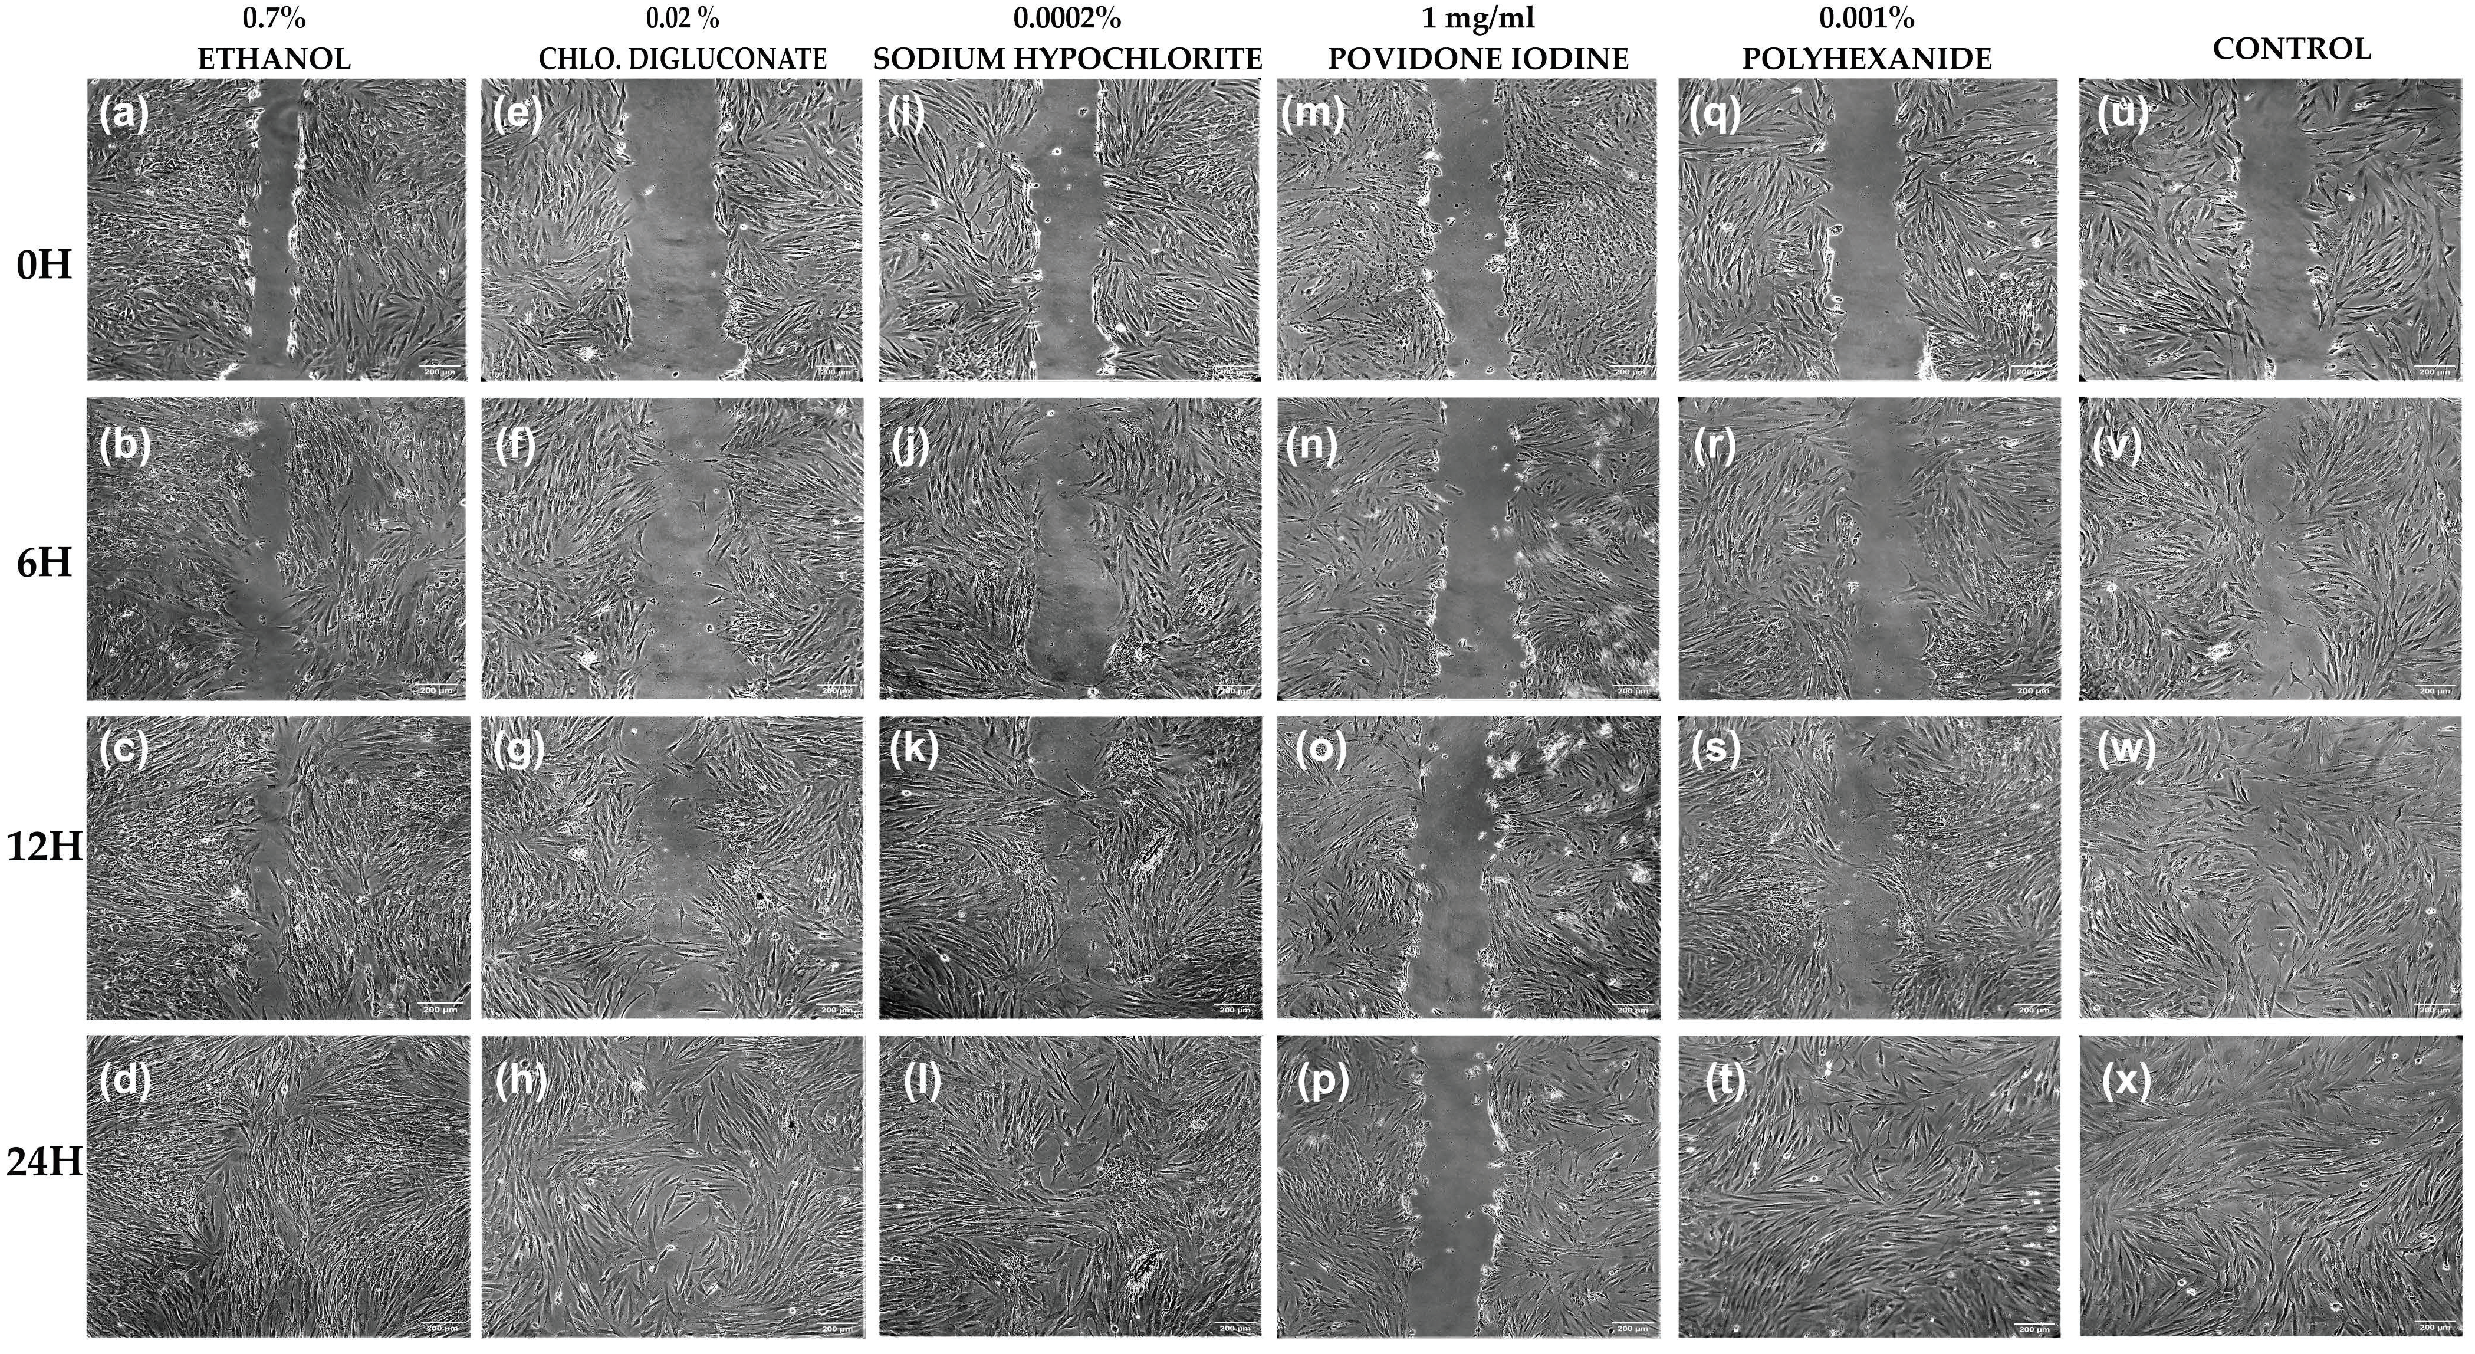
3.4. Common Antiseptics for Clinical Use Affect Cell Migration of Skin Cell Lines
3.4.1. Chlorhexidine Digluconate Inhibits Cell Migration Capacity in HaCaT Cells Compared to Other Antiseptic Treatments
3.4.2. Povidone Iodine Inhibits Cell Migration Capacity in HFs Compared to Other Antiseptics
4. Discussion
Supplementary Materials
Author Contributions
Funding
Institutional Review Board Statement
Informed Consent Statement
Data Availability Statement
Acknowledgments
Conflicts of Interest
Abbreviations
| BASS | Bioengineered Autologous Skin Substitute |
| CHLO | Chlorhexidine |
| DFM | Dermal Fibroblast Medium |
| DPBS | Dulbecco’s phosphate-buffered saline |
| HFs | Human Fibroblasts |
| hMSCs | Human Mesenchymal Stem Cells |
| hAMSCs | Human Amniotic Membrane derived MSCs |
| hPMSCs | Human Placenta derived MSCs |
| hUC-MSCs | Human Umbilical Cord derived MSCs |
| ROS | Reactive Oxygen Species |
| SDS | Sodium Dodecyl Sulfate |
| SEM | Standard Error of the Mean |
References
- Jia, T.; Qiao, W.; Yao, Q.; Wu, W.; Kaku, K. Treatment with docosahexaenoic acid improves epidermal keratinocyte differentiation and ameliorates inflammation in human keratinocytes and reconstructed human epidermis models. Molecules 2019, 24, 3156. [Google Scholar] [CrossRef] [PubMed] [Green Version]
- Arda, O.; Göksügür, N. Basic histological structure and functions of facial skin. Clin. Dermatol. 2014, 32, 3–13. [Google Scholar] [CrossRef] [PubMed]
- Wojtowicz, A.M.; Oliveira, S.; Carlson, M.W.; Zawadzka, A.; Rousseau, C.F.; Baksh, D. The importance of both fibroblasts and keratinocytes in a bilayered living cellular construct used in wound healing. Wound Repair Regen. 2014, 22, 246–255. [Google Scholar] [CrossRef] [PubMed] [Green Version]
- Nešporová, K.; Pavlík, V.; Šafránková, B.; Vágnerová, H.; Odráška, P.; Žídek, O.; Císařová, N.; Skoroplyas, S.; Kubala, L.; Velebný, V. Effects of wound dressings containing silver on skin and immune cells. Sci. Rep. 2020, 10, 1–14. [Google Scholar] [CrossRef]
- Barret, J.P. Cronología de la colonización bacteriana en grandes quemados: ¿Es el aislamiento estricto necesario? Enferm. Infecc. Microbiol. Clin. 2003, 21, 552–556. [Google Scholar] [CrossRef]
- Leaper, D.J.; Roberts, C.D. The Role of Topical Antiseptic Agents Within Antimicrobial Stewardship Strategies for Prevention and Treatment of Surgical Site and Chronic Open Wound Infection. Adv. Wound Care 2017, 6, 63–71. [Google Scholar] [CrossRef] [Green Version]
- Atiyeh, B.S.; Dibo, S.A.; Hayek, S.N. Wound cleansing, topical antiseptics and wound healing. Int. Wound J. 2009, 6, 420–430. [Google Scholar] [CrossRef]
- Liu, J.X.; Werner, J.; Kirsch, T.; Zuckerman, J.D.; Virk, M.S. Cytotoxicity evaluation of chlorhexidine gluconate on human fibroblasts, myoblasts, and osteoblasts. J. Bone Jt. Infect. 2018, 3, 165–172. [Google Scholar] [CrossRef]
- Quiñones-Vico, M.I.; Fernández-González, A.; Pérez-Castejón, E.; Montero-Vílchez, T.; Arias-Santiago, S. Cytotoxicity and Epidermal Barrier Function Evaluation of Common Antiseptics for Clinical Use in an Artificial Autologous Skin Model. J. Clin. Med. 2021, 10, 642. [Google Scholar] [CrossRef]
- Colombo, I.; Sangiovanni, E.; Maggio, R.; Mattozzi, C.; Zava, S.; Corbett, Y.; Fumagalli, M.; Carlino, C.; Corsetto, P.A.; Scaccabarozzi, D.; et al. HaCaT Cells as a Reliable in Vitro Differentiation Model to Dissect the Inflammatory/Repair Response of Human Keratinocytes. Mediators Inflamm. 2017, 2017, 7435621. [Google Scholar] [CrossRef]
- Salvador-Culla, B.; Jeong, K.J.; Kolovou, P.E.; Chiang, H.H.; Chodosh, J.; Dohlman, C.H.; Kohane, D.S. Titanium coating of the Boston keratoprosthesis. Transl. Vis. Sci. Technol. 2016, 5, 17. [Google Scholar] [CrossRef] [PubMed]
- Kotian, S.R.; Bhat, K.M.R.; Padma, D.; Pai, K.S.R. Influence of traditional medicines on the activity of keratinocytes in wound healing: An in-vitro study. Anat. Cell Biol. 2019, 52, 324–332. [Google Scholar] [CrossRef] [PubMed]
- Suarez-Arnedo, A.; Figueroa, F.T.; Clavijo, C.; Arbeláez, P.; Cruz, J.C.; Muñoz-Camargo, C. An image J plugin for the high throughput image analysis of in vitro scratch wound healing assays. PLoS ONE 2020, 15, e0236525. [Google Scholar] [CrossRef] [PubMed]
- Balin, A.K.; Pratt, L. Dilute Povidone-Iodine Solutions Inhibit Human Skin Fibroblast Growth. Dermatol. Surg. 2002, 28, 210–214. [Google Scholar]
- Yoon, C.; Lee, J.; Jeong, H.; Lee, S.; Sohn, T.; Chung, S. Rapid preparation of a noncultured skin cell suspension that promotes wound healing. Cell Tissue Bank. 2017, 18, 131–141. [Google Scholar] [CrossRef] [PubMed]
- ClinicalTrials.gov ReCell® Combined With Meshed Skin Graft in the Treatment of Acute Burn Injuries. Available online: https://clinicaltrials.gov/ct2/show/NCT02380612 (accessed on 13 June 2021).
- Bigliardi, P.L.; Alsagoff, S.A.L.; El-Kafrawi, H.Y.; Pyon, J.K.; Wa, C.T.C.; Villa, M.A. Povidone iodine in wound healing: A review of current concepts and practices. Int. J. Surg. 2017, 44, 260–268. [Google Scholar] [CrossRef]
- Li, L.; He, Y.; Zhao, M.; Jiang, J. Collective cell migration: Implications for wound healing and cancer invasion. Burn. Trauma 2013, 1, 21–26. [Google Scholar] [CrossRef] [Green Version]
- Hajská, M.; Dragúňová, J.; Koller, J. Cytotoxicity testing of burn wound dressings: First results. Cell Tissue Bank. 2017, 18, 143–151. [Google Scholar] [CrossRef]
- Thomas, G.W.; Rael, L.T.; Bar-Or, R.; Shimonkevitz, R.; Mains, C.W.; Slone, D.S.; Craun, M.L.; Bar-Or, D. Mechanisms of delayed wound healing by commonly used antiseptics. J. Trauma-Inj. Infect. Crit. Care 2009, 66, 82–90. [Google Scholar] [CrossRef]
- Hirsch, T.; Koerber, A.; Jacobsen, F.; Dissemond, J.; Steinau, H.U.; Gatermann, S.; Al-Benna, S.; Kesting, M.; Seipp, H.M.; Steinstraesser, L. Evaluation of toxic side effects of clinically used skin antiseptics in vitro. J. Surg. Res. 2010, 164, 344–350. [Google Scholar] [CrossRef]
- Chou, S.F.; Lin, C.H.; Chang, S.W. Povidone-iodine application induces corneal cell death through fixation. Br. J. Ophthalmol. 2011, 95, 277–283. [Google Scholar] [CrossRef] [PubMed]
- Lee, H.S.; Jang, H.J.; Lo, E.M.; Truong, C.Y.; Groth, S.S.; Friedberg, J.S.; Sugarbaker, D.J.; Burt, B.M. Povidone-iodine results in rapid killing of thymic epithelial tumour cells through cellular fixation. Interact. Cardiovasc. Thorac. Surg. 2019, 28, 353–359. [Google Scholar] [CrossRef] [PubMed]
- Sato, S.; Miyake, M.; Hazama, A.; Omori, K. Povidone-iodine-induced cell death in cultured human epithelial HeLa cells and rat oral mucosal tissue. Drug Chem. Toxicol. 2014, 37, 268–275. [Google Scholar] [CrossRef] [PubMed] [Green Version]
- Nomura, Y.; Bhawal, U.K.; Nishikiori, R.; Sawajiri, M.; Maeda, T.; Okazaki, M. Effects of high-dose major components in oral disinfectants on the cell cycle and apoptosis in primary human gingival fibroblasts in vitro. Dent. Mater. J. 2010, 29, 75–83. [Google Scholar] [CrossRef] [PubMed] [Green Version]
- Sivathasan, N.; Goodfellow, P.B. Skin cleansers: The risks of chlorhexidine. J. Clin. Pharmacol. 2011, 51, 785–786. [Google Scholar] [CrossRef]
- Abdel-Sayed, P.; Tornay, D.; Hirt-Burri, N.; de Buys Roessingh, A.; Raffoul, W.; Applegate, L.A. Implications of chlorhexidine use in burn units for wound healing. Burns 2020, 46, 1150–1156. [Google Scholar] [CrossRef]
- Van Meurs, S.J.; Gawlitta, D.; Heemstra, K.A.; Poolman, R.W.; Vogely, H.C.; Kruyt, M.C. Selection of an optimal antiseptic solution for intraoperative irrigation: An in vitro study. J. Bone Jt. Surg. Am. 2014, 96, 285–291. [Google Scholar] [CrossRef]
- Zhang, J.; Yan, Y.; Li, Y.; Shen, C.; Zhang, Y. Topical effect of benzalkonium bromide on wound healing and potential cellular and molecular mechanisms. Int. Wound J. 2021, 18, 566–576. [Google Scholar] [CrossRef]
- Coelho, A.S.; Laranjo, M.; Gonçalves, A.C.; Paula, A.; Paulo, S.; Abrantes, A.M.; Caramelo, F.; Ferreira, M.M.; Silva, M.J.; Carrilho, E.; et al. Cytotoxic effects of a chlorhexidine mouthwash and of an enzymatic mouthwash on human gingival fibroblasts. Odontology 2020, 108, 260–270. [Google Scholar] [CrossRef]
- Verma, U.P.; Gupta, A.; Yadav, R.K.; Tiwari, R.; Sharma, R.; Balapure, A.K. Cytotoxicity of chlorhexidine and neem extract on cultured human gingival fibroblasts through fluorescence-activated cell sorting analysis: An in-vitro study. Eur. J. Dent. 2018, 12, 344–349. [Google Scholar] [CrossRef]
- González-Espinosa, D.; Pérez-Romano, L.; Guzmán-Soriano, B.; Arias, E.; Bongiovanni, C.M.; Gutiérrez, A.A. Effects of pH-neutral, super-oxidised solution on human dermal fibroblasts in vitro. Int. Wound J. 2007, 4, 241–250. [Google Scholar] [CrossRef] [PubMed]
- Ortega-Peña, S.; Hidalgo-González, C.; Robson, M.C.; Krötzsch, E. In vitro microbicidal, anti-biofilm and cytotoxic effects of different commercial antiseptics. Int. Wound J. 2017, 14, 470–479. [Google Scholar] [CrossRef] [PubMed]
- Pichlsberger, M.; Jerman, U.D.; Obradović, H.; Tratnjek, L.; Macedo, A.S.; Mendes, F.; Fonte, P.; Hoegler, A.; Sundl, M.; Fuchs, J.; et al. Systematic Review of the Application of Perinatal Derivatives in Animal Models on Cutaneous Wound Healing. Front. Bioeng. Biotechnol. 2021, 9, 742858. [Google Scholar] [CrossRef]
- Sierra-Sánchez, Á.; Montero-Vilchez, T.; Quiñones-Vico, M.I.; Sanchez-Diaz, M.; Arias-Santiago, S. Current Advanced Therapies Based on Human Mesenchymal Stem Cells for Skin Diseases. Front. Cell Dev. Biol. 2021, 9, 643125. [Google Scholar] [CrossRef] [PubMed]
- Ribeiro, J.; Pereira, T.; Amorim, I.; Caseiro, A.R.; Lopes, M.A.; Lima, J.; Gartner, A.; Santos, J.D.; Bártolo, P.J.; Rodrigues, J.M.; et al. Cell therapy with human MSCs isolated from the umbilical cord wharton jelly associated to a PVA membrane in the treatment of chronic skin wounds. Int. J. Med. Sci. 2014, 11, 979–987. [Google Scholar] [CrossRef] [PubMed] [Green Version]
- Liu, J.X.; Werner, J.A.; Buza, J.A.; Kirsch, T.; Zuckerman, J.D.; Virk, M.S. Povidone-iodine Solutions Inhibit Cell Migration and Survival of Osteoblasts, Fibroblasts, and Myoblasts. Spine (Phila. Pa. 1976). 2017, 42, 1757–1762. [Google Scholar] [CrossRef]
- Wang, L.; Qin, W.; Zhou, Y.; Chen, B.; Zhao, X.; Zhao, H.; Mi, E.; Mi, E.; Wang, Q.; Ning, J. Transforming growth factor β plays an important role in enhancing wound healing by topical application of Povidone-iodine. Sci. Rep. 2017, 7, 1–8. [Google Scholar] [CrossRef]
- Barreto, R.; Barrois, B.; Lambert, J.; Malhotra-Kumar, S.; Santos-Fernandes, V.; Monstrey, S. Addressing the challenges in antisepsis: Focus on povidone iodine. Int. J. Antimicrob. Agents 2020, 56, 106064. [Google Scholar] [CrossRef]


Publisher’s Note: MDPI stays neutral with regard to jurisdictional claims in published maps and institutional affiliations. |
© 2022 by the authors. Licensee MDPI, Basel, Switzerland. This article is an open access article distributed under the terms and conditions of the Creative Commons Attribution (CC BY) license (https://creativecommons.org/licenses/by/4.0/).
Share and Cite
Ortega-Llamas, L.; Quiñones-Vico, M.I.; García-Valdivia, M.; Fernández-González, A.; Ubago-Rodríguez, A.; Sanabria-de la Torre, R.; Arias-Santiago, S. Cytotoxicity and Wound Closure Evaluation in Skin Cell Lines after Treatment with Common Antiseptics for Clinical Use. Cells 2022, 11, 1395. https://doi.org/10.3390/cells11091395
Ortega-Llamas L, Quiñones-Vico MI, García-Valdivia M, Fernández-González A, Ubago-Rodríguez A, Sanabria-de la Torre R, Arias-Santiago S. Cytotoxicity and Wound Closure Evaluation in Skin Cell Lines after Treatment with Common Antiseptics for Clinical Use. Cells. 2022; 11(9):1395. https://doi.org/10.3390/cells11091395
Chicago/Turabian StyleOrtega-Llamas, Laura, María I. Quiñones-Vico, Marta García-Valdivia, Ana Fernández-González, Ana Ubago-Rodríguez, Raquel Sanabria-de la Torre, and Salvador Arias-Santiago. 2022. "Cytotoxicity and Wound Closure Evaluation in Skin Cell Lines after Treatment with Common Antiseptics for Clinical Use" Cells 11, no. 9: 1395. https://doi.org/10.3390/cells11091395
APA StyleOrtega-Llamas, L., Quiñones-Vico, M. I., García-Valdivia, M., Fernández-González, A., Ubago-Rodríguez, A., Sanabria-de la Torre, R., & Arias-Santiago, S. (2022). Cytotoxicity and Wound Closure Evaluation in Skin Cell Lines after Treatment with Common Antiseptics for Clinical Use. Cells, 11(9), 1395. https://doi.org/10.3390/cells11091395