
Metabolomic Profiling and Mechanotransduction of Single Chondrocytes Encapsulated in Alginate Microgels

 and
and 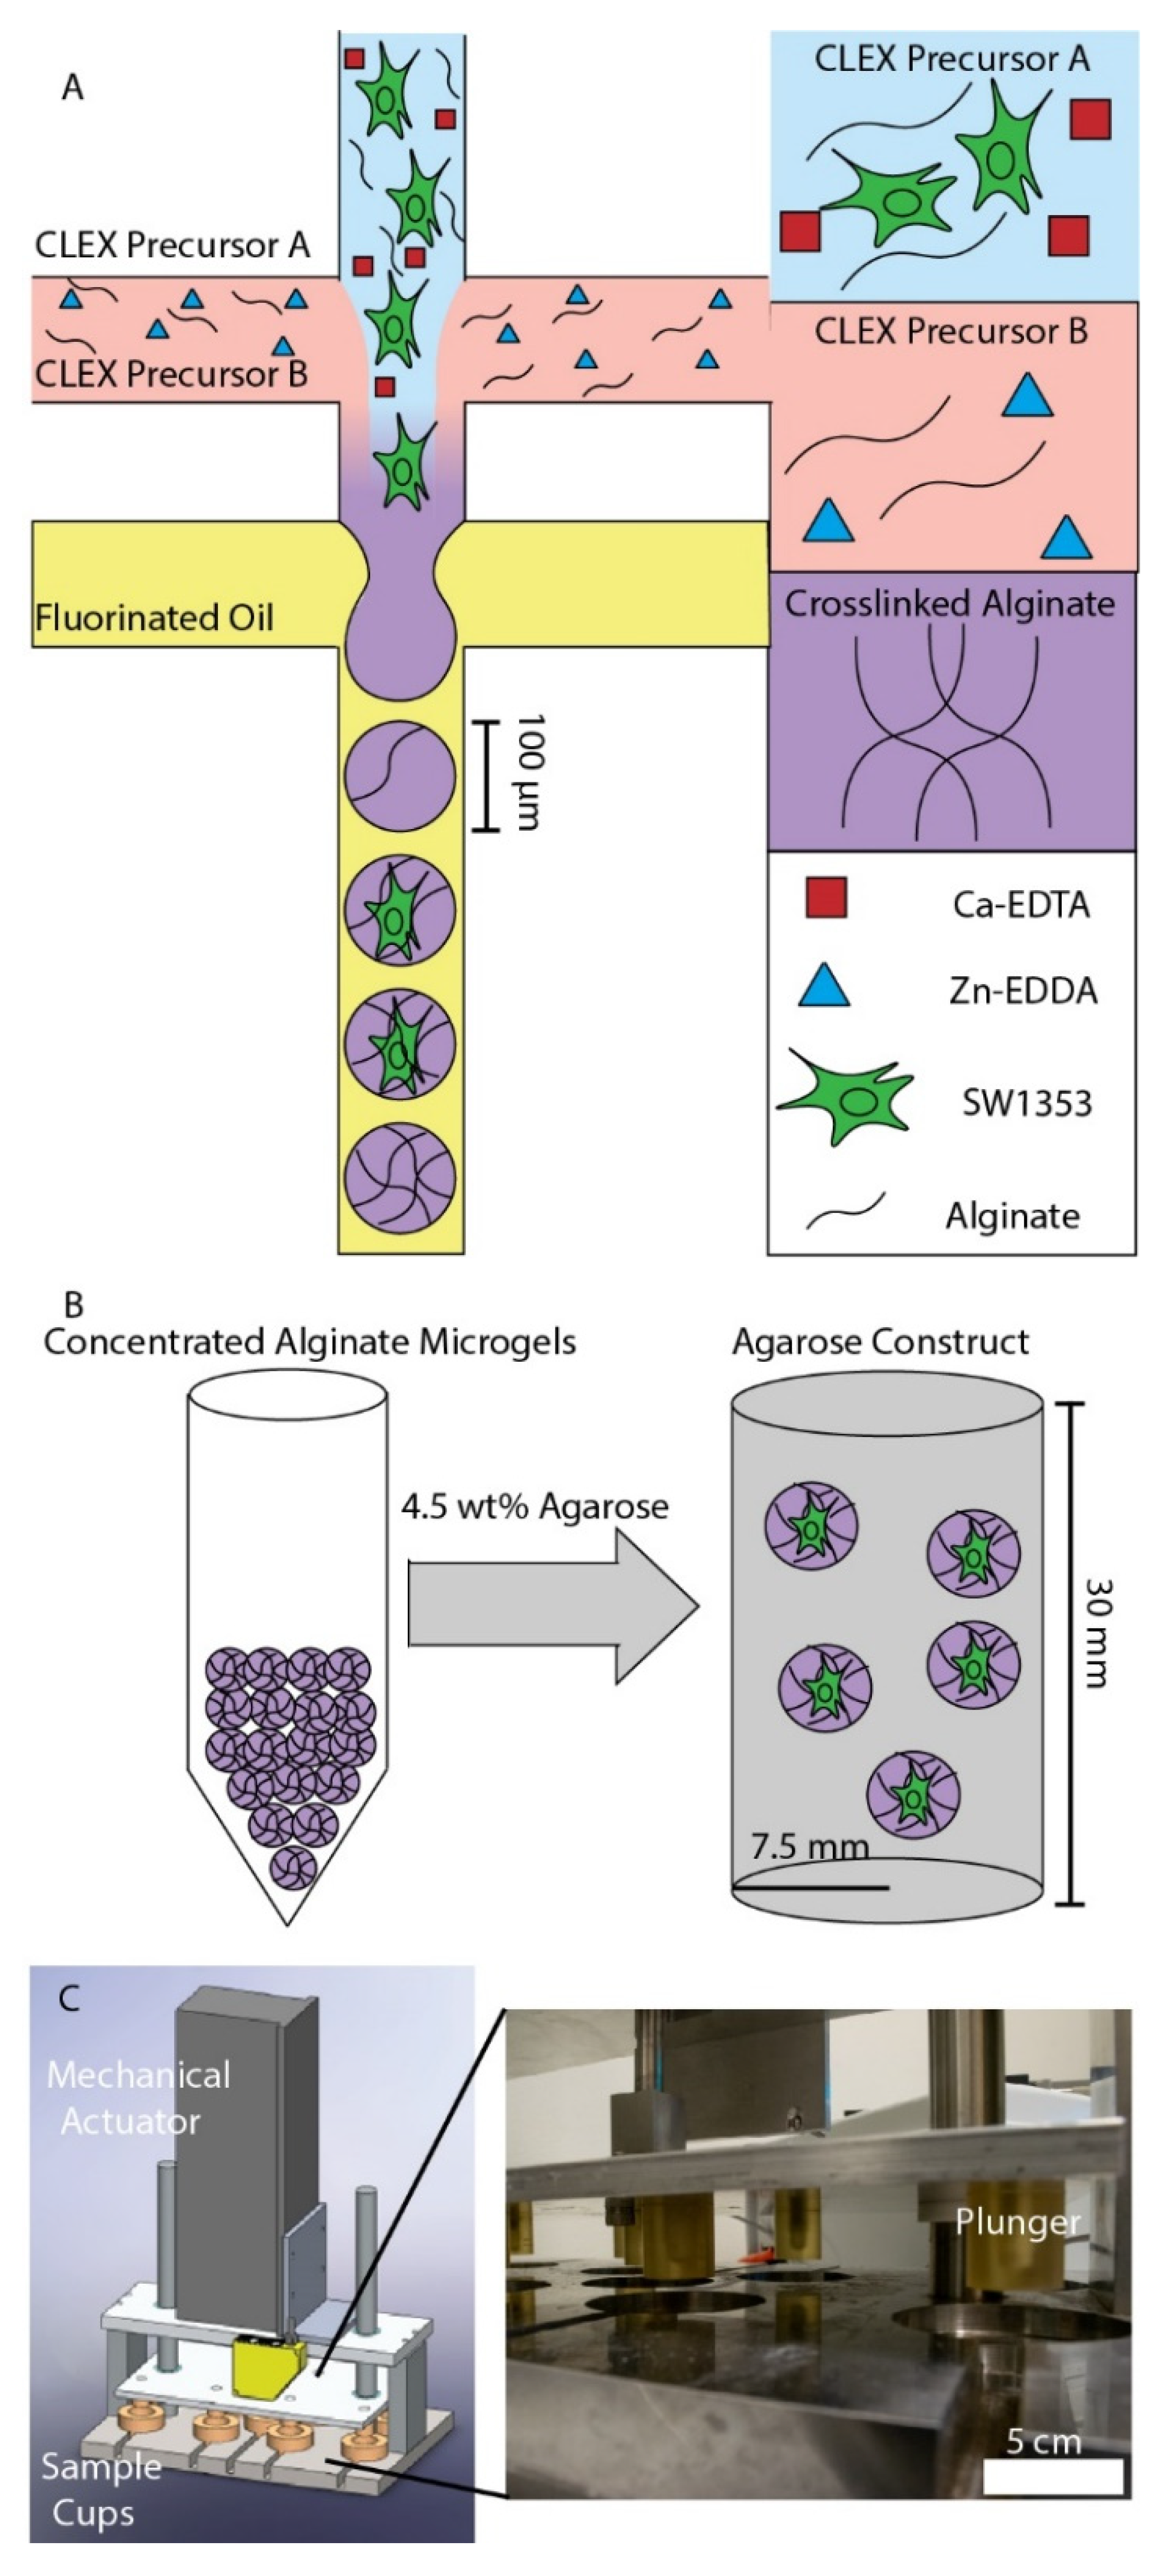
Abstract
1. Introduction
2. Methods
2.1. Chondrocyte Harvest and Culture
2.2. PDMS Microfluidic Device Fabrication
2.3. Preparation of Precursor Solutions
2.3.1. Oil Preparation
2.3.2. Alginate Precursor Preparation (A)
2.3.3. Alginate Precursor Preparation (B)
2.4. Cell Encapsulation in Microgels
2.5. Cell Culture in Microgels
2.6. Cell Viability Assay
2.7. Fluorescence Imaging and Analysis
2.8. Immunofluorescence Staining and Confocal Imaging
2.8.1. Monolayer Controls
2.8.2. Microgel-Encapsulated Chondrocytes
2.9. Encapsulation in High-Stiffness Agarose, Mechanical Stimulation, and Metabolite Extraction
2.10. Untargeted Metabolic Profiling
2.11. Rheology
2.12. Statistical Analysis
3. Results and Discussion
3.1. Chondrocyte Encapsulation in Alginate Microgels and Dynamic Compression Workflow
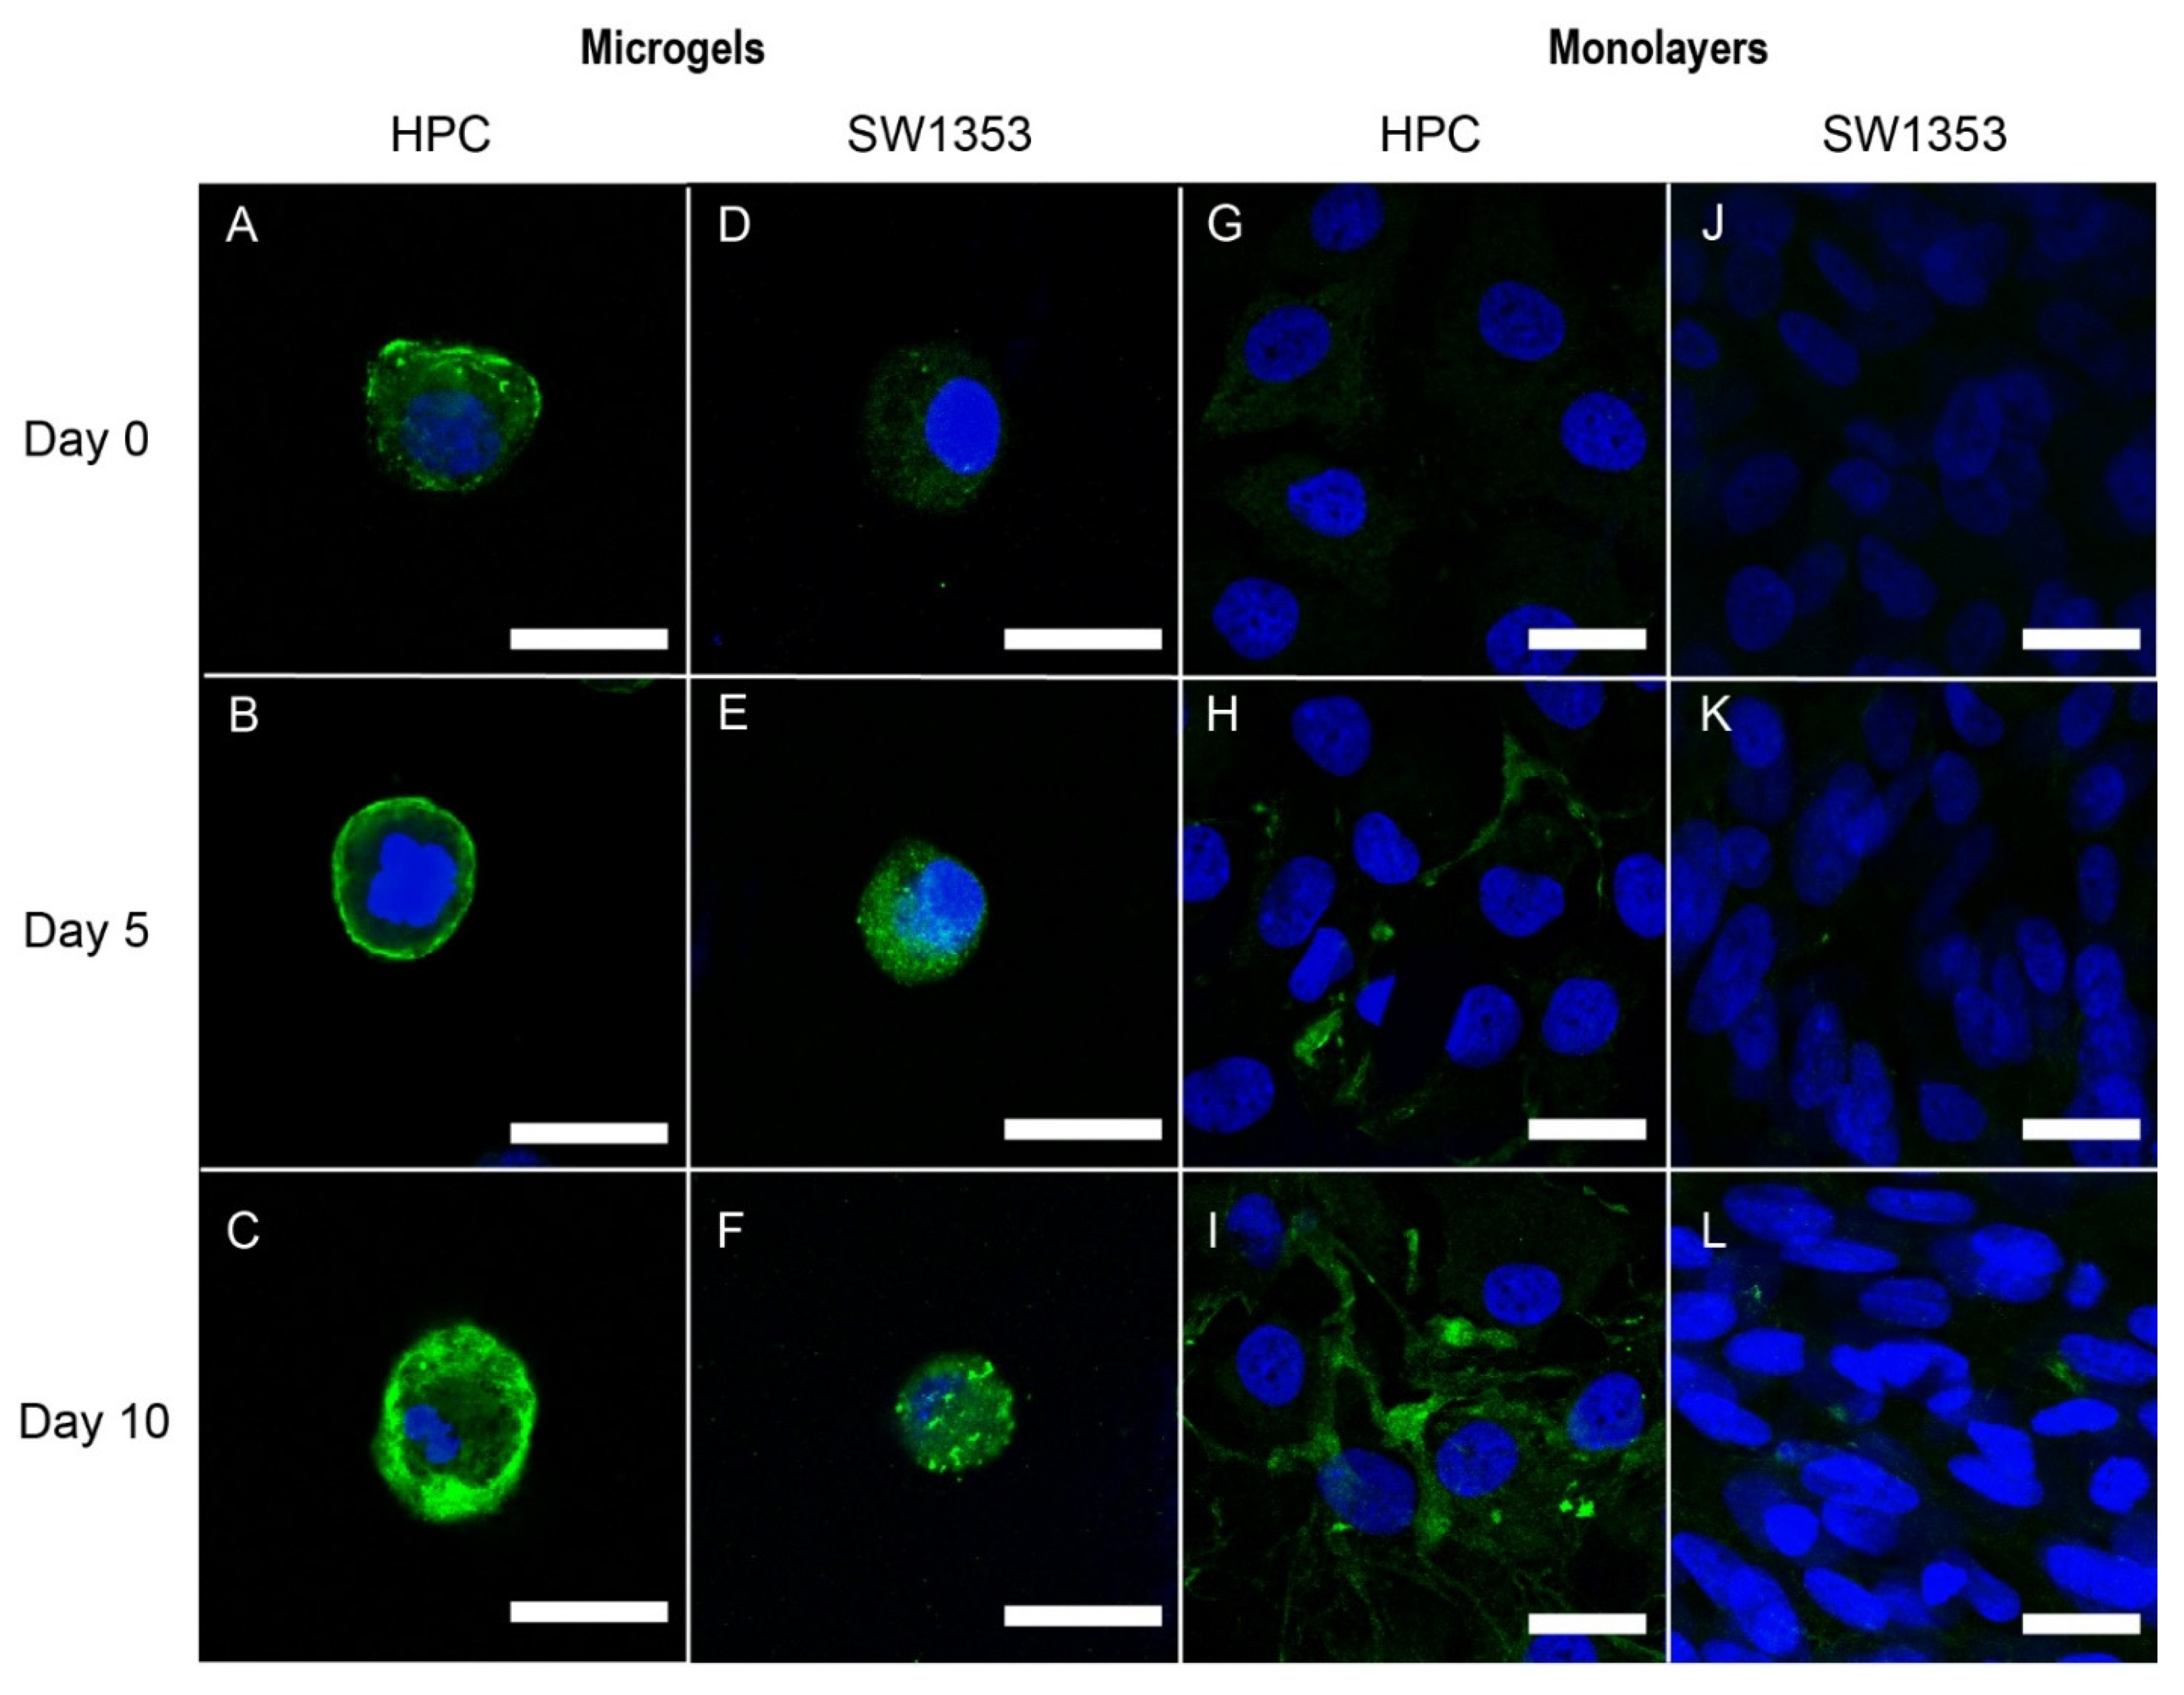
3.2. Immunofluorescence Staining of PCM Formation in Alginate Microgels
3.3. Immunofluorescence Staining of Pericellular Matrix Formation in Monolayers
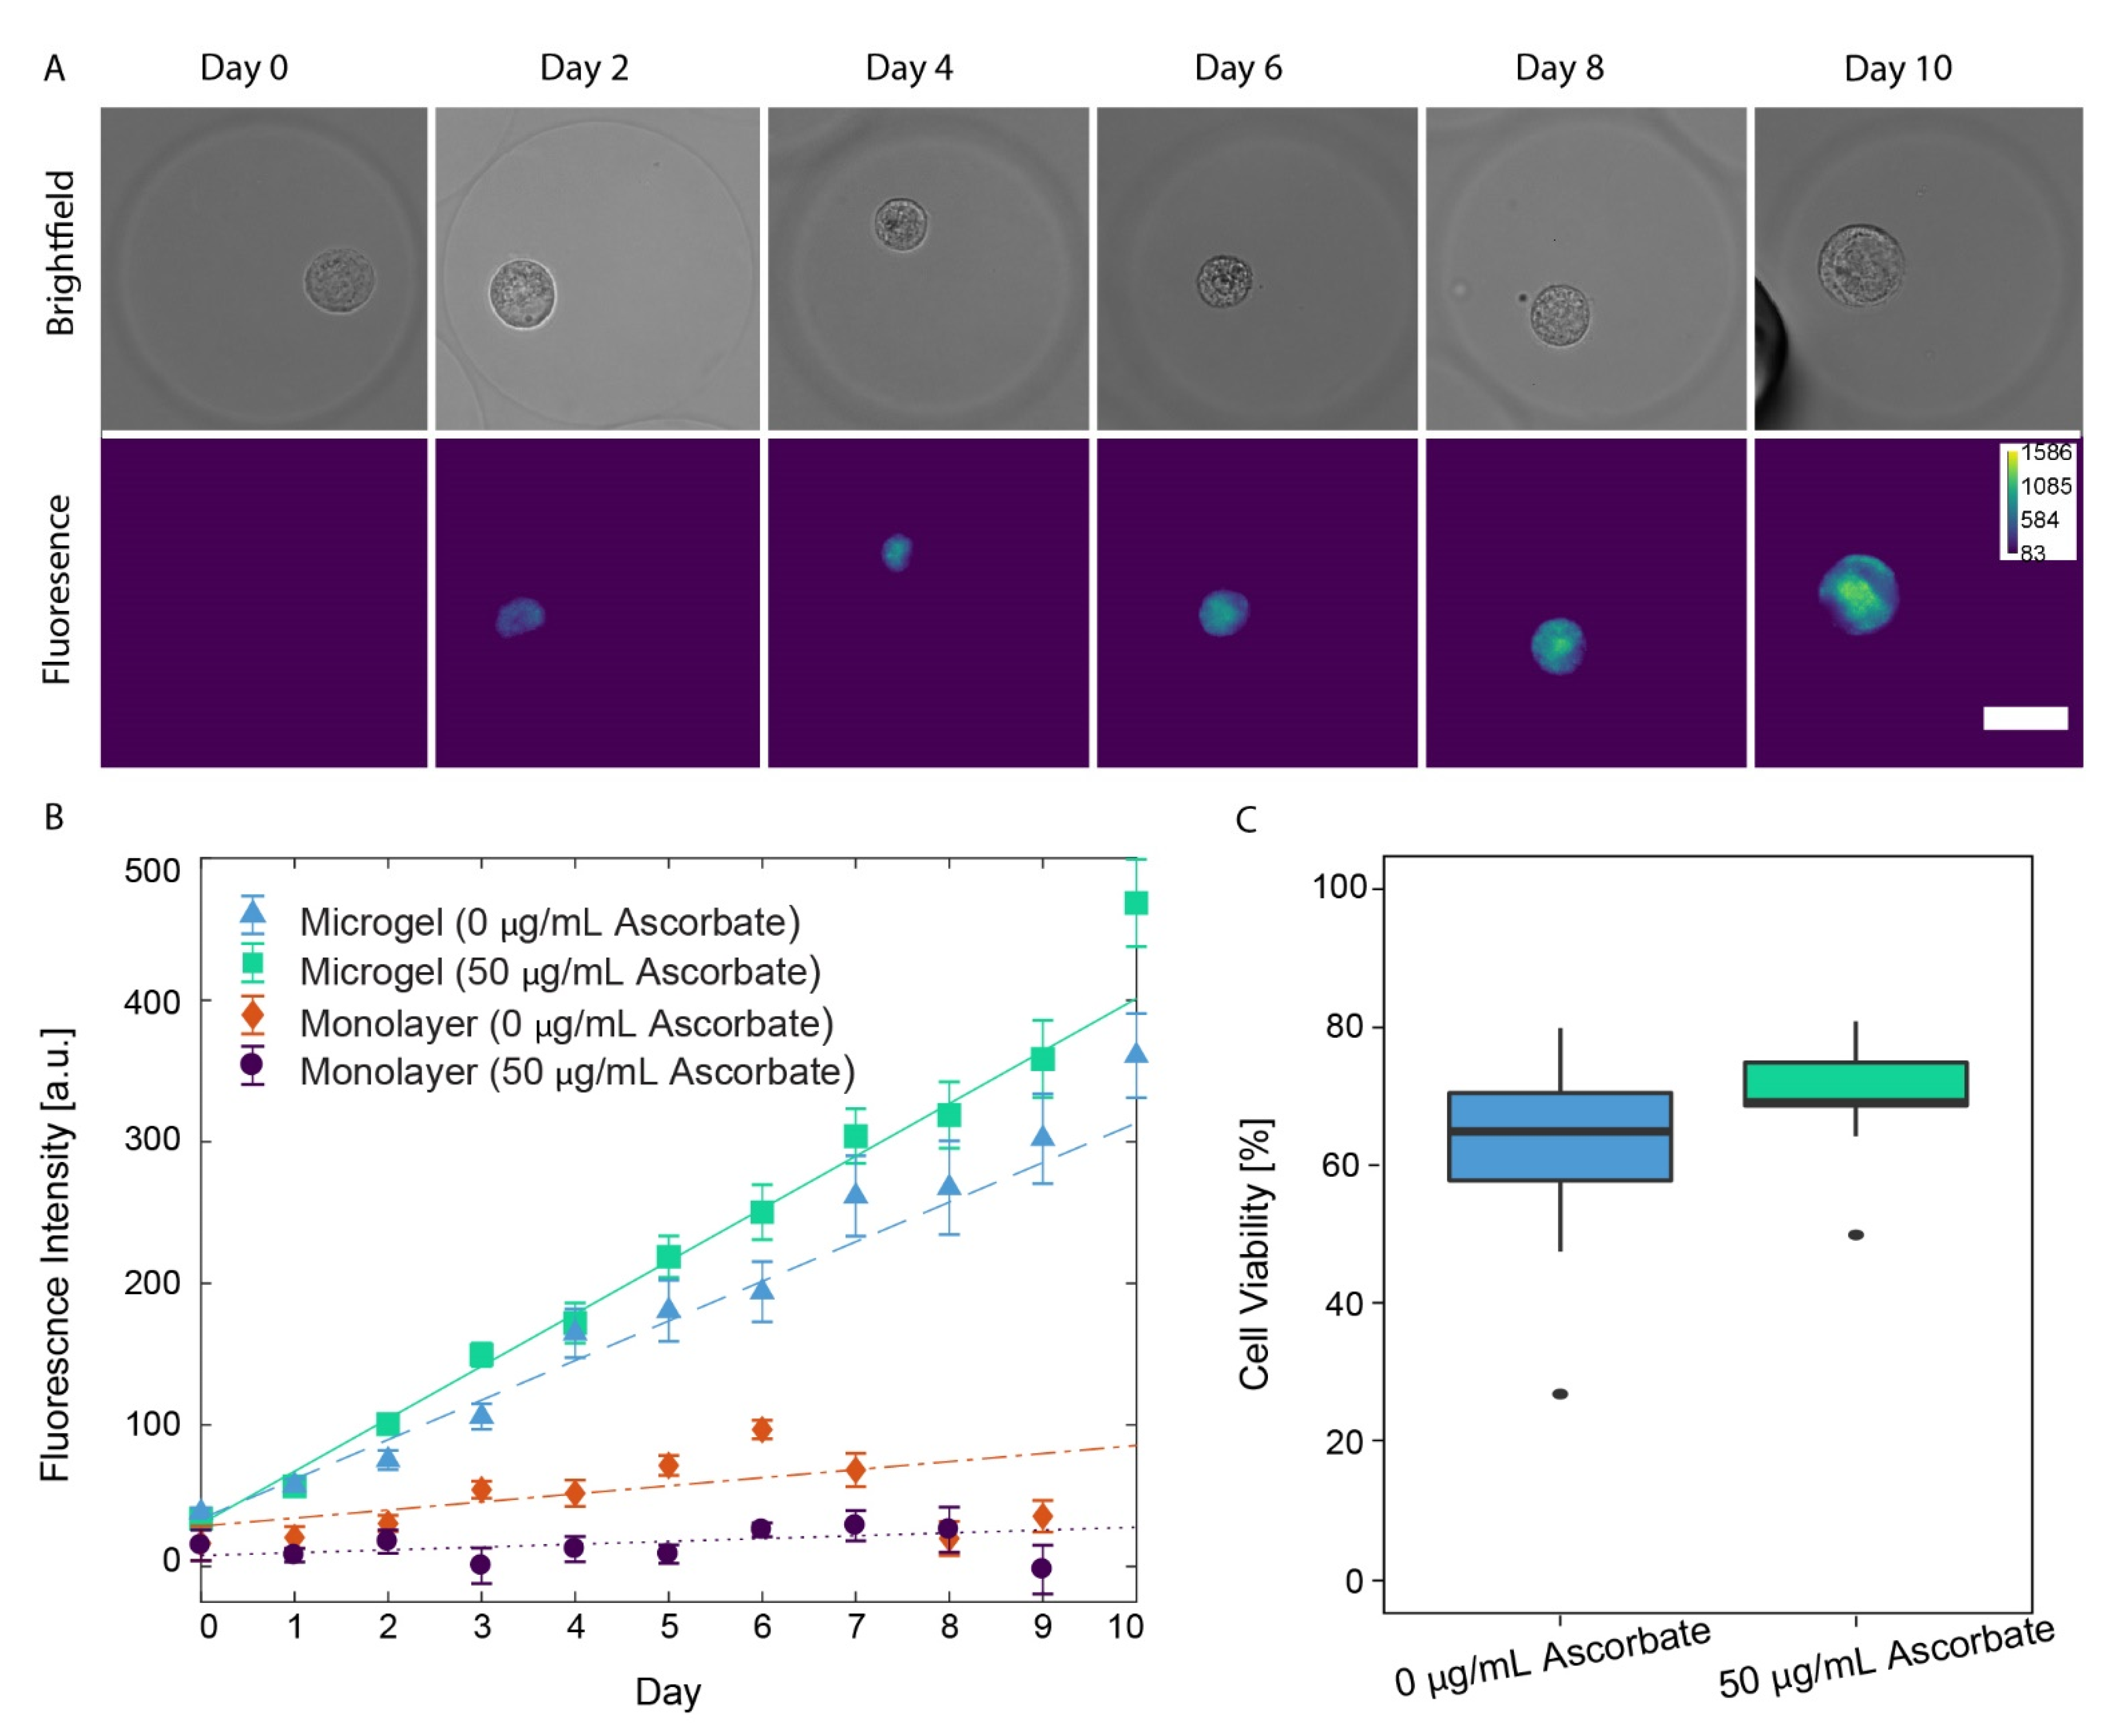
3.4. Auto-Fluorescence of PCM Formation in Alginate Microgels
3.5. Chondrocyte Viability in Alginate Microgels
3.6. Elastic Moduli Characterization of Hydrogel Constructs
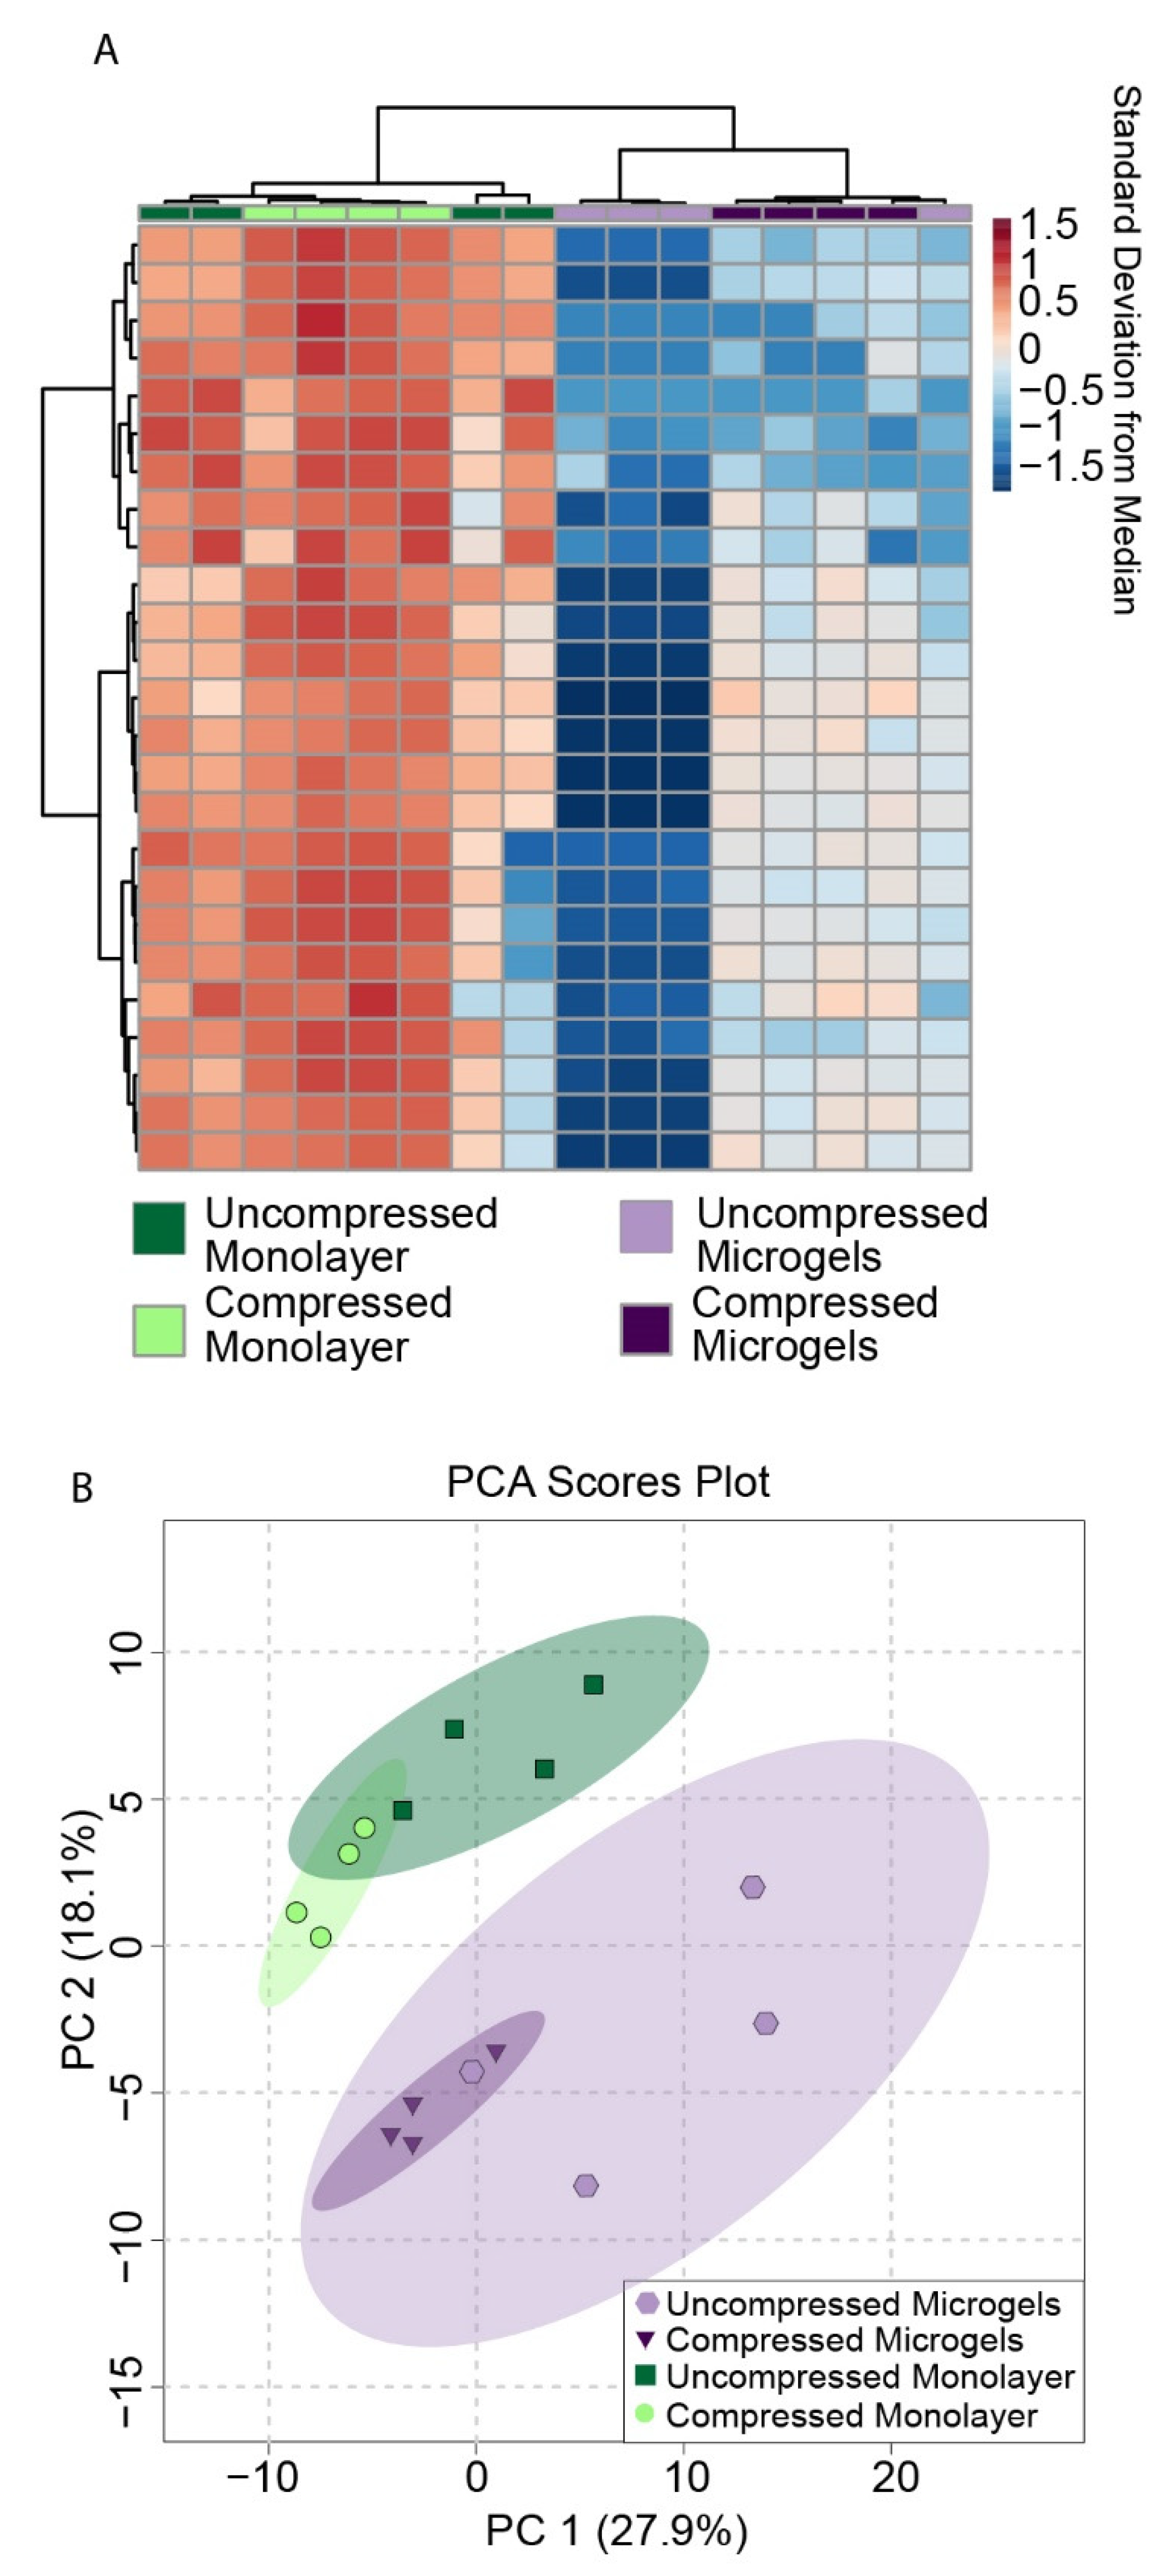
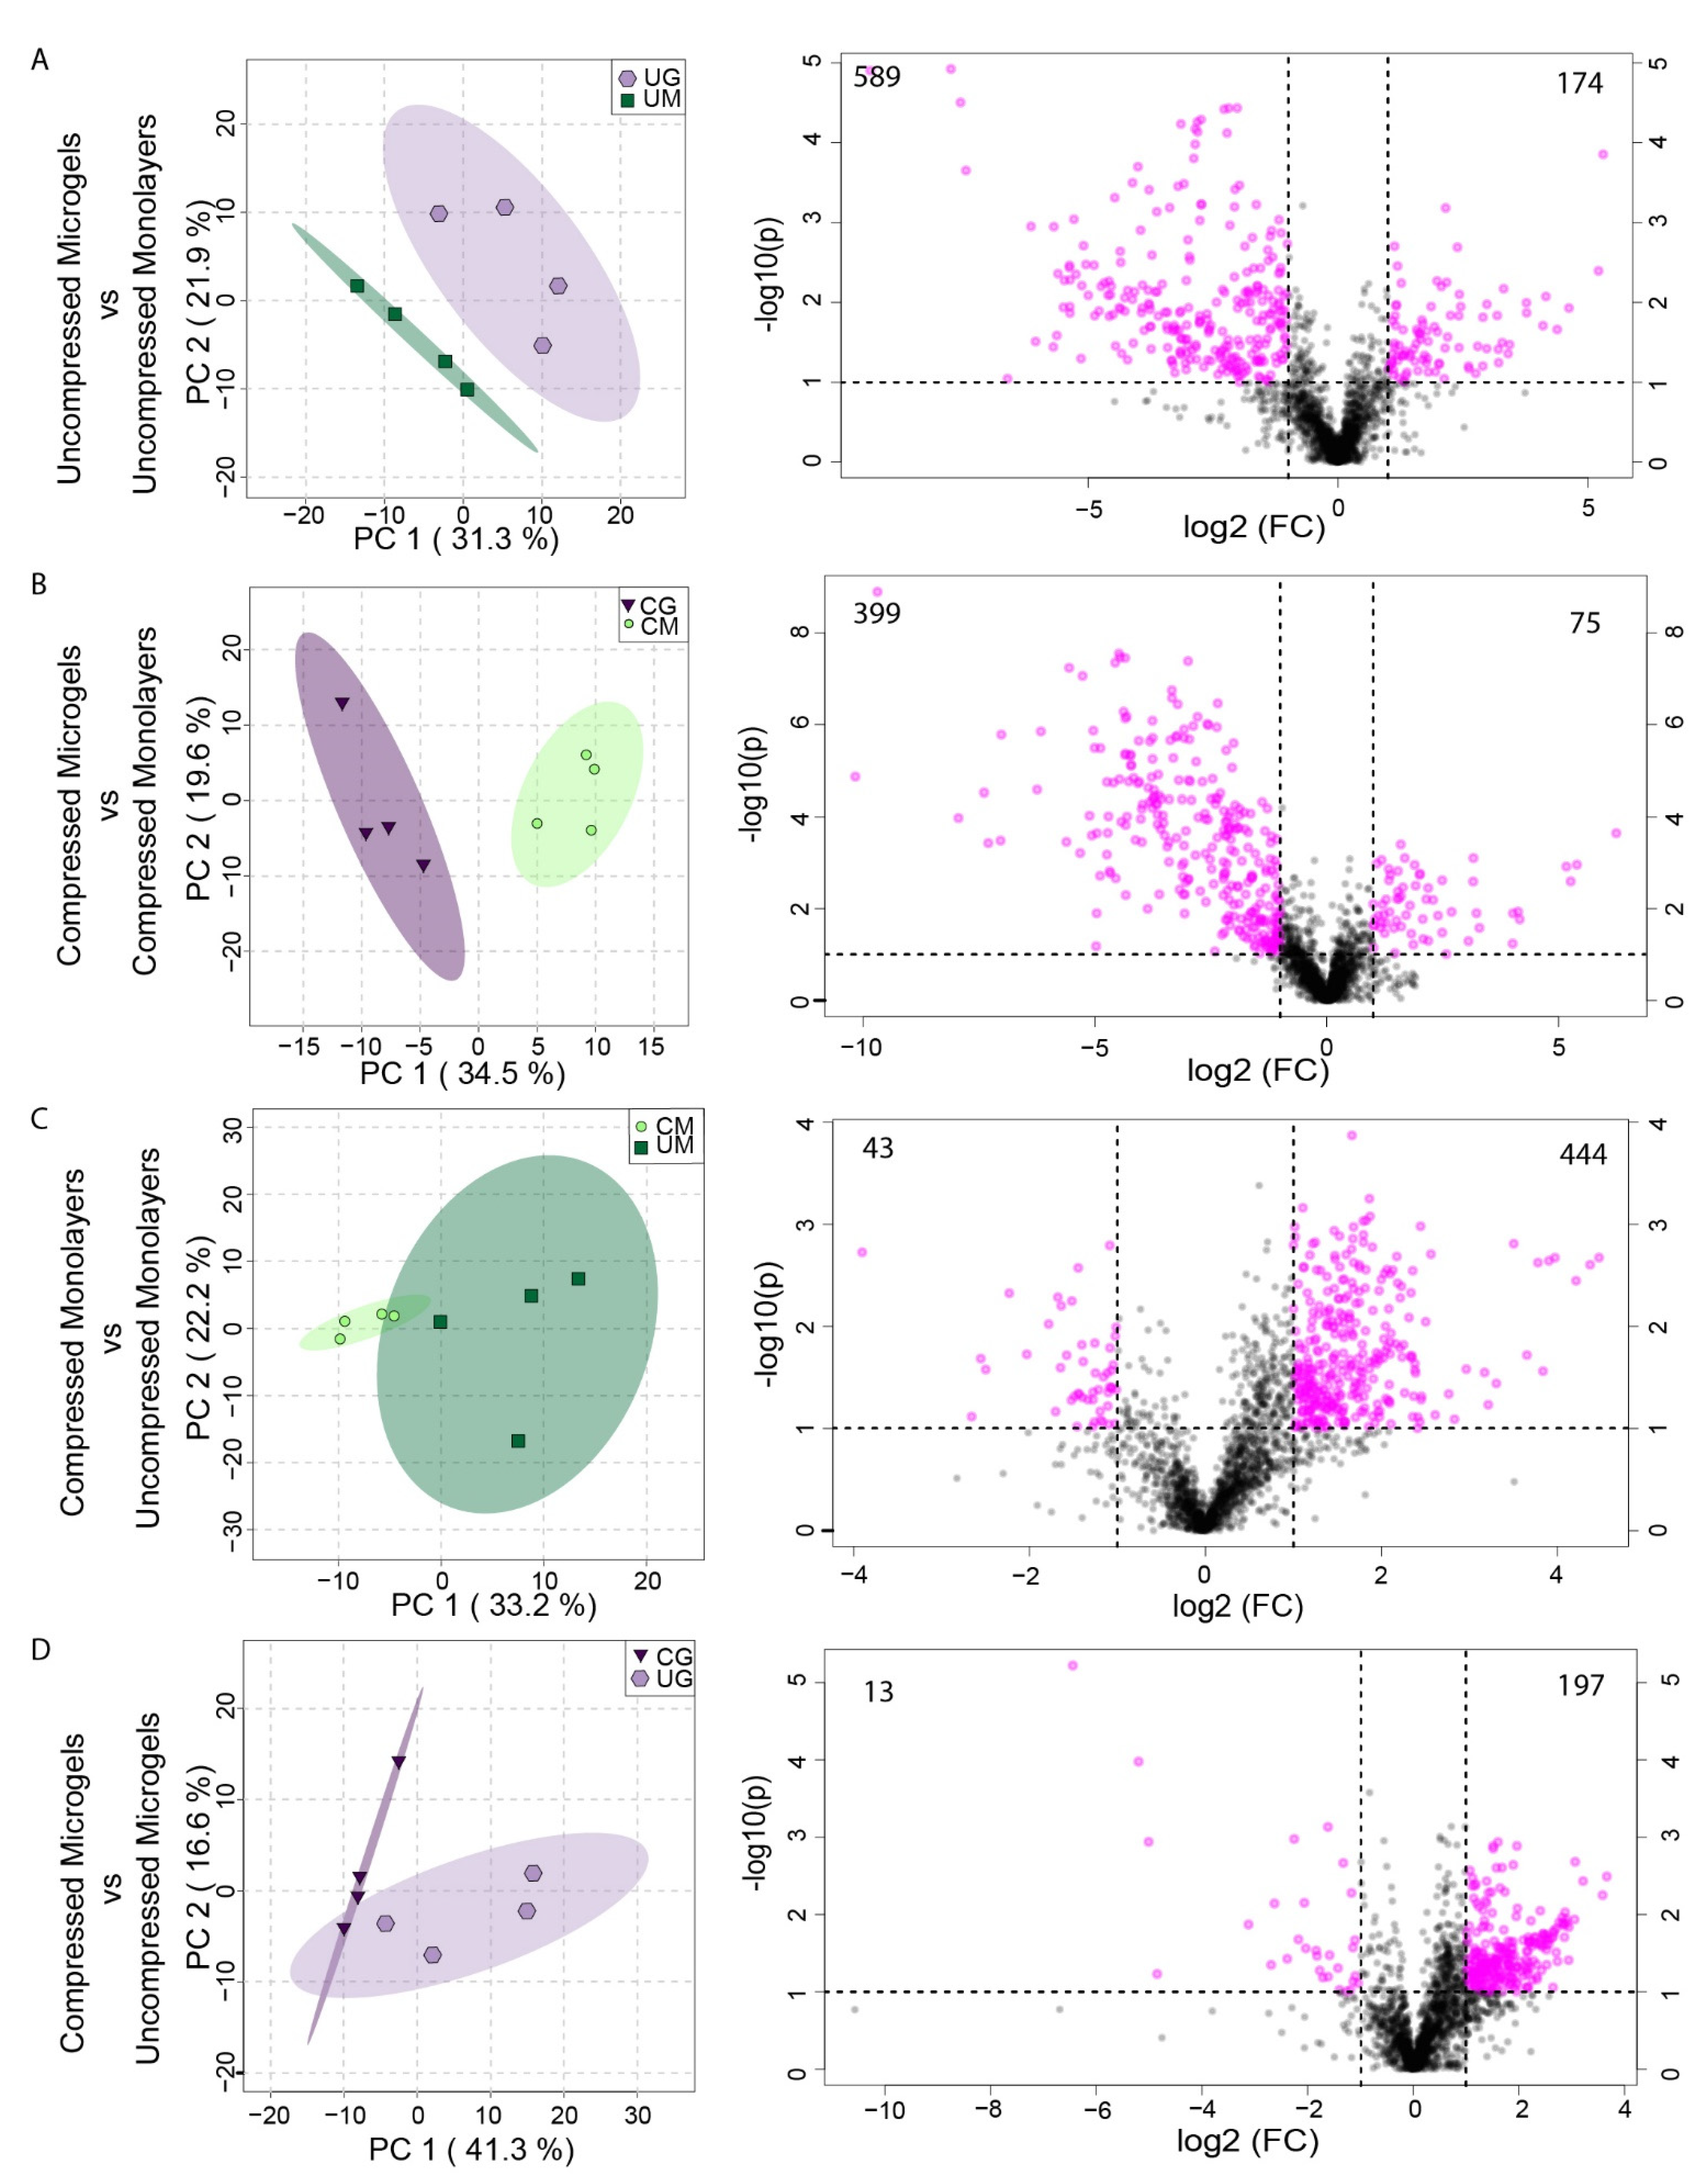
3.7. Metabolomic Profiling of Hydrogel Constructs Containing Compressed and Uncompressed Monolayer and Microgel Cells
4. Conclusions
Supplementary Materials
Author Contributions
Funding
Institutional Review Board Statement
Informed Consent Statement
Data Availability Statement
Acknowledgments
Conflicts of Interest
Abbreviations
| 3-D | Three-dimensional |
| w/w | Weight per weight |
| IRB | Institutional review board |
| v/v | Volume per volume |
| I.U. | International Unit |
| Q | Volumetric Flowrate |
References
- Safiri, S.; Kolahi, A.-A.; Smith, E.; Hill, C.; Bettampadi, D.; Mansournia, M.A.; Hoy, D.; Ashrafi-Asgarabad, A.; Sepidarkish, M.; Almasi-Hashiani, A.; et al. Global, regional and national burden of osteoarthritis 1990–2017: A systematic analysis of the Global Burden of Disease Study 2017. Ann. Rheum. Dis. 2020, 79, 819–828. [Google Scholar] [CrossRef]
- Muir, H. The chondrocyte, architect of cartilage. Biomechanics, structure, function and molecular biology of cartilage matrix macromolecules. Bioessays 1995, 17, 1039–1048. [Google Scholar] [CrossRef] [PubMed]
- Wilusz, R.E.; Sanchez-Adams, J.; Guilak, F. The structure and function of the pericellular matrix of articular cartilage. Matrix Biol. 2014, 39, 25–32. [Google Scholar] [CrossRef] [PubMed]
- Harris, M.D.; Anderson, A.E.; Henak, C.R.; Ellis, B.J.; Peters, C.L.; Weiss, J.A. Finite element prediction of cartilage contact stresses in normal human hips. J. Orthop. Res. 2012, 30, 1133–1139. [Google Scholar] [CrossRef]
- Alexopoulos, L.G.; Haider, M.A.; Vail, T.P.; Guilak, F. Alterations in the mechanical properties of the human chondrocyte pericellular matrix with osteoarthritis. J. Biomech. Eng. 2003, 125, 323–333. [Google Scholar] [CrossRef]
- Salinas, D.; Mumey, B.M.; June, R.K. Physiological dynamic compression regulates central energy metabolism in primary human chondrocytes. Biomech. Model. Mechanobiol. 2019, 18, 69–77. [Google Scholar] [CrossRef] [PubMed]
- Chowdhury, T.T.; Arghandawi, S.; Brand, J.; Akanji, O.O.; Bader, D.L.; Salter, D.M.; Lee, D.A. Dynamic compression counteracts IL-1beta induced inducible nitric oxide synthase and cyclo-oxygenase-2 expression in chondrocyte/agarose constructs. Arthritis Res. Ther. 2008, 10, R35. [Google Scholar] [CrossRef] [PubMed]
- Jutila, A.A.; Zignego, D.L.; Hwang, B.K.; Hilmer, J.K.; Hamerly, T.; Minor, C.A.; Walk, S.T.; June, R.K. Candidate mediators of chondrocyte mechanotransduction via targeted and untargeted metabolomic measurements. Arch. Biochem. Biophys. 2014, 545, 116–123. [Google Scholar] [CrossRef] [PubMed]
- Jutila, A.A.; Zignego, D.L.; Schell, W.J.; June, R.K. Encapsulation of chondrocytes in high-stiffness agarose microenvironments for in vitro modeling of osteoarthritis mechanotransduction. Ann. Biomed. Eng. 2015, 43, 1132–1144. [Google Scholar] [CrossRef] [PubMed]
- McCutchen, C.N.; Zignego, D.L.; June, R.K. Metabolic responses induced by compression of chondrocytes in variable-stiffness microenvironments. J. Biomech. 2017, 64, 49–58. [Google Scholar] [CrossRef] [PubMed]
- Darling, E.M.; Wilusz, R.E.; Bolognesi, M.P.; Zauscher, S.; Guilak, F. Spatial mapping of the biomechanical properties of the pericellular matrix of articular cartilage measured in situ via atomic force microscopy. Biophys. J. 2010, 98, 2848–2856. [Google Scholar] [CrossRef] [PubMed]
- McLeod, M.A.; Wilusz, R.E.; Guilak, F. Depth-dependent anisotropy of the micromechanical properties of the extracellular and pericellular matrices of articular cartilage evaluated via atomic force microscopy. J. Biomech. 2013, 46, 586–592. [Google Scholar] [CrossRef] [PubMed]
- Hauselmann, H.J.; Fernandes, R.J.; Mok, S.S.; Schmid, T.M.; Block, J.A.; Aydelotte, M.B.; Kuettner, K.E.; Thonar, E.J. Phenotypic stability of bovine articular chondrocytes after long-term culture in alginate beads. J. Cell Sci. 1994, 107, 17–27. [Google Scholar] [CrossRef] [PubMed]
- Stoddart, M.J.; Ettinger, L.; Hauselmann, H.J. Generation of a scaffold free cartilage-like implant from a small amount of starting material. J. Cell. Mol. Med. 2006, 10, 480–492. [Google Scholar] [CrossRef] [PubMed]
- Randau, T.M.; Schildberg, F.A.; Alini, M.; Wimmer, M.D.; Haddouti, E.M.; Gravius, S.; Ito, K.; Stoddart, M.J. The effect of dexamethasone and triiodothyronine on terminal differentiation of primary bovine chondrocytes and chondrogenically differentiated mesenchymal stem cells. PLoS ONE 2013, 8, e72973. [Google Scholar] [CrossRef]
- Stokke, B.T.; Draget, K.I.; Smidsrød, O.; Yuguchi, Y.; Urakawa, H.; Kajiwara, K. Small-Angle X-ray Scattering and Rheological Characterization of Alginate Gels. 1. Ca−Alginate Gels. Macromolecules 2000, 33, 1853–1863. [Google Scholar] [CrossRef]
- Yuguchi, Y.; Urakawa, H.; Kajiwara, K.; Draget, K.I.; Stokke, B.T. Small-angle X-ray scattering and rheological characterization of alginate gels. 2. Time-resolved studies on ionotropic gels. J. Mol. Struct. 2000, 554, 21–34. [Google Scholar] [CrossRef]
- Bassett, D.C.; Håti, A.G.; Melø, T.B.; Stokke, B.T.; Sikorski, P. Competitive ligand exchange of crosslinking ions for ionotropic hydrogel formation. J. Mater. Chem. B 2016, 4, 6175–6182. [Google Scholar] [CrossRef]
- Hati, A.G.; Bassett, D.C.; Ribe, J.M.; Sikorski, P.; Weitz, D.A.; Stokke, B.T. Versatile, cell and chip friendly method to gel alginate in microfluidic devices. Lab Chip 2016, 16, 3718–3727. [Google Scholar] [CrossRef]
- Utech, S.; Prodanovic, R.; Mao, A.S.; Ostafe, R.; Mooney, D.J.; Weitz, D.A. Microfluidic Generation of Monodisperse, Structurally Homogeneous Alginate Microgels for Cell Encapsulation and 3D Cell Culture. Adv. Healthc. Mater. 2015, 4, 1628–1633. [Google Scholar] [CrossRef]
- McGuigan, A.P.; Bruzewicz, D.A.; Glavan, A.; Butte, M.J.; Whitesides, G.M. Cell encapsulation in sub-mm sized gel modules using replica molding. PLoS ONE 2008, 3, e2258. [Google Scholar] [CrossRef]
- Zignego, D.L.; Hilmer, J.K.; June, R.K. Mechanotransduction in primary human osteoarthritic chondrocytes is mediated by metabolism of energy, lipids, and amino acids. J. Biomech. 2015, 48, 4253–4261. [Google Scholar] [CrossRef] [PubMed]
- Zignego, D.L.; Hilmer, J.K.; Bothner, B.; Schell, W.J.; June, R.K. Primary human chondrocytes respond to compression with phosphoproteomic signatures that include microtubule activation. J. Biomech. 2019, 97, 109367. [Google Scholar] [CrossRef] [PubMed]
- Duffy, D.C.; McDonald, J.C.; Schueller, O.J.; Whitesides, G.M. Rapid Prototyping of Microfluidic Systems in Poly(dimethylsiloxane). Anal. Chem. 1998, 70, 4974–4984. [Google Scholar] [CrossRef]
- Rueden, C.T.; Schindelin, J.; Hiner, M.C.; DeZonia, B.E.; Walter, A.E.; Arena, E.T.; Eliceiri, K.W. ImageJ2: ImageJ for the next generation of scientific image data. BMC Bioinform. 2017, 18, 529. [Google Scholar] [CrossRef]
- Tinevez, J.Y.; Perry, N.; Schindelin, J.; Hoopes, G.M.; Reynolds, G.D.; Laplantine, E.; Bednarek, S.Y.; Shorte, S.L.; Eliceiri, K.W. TrackMate: An open and extensible platform for single-particle tracking. Methods 2017, 115, 80–90. [Google Scholar] [CrossRef]
- Zignego, D.L.; Jutila, A.A.; Gelbke, M.K.; Gannon, D.M.; June, R.K. The mechanical microenvironment of high concentration agarose for applying deformation to primary chondrocytes. J. Biomech. 2014, 47, 2143–2148. [Google Scholar] [CrossRef]
- Carlson, A.K.; Rawle, R.A.; Wallace, C.W.; Brooks, E.G.; Adams, E.; Greenwood, M.C.; Olmer, M.; Lotz, M.K.; Bothner, B.; June, R.K. Characterization of synovial fluid metabolomic phenotypes of cartilage morphological changes associated with osteoarthritis. Osteoarthr. Cartil. 2019, 27, 1174–1184. [Google Scholar] [CrossRef]
- R Core Team. R: A Language and Environment for Statistical Computing; R Foundation for Statistical Computing: Vienna, Austria, 2019. [Google Scholar]
- Wickham, H. Tidyverse: Easily Install and Load the ‘Tidyverse’. 2017. Available online: https://tidyverse.tidyverse.org/ (accessed on 1 March 2022).
- Daniel, J.C.; Pauli, B.U.; Kuettner, K.E. Synthesis of Cartilage Matrix by Mammalian Chondrocytes In Vitro. III. Effects of Ascorbate. J. Cell Biol. 1984, 99, 1960–1969. [Google Scholar] [CrossRef]
- Benya, P.D.; Shaffer, J.D. Dedifferentiated Chondrocytes Reexpress the Differentiated Collagen Phenotype When Cultured in Agarose Gels. Cell 1982, 30, 215–224. [Google Scholar] [CrossRef]
- Andersson-Engels, S.; Johansson, J.; Svanberg, K.; Svanberg, S. Fluorescence imaging and point measurements of tissue: Applications to the demarcation of malignant tumors and atherosclerotic lesions from normal tissue. Photochem. Photobiol. 1991, 53, 807–814. [Google Scholar] [CrossRef] [PubMed]
- Hoell, T.; Huschak, G.; Beier, A.; Huttmann, G.; Minkus, Y.; Holzhausen, H.J.; Meisel, H.J. Auto fluorescence of intervertebral disc tissue: A new diagnostic tool. Eur. Spine J. 2006, 15 (Suppl. S3), S345–S353. [Google Scholar] [CrossRef] [PubMed][Green Version]
- Rigacci, L.; Alterini, R.; Bernabei, P.A.; Ferrini, P.R.; Agati, G.; Fusi, F.; Monici, M. Multispectral Imaging Autofluorescence Microscopy for the Analysis of Lymph-Node Tissues. Photochem. Photobiol. 2000, 71, 737–742. [Google Scholar] [CrossRef]
- Gebauer, M.; Saas, J.; Sohler, F.; Haag, J.; Soder, S.; Pieper, M.; Bartnik, E.; Beninga, J.; Zimmer, R.; Aigner, T. Comparison of the chondrosarcoma cell line SW1353 with primary human adult articular chondrocytes with regard to their gene expression profile and reactivity to IL-1beta. Osteoarthr. Cartil. 2005, 13, 697–708. [Google Scholar] [CrossRef] [PubMed]
- Huang, S.C.; Wei, J.C.; Wu, D.J.; Huang, Y.C. Vitamin B(6) supplementation improves pro-inflammatory responses in patients with rheumatoid arthritis. Eur. J. Clin. Nutr. 2010, 64, 1007–1013. [Google Scholar] [CrossRef] [PubMed]
- Ma, Q.; Liang, M.; Tang, X.; Luo, F.; Dou, C. Vitamin B5 inhibit RANKL induced osteoclastogenesis and ovariectomy induced osteoporosis by scavenging ROS generation. Am. J. Transl. Res. 2019, 11, 5008. [Google Scholar] [PubMed]
- Nelson, D.L.; Cox, M.M. Lehninger: Principals of Biochemistry; W. H. Freeman and Company: New York, NY, USA, 2008. [Google Scholar]
- Kosai, A.; Horike, N.; Takei, Y.; Yamashita, A.; Fujita, K.; Kamatani, T.; Tsumaki, N. Changes in acetyl-CoA mediate Sik3-induced maturation of chondrocytes in endochondral bone formation. Biochem. Biophys. Res. Commun. 2019, 516, 1097–1102. [Google Scholar] [CrossRef]
- Kanehisa, M.; Furumichi, M.; Sato, Y.; Ishiguro-Watanabe, M.; Tanabe, M. KEGG: Integrating viruses and cellular organisms. Nucleic Acids Res. 2021, 49, D545–D551. [Google Scholar] [CrossRef]
- Zhai, G. Alteration of metabolic pathways in osteoarthritis. Metabolites 2019, 9, 11. [Google Scholar] [CrossRef]
- Ghosh, S.; Scott, A.K.; Seelbinder, B.; Barthold, J.E.; Martin, B.M.S.; Kaonis, S.; Schneider, S.E.; Henderson, J.T.; Neu, C.P. Dedifferentiation alters chondrocyte nuclear mechanics during in vitro culture and expansion. Biophys. J. 2022, 121, 131–141. [Google Scholar] [CrossRef]


Publisher’s Note: MDPI stays neutral with regard to jurisdictional claims in published maps and institutional affiliations. |
© 2022 by the authors. Licensee MDPI, Basel, Switzerland. This article is an open access article distributed under the terms and conditions of the Creative Commons Attribution (CC BY) license (https://creativecommons.org/licenses/by/4.0/).
Share and Cite
Fredrikson, J.P.; Brahmachary, P.P.; Erdoğan, A.E.; Archambault, Z.K.; Wilking, J.N.; June, R.K.; Chang, C.B. Metabolomic Profiling and Mechanotransduction of Single Chondrocytes Encapsulated in Alginate Microgels. Cells 2022, 11, 900. https://doi.org/10.3390/cells11050900
Fredrikson JP, Brahmachary PP, Erdoğan AE, Archambault ZK, Wilking JN, June RK, Chang CB. Metabolomic Profiling and Mechanotransduction of Single Chondrocytes Encapsulated in Alginate Microgels. Cells. 2022; 11(5):900. https://doi.org/10.3390/cells11050900
Chicago/Turabian StyleFredrikson, Jacob P., Priyanka P. Brahmachary, Ayten E. Erdoğan, Zachary K. Archambault, James N. Wilking, Ronald K. June, and Connie B. Chang. 2022. "Metabolomic Profiling and Mechanotransduction of Single Chondrocytes Encapsulated in Alginate Microgels" Cells 11, no. 5: 900. https://doi.org/10.3390/cells11050900
APA StyleFredrikson, J. P., Brahmachary, P. P., Erdoğan, A. E., Archambault, Z. K., Wilking, J. N., June, R. K., & Chang, C. B. (2022). Metabolomic Profiling and Mechanotransduction of Single Chondrocytes Encapsulated in Alginate Microgels. Cells, 11(5), 900. https://doi.org/10.3390/cells11050900