Abstract
Millions of people worldwide are affected by neurodegenerative diseases (NDs), and to date, no effective treatment has been reported. The hallmark of these diseases is the formation of pathological aggregates and fibrils in neural cells. Many studies have reported that catechins, polyphenolic compounds found in a variety of plants, can directly interact with amyloidogenic proteins, prevent the formation of toxic aggregates, and in turn play neuroprotective roles. Besides harboring amyloidogenic domains, several proteins involved in NDs possess arginine-glycine/arginine-glycine-glycine (RG/RGG) regions that contribute to the formation of protein condensates. Here, we aimed to assess whether epigallocatechin gallate (EGCG) can play a role in neuroprotection via direct interaction with such RG/RGG regions. We show that EGCG directly binds to the RG/RGG region of fused in sarcoma (FUS) and that arginine methylation enhances this interaction. Unexpectedly, we found that low micromolar amounts of EGCG were sufficient to restore RNA-dependent condensate formation of methylated FUS, whereas, in the absence of EGCG, no phase separation could be observed. Our data provide new mechanistic roles of EGCG in the regulation of phase separation of RG/RGG-containing proteins, which will promote understanding of the intricate function of EGCG in cells.
1. Introduction
Neurodegenerative diseases (NDs) affect millions of people worldwide and therefore constitute a major public health threat. NDs occur when nerve cells in the brain or peripheral nervous system lose their function over time, leading to cellular death [1]. The hallmarks of these diseases, which encompass Alzheimer’s disease (AD), Parkinson’s disease (PD), amyotrophic lateral sclerosis (ALS), and frontotemporal dementia (FTD), are the formation of pathological aggregates and the presence of abnormal protein deposits in neural cells [2,3,4,5]. Until today, and to our knowledge, no effective treatment has been reported to cure or slow down the progression of these diseases [6,7].
Several studies have demonstrated the role of green tea catechins in neuroprotection, with epigallocatechin gallate (EGCG) being widely studied because it constitutes 65% of all catechins in green tea [8,9,10,11]. The green tea catechins play a variety of roles in neuroprotection, such as exerting (i) anti-oxidative properties through radical scavenging and metal ion chelation [12,13,14], (ii) anti-apoptotic properties through the reduction in pro-apoptotic gene expression [15], (iii) anti-inflammatory properties through the inhibition of microglia activation [16], and (iv) anti-amyloidogenic properties through the remodeling of toxic aggregates [8,17]. The latter role of catechins in neuroprotection is of great interest as it counteracts the hallmark of NDs (formation of protein aggregates), which is thought to drive the process of neurodegeneration. Indeed, EGCG has been shown to directly interact with various amyloidogenic proteins, such as amyloid-β or α-synuclein, involving their low-complexity domains, thus inhibiting their propensity to form toxic aggregates [18,19,20,21,22]. Several amyloidogenic proteins harbor, in addition to their amyloidogenic domain (AD), regions rich in arginine and glycine residues (RG/RGG), and these regions contribute to their propensity to phase separate and possibly aggregate in (patho)physiological conditions [23,24,25,26,27,28]. Given that EGCG possesses several aromatic rings that could mediate cation–π interactions with arginines of RG/RGG regions, we hypothesized that EGCG directly interacts with the RG/RGG region of these amyloidogenic proteins, modulates the formation of biomolecular condensates, and in turn contributes to the neuroprotective effect of EGCG.
To this end, we chose fused in sarcoma (FUS) as a model protein. FUS contains a N-terminal SYGQ-rich domain, with prion-like properties, as well as several RG/RGG-rich regions in its C-terminal disordered tail (Figure 1A). Both the prion-like domain and the RGG3-PY region of FUS have been shown to contribute to FUS phase separation and stress granule (SG) association. Aggregation and/or fibril formation of FUS has been linked to several (patho)physiological conditions [23,27,29]. For example, FUS cytoplasmic aggregates were found in neuronal cells of ALS and FTD patients and proposed to drive neurodegeneration. Therefore, we asked the question of whether EGCG can directly bind to the RGG3-PY region of FUS (FUSRGG3PY), thereby modulating its propensity to phase separate.
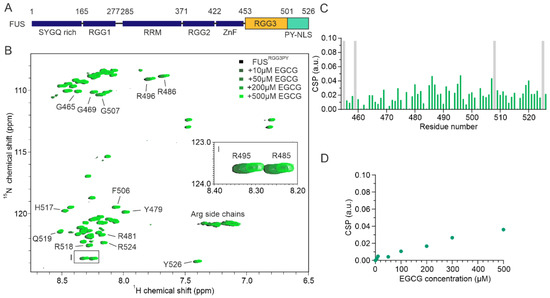
Figure 1.
FUSRGG3PY binds directly to EGCG. (A) Scheme of the FUS domain organization; SYGQ-rich, RRM (RNA-recognition motif), ZnF (Zinc finger), PY-NLS (proline-tyrosine nuclear localization signal), arginine-glycine/glycine (RG/RGG). (B) Overlay of 1H-15N HSQC spectra of 30 µM 15N-labeled FUSRGG3PY in the absence (black) and presence of the increasing concentrations of EGCG, ranging from 10 to 500 µM (colored in a gradient of green). The region corresponding to arginine R485 and R495 1H-15N HSQC cross-peaks is represented as a zoomed-in image on the middle right side of the spectrum. (C) Chemical shift perturbation (CSP) plot of FUSRGG3PY 1H-15N HSQC cross-peaks in the presence of 500 µM EGCG (samples from (B)). Proline residues lacking a backbone amide signal are indicated in gray. (D) CSP plot of a FUSRGG3PY 1H-15N cross-peak corresponding to R495 plotted as a function of EGCG concentration (samples from (B)).
Here, we used nuclear magnetic resonance (NMR) spectroscopy to obtain molecular details on EGCG binding to FUS and its regulation by FUS arginine methylation and RNA binding. We used turbidity assays and differential contrast microscopy (DIC) in order to decipher the role of EGCG, RNA, and arginine methylation on FUS condensate formation. We found that EGCG directly interacts with the RGG3-PY region of FUS in a non-specific and arginine methylation-independent manner, leading to the formation of FUS condensates at high micromolar EGCG concentrations. We uncovered that RNA can directly interact with both methylated and unmethylated FUSRGG3PY and that FUS phase separation was inhibited by methylation. Unexpectedly, arginine methylation of FUS enhanced its EGCG affinity by several orders of magnitude, and EGCG restored RNA-driven phase separation of methylated FUS at low micromolar concentrations.
In summary, our data provide unexpected evidence that EGCG can compensate for the inhibitory effect of arginine methylation on RNA-driven phase separation of RG/RGG regions. Although further studies are required to investigate the physiological significance of EGCG in the regulation of condensate formation, our studies shed light on the new mechanistic functions of EGCG that will promote a better understanding of the various roles of EGCG in human cells.
2. Materials and Methods
2.1. Recombinant Protein Expression and Purification
Recombinant His6-protein A-tagged FUSRGG3PY (amino acids 454–526), His6-protein A-tagged FOXO4CR3 (amino acids 454–505), and His6-protein A-tagged axin-1 (amino acids 351–500) containing a tobacco etch virus (TEV) protease cleavage site after protein A were expressed from codon-optimized synthetic genes inserted into pETM11-based vectors (Genscript, Piscataway, NJ, USA). For the expression of recombinant protein, the construct was transformed into E. coli BL21(DE3) Star cells, and grown in a standard lysogeny broth (LB) medium (Carl Roth GmbH, Karlsruhe, Germany) at 37 °C until an optical density (OD 600 nm) value has reached 0.6–0.8. Then, cells were induced with 1 mM isopropyl β-d-1-thiogalactopyranoside (IPTG), (BLD Pharmatech GmbH, Kaiserslautern, Germany) and grown for 16 h at 20 °C. For the purpose of NMR experiments, 10 mL overnight precultures were transferred to minimal media (100 mM KH2PO4, 50 mM K2HPO4, 60 mM Na2HPO4, 14 mM K2SO4, 5 mM MgCl2, pH 7.2 adjusted with HCl and NaOH with 0.1 dilution of trace element solution (41 mM CaCl2, 22 mM FeSO4, 6 mM MnCl2, 3 mM CoCl2, 1 mM ZnSO4, 0.1 mM CuCl2, 0.2 mM (NH4)6Mo7O24, 17 mM EDTA) (all chemical compounds here and below, if not further specified, were purchased from Carl Roth GmbH, Karlsruhe, Germany. FeSO4, ZnSO4 CuCl2 and (NH4)6Mo7O24 from VWR International bvba, Leuven Belgium, CoCl2 from AppliChem GmbH - An ITW Company, Darmstadt, Germany) supplemented with 1 g of 15NH4Cl (Eurisotop, Saint-Aubin, France), and either with 6 g of unlabeled glucose or 2 g of 13C6H12O6 (Cambridge Isotope Laboratories, Tewksbury, MA, USA), followed by a growth as described for unlabeled protein. Cells were harvested (6,000 rpm for 10 min at 4 °C), transferred to a denaturing lysis buffer (50 mM Tris-HCl pH 7.5, 150 mM NaCl, 20 mM imidazole, 6 M urea), and sonicated (70% amplitude, 1 s pulse for 12 min on ice bath with Qsonica MC-18 sonicator (Qsonica, Newtown, CT, USA). His6-protein A-tagged FUSRGG3PY, FOXO4CR3 and axin-1 were purified using nickel-nitrilotriacetic (Ni-NTA) agarose resin (Carl Roth GmbH, Karlsruhe, Germany) and eluted into buffer containing 50 mM Tris-HCl pH 7.5, 1 M NaCl, 500 mM imidazole, 2 mM tris(2-carboxyethyl)phosphine (TCEP) (BLD Pharmatech GmbH, Mehlingen, Germany), 0.04% NaN3. The eluted protein was desalted to buffer containing 50 mM Tris-HCl pH 7.5, 150 mM NaCl, 20 mM imidazole, 2 mM TCEP, 0.04% NaN3, and subjected to overnight TEV treatment at 4 °C. The cleaved FUSRGG3PY, FOXO4CR3, or axin-1 were then isolated by a second affinity purification using Ni-NTA beads. A final size-exclusion chromatography purification step was performed in the buffer of interest with the use of Superdex 75 Increase 10/300 GL column (GE Healthcare Bio-Sciences AB, Uppsala, Sweden) at room temperature. Fractions corresponding to FUSRGG3PY, FOXO4CR3, or axin-1 were identified by SDS PAGE gel and either used immediately for experiments or stored at −80 °C until further use.
Recombinant rat His6-PRMT1 (amino acids 11–353) was inserted into a pET28b-His6 vector (Novagen, Merck, Darmstadt, Germany), and the expression has been previously described [30]. The expression construct was transformed into E. coli BL21(DE3) star cells, and 10 mL of overnight preculture was transferred to 1 L of LB medium. The expression culture was grown at 37 °C and at 160 rpm, and cells were induced at an OD 600 nm of 0.6–0.8 with 1 mM IPTG, followed by protein expression for 16 h at 20 °C and at 160 rpm. Cells were harvested (6,000 rpm for 10 min at 4 °C) and lysed by sonication (70% amplitude, 1 s pulse for 12 min on ice bath with Qsonica MC-18 sonicator in a non-denaturing lysis buffer (50 mM Tris-HCl pH 7.5, 150 mM NaCl, 20 mM imidazole, 2 mM TCEP, 10% (v/v) glycerol). Uncleaved His6-PRMT1 was then purified using 5 mL HisTrap HP column (Cytiva Europe GmbH, Vienna, Austria) at 4 °C and eluted with 10 column volumes into buffer containing 50 mM Tris-HCl pH 7.5, 1 M NaCl, 500 mM imidazole, 2 mM TCEP, 0.04% NaN3. The eluted His6-PRMT1 was desalted into methylation buffer (50 mM Na2HPO4/NaH2PO4 pH 8.0, 150 mM NaCl, 2 mM dithiothreitol (DTT, AppliChem GmbH, Darmstadt, Germany), 0.04% NaN3) using a HiPrep 26/10 Sephadex G-25 desalting column (GE Healthcare Bio-Sciences AB, Uppsala, Sweden) and stored overnight at 4 °C. As a final polishing step, size-exclusion chromatography purification was performed in the methylation buffer using a Superdex 200 Increase 10/300 GL column (GE Healthcare Bio-Sciences AB, Uppsala, Sweden) at 4 °C. Fractions corresponding to PRMT1 were identified by SDS PAGE gel and used immediately for experiments.
The in vitro methylation reaction of FUSRGG3PY was performed as follows. For the reaction, respective size-exclusion fractions of FUSRGG3PY and PRMT1 were eluted into the methylation buffer and collected. FUSRGG3PY was in vitro methylated by incubation with PRMT1 in the presence of 2 mM S-adenosyl-L-methionine (SAM) at room temperature for 24 h, and PRMT1 was used at a molar ratio of 1:2 for FUSRGG3PY. In vitro methylated FUSRGG3PY (meFUSRGG3PY) was then isolated from PRMT1 by heating for 10 min at 95 °C and applying the sample on a size-exclusion chromatography column in the buffer of interest (Superdex 75 Increase 10/300 GL).
2.2. Turbidity Assay
For turbidity assays, FUSRGG3PY and meFUSRGG3PY samples were prepared in 50 mM sodium succinate pH 6.0, 150 mM NaCl, 2 mM TCEP, 0.04% NaN3. Turbidity measurements were conducted at 620 nm in 96-well plates with 90-μL samples with the use of a CLARIOstar Plate Reader (BMG LABTECH GmbH, Ortenberg, Germany).
2.3. Differential Interference Contrast Microscopy
FUSRGG3PY and meFUSRGG3PY samples were prepared in 50 mM sodium succinate pH 6.0, 150 mM NaCl, 2 mM TCEP, 0.04% NaN3. The 30-μL sample was plated on a 30 mm No. 1 round glass coverslip and mounted on an Observer D1 microscope with 100×/1.45 oil immersion objective (Zeiss, White Plains, NY, USA). Protein droplets were viewed using a HAL100 halogen lamp, and images were captured with an OrcaD2 camera (Hamamatsu, Japan) using VisiView 4.0.0.13 software (Visitron Systems GmbH, Puchheim, Germany). The formation of droplets was induced by the addition of RNA/EGCG to all protein samples, and pictures were recorded for a duration of 1 h after the addition of RNA/EGCG.
2.4. NMR Spectroscopy
All NMR experiments were conducted at 25 °C on a Bruker 600 MHz spectrometer (Bruker Biospin, Rheinstetten, Germany) equipped with a TXI probe equipped with z-axis gradients and using between 30 and 600 µM of [U-15N]- or [U-15N,13C]-labeled FUSRGG3PY. All spectra were processed using TopSpin 4.0.9, and heteronuclear spectra were analyzed with the use of NMRFAM-Sparky 3.114, [31] and CcpNMR 2.4.2 [32] software. All experiments, except axin-1 and FOXO4CR3 titrations, were performed using protein samples prepared in 50 mM sodium succinate pH 6.0, 150 mM NaCl, 2 mM TCEP, 0.04% NaN3, and 10% (v/v) deuterium oxide (Eurisotop, Saint-Aubin, France) was added for the lock signal in all samples. Axin1-EGCG titrations were performed in 50 mM NaH2PO4/Na2HPO4 pH 6.5, 150 mM NaCl, 2 mM DTT and 10% (v/v) deuterium oxide. FOXO4 CR3-EGCG titrations were performed in 50 mM NaH2PO4/Na2HPO4 pH 6.5, 2 mM DTT and 10% (v/v) deuterium oxide. The following experiments were recorded: 1H-15N HSQC, 1H-13C HSQC, 1H-1H NOESY, heteronuclear 15N{1H} NOE, (H)CC(CO)NH, CBCA(CO)NH, HN(CA)NNH(N), and HN(CA)NNH(H). The assigned spectra were uploaded to Biological Magnetic Resonance Bank and are available under the accession codes 51314 and 51315. For the chemical shift perturbation (CSP) analysis, normalized values of FUSRGG3PY/meFUSRGG3PY 1H-15N cross-peaks upon binding to RNA and/or EGCG were calculated according to the following formula:
where δH corresponds to the 1H chemical shift difference between FUSRGG3PY/meFUSRGG3PY 1H-15N cross-peaks in the bound and free states, and δN denotes the 15N chemical shift difference between FUSRGG3PY/meFUSRGG3PY 1H-15N cross-peaks in the bound and free states, respectively.
3. Results
We successfully expressed and purified recombinant FUSRGG3PY and PRMT1 to perform in vitro methylation. Using non-methylated FUSRGG3PY and methylated FUSRGG3PY (meFUSRGG3PY) samples, we carried out solution-based characterization of the (me)FUSRGG3PY interactions with EGCG and RNA as well as their implications in liquid-liquid phase separation.
3.1. EGCG Directly Interacts with the RGG3-PY Region of FUS with High Micromolar Affinity
We firstly aimed to assess whether EGCG can directly interact with the RGG3-PY region of FUS. To obtain residue-resolved information of this putative interaction, we performed NMR spectroscopy-derived titrations of recombinant 15N isotope-labeled FUSRGG3PY in the absence or presence of EGCG. Stepwise addition of EGCG resulted in a progressive line broadening and chemical shift perturbation (CSP) of several 1H-15N FUSRGG3PY cross-peaks (Figure 1B,C). This shows that EGCG can directly interact with the RGG3-PY region of FUS with a binding affinity in the high micromolar to the millimolar range, as suggested by the linear increase in CSPs upon EGCG addition (Figure 1D). A closer inspection of 1H-15N FUSRGG3PY cross-peaks affected by the addition of EGCG revealed that the entire FUS RGG3-PY region is affected, suggesting several EGCG binding sites (Figure 1B–D).
3.2. Arginine Methylation of the RGG3-PY Region of FUS Enhanced Binding to EGCG
Several studies have shown that FUS can be specifically methylated on several arginines by the protein arginine N-methyltransferase 1 (PRMT1) [23,33,34]. Here, our objective was to assign methylated arginine residues in FUSRGG3PY using NMR spectroscopy and then assess the effect of FUSRGG3PY arginine methylation on EGCG binding. We, therefore, carried out in vitro arginine methylation of FUSRGG3PY using purified recombinant PRMT1 and tested the effect of arginine methylation on EGCG binding employing NMR spectroscopy.
Successful methylation of several arginines, including several previously published residues [35], was confirmed by NMR spectroscopy using (H)CC(CO)NH experiments (Figure 2A,B). Methylated arginines exhibit a carbon delta (Cδ) resonance shifted by about 2 ppm compared to unmethylated arginines (Figure 2B). This allowed us to cluster arginines in FUSRGG3 depending on their degree of methylation in three groups: (a) unmethylated arginines (R472, R498, R503, and R514), (b) partly methylated arginines (R473, R476) (c) methylated arginines (R481, R485, R487, R491, R495) (Figure 2B). Arginines in the FUSPY region remain unmethylated. To investigate the impact of arginine methylation on the local rigidity of FUSRGG3PY, we performed 15N{1H} heteronuclear NOE experiments using isotopically labeled un- and methylated FUSRGG3PY (Appendix A Figure A1). The observed low heteronuclear NOE values indicate that both un- and methylated FUSRGG3PY are intrinsically disordered, in which methylation status has only negligible effects on the variation of local rigidity. Overall, we identified multiple methylated arginines well-distributed along the RGG3-PY region of FUS.

Figure 2.
Arginine methylation of FUSRGG3PY and EGCG binding of meFUSRGG3PY. (A) Overlay of 1H-15N HSQC spectra of 30 µM 15N-labeled FUSRGG3PY (black) and PRMT1-methylated meFUSRGG3PY (orange). (B) Strip plots of (H)CC(CO)NH NMR spectra corresponding to the Cδ atoms of arginines of PRMT1-methylated FUSRGG3PY. 13Cδ of 1H-13C cross-peaks corresponding to methylated and non-methylated arginine residues are indicated by dotted lines. (C) Overlay of 1H-15N HSQC spectra of 30 µM 15N-labeled meFUSRGG3PY in the absence (black) and presence of increasing concentrations of EGCG, ranging from 10 to 500 µM (colored in a gradient of orange). The region corresponding to R485 and R495 1H-15N HSQC cross-peaks is shown as a zoomed-in image on the middle right side of the spectrum. (D) CSP plot of meFUSRGG3PY 1H-15N HSQC cross-peaks in the presence of 500 µM EGCG (samples from (C)). Proline residues lacking a backbone amide signal are shown in gray. (E) CSP plot of a meFUSRGG3PY 1H-15N cross-peak corresponding to R495 plotted as a function of EGCG concentration (samples from (C)).
To decipher whether arginine methylation in FUSRGG3PY alters its binding with EGCG, we performed an NMR-based titration by stepwise addition of EGCG in a solution containing meFUSRGG3PY. This resulted in a progressive line broadening (Figure 2C) as well as higher CSPs of several 1H-15N meFUSRGG3PY cross-peaks, in comparison to FUSRGG3PY (Figure 2D). Interestingly, increased CSPs were mostly found in the region of amino acids 480–500, which corresponds to the region containing methylated arginines. This suggested a higher affinity of EGCG to methylated FUS, resulting from arginine methylation in the RG/RGG region. Overall, our data revealed that PRMT1-mediated arginine methylation of the FUS RGG3-PY region enhances its EGCG binding.
3.3. Arginine Methylation Does Not Abrogate RNA or EGCG Binding of FUSRGG3-PY
We and others have previously demonstrated that RNA can directly interact with RG/RGG regions of several RNA-binding proteins (RBPs), including FUS, CIRBP, and hnRNP family proteins [23,24,25,36,37]. This prompted us to determine whether (i) arginine methylation of the FUSRGG3PY is compatible with RNA binding and whether (ii) RNA binding affects EGCG binding of methylated or unmethylated FUSRGG3PY, respectively. We first tested the effect of FUSRGG3PY arginine methylation on RNA binding using NMR spectroscopy. Stepwise addition of (UG)12 RNA to solutions of either 15N-labeled methylated or unmethylated FUSRGG3PY caused CSPs of several 1H-15N (me)FUSRGG3PY cross-peaks (Figure 3A–C). In addition to CSPs, line broadening was observed for unmethylated FUS. The CSPs of meFUSRGG3-PY binding to RNA at 4:1 molar ratio are higher than the CSPs of FUSRGG3PY (Figure 3C). These results indicated that RNA is binding to both unmethylated and methylated RGG3-PY regions of FUS but is stronger with the methylation of arginines. The line broadening observed for unmethylated FUS is likely a result of its propensity to phase separate in the presence of RNA, as previously published [23].
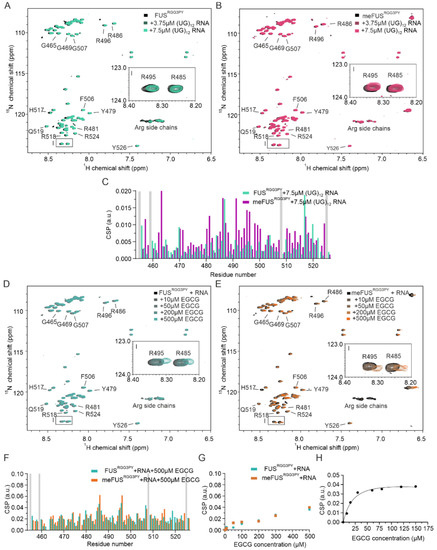
Figure 3.
Role of RNA in FUSRGG3PY and meFUSRGG3PY -EGCG binding. (A,B) Overlays of 1H-15N HSQC spectra of 30 µM 15N-labeled FUSRGG3PY (A) and 30 µM 15N-labeled meFUSRGG3PY (B) in the absence (black) and presence of the increasing concentrations of (UG)12 RNA, at 0, 3.75, and 7.5 µM (colored in a gradient of green for the samples of FUSRGG3PY, and in a gradient of magenta for the samples of meFUSRGG3PY). (C) Overlay of CSP plots of FUSRGG3PY (green) and meFUSRGG3PY (magenta) 1H-15N HSQC cross-peaks in the presence of 7.5 µM (UG)12 RNA (samples from (A), (B)). Proline residues lacking a backbone amide signal are indicated in gray. (D,E) Overlay of 1H-15N HSQC spectra of 30 µM 15N-labeled FUSRGG3PY (D) and 30 µM 15N-labeled meFUSRGG3PY (E) in the presence of 7.5 µM (UG)12 RNA. The 1H-15N HSQC spectra recorded at increasing concentrations of EGCG, ranging from 10 to 500 µM, are colored in a gradient of blue and orange for the samples of FUSRGG3PY and meFUSRGG3PY, respectively. The regions corresponding to R485 and R495 1H-15N HSQC cross-peaks are indicated by zoomed-in images on the middle right side of the spectra. (F) Overlay of CSP plots of 1H-15N HSQC cross-peaks of FUSRGG3PY (blue) and meFUSRGG3PY (orange), in the presence of 7.5 µM (UG)12 RNA and 500 µM EGCG (samples from (D,E)). Proline residues lacking a backbone amide signal are shown in gray. (G) CSP plots of FUSRGG3PY (blue) and meFUSRGG3PY (orange), both in the presence of 7.5 µM (UG)12 RNA. 1H-15N cross-peaks corresponding to R495 are plotted as a function of EGCG concentration (samples from (D,E)). (H) CSP plot of a 1H-15N cross-peak corresponding to R487 of meFUSRGG3PY in the presence of 7.5 µM (UG)12 RNA plotted for increasing concentrations of EGCG. The associated Kd is estimated to be 21.7 ± 9.6 µM.
We then performed NMR-based titrations of methylated and unmethylated FUSRGG3PY with increasing amounts of EGCG using a fixed concentration of (UG)12 RNA. In both titrations, we observed CSPs and line broadening of several 1H-15N (me)FUSRGG3PY cross-peaks (Figure 3D–F), showing that the presence of RNA is compatible with EGCG binding to the (me)FUSRGG3PY. The CSPs of 1H-15N FUSRGG3PY cross-peaks increase linearly with increasing EGCG concentration for unmethylated FUS (Figure 3G), as observed before in the absence of RNA, suggesting a non-specific binding. On the contrary, we observed specific binding of EGCG to meFUSRGG3PY in the presence of RNA in the low micromolar concentration range, with an associated dissociation constant (KD) of 21.7 ± 9.6 µM (Figure 3G,H). This specific binding of EGCG to the meFUSRGG3PY was not observed in the absence of RNA (Figure 2E), suggesting that multiple binding modes involving RNA and methylated arginines are the key molecular determinants to provide specific binding of EGCG to FUSRGG3PY.
3.4. EGCG Binds to meFUSRGG3PY Involving Its Methylated Arginines
It has been previously found that methylation of FUSRGG3PY by PRMT1 generates asymmetric dimethylarginine (ADMA) and monomethylarginine (MMA) by adding two or one methyl group, respectively, to one of the nitrogen atoms of the arginine guanidinium group [38]. Here, we observed the ADMA/MMA methyl protons as additional peaks in the 1H NMR spectra (Figure 4A). To investigate whether EGCG can directly bind to these methyl groups, we performed a titration of meFUSRGG3PY with increasing concentrations of EGCG and recorded sets of 1H NMR spectra. Using published EGCG 1H resonance assignments [39], we identified chemical shift perturbations of several EGCG protons (Figure 4B). In line with EGCG binding observed in 1H-15N HSQC spectra (Figure 2C), we observed progressively increased CSPs of several 1H resonances with increasing concentrations of EGCG. These CSPs are associated with a consecutive decrease in peak intensities for 1H signals corresponding to aromatic protons of phenylalanine (Figure 4C), arginine side-chain protons (Figure 4C) and the methyl groups (Figure 4D). To test whether direct contacts between meFUSRGG3PY and EGCG could be observed, we recorded a 2D 1H-1H NOESY spectrum. In agreement with the CSPs, we observed a cross-peak between the EGCG aromatic protons and ADMA/MMA methyl protons (Figure 4E). In addition, a 1H-1H cross-peak corresponding to contact between ADMA/MMA methyl groups and phenylalanine aromatic protons was observed. Altogether, our data indicate that binding of EGCG to meFUSRGG3PY is mediated by its methylated arginine side chains.

Figure 4.
EGCG binds to the side chains of methylated arginines in meFUSRGG3PY. (A) Overlay of 1H spectra of FUSRGG3PY (light blue) and meFUSRGG3PY (orange) showing the chemical shift region corresponding to ADMA and MMA. (B) 1H NMR spectrum of 100 µM 15N-labeled meFUSRGG3PY in the presence of 1.5 stoichiometric equivalents of EGCG. The structural formula and the EGCG protons that were assigned are marked on the right. The proton numbering refers to the published assignment [39]. (C) CSPs and a decrease in intensity of signals corresponding to phenylalanine and arginine side-chain protons were observed with increasing concentrations of EGCG at 0.5 (gray), 1.0 (orange), and 1.5 (yellow) stoichiometric equivalents. (D) CSPs and a decrease in intensity of signals corresponding to ADMA and MMA were observed with increasing concentrations of EGCG at 0.5 (gray), 1.0 (orange), and 1.5 (yellow) stoichiometric equivalents. (E) Overlay of 1H-1H NOESY spectra of meFUSRGG3PY (black) and meFUSRGG3PY in the presence of 1.5 stoichiometric equivalents of EGCG (yellow) showing cross-peaks between ADMA/MMA methyl/phenylalanine aromatic protons and EGCG.
3.5. meFUSRGG3PY Phase Separation Is Restored by EGCG
It has been previously demonstrated that the RGG3-PY region of FUS mediates phase separation and contributes to FUS stress granule association and the formation of (patho)physiological aggregates in cells [23,27,28,29]. We, therefore, proceeded to assess whether binding of EGCG to FUSRGG3PY can modulate its propensity to phase separate in vitro. Taking into consideration that EGCG interacts with both methylated and unmethylated FUS, we performed turbidity assays as a measure of FUS phase separation for both FUSRGG3PY and meFUSRGG3PY with increasing EGCG concentrations. For both methylated and unmethylated FUS, we observed comparable effects of EGCG: addition of 5 to 100 µM EGCG did not affect FUSRGG3PY turbidity, whereas increasing EGCG concentrations from 100 to 500 µM led to a progressive turbidity increase. This shows that EGCG can lead to the formation of FUS condensates at high EGCG concentrations and that methylation slightly enhances EGCG-dependent FUS condensate formation (Figure 5A).
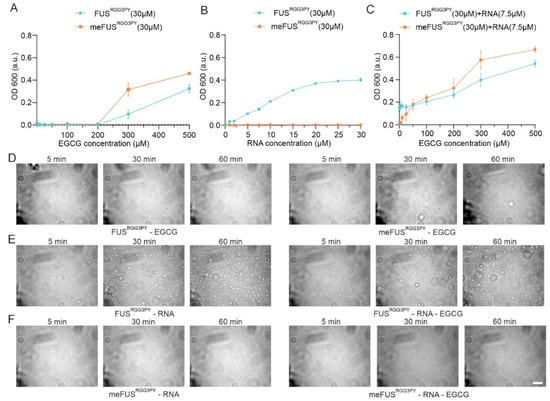
Figure 5.
Turbidity and DIC microscopy studies of FUSRGG3PY and meFUSRGG3PY liquid-liquid phase separation. (A,B) Turbidity assays were performed at a fixed concentration of FUSRGG3PY and meFUSRGG3PY (both at 30 µM) with an increasing concentration of EGCG (A) or (UG)12 RNA (B). (C) Turbidity assays for FUSRGG3PY and meFUSRGG3PY (at a fixed concentration of 30 µM), both in the presence of 7.5 µM (UG)12 RNA, with increasing concentrations of EGCG. Data points for the methylated FUSRGG3PY are shown in orange and for the non-modified protein in blue. (D) Differential interference contrast microscopy images illustrating FUSRGG3PY and meFUSRGG3PY at 30 µM in the presence of 25 µM EGCG are shown on the left and the right panels, respectively. (E) DIC images of 30 µM FUSRGG3PY in the presence of 7.5 µM (UG)12 RNA and in the absence (left panel) or presence of 25 µM EGCG (right panel). (F) DIC images of 30 µM meFUSRGG3PY in the presence of 7.5 µM (UG)12 RNA in the absence (left panel) or presence of 25 µM EGCG (right panel). All images were recorded over 1 h, and the scale bar represents 10 µm.
We previously showed that the presence of RNA can drive phase separation of the FUSRGG3PY and that methylation of full-length FUS impairs FUS LLPS in vitro and stress granules association in cells [23]. Therefore, we proceeded to determine the influence of EGCG on the ability of methylated and unmethylated FUSRGG3PY to phase separate in the presence of RNA. Previous studies identified a higher LLPS propensity of unmethylated FUSRGG3PY with the presence of RNA [23]. We, therefore, first validated that the same observation could be observed in our ratio of protein/RNA concentration. Indeed, whereas stepwise addition of (UG)12 RNA led to a progressive increase in turbidity of FUSRGG3PY, it did not affect meFUSRGG3PY turbidity (Figure 5B), thus, showing that PRMT1-mediated methylation of the FUS RGG3-PY region completely impairs its RNA-driven propensity to phase separate at our experimental conditions.
Next, we aimed to unravel the effect of EGCG on RNA-driven FUSRGG3PY LLPS. Consequently, we used a fixed concentration of (UG)12 RNA, at which FUSRGG3PY showed phase separation, and added increasing concentrations of EGCG to FUSRGG3PY or meFUSRGG3PY, respectively. For unmethylated FUSRGG3PY, the turbidity remained unchanged up to concentrations of 100 µM EGCG (Figure 5C). This remains in line with our observation that in this specific concentration range, EGCG had no effect on FUSRGG3PY turbidity (Figure 5A). Further addition of EGCG up to 500 µM led to a progressive increase in turbidity, likely due to an RNA-independent effect of EGCG, as also shown in Figure 5A. In contrast, for methylated FUSRGG3PY, we observed a progressive increase in FUSRGG3PY turbidity already after the addition of 5 to 100 µM EGCG. Given that neither RNA nor EGCG alone (0–100 µM) had any impact on methylated FUS turbidity, this observation strongly suggests that EGCG restores phase separation of meFUSRGG3PY in the presence of RNA.
In order to validate these striking findings, we performed differential contrast microscopy (DIC) of FUSRGG3PY and meFUSRGG3PY in the presence or absence of 7.5 µM RNA and in the presence or absence of 25 µM EGCG, respectively. In line with the turbidity assays, no condensate formation could be observed for both FUSRGG3PY and meFUSRGG3PY after the addition of 25 µM EGCG (Figure 5D), confirming that at this low EGCG concentration, EGCG has no effect on FUS phase separation. For unmethylated FUSRGG3PY, the addition of 7.5 µM (UG)12 RNA led to the formation of small condensates that increased in size and number over time, as previously described [23] (Figure 5E, left panel). Further addition of EGCG did not change RNA-driven formation of FUSRGG3PY droplets (Figure 5E, right panel), suggesting that EGCG has no effect on phase separation of the unmethylated FUS RGG3-PY region. In contrast, whereas no condensates could be observed for meFUSRGG3PY in the presence of RNA (Figure 5F, left panel), addition of EGCG led to the formation of small condensates that increased in number over time (Figure 5F, right panel), showing that both the presence of RNA and EGCG are required to allow phase separation of the methylated version of the FUS RGG3-PY region.
To summarize, EGCG binding to unmethylated FUSRGG3PY has no effect on its propensity to phase separate in the presence of RNA. In contrast, while FUSRGG3PY phase separation in the presence of RNA is impaired upon PRMT1-mediated FUS arginine methylation, it is restored by EGCG.
4. Discussion
In this study, we found that EGCG directly binds to the RGG3-PY region of FUS, with a non-specific/low-affinity behavior as observed by a linear increase in CSPs of FUS 1H-15N cross-peaks upon EGCG addition. Despite the non-specific trend of binding, we observed that EGCG seems to preferentially bind to the RG/RGG stretches within the FUS RGG3-PY region, as shown by the overall higher CSPs of these regions compared with non-RG-rich regions (Figure 1C, Figure 2D and Figure 3F). The presence of aromatic rings in EGCG could mediate cation–π interactions with arginines of RG/RGG repeats. Several studies have demonstrated that EGCG can directly interact with the intrinsically disordered regions (IDRs) of various proteins in vitro [21,40,41], including amyloidogenic proteins such as tau, α-synuclein, amyloid-β, but also transcription factors such as p53 [42]. As the corresponding binding regions are highly divergent in terms of amino acid composition, it remains questionable whether EGCG interacts with disordered regions in a non-specific manner at high concentrations. In this regard, we also observed that EGCG can directly interact with the IDRs of axin-1 and FOXO4, two other non-amyloidogenic proteins, at high concentrations (Appendix A Figure A2).
In contrast, we observed that PRMT1-mediated methylation of the FUS RGG3-PY region in association with the presence of RNA allows specific binding of EGCG with low micromolar affinity. We showed that RNA can also directly interact with meFUSRGG3PY, but it remains unclear how RNA binding to methylated RG/RGG regions in FUS could create a specific binding interface for EGCG. Binding of methylated arginines to Tudor domains that act as “methylation readers” has been described recently [43]. In protein complex structures, it was observed that binding of ADMA to Tudor domains is mediated by cation–π interactions involving conserved aromatic cages. We speculate that the three aromatic rings of EGCG resemble the properties of the conserved aromatic cage of Tudor domains containing three aromatic rings and, through this, mediate the interaction with methylated arginines. Further structural studies will be required to address this and how the number and patterns of methylation regulate EGCG binding. Nevertheless, we showed that the methyl groups of methylated arginines directly contact EGCG (Figure 4D,E). RG/RGG regions are highly abundant in the human proteomes. Many of these regions have been shown to be methylated as well as to bind RNA [36,44]. Therefore, it is tempting to speculate that EGCG binding observed for FUS RGG3-PY here could be relevant for other proteins containing RG/RGG regions.
EGCG function in neuroprotection is primarily associated with its inhibitory effect on amyloidogenic protein aggregation, redirecting the self-association of amyloidogenic peptides from toxic aggregates/amyloid fibrils to stable, non-toxic oligomers [18,21,45,46]. Numerous RG/RGG-containing proteins have been implicated in neurological disorders, such as FUS and TAF-15 in ALS, FXR1, and FMRP1 in fragile X syndrome (FSX), SMN in spinal muscular atrophy (SMA), SHANK1 in autism, as well as a plethora of human cancers [44]. Here, we showed that specific EGCG binding to the RG/RGG region of FUS allows condensates formation of methylated FUS in the presence of RNA. Methylation of FUS RG/RGG regions as well as several other disease-relevant RBPs attenuates phase separation in vitro and SG association in cells and is currently seen as a protective role against the redirection of physiological “liquid-like” membrane-less organelles to toxic aggregates and fibrils [23,36]. Therefore, it remains to be determined whether the observed effect of EGCG on phase separation of RG/RGG regions has beneficial or adverse effects on RG/RGG-linked diseases.
Our data propose unexpected new functions of EGCG in the regulation of biomolecular condensate formation, targeting one of the most abundant regions in the human proteome. Through this, our work might set the base to promote a better understanding of the EGCG effect in neuroprotection, as well as putative other disorders linked to misregulation of RG/RGG-containing proteins.
Author Contributions
Conceptualization, T.M., B.B.; methodology, T.M., B.B., A.J.L., and Q.Z.; software, A.J.L.; validation, T.M., A.J.L., and Q.Z.; formal analysis, A.J.L., and Q.Z.; investigation, Q.Z., A.J.L., H.H., and Y.K.; resources, Q.Z., A.J.L., C.M.-S., H.H., and Y.K.; data curation, A.J.L., and Q.Z.; writing—original draft preparation, B.B.; writing—review and editing, T.M., B.B., C.M.-S., Q.Z., A.J.L., and Y.K.; visualization, Q.Z., A.J.L., and B.B.; supervision, T.M., and B.B.; project administration, T.M.; funding acquisition, T.M. All authors have read and agreed to the published version of the manuscript.
Funding
T.M. was supported the Austrian Science Fund (FWF) grants P28854, I3792, DOC-130, and DK-MCD W1226; Austrian Research Promotion Agency (FFG) grants 864690 and 870454; the Integrative Metabolism Research Center Graz; the Austrian Infrastructure Program 2016/2017, the Styrian Government (Zukunftsfonds, doc.fund program); the City of Graz; and BioTechMed-Graz (flagship project). A.J.L., Q.Z., and H.H. were trained within the frame of the Ph.D. program Metabolic and Cardiovascular Disease (DK-MCD), Medical University of Graz. The authors gratefully acknowledge Open Access Funding by the Austrian Science Fund (FWF). Y.K. was trained within the frame of the Ph.D. program Biomolecular Structures and Interactions (BioMolStruct), Medical University of Graz.
Institutional Review Board Statement
Not applicable.
Informed Consent Statement
Not applicable.
Data Availability Statement
The data shown in this study are available upon request from the corresponding author. The recorded NMR data are available at Biological Magnetic Resonance Bank under the accession codes 51314 and 51315 for FUSRGG3PY and metFUSRGG3PY, respectively.
Acknowledgments
The authors thank the Center for Medical Research, Medical University of Graz, Graz, Austria for laboratory access, and thank E. Spreitzer (Medical University of Graz, Austria) for software support.
Conflicts of Interest
The authors declare no conflict of interest.
Appendix A
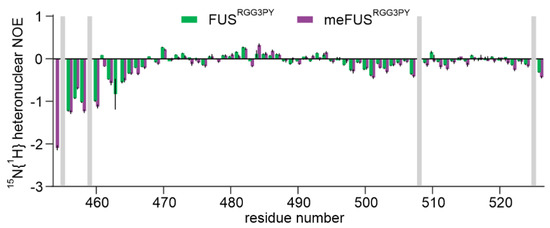
Figure A1.
Overlay of 1H-15N heteronuclear NOEs of FUSRGG3PY (green) and metFUSRGG3PY (magenta) plotted against FUSRGG3PY amino acid number. The values for error bars were derived using error propagation and a standard deviation of 10 arbitrarily chosen noise peaks in saturated and unsaturated spectra.
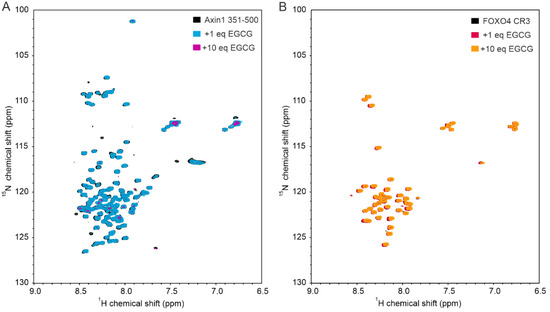
Figure A2.
EGCG binds to the intrinsically disordered regions of axin-1 and FOXO4 at high concentrations. (A) 1H-15N HSQC spectrum of 50 µM 15N-labeled axin-1 residues 351–500 in the absence (black) and the presence of 1 (blue) or 10 stoichiometric equivalents of EGCG (pink). (B) 1H-15N HSQC spectrum of 100 µM 15N-labeled FOXO4 CR3 in the absence (black) and the presence of 1 (pink) or 10 stoichiometric equivalents of EGCG (orange).
References
- Chi, H.; Chang, H.-Y.; Sang, T.-K. Neuronal Cell Death Mechanisms in Major Neurodegenerative Diseases. Int. J. Mol. Sci. 2018, 19, 3082. [Google Scholar] [CrossRef] [PubMed] [Green Version]
- Dugger, B.N.; Dickson, D.W. Pathology of Neurodegenerative Diseases. Cold Spring Harb. Perspect. Biol. 2017, 9, a028035. [Google Scholar] [CrossRef] [PubMed]
- Wolfe, K.J.; Cyr, D.M. Amyloid in neurodegenerative diseases: Friend or foe? Semin. Cell Dev. Biol. 2011, 22, 476–481. [Google Scholar] [CrossRef] [Green Version]
- Alberti, S.; Dormann, D. Liquid–Liquid Phase Separation in Disease. Annu. Rev. Genet. 2019, 53, 171–194. [Google Scholar] [CrossRef] [PubMed] [Green Version]
- Zbinden, A.; Pérez-Berlanga, M.; De Rossi, P.; Polymenidou, M. Phase Separation and Neurodegenerative Diseases: A Disturbance in the Force. Dev. Cell 2020, 55, 45–68. [Google Scholar] [CrossRef]
- Harrison, A.F.; Shorter, J. RNA-binding proteins with prion-like domains in health and disease. Biochem. J. 2017, 474, 1417–1438. [Google Scholar] [CrossRef] [PubMed] [Green Version]
- Darling, A.L.; Shorter, J. Combating deleterious phase transitions in neurodegenerative disease. Biochim. et Biophys. Acta 2021, 1868, 118984. [Google Scholar] [CrossRef]
- Pomier, K.M.; Ahmed, R.; Melacini, G. Catechins as Tools to Understand the Molecular Basis of Neurodegeneration. Molecules 2020, 25, 3571. [Google Scholar] [CrossRef]
- Sutherland, B.; Rahman, R.M.; Appleton, I. Mechanisms of action of green tea catechins, with a focus on ischemia-induced neurodegeneration. J. Nutr. Biochem. 2006, 17, 291–306. [Google Scholar] [CrossRef]
- Pervin, M.; Unno, K.; Ohishi, T.; Tanabe, H.; Miyoshi, N.; Nakamura, Y. Beneficial Effects of Green Tea Catechins on Neurodegenerative Diseases. Molecules 2018, 23, 1297. [Google Scholar] [CrossRef] [Green Version]
- Singh, N.A.; Mandal, A.K.A.; Khan, Z.A. Potential neuroprotective properties of epigallocatechin-3-gallate (EGCG). Nutr. J. 2015, 15, 1–17. [Google Scholar] [CrossRef] [PubMed] [Green Version]
- Gonzalez-Alfonso, J.L.; Peñalver, P.; Ballesteros, A.O.; Morales, J.C.; Plou, F.J. Effect of α-Glucosylation on the Stability, Antioxidant Properties, Toxicity, and Neuroprotective Activity of (–)-Epigallocatechin Gallate. Front. Nutr. 2019, 6, 30. [Google Scholar] [CrossRef] [PubMed]
- Renno, W.M.; Benov, L.; Khan, K.M. Possible role of antioxidative capacity of (−)-epigallocatechin-3-gallate treatment in morphological and neurobehavioral recovery after sciatic nerve crush injury. J. Neurosurg. Spine 2017, 27, 593–613. [Google Scholar] [CrossRef] [PubMed] [Green Version]
- Yoo, S.-H.; Lee, Y.-E.; Chung, J.-O.; Rha, C.-S.; Hong, Y.-D.; Park, M.-Y.; Shim, S.-M. Addition of flavonols and polysaccharides as excipient ingredients into epicatechin rich green tea extract inhibited free radical formation and glucose uptake. Food Funct. 2020, 11, 3105–3111. [Google Scholar] [CrossRef] [PubMed]
- Yiannakopoulou, E.C. Green tea catechins: Proposed mechanisms of action in breast cancer focusing on the interplay between survival and apoptosis. Anti-Cancer Agents Med. Chem. 2014, 14, 290–295. [Google Scholar] [CrossRef] [PubMed]
- Ohishi, T.; Goto, S.; Monira, P.; Isemura, M.; Nakamura, Y. Anti-inflammatory Action of Green Tea. Anti-Inflammatory Anti-Allergy Agents Med. Chem. 2016, 15, 74–90. [Google Scholar] [CrossRef]
- Gonçalves, P.; Sodero, A.; Cordeiro, Y. Green Tea Epigallocatechin-3-gallate (EGCG) Targeting Protein Misfolding in Drug Discovery for Neurodegenerative Diseases. Biomolecules 2021, 11, 767. [Google Scholar] [CrossRef]
- del Amo, J.M.L.; Fink, U.; Dasari, M.; Grelle, G.; Wanker, E.; Bieschke, J.; Reif, B. Structural Properties of EGCG-Induced, Nontoxic Alzheimer’s Disease Aβ Oligomers. J. Mol. Biol. 2012, 421, 517–524. [Google Scholar] [CrossRef]
- Zhan, C.; Chen, Y.; Tang, Y.; Wei, G. Green Tea Extracts EGCG and EGC Display Distinct Mechanisms in Disrupting Aβ42 Protofibril. ACS Chem. Neurosci. 2020, 11, 1841–1851. [Google Scholar] [CrossRef]
- Lorenzen, N.; Nielsen, S.B.; Yoshimura, Y.; Vad, B.S.; Andersen, C.B.; Betzer, C.; Kaspersen, J.D.; Christiansen, G.; Pedersen, J.S.; Jensen, P.H.; et al. How Epigallocatechin Gallate Can Inhibit α-Synuclein Oligomer Toxicity in Vitro. J. Biol. Chem. 2014, 289, 21299–21310. [Google Scholar] [CrossRef] [Green Version]
- Bieschke, J.; Russ, J.; Friedrich, R.P.; Ehrnhoefer, D.E.; Wobst, H.; Neugebauer, K.; Wanker, E.E. EGCG remodels mature α-synuclein and amyloid-β fibrils and reduces cellular toxicity. Proc. Natl. Acad. Sci. USA 2010, 107, 7710–7715. [Google Scholar] [CrossRef] [PubMed] [Green Version]
- Fernandes, L.; Cardim-Pires, T.R.; Foguel, D.; Palhano, F.L. Green Tea Polyphenol Epigallocatechin-Gallate in Amyloid Aggregation and Neurodegenerative Diseases. Front. Neurosci. 2021, 15, 718188. [Google Scholar] [CrossRef] [PubMed]
- Hofweber, M.; Hutten, S.; Bourgeois, B.; Spreitzer, E.; Niedner-Boblenz, A.; Schifferer, M.; Ruepp, M.-D.; Simons, M.; Niessing, D.; Madl, T.; et al. Phase Separation of FUS Is Suppressed by Its Nuclear Import Receptor and Arginine Methylation. Cell 2018, 173, 706–719. [Google Scholar] [CrossRef] [PubMed] [Green Version]
- Molliex, A.; Temirov, J.; Lee, J.; Coughlin, M.; Kanagaraj, A.P.; Kim, H.J.; Mittag, T.; Taylor, J.P. Phase Separation by Low Complexity Domains Promotes Stress Granule Assembly and Drives Pathological Fibrillization. Cell 2015, 163, 123–133. [Google Scholar] [CrossRef] [PubMed] [Green Version]
- Bourgeois, B.; Hutten, S.; Gottschalk, B.; Hofweber, M.; Richter, G.; Sternat, J.; Abou-Ajram, C.; Göbl, C.; Leitinger, G.; Graier, W.F.; et al. Nonclassical nuclear localization signals mediate nuclear import of CIRBP. Proc. Natl. Acad. Sci. USA 2020, 117, 8503–8514. [Google Scholar] [CrossRef] [Green Version]
- Zhou, Q.; Usluer, S.; Zhang, F.; Lenard, A.J.; Bourgeois, B.M.R.; Madl, T. ATP regulates RNA-driven cold inducible RNA binding protein phase separation. Protein Sci. 2021, 30, 1438–1453. [Google Scholar] [CrossRef]
- Murthy, A.C.; Tang, W.S.; Jovic, N.; Janke, A.M.; Seo, D.H.; Perdikari, T.M.; Mittal, J.; Fawzi, N.L. Molecular interactions contributing to FUS SYGQ LC-RGG phase separation and co-partitioning with RNA polymerase II heptads. Nat. Struct. Mol. Biol. 2021, 28, 923–935. [Google Scholar] [CrossRef]
- Guo, L.; Kim, H.J.; Wang, H.; Monaghan, J.; Freyermuth, F.; Sung, J.C.; O’Donovan, K.; Fare, C.; Diaz, Z.; Singh, N.; et al. Nuclear-Import Receptors Reverse Aberrant Phase Transitions of RNA-Binding Proteins with Prion-like Domains. Cell 2018, 173, 677–692.e20. [Google Scholar] [CrossRef] [Green Version]
- Qamar, S.; Wang, G.; Randle, S.J.; Ruggeri, F.S.; Varela, J.A.; Lin, J.Q.; Phillips, E.C.; Miyashita, A.; Williams, D.; Ströhl, F.; et al. FUS Phase Separation Is Modulated by a Molecular Chaperone and Methylation of Arginine Cation-π Interactions. Cell 2018, 173, 720–734.e15. [Google Scholar] [CrossRef] [Green Version]
- Zhang, X.; Cheng, X. Structure of the Predominant Protein Arginine Methyltransferase PRMT1 and Analysis of Its Binding to Substrate Peptides. Structure 2003, 11, 509–520. [Google Scholar] [CrossRef] [Green Version]
- Lee, W.; Tonelli, M.; Markley, J.L. NMRFAM-SPARKY: Enhanced software for biomolecular NMR spectroscopy. Bioinformatics 2015, 31, 1325–1327. [Google Scholar] [CrossRef] [PubMed] [Green Version]
- Vranken, W.; Boucher, W.; Stevens, T.J.; Fogh, R.H.; Pajon, A.; Llinas, M.; Ulrich, E.L.; Markley, J.L.; Ionides, J.; Laue, E.D. The CCPN data model for NMR spectroscopy: Development of a software pipeline. Proteins Struct. Funct. Bioinform. 2005, 59, 687–696. [Google Scholar] [CrossRef] [PubMed]
- Suárez-Calvet, M.; Neumann, M.; Arzberger, T.; Abou-Ajram, C.; Funk, E.; Hartmann, H.; Edbauer, D.; Kremmer, E.; Göbl, C.; Resch, M.; et al. Monomethylated and unmethylated FUS exhibit increased binding to Transportin and distinguish FTLD-FUS from ALS-FUS. Acta Neuropathol. 2016, 131, 587–604. [Google Scholar] [CrossRef] [PubMed]
- Dormann, D.; Madl, T.; Valori, C.F.; Bentmann, E.; Tahirovic, S.; Abou-Ajram, C.; Kremmer, E.; Ansorge, O.; A Mackenzie, I.R.; Neumann, M.C.; et al. Arginine methylation next to the PY-NLS modulates Transportin binding and nuclear import of FUS. EMBO J. 2012, 31, 4258–4275. [Google Scholar] [CrossRef] [PubMed] [Green Version]
- Rappsilber, J.; Friesen, W.J.; Paushkin, S.; Dreyfuss, G.; Mann, M. Detection of Arginine Dimethylated Peptides by Parallel Precursor Ion Scanning Mass Spectrometry in Positive Ion Mode. Anal. Chem. 2003, 75, 3107–3114. [Google Scholar] [CrossRef] [PubMed]
- Chong, P.A.; Vernon, R.M.; Forman-Kay, J.D. RGG/RG Motif Regions in RNA Binding and Phase Separation. J. Mol. Biol. 2018, 430, 4650–4665. [Google Scholar] [CrossRef]
- Ozdilek, B.A.; Thompson, V.F.; Ahmed, N.S.; White, C.I.; Batey, R.T.; Schwartz, J.C. Intrinsically disordered RGG/RG domains mediate degenerate specificity in RNA binding. Nucleic Acids Res. 2017, 45, 7984–7996. [Google Scholar] [CrossRef]
- Zhang, F.; Kerbl-Knapp, J.; Colman, M.J.R.; Meinitzer, A.; Macher, T.; Vujić, N.; Fasching, S.; Jany-Luig, E.; Korbelius, M.; Kuentzel, K.B.; et al. Global analysis of protein arginine methylation. Cell Rep. Methods 2021, 1, 100016. [Google Scholar] [CrossRef]
- Folch-Cano, C.; Guerrero, J.; Speisky, H.; Jullian, C.; Olea-Azar, C. NMR and molecular fluorescence spectroscopic study of the structure and thermodynamic parameters of EGCG/β-cyclodextrin inclusion complexes with potential antioxidant activity. J. Incl. Phenom. Macrocycl. Chem. 2014, 78, 287–298. [Google Scholar] [CrossRef]
- E Ehrnhoefer, D.; Bieschke, J.; Boeddrich, A.; Herbst, M.; Masino, L.; Lurz, R.; Engemann, S.; Pastore, A.; Wanker, E.E. EGCG redirects amyloidogenic polypeptides into unstructured, off-pathway oligomers. Nat. Struct. Mol. Biol. 2008, 15, 558–566. [Google Scholar] [CrossRef]
- Seidler, P.; Boyer, D.; Sawaya, M.; Ge, P.; Shin, W.; DeTure, M.; Dickson, D.; Jiang, L.; Eisenberg, D. CryoEM reveals how the small molecule EGCG binds to Alzheimer’s brain-derived tau fibrils and initiates fibril disaggregation. bioRxiv 2020. [Google Scholar] [CrossRef]
- Zhao, J.; Blayney, A.; Liu, X.; Gandy, L.; Jin, W.; Yan, L.; Ha, J.-H.; Canning, A.J.; Connelly, M.; Yang, C.; et al. EGCG binds intrinsically disordered N-terminal domain of p53 and disrupts p53-MDM2 interaction. Nat. Commun. 2021, 12, 1–11. [Google Scholar] [CrossRef] [PubMed]
- Tripsianes, K.; Madl, T.; Machyna, M.; Fessas, D.; Englbrecht, C.; Fischer, U.; Neugebauer, K.M.; Sattler, M. Structural basis for dimethylarginine recognition by the Tudor domains of human SMN and SPF30 proteins. Nat. Struct. Mol. Biol. 2011, 18, 1414–1420. [Google Scholar] [CrossRef]
- Thandapani, P.; O’Connor, T.R.; Bailey, T.L.; Richard, S. Defining the RGG/RG Motif. Mol. Cell 2013, 50, 613–623. [Google Scholar] [CrossRef] [PubMed] [Green Version]
- Wang, I.-F.; Chang, H.-Y.; Hou, S.-C.; Liou, G.-G.; Way, T.-D.; Shen, C.-K.J. The self-interaction of native TDP-43 C terminus inhibits its degradation and contributes to early proteinopathies. Nat. Commun. 2012, 3, 766. [Google Scholar] [CrossRef] [PubMed] [Green Version]
- Miyata, M.; Sato, T.; Kugimiya, M.; Sho, M.; Nakamura, T.; Ikemizu, S.; Chirifu, M.; Mizuguchi, M.; Nabeshima, Y.; Suwa, Y.; et al. The Crystal Structure of the Green Tea Polyphenol (−)-Epigallocatechin Gallate−Transthyretin Complex Reveals a Novel Binding Site Distinct from the Thyroxine Binding Site. Biochemistry 2010, 49, 6104–6114. [Google Scholar] [CrossRef] [PubMed]
Publisher’s Note: MDPI stays neutral with regard to jurisdictional claims in published maps and institutional affiliations. |
© 2022 by the authors. Licensee MDPI, Basel, Switzerland. This article is an open access article distributed under the terms and conditions of the Creative Commons Attribution (CC BY) license (https://creativecommons.org/licenses/by/4.0/).