Article

Enhanced Loss of Retinoic Acid Network Genes in Xenopus laevis Achieves a Tighter Signal Regulation

Department of Developmental Biology and Cancer Research, Institute for Medical Research Israel-Canada, Faculty of Medicine, The Hebrew University of Jerusalem, Jerusalem 9112102, Israel
*
Author to whom correspondence should be addressed.
These authors contributed equally to this work.
Cells 2022, 11(3), 327; https://doi.org/10.3390/cells11030327
Submission received: 15 December 2021 / Revised: 13 January 2022 / Accepted: 17 January 2022 / Published: 19 January 2022
(This article belongs to the Special Issue Retinoic Acid and Retinoid X Receptors)

Abstract

:
Retinoic acid (RA) is a major regulatory signal during embryogenesis produced from vitamin A (retinol) by an extensive, autoregulating metabolic and signaling network to prevent fluctuations that result in developmental malformations. Xenopus laevis is an allotetraploid hybrid frog species whose genome includes L (long) and S (short) chromosomes from the originating species. Evolutionarily, the X. laevis subgenomes have been losing either L or S homoeologs in about 43% of genes to generate singletons. In the RA network, out of the 47 genes, about 47% have lost one of the homoeologs, like the genome average. Interestingly, RA metabolism genes from storage (retinyl esters) to retinaldehyde production exhibit enhanced gene loss with 75% singletons out of 28 genes. The effect of this gene loss on RA signaling autoregulation was studied. Employing transient RA manipulations, homoeolog gene pairs were identified in which one homoeolog exhibits enhanced responses or looser regulation than the other, while in other pairs both homoeologs exhibit similar RA responses. CRISPR/Cas9 targeting of individual homoeologs to reduce their activity supports the hypothesis where the RA metabolic network gene loss results in tighter network regulation and more efficient RA robustness responses to overcome complex regulation conditions.

1. Introduction

Retinoic acid (RA) signaling is one of the major regulatory pathways active during embryogenesis and it controls numerous developmental processes [1,2,3,4]. RA is produced in the body from nutritional sources containing vitamin A (retinol, ROL) and other retinoids, or carotenoids [5,6]. This metabolic network involves multiple enzymes active in the conversion of these substrates into RA, or the storage of retinoids as retinyl esters to survive periods when the nutritional sources of retinoids or carotenoids are diminished or lacking [5,7,8,9,10]. Increased or decreased RA signaling levels can result in severe developmental malformations [8,11,12,13,14]. For this reason, the RA metabolic and signaling network exhibits efficient self-regulation to overcome fluctuations in this signaling pathway elicited by dietary changes, environmental toxicity, or genetic polymorphisms [15,16,17,18,19,20,21,22,23,24,25,26]. The autoregulation of the RA network by RA levels is instrumental to maintaining pathway robustness in response to hampering mechanisms [27,28].
For over half a century, gene duplication has been studied as one of the processes important for the evolution of species [29,30,31]. Following duplication of a gene or gene family, one of the copies can be lost, or one member retains the original function and regulation whereas the extra copy can gain novel functions, called neofunctionalization and subfunctionalization. Generally, duplications occur on a small scale involving restricted genomic regions, but in extreme cases, gene duplication of all the genes present in the genome is the result of polyploidization by whole-genome duplication (WGD) [29]. Xenopus laevis, the African clawed frog, was proposed to have arisen by interspecific hybridization of two related diploid species followed by WGD making it an allotetraploid species [32]. From sequence analysis of the Xenopus laevis genome, it was concluded that the two ancestral originating species separated about 34 million years ago and the allotetraploid event occurred about 17–18 million years ago. X. laevis inherited half of its genome from each ancestor, resulting in two distinct subgenomes present in a diploid condition: L and S, for long and short chromosomes, respectively [32].
As a result of a WGD event, one of the gene copies may diverge, probably together with other genes, co-evolving as a complex system to achieve neofunctionalization or subfunctionalization [31]. Alternatively, it has been proposed that sometimes following a burst of increase in genome complexity, there is a long process of genome reduction [33,34]. During the genome reduction process following a WGD event, one of the gene copies might be lost or mutated into a pseudogene [35]. Analysis of the genome of X. laevis and its transcriptome clearly identified many instances of the L and S genes and their respective transcripts [32,36,37,38,39]. Moreover, these studies also identified a process of gene loss that encompasses today about 43% of protein-coding genes [32]. Most of this gene loss took place in the S subgenome. Detailed genome analysis also revealed high (>85%) conservation of both (L and S) gene copies, i.e., homoeologs, among genes encoding DNA binding proteins, transcription factors, the Wnt, Hh, Notch, FGF, TGFβ, and Hippo signaling pathways [32,40,41,42]. The inverse situation, enhanced gene loss, was observed among the genes encoding DNA repair proteins (79% singletons). This high rate of singletons was attributed to either a lack of selective pressure where one enzyme encoding locus is sufficient or to functional incompatibility among homoeologs leading to deletions [32].
We analyzed the RA signaling network in X. laevis and uncovered an average distribution of homoeologs and singletons similar to the genomic average. However, deeper analysis of the RA metabolic and gene regulatory network revealed that among the enzymatic components necessary for retinaldehyde (RAL) production, and retinoid storage and retrieval there is a high incidence of gene loss, resulting in about 75% singletons. For the rest of the network, from RAL to RA production, RA disposal and gene regulation, most genes (about 95%), are present as homoeolog pairs. We studied the possibility that the enhanced gene loss in the RA metabolic network leading to RAL production is related to the regulation of the RA signal to prevent teratogenic outcomes. A transient RA manipulation approach followed by kinetic analysis of the recovery period revealed the presence of both tightly regulated (restricted responses, low RA fluctuation sensitivity) and loosely regulated (enhanced responses, high RA change sensitivity) genes. We speculated that homoeolog pairs with markedly different RA responses would degrade the robustness response to RA fluctuations, therefore we used CRISPR/Cas9 to target specific homoeologs. Our results showed that among homoeolog pairs with similar RA responses, individual knockdowns resulted in similar recovery kinetics from the RA treatment. In contrast, among homoeologs with diverged RA responses, knockdown of the tightly regulated homoeolog impairs the kinetic recovery response, whereas, targeting the loosely regulated homoeolog improves the RA robustness response. These results support our hypothesis proposing that enhanced gene loss of the RA network components might lead to an improved robustness response by reducing the number of genes to be regulated, specifically removing genes with enhanced responses to RA fluctuation.

2. Materials and Methods

2.1. Embryo Culture and Treatment

Xenopus laevis frogs were purchased from Xenopus I or NASCO (Dexter, MI, USA or Fort Atkinson, WI, USA). Experiments were performed after approval and under the supervision of the Institutional Animal Care and Use Committee (IACUC) of the Hebrew University (Ethics approval no. MD-17-15281-3). Embryos were obtained by in vitro fertilization, incubated in 0.1% Modified Barth’s Solution and Hepes (MBSH), and staged according to Nieuwkoop and Faber [43]. All-trans retinoic acid and Dimethyl sulfoxide (DMSO) were purchased from Sigma-Aldrich (St. Louis, MO, USA). Stock solutions of RA were prepared in DMSO. For transient RA treatment, embryos were placed in 10 or 25 nM RA from late blastula (st. 9.5) and washed two hours later, at early gastrula (st. 10.25) by three changes of 0.1% MBSH and further incubated in fresh 0.1% MBSH for the desired time. Samples were collected 1, 1.5, 2, and 2.5 h after washing.

2.2. Quantitative Reverse Transcription Real-Time PCR (qPCR)

Total RNA from embryos was extracted with Aurum™ Total RNA Mini Kit (Bio-Rad, Hercules, CA, USA). cDNA was synthesized using iScript cDNA Synthesis Kit (Bio-Rad). The real-time PCR reactions were performed using the CFX384 Real Time System (Bio-Rad) and iTaq Universal SYBR Green Supermix (Bio-Rad). Each experiment was repeated at least three independent times and each time the samples were run in triplicate. slc35b1.L was used as the housekeeping reference gene. The primers used for qPCR analysis are listed in Table 1.

2.3. Generation of CRISPant Embryos

For gene-specific single guide RNA design (sgRNA), genomic DNA sequences were selected from Xenbase.org [44] for the L and S homoeologs when present and analyzed using CRISPRdirect [45] and CRISPRscan [46] for target site search. Computational estimation of the sgRNA efficiency was determined using the inDelphi software [47,48]. For the generation of F0 CRISPant embryos, we injected one-cell stage embryos with Cas9 ribonucleoprotein (RNP) complexes employing the two-RNA component (crRNA:tracrRNA) approach [49]. Briefly, chemically synthesized and modified for stability (Alt-R) RNAs (crRNA and tracrRNA; IDT, Coralville, IA, USA) (Table 1) were annealed to generate the double guide complexes (crRNA:tracrRNA) and were incubated (10 min at 37 °C) with S. pyogenes Cas9 protein (IDT) to generate RNP complexes. Eight nanoliters of the RNP complex solution were injected into the cytoplasm of one-cell stage embryos.
To determine the efficiency of indel induction, genomic DNA was extracted from 5 individual embryos at mid-gastrula (st. 11) or later employing the GenElute Mammalian Genomic DNA Miniprep Kit (Sigma). The genomic region containing the CRISPR/Cas9 targeted region was PCR amplified using a nested PCR approach (Table 1) and the size-selected and cleaned product was sequenced. Genome editing efficiency was analyzed by decomposition analysis [50] using the Synthego (Menlo Park, CA, USA) ICE algorithm [51].

2.4. Statistical Analysis

All statistical comparisons were carried out using the Prism software package (Graph Pad Software Inc., San Diego, CA, USA). Results are given as the mean ± standard error of the mean (SEM). Tests used were the 2-tailed t-test for two-sample comparisons, Dunnett’s (ANOVA) multiple comparisons test, or Fisher test. Differences between means were considered significant at a significance level of p ≤ 0.05.

3. Results and Discussion

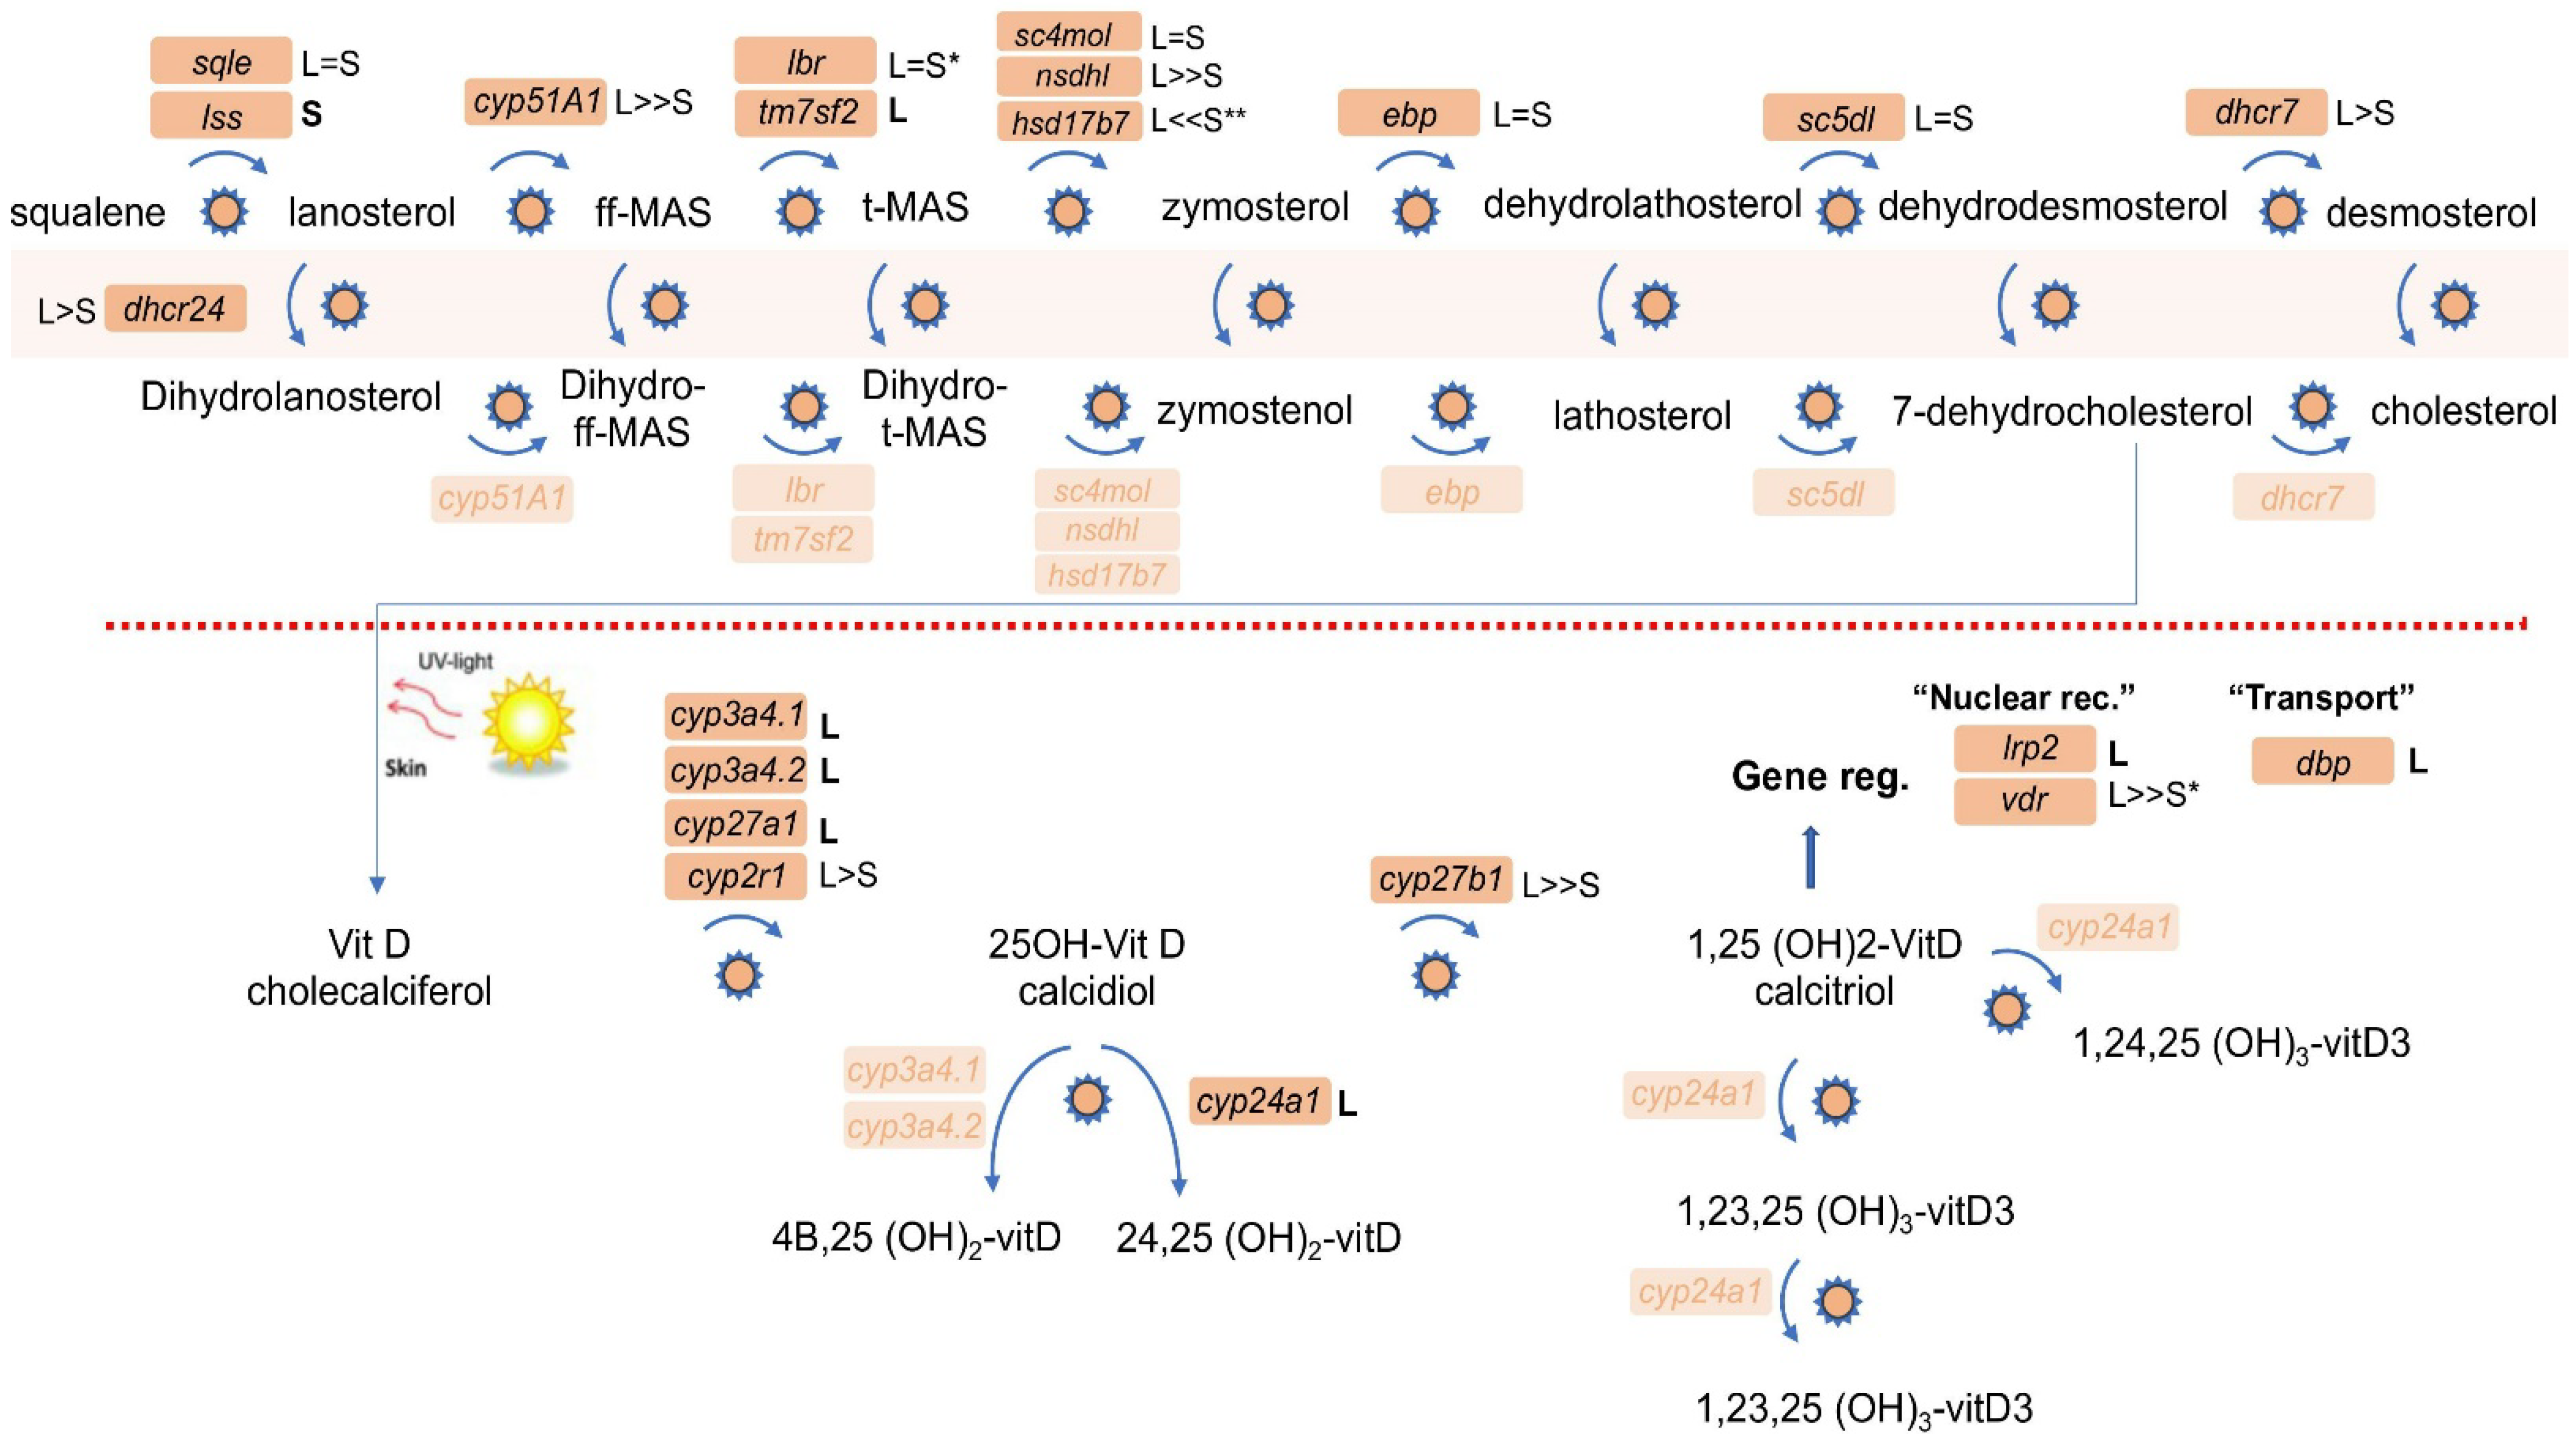
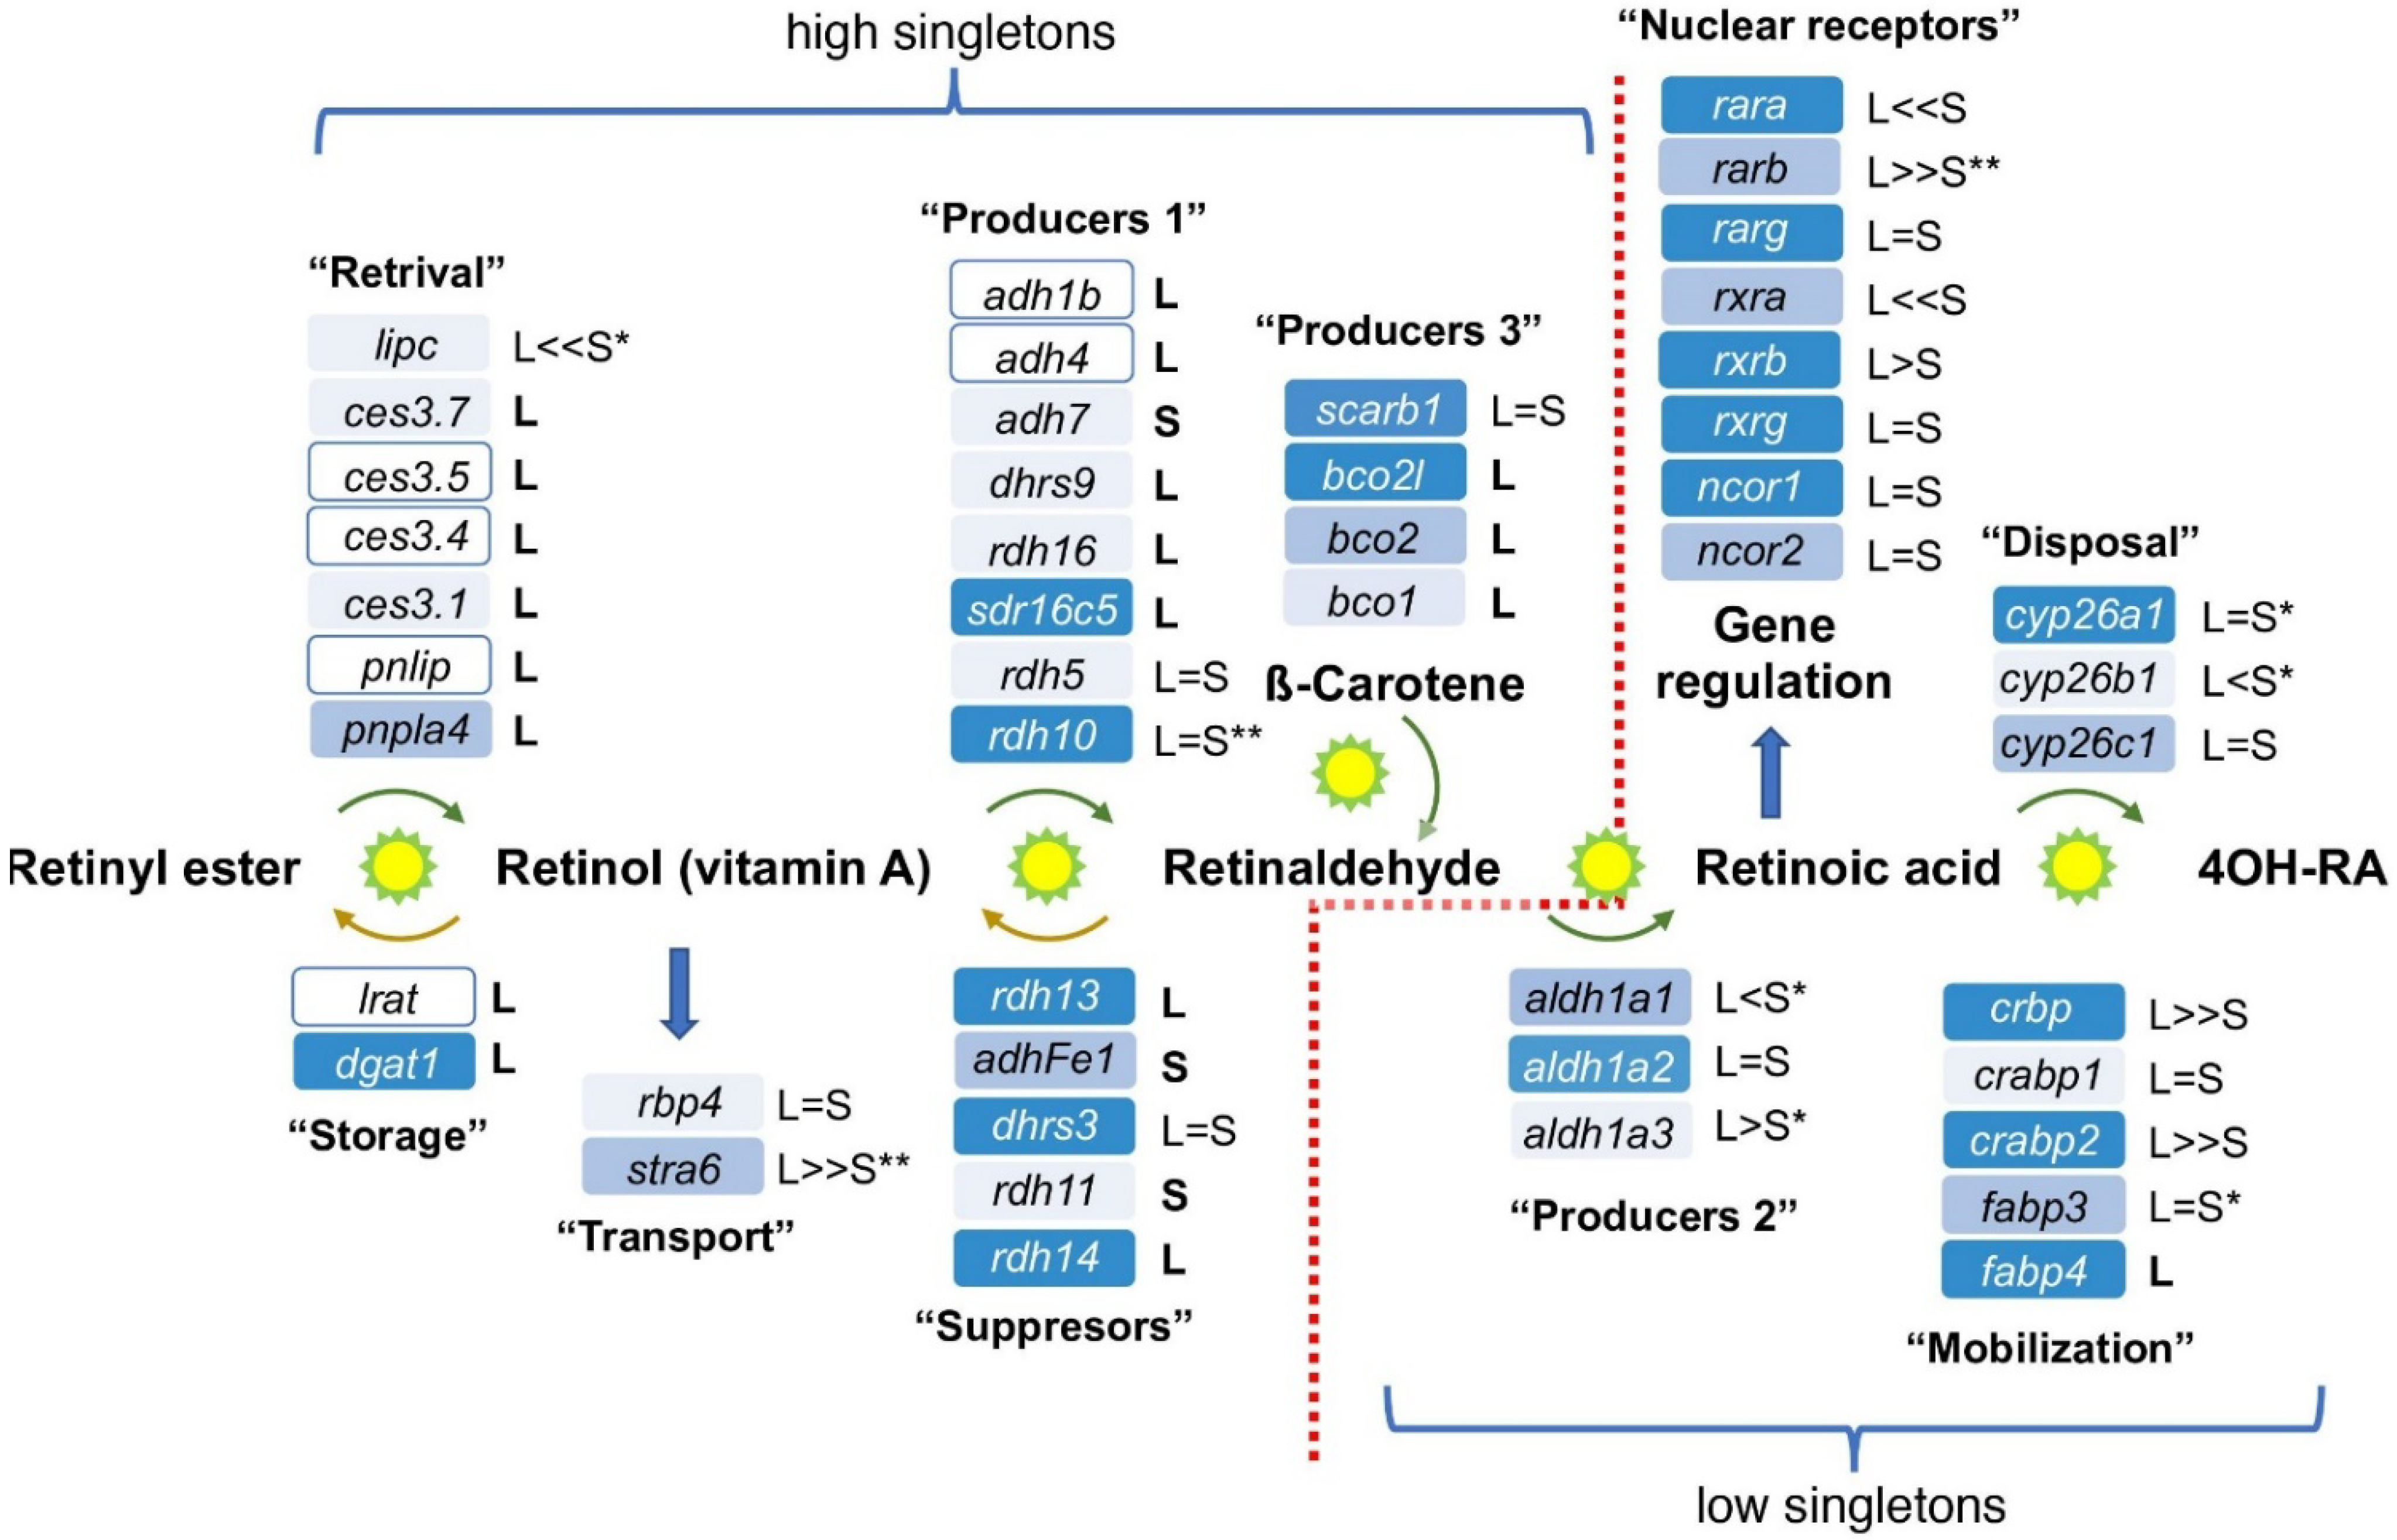
3.1. Conservation of the RA Network

In a recent extensive data mining effort searching the KEGG and Xenbase databases [44,52] and the literature, we assembled the putative components of the RA metabolic and signaling network assembling components described in multiple experimental systems and tissues [1,6,9]. To determine the composition of the RA network active during gastrula in Xenopus laevis embryos we assessed which components are expressed during this developmental stage based on analysis of transcriptomic data sets [27,53,54] and corroborated the gastrula expression by quantitative RT-PCR (qPCR) [27]. This view of the RA metabolic and signaling network exhibits a rather uncommon characteristic that for each enzymatic step, multiple genes encoding enzymes have been described that are capable of performing the same reaction (Figure 1). For some of the reversible reactions, such as the oxidation of ROL to RAL and the corresponding reduction of RAL to ROL, a preferred activity has been identified, but the reverse reaction might be possible under certain conditions [55,56,57]. Because it is necessary to maintain non-teratogenic levels of RA at these stages, there appear to be several ways to control levels of RA signaling. Substrate availability for the retinaldehyde dehydrogenase enzymes that oxidize RAL to RA, the Aldh1a subfamily, is controlled by the presence of multiple enzymes that reduce RAL back to ROL [10,13,15,25,58,59,60]. Levels of signaling can additionally be controlled by RA disposal, regulating the spatial-temporal expression of the many RA metabolic and gene regulatory network components, including the RA nuclear receptor families (RAR and RXR) and retinoid-binding proteins [61,62,63].
Analysis of the allotetraploid status of the genes encoding all the identified RA network components in the Xenopus laevis genome revealed that in 25 out of 47 genes both the L and S homoeologs [32] have been retained during evolution (Figure 1; Table 2). Thus, 22 genes (46.8%) in the RA network have lost one of the homoeologs, bringing this metabolic and signaling network close to the genomic average (43.6%) of singletons among protein-coding genes [32]. This observation seemingly contradicts previous studies of other main signaling pathways critical for normal embryogenesis, like TGFβ, FGF, Wnt, Hh, Notch, Hippo, and of transcription factors for which the conservation of the L and S homoeologs is very high (>83.3%; Table 2) [40,41,42].
Further analysis of the distribution of homoeologs and singletons within the RA network genes, however, revealed a surprising, non-random distribution of gene loss events (Figure 1). Among the enzymes involved in the metabolic steps leading up to the production of RAL, including retinoid storage, about 75% of the genes (21 out of 28) are encoded as singletons (Figure 1; Table 2). Interestingly, for genes involved in the oxidation of RAL to RA, hydroxylation of RA, or actual RA-driven gene regulation, almost all (94.8%; 18 out of 19) are still encoded by both L and S homoeologs (Figure 1; Table 2).
This suggests a preferential loss of homoeologs involved in the production of RAL, regulation of RAL production, or storage of retinoids. One possible explanation for this asymmetrical gene loss in the metabolic side of the RA network could be the observation that RAL availability for oxidation by retinaldehyde dehydrogenases is like a “commitment” step (Figure 1). The oxidation of RAL to RA by the Aldh1a1, Aldh1a2, and Aldh1a3 enzymes cannot be reversed and either promotes RA-driven gene regulation or the RA produced has to be neutralized and degraded. RA signaling is one of the major embryonic signaling pathways dependent on the maternal nutritional status and its function can be altered by environmental factors [5,15,16,17]. Fluctuations in RA signaling, increase or decrease, can be extremely teratogenic. Therefore, we explored the possibility that the extensive gene loss observed preferentially achieves tighter regulation of the RA signal, providing an evolutionary advantage.
To assess whether this preferential gene loss in the RA metabolic and gene-regulatory pathway was restricted to RA signaling, we also analyzed the genomic evolution of two additional nuclear receptor signaling pathways closely linked to RA: vitamin D and thyroid hormone signaling [64,65]. Thyroid hormone biosynthesis and signaling in Xenopus includes 23 genes out of 52 that are already singletons (44.2%), bringing this pathway to the genomic average with no obvious distinctive distribution (Table 2). Interestingly, vitamin D biosynthesis and gene regulation exhibit a distribution resembling the RA network where part of the pathway is rich in singletons (Figure 2). Also in this case, the whole pathway (21 genes) exhibits 38% singletons (8 genes) close to the protein-coding average (Table 2) [32]. However, from the production of cholecalciferol (vitamin D3) the pathway has 6 genes out of 9 that are already singletons (Figure 2; Table 2). These 66.7% singletons in the vitamin D-specific part of the network show a preferential loss of genes involved in metabolism and gene regulation by this ligand.
As both the RA and vitamin D signaling pathways involve biosynthesis of the regulatory ligand through a metabolic pathway, to assess the generality of this observation we explored the L or S gene loss in additional metabolic pathways. For the de novo purine biosynthesis pathway we scored 7 genes out of 15 that are already singletons (Table 2). The 47% singleton status is close to the genomic average suggesting the normal rate of gene loss for coding sequences. Analysis of glycolysis + gluconeogenesis + Krebs cycle identified 9 singletons among 44 genes (20.4%), which is a low singleton proportion suggesting conservation of both homoeologs in these metabolic pathways (Table 2). Analysis of the folic acid metabolic network indicated the reverse: a high proportion of singletons. From the information in KEGG, we identified 27 enzyme-encoding genes in the X. laevis genome out of which 19 (70.4%) are encoded by singletons (Table 2), indicating a preferential loss of one of the homoeologs during evolution.
Based on the analysis of homoeolog loss in the Xenopus laevis genome to date [32,40,41,42], signaling pathways and metabolic networks can be classified into three groups. There are pathways that exhibit homoeolog retention rates similar to the protein-coding gene average in the whole genome. From our analysis, we identified the thyroid hormone synthesis and signaling, vitamin D biosynthesis and signaling, de novo purine biosynthesis, and RA metabolism and signaling pathways as belonging to this group (Table 2). The second group includes previously analyzed signaling pathways described as having very high homoeolog retention rates (low or suppressed singletons) [32,40,41,42], and we added Krebs cycle, glycolysis, and gluconeogenesis to this group (Table 2). Our analysis identified the third group as having a high rate of gene loss creating a high proportion of singletons (Table 2). Interestingly, apart from the folate metabolic network, for both RA metabolism and vitamin D biosynthesis and signaling, the high rate of homoeolog loss localizes to a specific region of the pathway (Figure 1 and Figure 2).

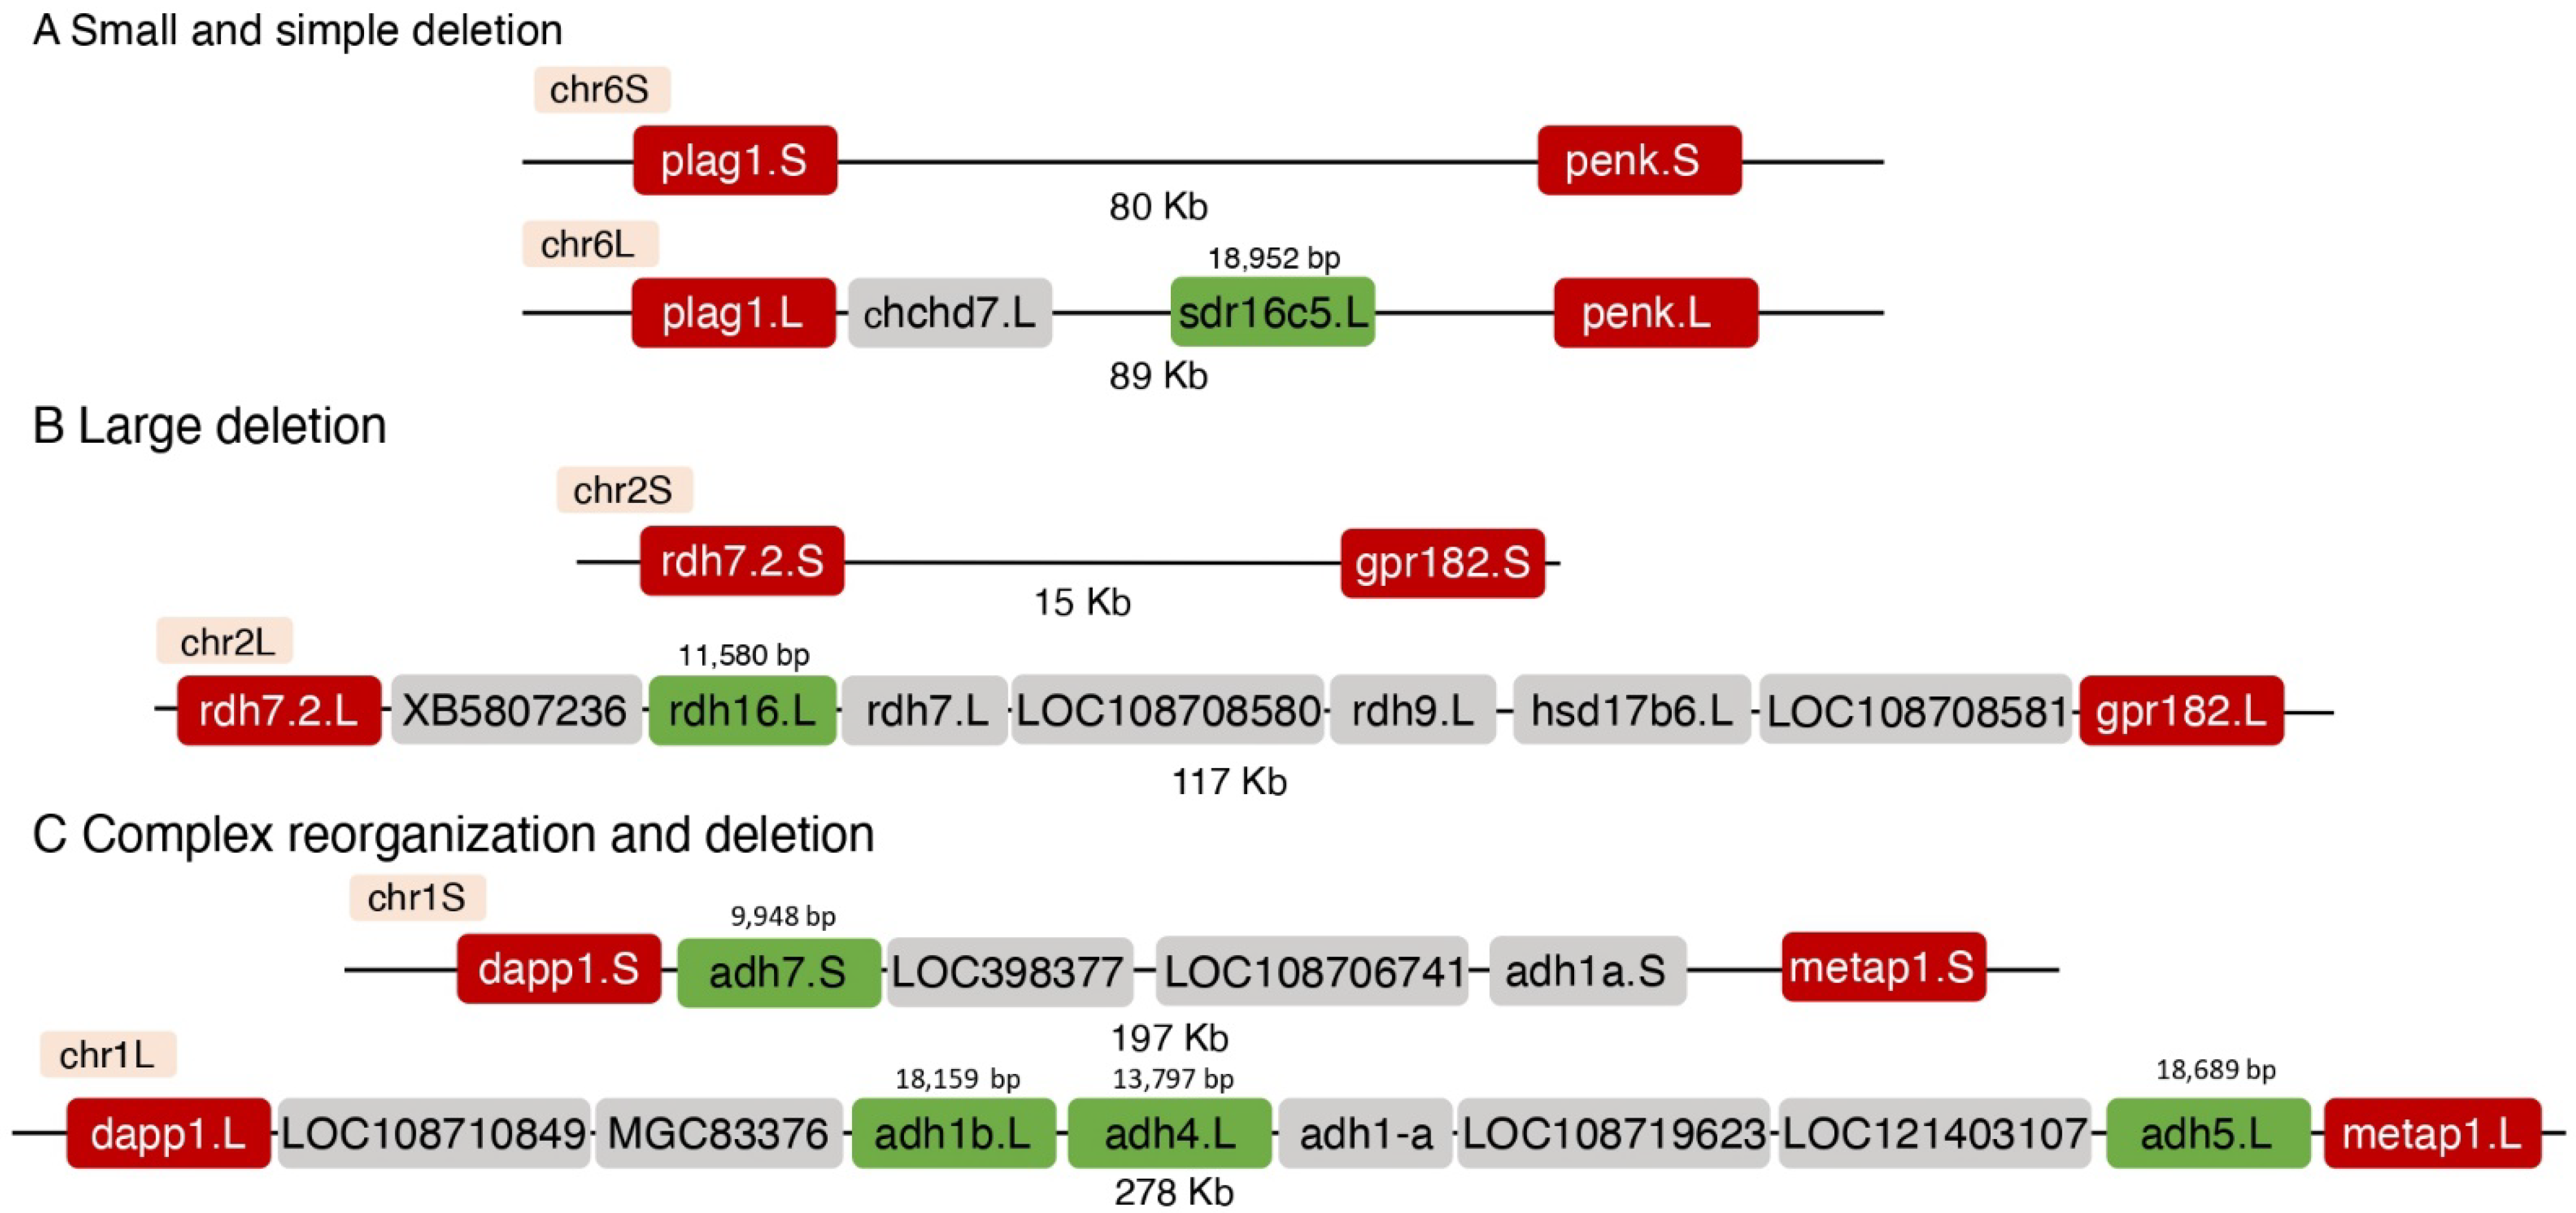
3.2. Genomic Changes in the Loss of a Homoeolog

The high incidence of singletons in the RA metabolic network from retinyl ester storage to the production of RAL prompted us to try to understand the genomic rearrangements that resulted in this enhanced homoeolog loss that involved 21 out of 28 genes (Table 2). We focused our analysis on enzymes with alcohol dehydrogenase activity to oxidize vitamin A to RAL (Producers 1); enzymes, mainly of the short-chain dehydrogenase/reductase family, that reduce RAL to retinol (Suppressors); and proteins involved in β-carotene cleavage to RAL (Producers 3) (Figure 1; Table 3). We compared the appropriate genomic regions between the L and S chromosomes choosing the first pair of conserved genes flanking the deleted or rearranged region as boundaries (Table 3). Using these flanking genes, we could determine the distance between them in the L and S chromosomes and analyze the region between them (Table 3). This type of analysis revealed cases in which single or multiple genes were deleted. Additionally, the length of the modified region changed from 0.1 to 410 Kb (Table 3). We could group the rearrangements into three groups. The first group represents singletons in which the loss of a homoeolog involved a relatively small (0.1–36 Kb) and simple deletion (Figure 3A; Table 3). The second group involved large (102–410 Kb) deletions (Figure 3B; Table 3). In the third group, we identified large deletions (81 and 238 Kb) combined with extensive rearrangement of the genomic region (Figure 3C; Table 3). These results show that most deletions leading to the loss of a homoeolog are relatively simple although the genomic region lost can be small or very large. In a few cases, the loss of a homoeolog involved complex genomic rearrangements in addition to the deletion of genes. In the locus on chromosome 1 (Figure 3C) there are multiple adh genes suggesting the possibility that this region contained duplicated sequences that could contribute to the rearrangements in this genomic region. On chromosome 9_10 we also observed a complex deletion but did not observe gene duplications that could contribute to its creation.

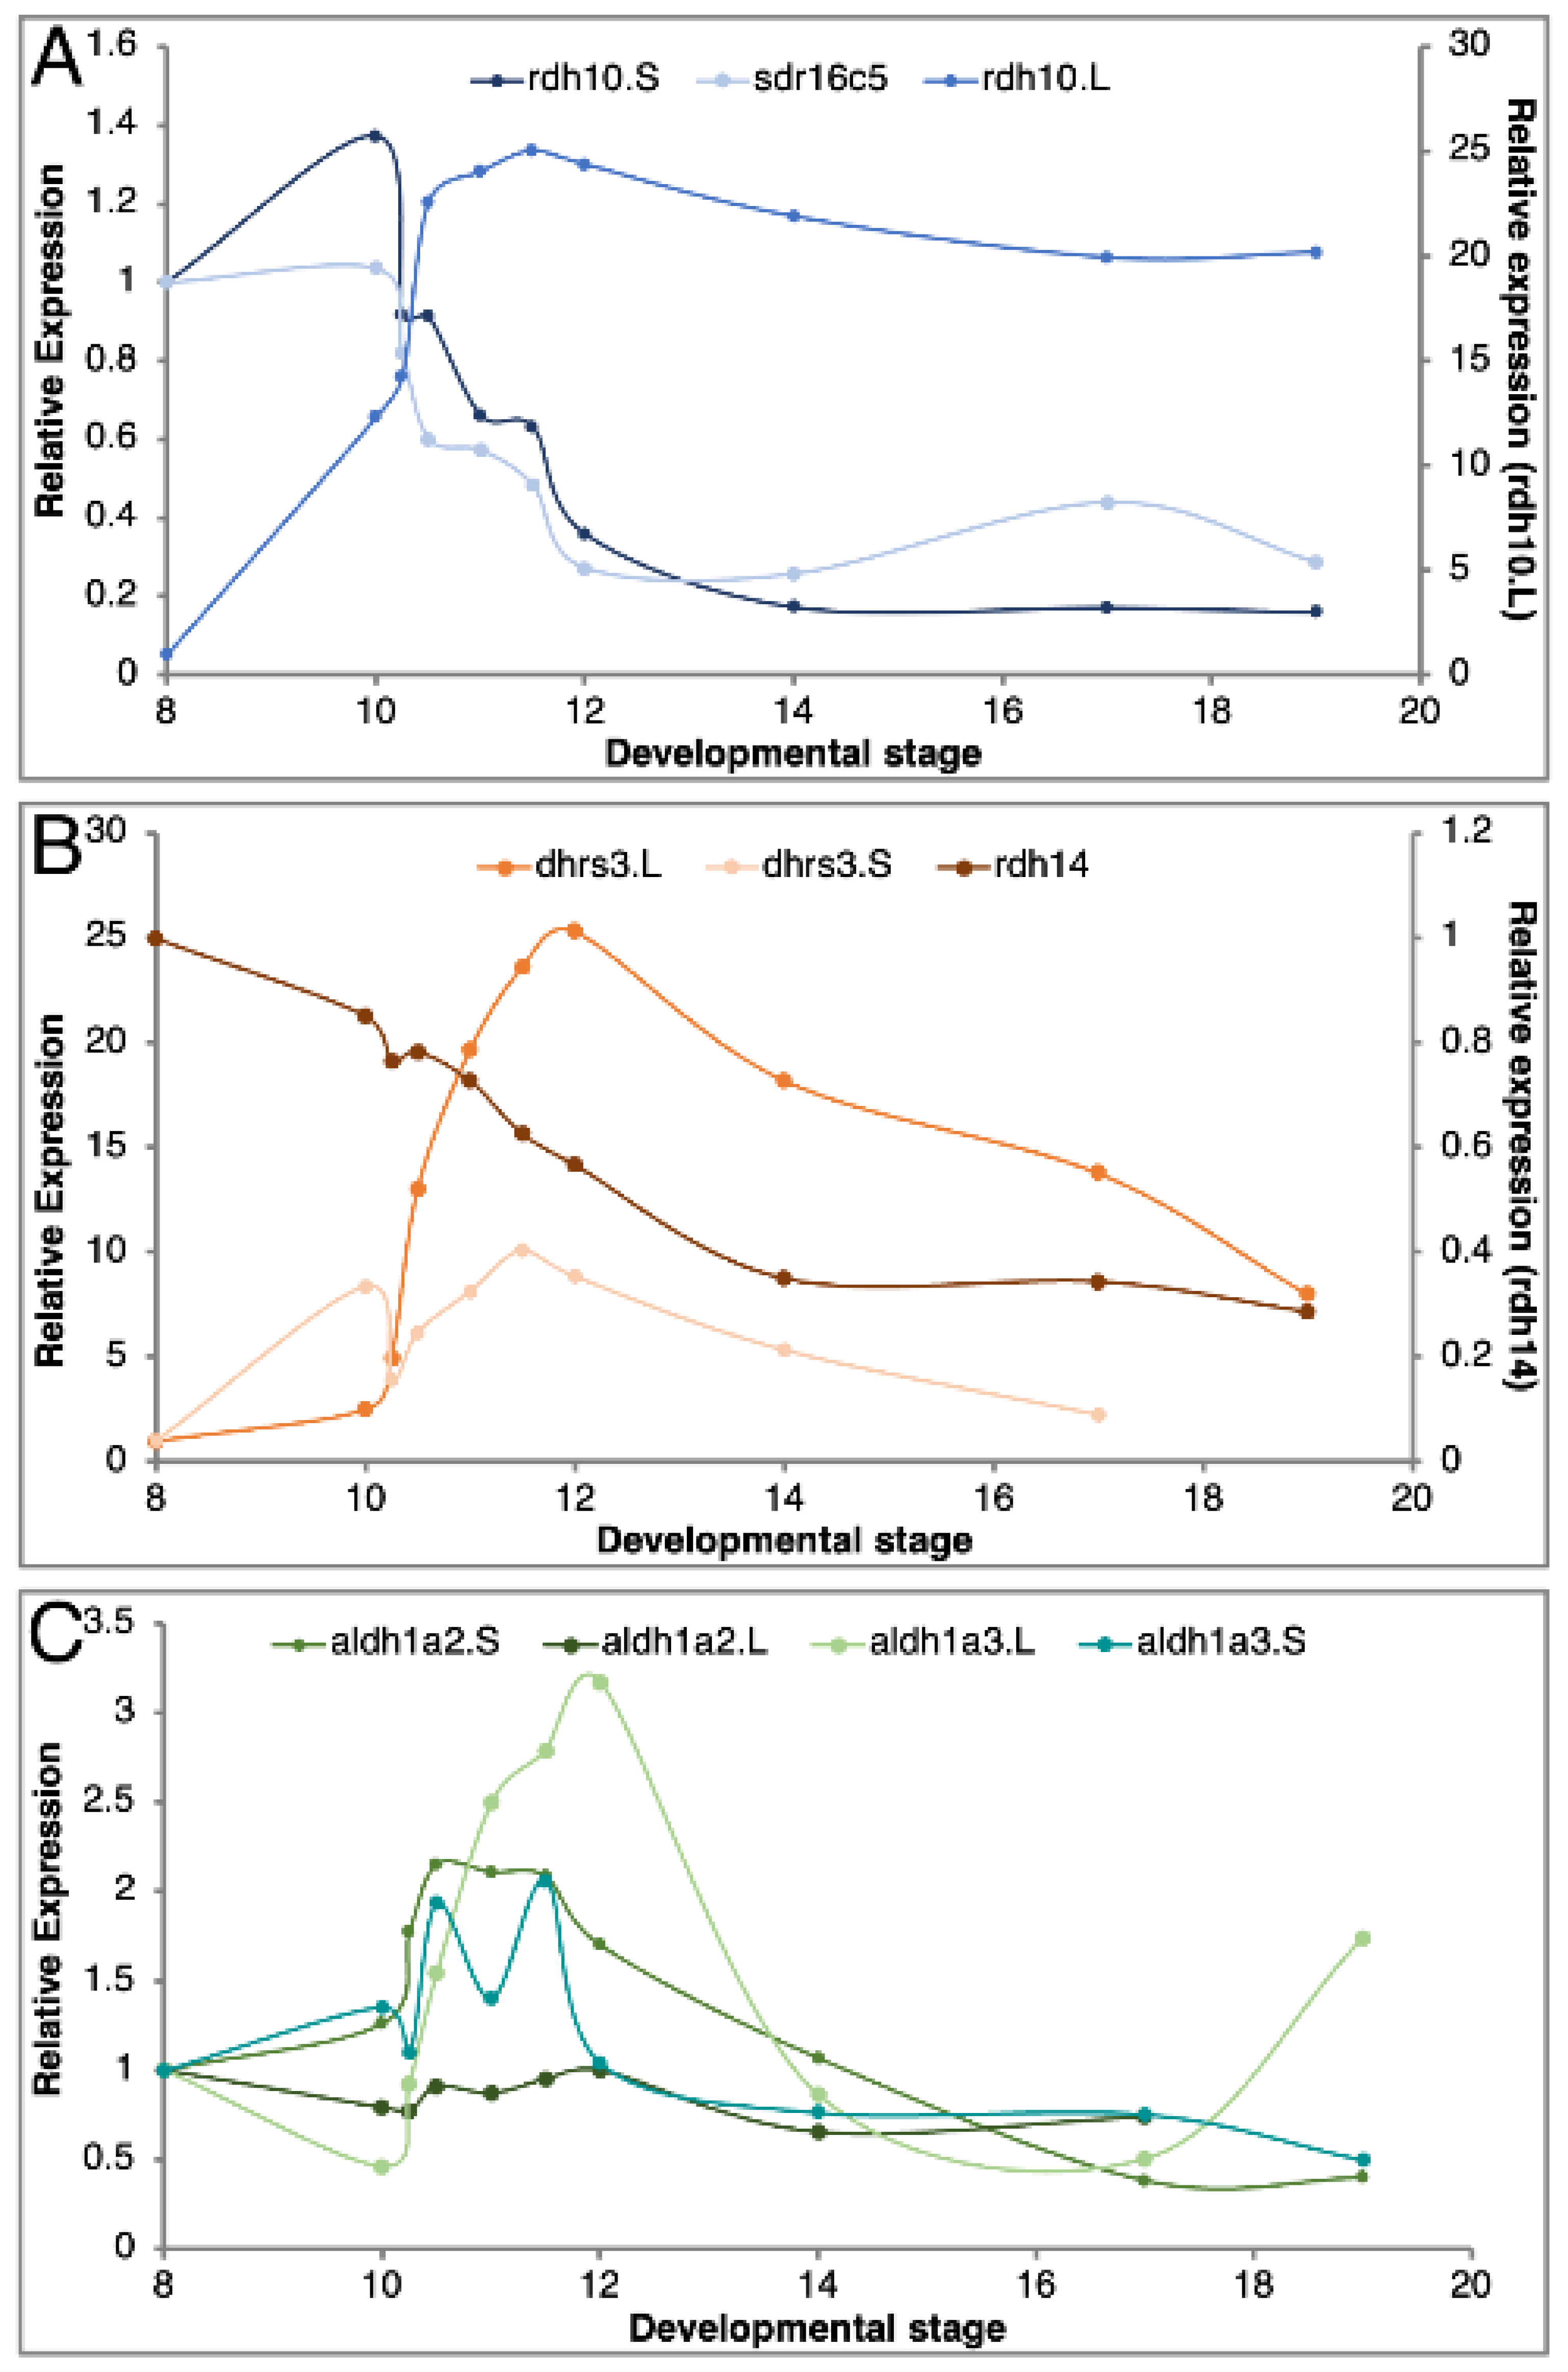
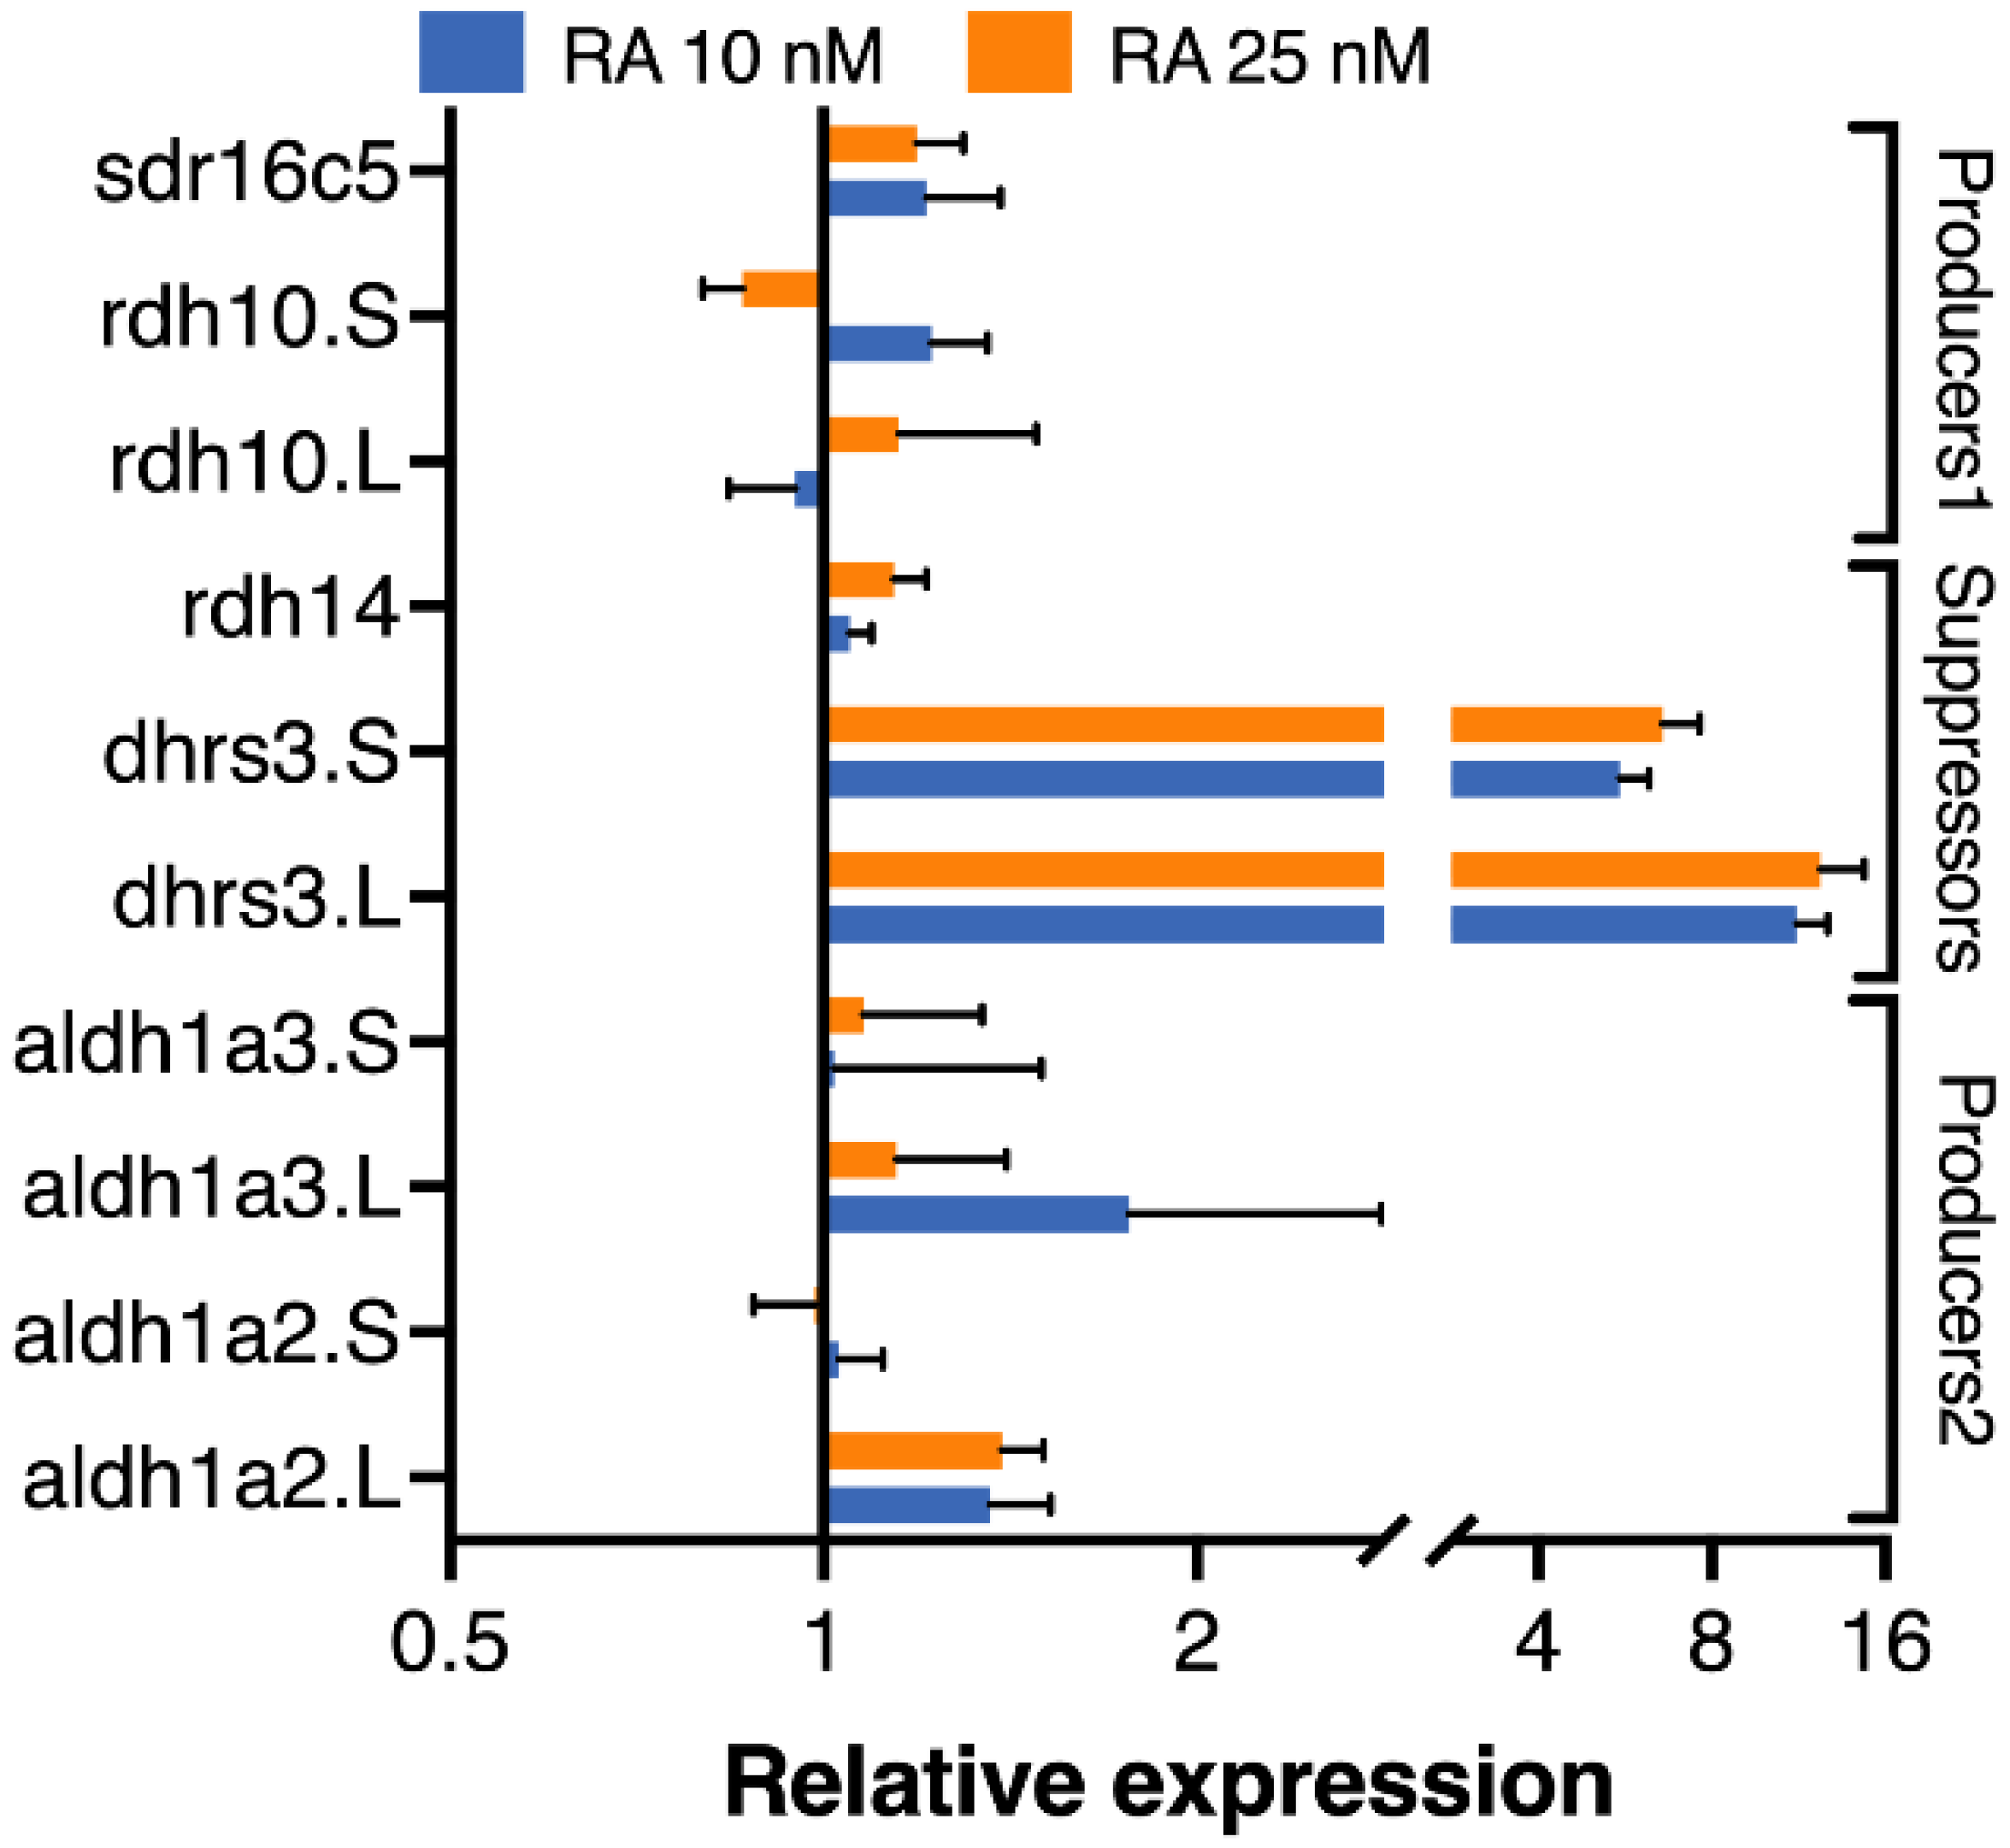
3.3. Expression Overlaps and Responsiveness of RA Network Components

Our recent analysis of the RA metabolic and signaling network revealed a high degree of robustness following disruption of this pathway within the physiological range [27]. Moreover, this study showed that enzymes performing the same metabolic reaction and expressed in partially overlapping patterns might be regulated differently. These differential responses to RA fluctuation are part of the mechanism to keep this critical signal within an appropriate, non-teratogenic range [27]. One possibility for the preferential loss of homoeologs in genes encoding RA network components is the selective or non-selective reduction of gene copies to achieve tighter regulation of the signal. To begin exploring these possibilities as possible driving forces for gene loss, we searched for gene pairs expressed during gastrula stages that have the same enzymatic activity but one of them is a singleton and the other is still presented as a homoeolog pair. Based on our previous studies we chose rdh10 and sdr16c5 for genes encoding enzymes that oxidize ROL to RAL (Producers 1), dhrs3 and rdh14 for genes encoding enzymes that reduce RAL to ROL (Suppressors), and aldh1a2 and aldh1a3 for genes encoding enzymes that oxidize RAL to RA and for which no singletons are known (Producers 2) (Figure 1). The temporal pattern of expression was determined for these genes including analysis of the individual homoeologs by qPCR (Figure 4). In all three gene groups, we observed extensive overlap in the temporal expression pattern between the selected singleton and at least one of the homoeologs of the paired gene with similar enzymatic activity (Figure 4A–C). While sdr16c5 (singleton) exhibits a pattern similar to the rdh10.S homoeolog both having significant maternal expression (Figure 4A), the rdh10.L homoeolog is mainly expressed zygotically. Among the Suppressors tested (Figure 4B), rdh14 exhibits what might be maternal transcripts, and its expression levels decline during gastrulation (Figure 4B). Both dhrs3 homoeologs retain extensively overlapping temporal expression patterns that peak at late gastrulation and subsequently decline (Figure 4B). The retinaldehyde dehydrogenase encoding genes aldh1a2 and aldh1a3 exhibit mostly zygotic expression patterns with a marked upregulation with the onset of gastrulation (Figure 4C). These expression patterns support the partial overlap between the genes selected and are part of the RA network during gastrulation.
For the four homoeolog pairs studied, we observed divergence in their temporal expression patterns. In the extreme case, rdh10.S exhibits high levels of maternal transcripts and a gradual decline during gastrula stages, whereas rdh10.L expression is activated after the midblastula transition as a zygotic gene (Figure 4A). A similar expression pattern for this homoeolog pair was determined from transcriptomic data [32]. This divergence in temporal expression patterns suggests changes in regulatory elements and initial subfunctionalization of the homoeologs [36]. For two of the other homoeolog pairs, dhrs3 and aldh1a3, there are subtle differences in their temporal expression patterns, with extensive overlap but also new gene-specific changes (Figure 4B,C). In contrast, the aldh1a2 homoeologs exhibit temporal expression patterns that are very similar (Figure 4C). Interestingly, the early expression of aldh1a2 at the onset of gastrulation has been linked to the onset of RA signaling as the enzyme encoded by this gene is the last component needed to complete the biosynthesis of RA [15,66,67,68,69]. Additionally, we showed that within the aldh1a gene family, aldh1a2 is expressed at the highest levels during early gastrula stages [15]. Thus, there appears to be selective pressure to conserve this expression pattern and the early gastrula activity of aldh1a2.
To better understand the contribution of these genes to the response of the RA network to fluctuations in ligand levels, we studied the response of these genes to subtle manipulation of RA levels. Analysis of the RA content of Xenopus laevis embryos during early gastrula estimated that they contain about 100–150 nM RA [70,71,72,73,74,75,76]. To perform physiologically relevant manipulations of RA we increased that level by about 10–25% using 10 and 20 nM treatments, respectively [27]. Embryos were treated from late blastula to early gastrula (st. 10.25) and collected for expression analysis by qPCR. This analysis revealed robust responses by the dhrs3 homoeologs (p < 0.0001) and weak (not significant) responses by the rest of the genes tested (Figure 5). The self-regulation of the RA metabolic and signaling network to maintain or restore normal signaling levels is widely accepted, and the transcriptional responses of aldh1a2, cyp26a1, dhrs3, and rdh10 to increased RA levels are the basis of this suggestion [18,19,20,21,22,23,24,69,77]. In a recent study, we performed a detailed analysis of the RA responsiveness and requirement for the RA network genes expressed during early gastrula [27]. While some genes exhibited robust and concentration-dependent responses, others showed no significant changes in response to RA fluctuations. Additionally, the same gene was shown to exhibit different responsiveness at different developmental stages [27]. These changes in responsiveness could be explained in part by the different temporal expression patterns and the RA responsiveness of the homoeologs that were not addressed in previous studies.

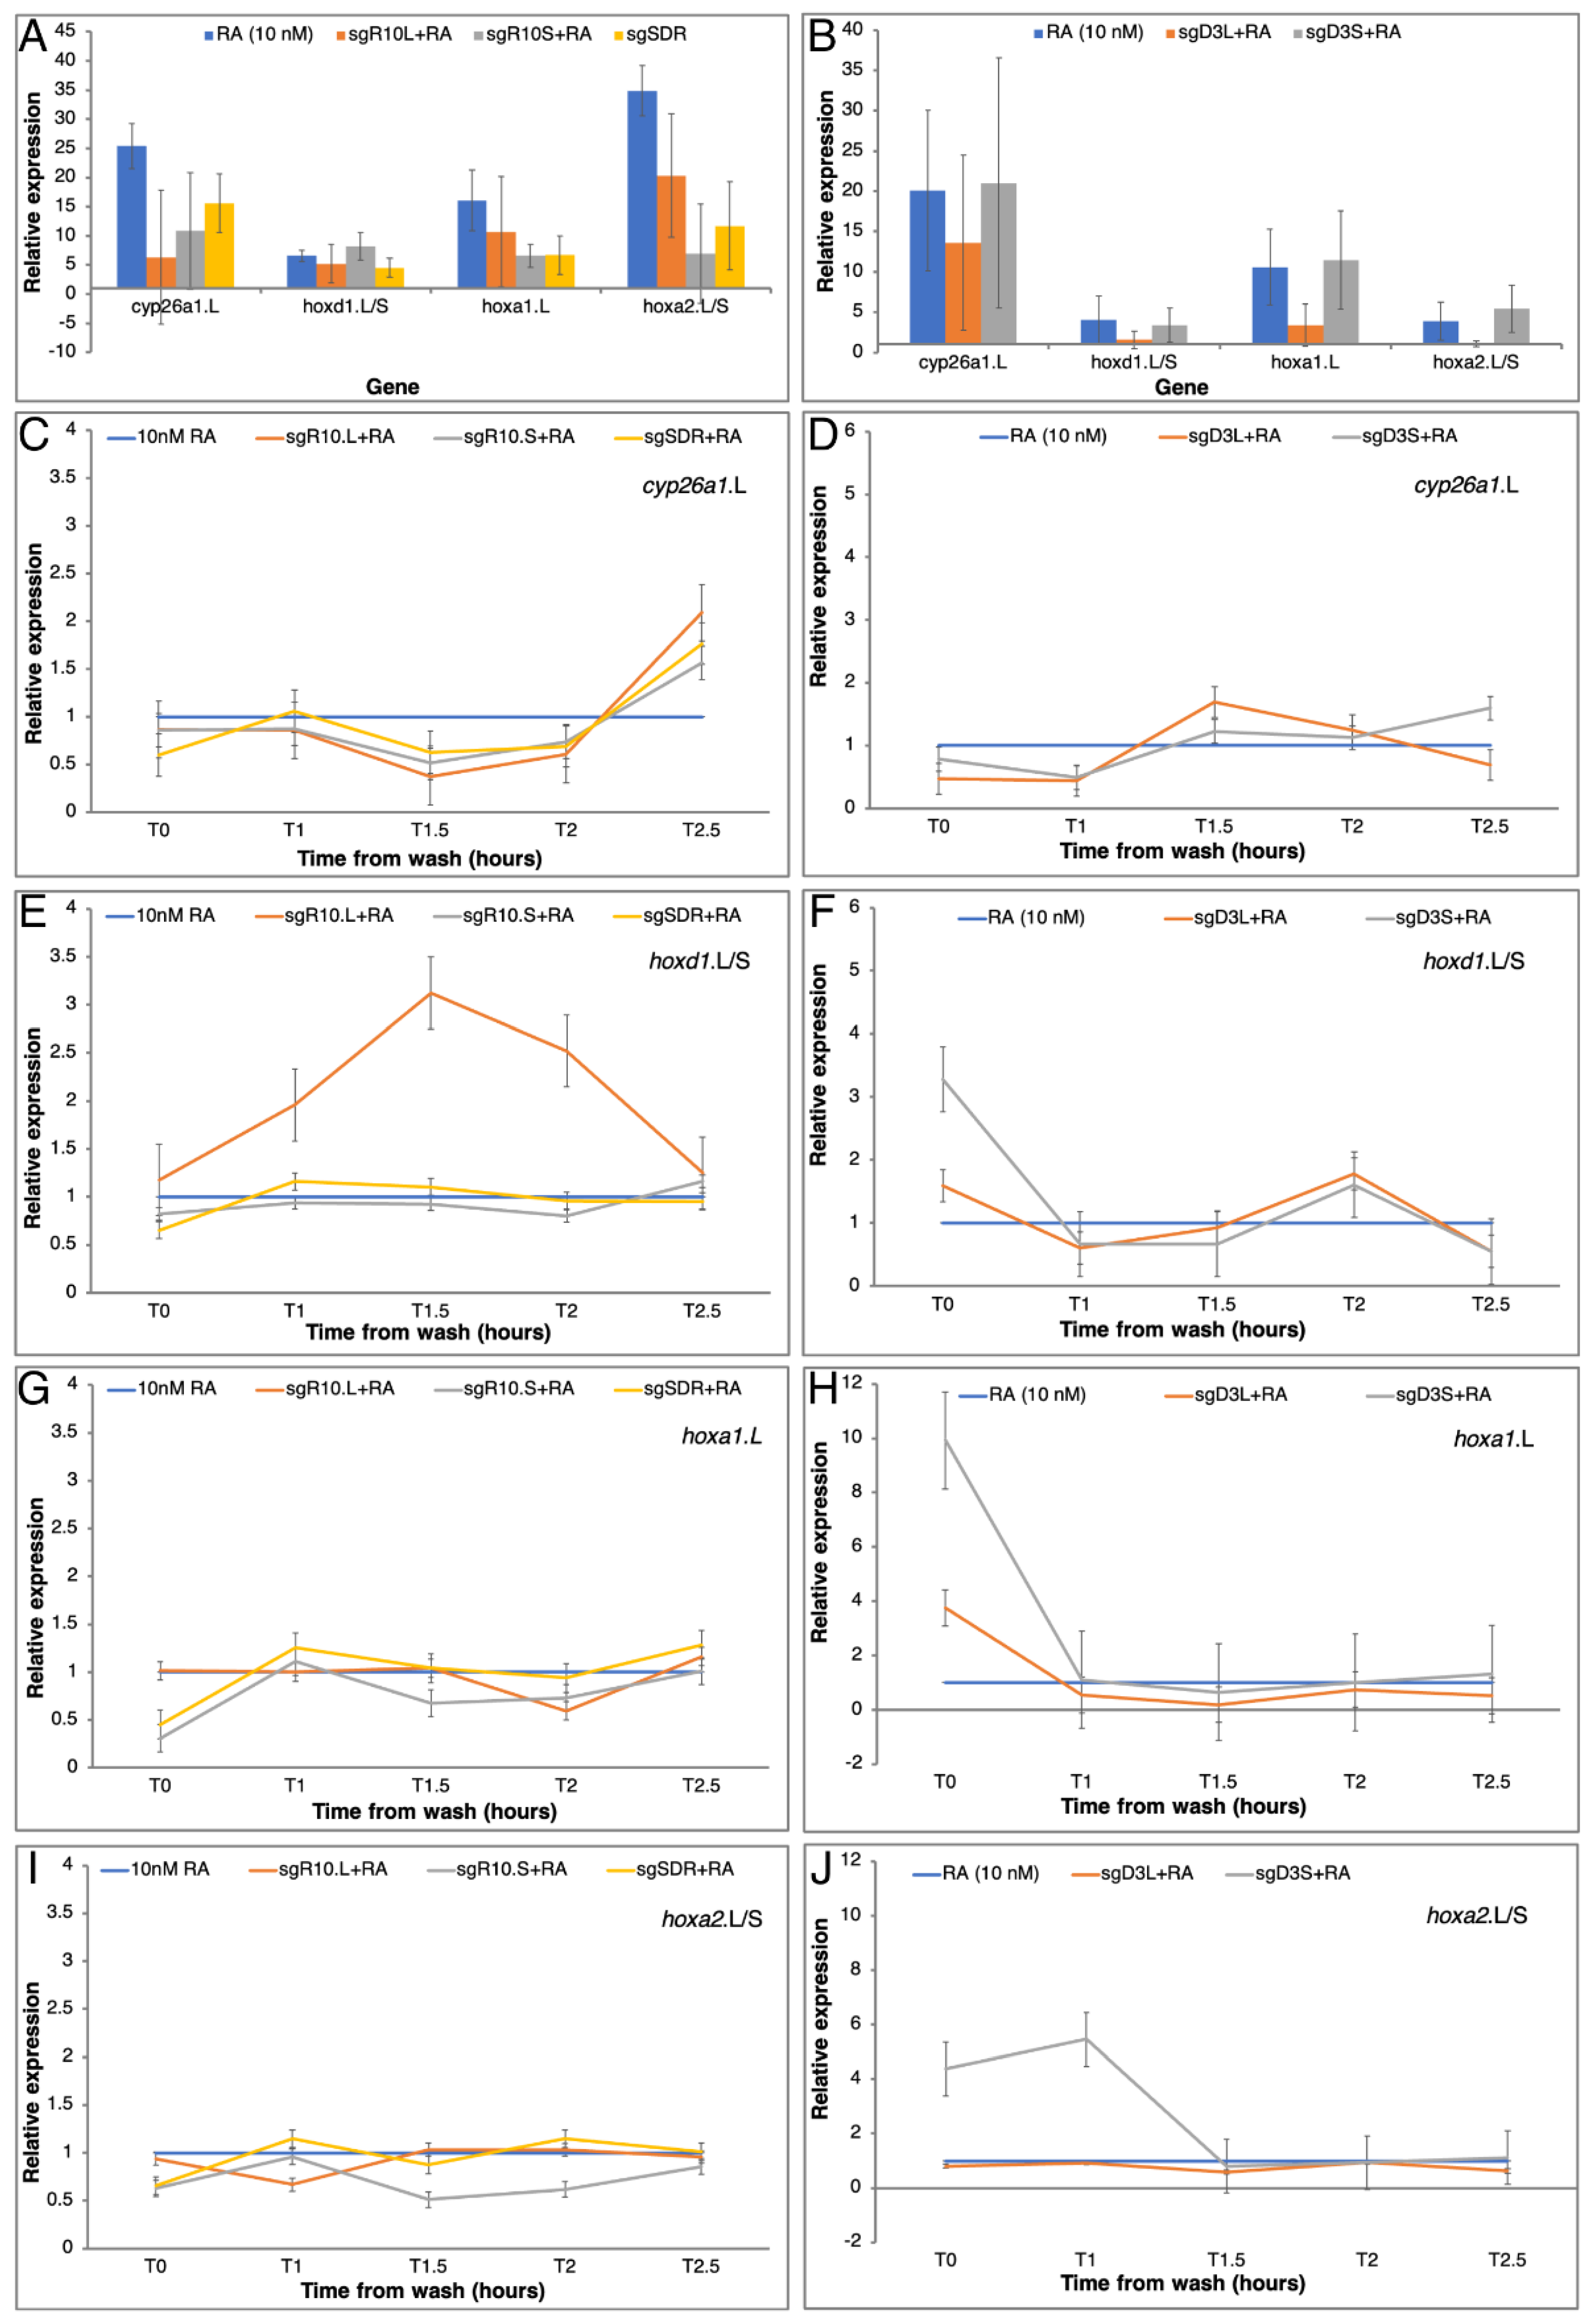
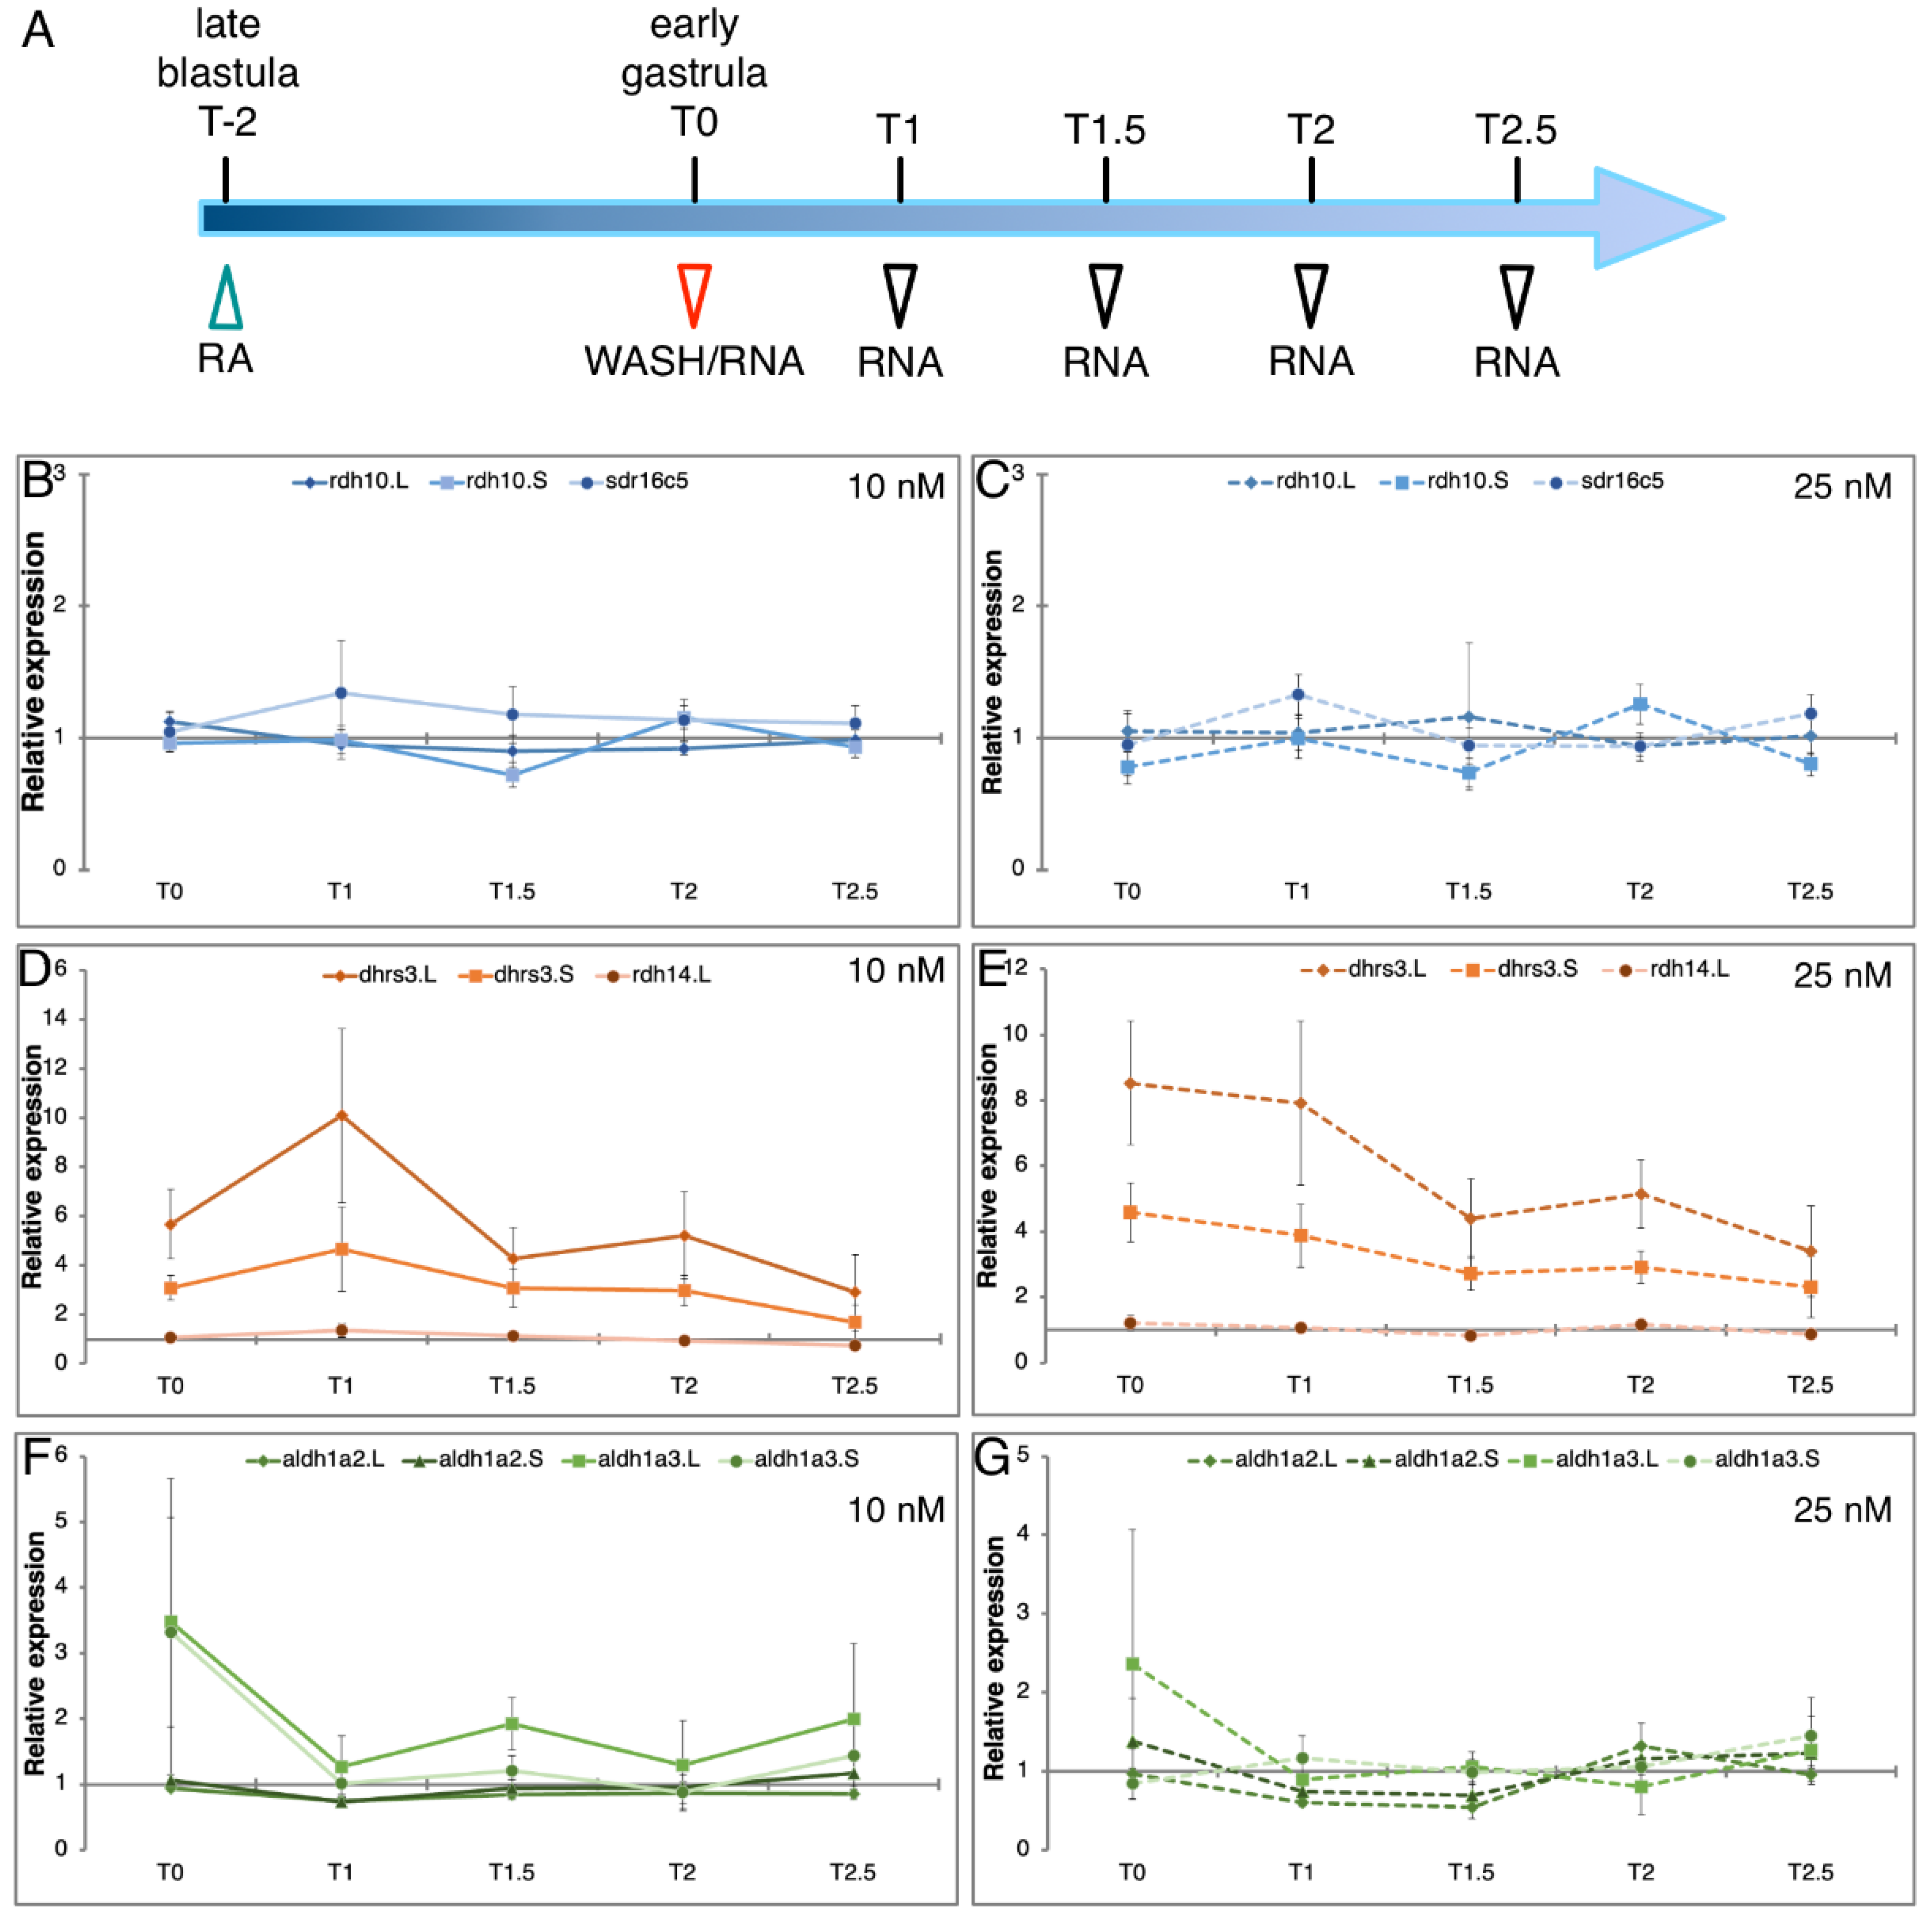
3.4. Homoeolog Response to Transient RA Manipulation

The enhanced homoeolog gene loss observed within the RA metabolic network leading to the production of RAL raised the question as to the possible selective pressure driving this phenomenon. Maintenance of normal RA signaling levels is central for the prevention of the teratogenic effects of increased or decreased RA signaling levels [13,21,70,78,79,80,81]. Thus, homoeolog gene loss might be a “solution” to achieve tighter signaling regulation, i.e., robustness [27]. Several models can be suggested that could drive this gene loss to achieve higher RA signaling robustness. One possibility is that one of the homoeologs in the pair has a looser regulation or enhanced sensitivity, “noisier” regulation, exhibiting enhanced responses to RA changes. It is important to note that this “noisy” gene could in theory mediate fast responses and might not necessarily be advantageous to lose. Alternatively, coordinated regulation of numerous genes performing the same enzymatic function might be more complicated to achieve, so having fewer genes would provide tighter regulation. Then, the “noisy” gene is lost preferentially to reach tighter regulation. To discriminate between these possibilities, we took advantage of an experimental protocol for transient RA manipulation and kinetic monitoring of the recovery process by qPCR (Figure 6A) [27]. This assay allows us to monitor the robustness response as it takes place by analyzing the expression changes of RA network components and downstream, RA-regulated genes. To perform physiologically relevant RA manipulations, based on our homoeolog responsiveness analysis (Figure 5) and our previous studies [27], embryos were treated with 10 and 25 nM all-trans RA for 2 h from late blastula to early gastrula (st. 10.25). The treatment was terminated by washing (T0) and samples were collected during the recovery period at 1.0, 1.5, 2.0, and 2.5 h post-washing (T1, T1.5, T2, and T2.5, respectively) (Figure 6A). RNA samples were prepared for comparative expression analysis to control samples. For enzymes that oxidize ROL we analyzed rdh10.L, rdh10.S, and sdr16c5 (Producers 1), for enzymes that reduce RAL to ROL we chose dhrs3.L, dhrs3.S, and rdh14 (Suppressors), and among the genes that produce RA (Producers 2), we studied both homoeologs of aldh1a2 and aldh1a3 (Figure 1). For each homoeolog or singleton, the relative expression (fold change; ∆) was calculated at each time point relative to the expression in sibling control embryos at the same developmental stage, and the average ∆ of four biological replicates was calculated. Analysis of rdh10.L, rdh10.S, and sdr16c5 revealed very slight fluctuations of all three genes irrespective of whether 10 or 25 nM RA was used for the treatment (Figure 6B,C). These weak responses are in agreement with the previous results of the RA responsiveness in which all three genes responded similarly (Figure 5). Additionally, these results suggest that none of the genes exhibit heightened responses in our experimental protocol which aims to mimic physiological RA fluctuations.
Analysis of the genes encoding enzymes preferentially involved in reducing RAL to ROL, dhrs3.L, dhrs3.S, and rdh14, revealed the hypothesized situation where one of the homoeologs exhibits an enhanced response to changes in RA levels and delayed restoration of normal expression levels. Expression of dhrs3.L shows the strongest upregulation at T0 irrespective of the amount of RA employed of the three genes analyzed (Figure 6D,E). By comparison, dhrs3.S shows a robust but weaker response at the end of the treatment, and rdh14 only exhibits a weak response. Importantly, while dhrs3.S and rdh14 reached almost normal expression levels (<2.3 fold) at the end of the recovery period (T2.5), dhrs3.L is still significantly upregulated (>2.9 fold) (Figure 6D,E). Analysis of the aldh1a2 and aldh1a3 homoeologs revealed that by the end of the transient treatment (T0), some of the homoeologs exhibit a clear upregulation, but already one hour into the recovery period all genes are almost back to normal expression levels (Figure 6F,G). These results show that the transient RA treatments can induce robust responses (dhrs3), but many of the genes studied exhibit mild expression changes and strong robustness responses, i.e., return to normal levels. A previous study that employed the same transient RA manipulation protocol but collected samples up to 5.5 h after washing showed efficient recovery to normal expression levels of most RA network genes [27].
To make comparisons between samples, genes, or biological replicates easier, we calculated the fold change of each gene for all time points (∆) and we summed up the values into a summary fold change score (∑∆). This tightness regulation score should be low for tightly regulated genes and high for enhanced responders with slow recovery to normal values. We calculated this regulation tightness score for all genes studied (Table 4). The results show that for genes exhibiting moderate or limited gene responsiveness to RA and expression changes throughout the recovery period, rdh10.L, rdh10.S, sdr16c5, rdh14, aldh1a2.L, and aldh1a2.S, the average ∑∆ score ranged from 4.3 to 5.8 (Table 4). For each one of these genes, the difference in the amount of RA added had a very limited effect on the variation in their expression. For genes with higher fluctuation in their expression, aldh1a3.L, aldh1a3.S, dhrs3.L, and dhrs3.S, the ∑∆ score increased in correlation with the kinetic analysis result (Table 4; Figure 6). The score for dhrs3.L reached ∑∆ > 28 making it the least tightly regulated gene or the gene with the most extreme responses to RA fluctuations of those analyzed. Importantly, both singletons studied, rdh14 and sdr16c5 exhibited tight regulation with low responsiveness to RA fluctuations even though they have been shown to be involved in vivo in the metabolism of RA [82,83,84].

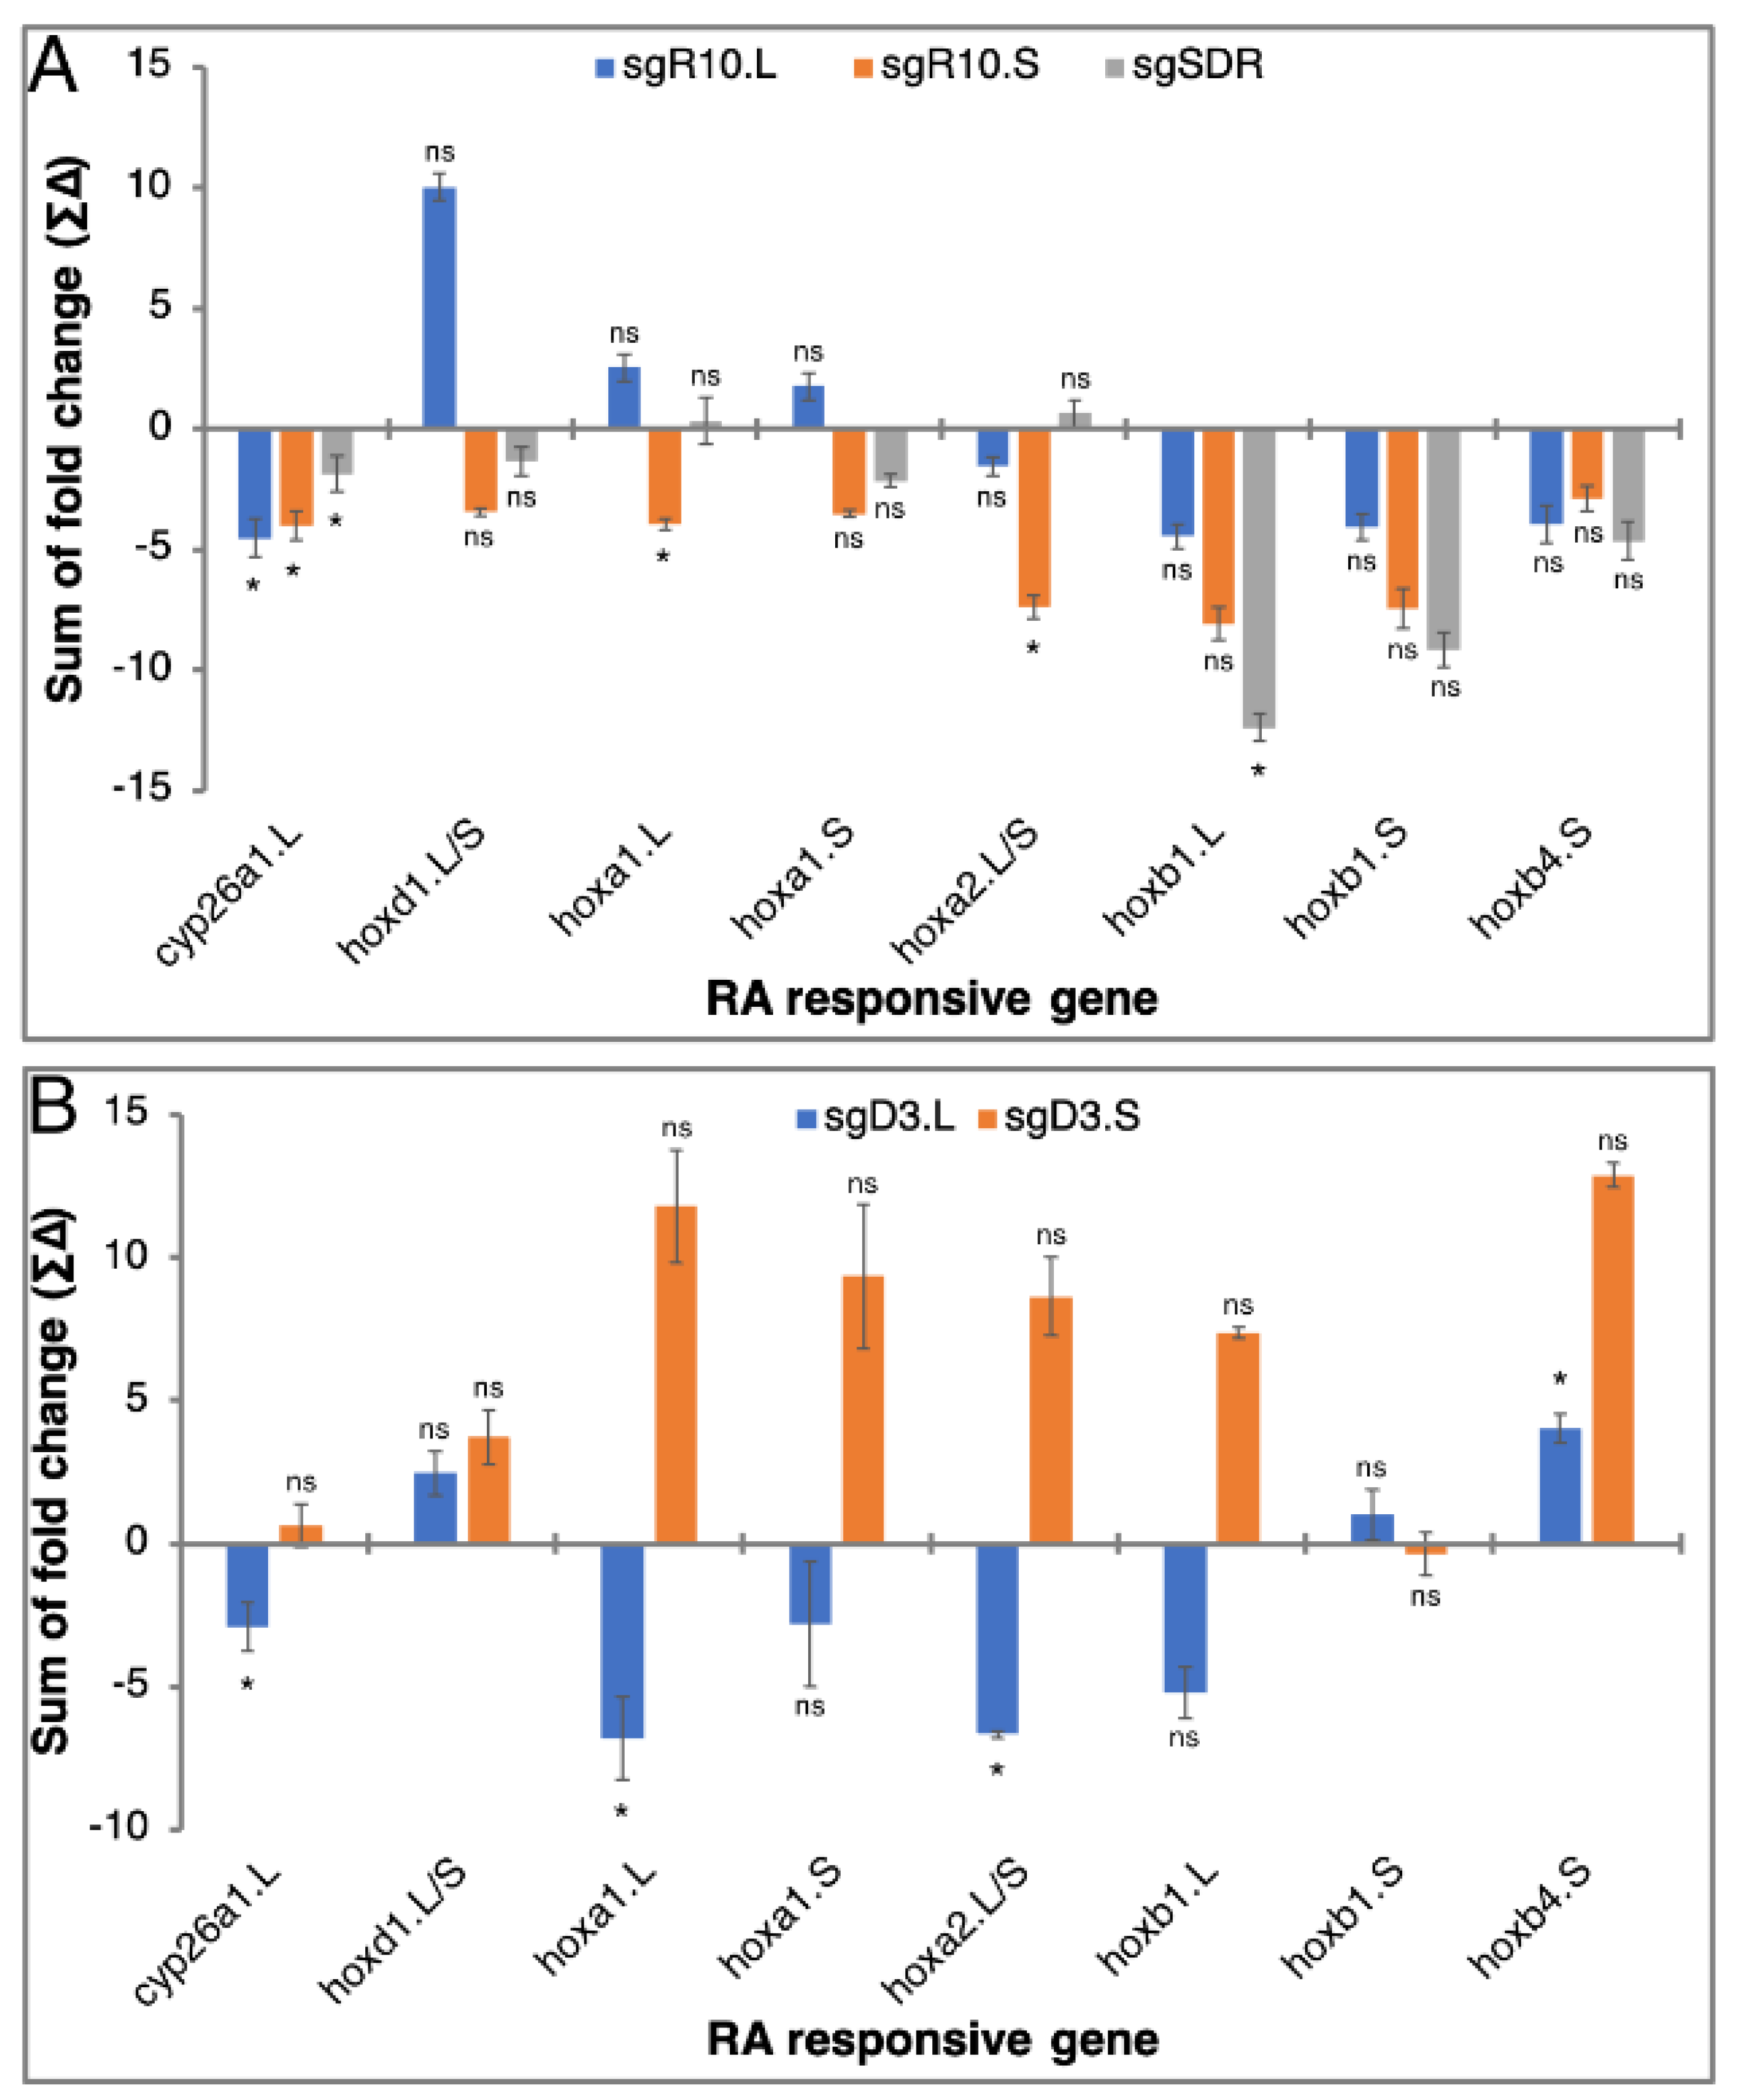
3.5. RA Responsiveness in Homoeolog CRISPant Embryos

The results of the individual homoeolog responses to transient RA manipulation identified gene pairs that represent all the possibilities initially suggested. The rdh10 and aldh1a2 genes have tightly and similarly RA-regulated homoeolog pairs. Similar but slightly enhanced responses were observed for the aldh1a3 homoeologs, whereas the dhrs3 homoeolog pair showed strong responses to RA changes and marked differences between the L and S genes. To begin to address the possible force driving the gene loss that gives rise to singletons, we took advantage of the CRISPR/Cas9 technology to create a partial, homoeolog-specific gene loss. We designed homoeolog-specific single guide RNAs (sgRNA) for the dhrs3 and rdh10 genes to knock down the expression of one homoeolog without affecting the second one. We also designed a sgRNA targeting the sdr16c5 singleton. To determine the efficiency of the sgRNAs, DNA was extracted from CRISPant embryos and the genomic region containing the sgRNA targeted sequence was PCR-amplified and sequenced. Decomposition analysis of the sequence traces [50,51] provided a quantitative assessment of the genome editing efficiency. Analysis of the sequencing traces demonstrated the creation of indels around the sequence targeted by the sgRNA and the deterioration of the sequencing quality (Supplementary Figure S1). According to the decomposition analysis, we observed a relatively robust effect of the sgRNAs inducing indels (Supplementary Figure S1).
To study the effect of losing one of the homoeologs on the RA robustness response, embryos were injected at the one-cell stage with the appropriate sgRNA/Cas9 riboprotein complex to generate CRISPant embryos, which were then subjected to the transient RA manipulation protocol using low RA concentrations (10 nM) (Figure 6A). RNA samples were collected at T0 (wash) and at 1.0, 1.5, 2.0, and 2.5 h after treatment termination. To understand the effect of this gene knockdown on the RA signaling levels, we analyzed the expression of a panel of RA-regulated genes including cyp26a1.L, hoxd1.L/S, hoxa1.L, hoxa1.S, hoxa2.L/S, hoxb4.S, hoxb1.L, and hoxb1.S (Figure 7 and Supplemental Figure S2). Comparison at T0 of the expression levels of RA-responsive genes between RA treated CRISPants (rdh10, dhrs3, and sdr16c5) and control siblings treated with RA supported the efficiency of the sgRNAs (Figure 7A,B and Supplemental Figure S2A,B). The RA treatment alone induced upregulation of all RA targets ranging from 3.6 to 35-fold increase, while RA treatment of the rdh10.L, rdh10.S, and sdr16c5 CRISPants resulted in a weaker RA-induced upregulation irrespective of the gene being knocked down (Figure 7A and Supplemental Figure S2A). In agreement with the similar and limited responses to RA exposure (Figure 6B,C), the three genes individually targeted, rdh10.L, rdh10.S, and sdr16c5, resulted in similar outcomes. This response of the RA target genes agrees with the suggestion that between similarly regulated RA network genes that encode enzymes performing the same metabolic reaction, their loss is equivalent in the early embryo. Maintenance of the singletons might reflect different spatial–temporal regulation to perform the same enzymatic reaction in different tissues in the embryo or the adult.
Kinetic analysis of the RA robustness response in the rdh10.L, rdh10.S, and sdr16c5 CRISPants was monitored by following the expression of the RA target genes during the recovery period (T0-T2.5; Figure 6A). To better understand the contribution of the RA network components studied, the CRISPant samples treated with RA were compared to siblings treated with RA only. In most instances, knockdown of each of these three genes had a mild effect on gene expression, reducing the response to the transient RA treatment (Figure 7C,E,G,I and Supplemental Figure S2C,E,G,I). It is important to note that weaker responses in the RA-treated CRISPants support a tighter regulation of the signal as a result of the gene loss phenocopy. In a few instances we observed enhanced responses to the RA exposure mainly linked to the rdh10.L CRISPant (Figure 7E and Supplemental Figure S2C), the rest of the samples exhibited more restricted responses to RA exposure supporting a tighter regulation. To simplify the comparative analysis between CRISPants, we calculated the regulation tightness score (∑∆) of the RA target genes for all time points compared to their response in RA-treated embryos (Figure 8A). The scores for the RA-regulated genes in the three RA-treated CRISPants showed that all of them reduced the target gene expression changes. This result suggests that in the case of rdh10.L, rdh10.S, and sdr16c5, the gene activity reduction results in tighter regulation of the RA robustness response in agreement with a gene loss model for better regulation of the signal. The low significance of the changes further supports the efficient robustness response of the RA network. In this analysis, we can also observe the enhanced responses linked to the rdh10.L CRISPant (Figure 8A).
The dhrs3 homoeologs exhibit enhanced responses to transient RA exposure, with the dhrs3.L gene showing the strongest responses (Figure 6D,E; Table 4). Since the Dhrs3 enzyme preferentially reduces RAL back to ROL [25,58,85], the dhrs3 CRISPants should exhibit enhanced RA signaling unless the RA network self-regulation and robustness response compensates for this loss of activity [27]. Supporting the robustness scenario, the dhrs3 CRISPants alone had almost no effect on the RA responsive genes with the exception of the two hoxb1 homoeologs exhibiting a 1.5–7.5 increase in expression compared to control samples (not shown). Analysis at T0 of both dhrs3 RA-treated CRISPants showed that these responses were not enhanced as expected, and the partial knockdown of one of the dhrs3 homoeologs resulted in reduced responses. In agreement with the loss of the loosely regulated, noisy homoeolog, these results show that the dhrs3.L CRISPants exhibit a stronger reduction in the RA response compared to knockdown of the dhrs3.S homoeolog (Figure 7B and Supplemental Figure S2B). Then, knockdown of the loosely regulated homoeolog achieves tighter regulation of the response.
While the T0 analysis supports the loss of the “noisier” gene to achieve tighter regulation of the response during the RA treatment, analysis of the full recovery kinetics compared to RA-only manipulated embryos provides information as to the effects of the homoeolog knockdown on the RA robustness response. Analysis of the same panel of RA-responsive genes showed that by about 1.5 h into the recovery period (T1.5), the expression levels of the target genes analyzed in the dhrs3.L and dhrs3.S CRISPants was almost back to the same as the samples treated only with RA (Figure 7D,F,H,J and Supplemental Figure S2D,F,H,J). We could observe slight fluctuations in expression levels but in most instances, both CRISPants gave similar variations although the responses in the dhrs3.L tend to be lower than the RA-only samples, while the dhrs3.S CRISPants gave slightly enhanced responses. For multiple genes, at T0 we observed the upregulation characteristic of the treatment before RA washing (Figure 7F,H,J and Supplemental Figure S2D,J). Additionally, at T0 and T1, CRISPants of the more tightly regulated homoeolog, dhrs3.S, exhibit larger fluctuations in expression of the RA responsive genes. Calculation of the regulation tightness score showed the opposed outcomes of the homoeolog-specific knockdown (Figure 8B). The RA robustness response is enhanced by knockdown of the dhrs3.S homoeolog, while knockdown of dhrs3.L results in a reduced response. In addition, in this case most changes observed were hardly significant compared to control RA-treated embryos. Analysis of the dhrs3 homoeologs identified the dhrs3.L gene as the one exhibiting enhanced responses to RA treatment and less tight regulation (Figure 6D,E). Then, knockdown of the homoeolog exhibiting tighter regulation exposes the system to the homoeolog with the gene with the apparent looser regulation. Interestingly, within 1.5 h in the recovery, the system appears to stabilize irrespective of the homoeolog manipulated even though both dhrs3 homoeologs take longer to reach normal expression levels. These observations suggest that the RA network robustness response efficiently restores normal RA signaling levels irrespective of the homoeolog knocked down. Removing the more loosely regulated homoeolog slightly improves the robustness response.

4. Conclusions

The RA metabolic and signaling network is strongly dependent on the nutritional status and is influenced by the environment. Fluctuations in the RA signaling levels during embryogenesis can result in severe teratogenic outcomes. The preferential gene loss of the RA network components involved in the metabolism leading to RAL production suggests a selective pressure to achieve tighter regulation of the robustness response. Eliciting a robustness response by transient RA manipulation together with knockdown of specific gene homoeologs support the suggestion that gene loss might be linked to more efficient regulation of the network. The RA robustness response efficiently overcomes the reduction of one of the homoeologs. Tighter network regulation might involve loss of homoeologs similarly regulated, or homoeologs with enhanced responses. While the allotetraploid condition of X. laevis is convenient to explore these genomic changes and their regulatory outcomes, in diploid organisms, besides gene duplications and deletions, mutation, addition, and deletion of regulatory elements might take place to achieve the similar outcomes.

Supplementary Materials

The following supporting information can be downloaded at: https://www.mdpi.com/article/10.3390/cells11030327/s1, Figure S1: Genomic sequence deterioration in the RA network CRISPants. Figure S2: RA responsiveness in RA network homoeolog-specific CRISPants.

Author Contributions

Conceptualization: A.F., L.B.-K. and T.A.; methodology, T.A.; validation, T.A., L.B.-K. and A.S.; formal analysis, T.A., L.B.-K. and A.S.; investigation, T.A., L.B.-K. and A.S.; resources, A.F. and T.A.; data curation, T.A., L.B.-K. and A.S.; writing—original draft preparation, A.F.; writing—review and editing, T.A., L.B.-K. and A.S.; supervision, A.F.; project administration, A.F.; funding acquisition, A.F. All authors have read and agreed to the published version of the manuscript.

Funding

This work was funded in part by grants from the United States-Israel Binational Science Foundation (2013422 and 2017199), The Israel Science Foundation (668/17), the Manitoba Liquor and Lotteries (RG-003-21), and the Wolfson Family Chair in Genetics to A.F.

Institutional Review Board Statement

Experiments were performed after approval and under the supervision of the Institutional Animal Care and Use Committee (IACUC) of the Hebrew University (Ethics approval no. MD-17-15281-3).

Informed Consent Statement

Not applicable.

Data Availability Statement

Data is contained within the article or Supplementary Material.

Acknowledgments

We wish to thank Martin Blum and Tim Ott for introducing us to the manipulation of the Xenopus genome using CRISPR/Cas9. We also wish to thank Sally Moody and Graciela Pillemer for critically reading the manuscript.

Conflicts of Interest

The authors declare no conflict of interest.

References

  1. Metzler, M.A.; Sandell, L.L. Enzymatic metabolism of vitamin A in developing vertebrate embryos. Nutrients 2016, 8, 812. [Google Scholar] [CrossRef]
  2. le Maire, A.; Bourguet, W. Retinoic acid receptors: Structural basis for coregulator interaction and exchange. Subcell. Biochem. 2014, 70, 37–54. [Google Scholar] [CrossRef]
  3. Nolte, C.; De Kumar, B.; Krumlauf, R. Hox genes: Downstream “effectors” of retinoic acid signaling in vertebrate embryogenesis. Genesis 2019, 57, e23306. [Google Scholar] [CrossRef]
  4. Draut, H.; Liebenstein, T.; Begemann, G. New Insights into the Control of Cell Fate Choices and Differentiation by Retinoic Acid in Cranial, Axial and Caudal Structures. Biomolecules 2019, 9, 860. [Google Scholar] [CrossRef] [Green Version]
  5. Blaner, W.S. Vitamin A signaling and homeostasis in obesity, diabetes, and metabolic disorders. Pharmacol. Ther. 2019, 197, 153–178. [Google Scholar] [CrossRef]
  6. Napoli, J.L. Post-natal all-trans-retinoic acid biosynthesis. Meth. Enzymol. 2020, 637, 27–54. [Google Scholar] [CrossRef]
  7. Blaner, W.S.; Li, Y.; Brun, P.-J.; Yuen, J.J.; Lee, S.-A.; Clugston, R.D. Vitamin A absorption, storage and mobilization. Subcell. Biochem. 2016, 81, 95–125. [Google Scholar] [CrossRef]
  8. Ghyselinck, N.B.; Duester, G. Retinoic acid signaling pathways. Development 2019, 146. [Google Scholar] [CrossRef] [Green Version]
  9. Kedishvili, N.Y. Retinoic acid synthesis and degradation. Subcell. Biochem. 2016, 81, 127–161. [Google Scholar] [CrossRef] [Green Version]
  10. Shabtai, Y.; Fainsod, A. Competition between ethanol clearance and retinoic acid biosynthesis in the induction of fetal alcohol syndrome. Biochem. Cell Biol. 2018, 96, 148–160. [Google Scholar] [CrossRef]
  11. Collins, M.D.; Mao, G.E. Teratology of retinoids. Annu. Rev. Pharmacol. Toxicol. 1999, 39, 399–430. [Google Scholar] [CrossRef]
  12. Mark, M.; Ghyselinck, N.B.; Chambon, P. Function of retinoid nuclear receptors: Lessons from genetic and pharmacological dissections of the retinoic acid signaling pathway during mouse embryogenesis. Annu. Rev. Pharmacol. Toxicol. 2006, 46, 451–480. [Google Scholar] [CrossRef]
  13. Fainsod, A.; Bendelac-Kapon, L.; Shabtai, Y. Fetal alcohol spectrum disorder: Embryogenesis under reduced retinoic acid signaling conditions. Subcell. Biochem. 2020, 95, 197–225. [Google Scholar] [CrossRef] [PubMed]
  14. Fainsod, A.; Kot-Leibovich, H. Xenopus embryos to study fetal alcohol syndrome, a model for environmental teratogenesis. Biochem. Cell Biol. 2018, 96, 77–87. [Google Scholar] [CrossRef] [Green Version]
  15. Shabtai, Y.; Bendelac, L.; Jubran, H.; Hirschberg, J.; Fainsod, A. Acetaldehyde inhibits retinoic acid biosynthesis to mediate alcohol teratogenicity. Sci. Rep. 2018, 8, 347. [Google Scholar] [CrossRef] [PubMed]
  16. Paganelli, A.; Gnazzo, V.; Acosta, H.; López, S.L.; Carrasco, A.E. Glyphosate-based herbicides produce teratogenic effects on vertebrates by impairing retinoic acid signaling. Chem. Res. Toxicol. 2010, 23, 1586–1595. [Google Scholar] [CrossRef]
  17. Dickinson, A.J.G.; Turner, S.D.; Wahl, S.; Kennedy, A.E.; Wyatt, B.H.; Howton, D.A. E-liquids and vanillin flavoring disrupts retinoic acid signaling and causes craniofacial defects in Xenopus embryos. Dev. Biol. 2022, 481, 14–29. [Google Scholar] [CrossRef]
  18. Niederreither, K.; McCaffery, P.; Dräger, U.C.; Chambon, P.; Dollé, P. Restricted expression and retinoic acid-induced downregulation of the retinaldehyde dehydrogenase type 2 (RALDH-2) gene during mouse development. Mech. Dev. 1997, 62, 67–78. [Google Scholar] [CrossRef]
  19. Pavez Loriè, E.; Chamcheu, J.C.; Vahlquist, A.; Törmä, H. Both all-trans retinoic acid and cytochrome P450 (CYP26) inhibitors affect the expression of vitamin A metabolizing enzymes and retinoid biomarkers in organotypic epidermis. Arch. Dermatol. Res. 2009, 301, 475–485. [Google Scholar] [CrossRef]
  20. Moss, J.B.; Xavier-Neto, J.; Shapiro, M.D.; Nayeem, S.M.; McCaffery, P.; Dräger, U.C.; Rosenthal, N. Dynamic patterns of retinoic acid synthesis and response in the developing mammalian heart. Dev. Biol. 1998, 199, 55–71. [Google Scholar] [CrossRef] [PubMed] [Green Version]
  21. Hollemann, T.; Chen, Y.; Grunz, H.; Pieler, T. Regionalized metabolic activity establishes boundaries of retinoic acid signalling. EMBO J. 1998, 17, 7361–7372. [Google Scholar] [CrossRef] [Green Version]
  22. Topletz, A.R.; Tripathy, S.; Foti, R.S.; Shimshoni, J.A.; Nelson, W.L.; Isoherranen, N. Induction of CYP26A1 by metabolites of retinoic acid: Evidence that CYP26A1 is an important enzyme in the elimination of active retinoids. Mol. Pharmacol. 2015, 87, 430–441. [Google Scholar] [CrossRef] [Green Version]
  23. Reijntjes, S.; Zile, M.H.; Maden, M. The expression of Stra6 and Rdh10 in the avian embryo and their contribution to the generation of retinoid signatures. Int. J. Dev. Biol. 2010, 54, 1267–1275. [Google Scholar] [CrossRef] [PubMed] [Green Version]
  24. Strate, I.; Min, T.H.; Iliev, D.; Pera, E.M. Retinol dehydrogenase 10 is a feedback regulator of retinoic acid signalling during axis formation and patterning of the central nervous system. Development 2009, 136, 461–472. [Google Scholar] [CrossRef] [PubMed] [Green Version]
  25. Adams, M.K.; Belyaeva, O.V.; Wu, L.; Kedishvili, N.Y. The retinaldehyde reductase activity of DHRS3 is reciprocally activated by retinol dehydrogenase 10 to control retinoid homeostasis. J. Biol. Chem. 2014, 289, 14868–14880. [Google Scholar] [CrossRef] [Green Version]
  26. Kam, R.K.T.; Chen, Y.; Chan, S.-O.; Chan, W.-Y.; Dawid, I.B.; Zhao, H. Developmental expression of Xenopus short-chain dehydrogenase/reductase 3. Int. J. Dev. Biol. 2010, 54, 1355–1360. [Google Scholar] [CrossRef] [Green Version]
  27. Parihar, M.; Bendelac-Kapon, L.; Gur, M.; Abbou, T.; Belorkar, A.; Achanta, S.; Kinberg, K.; Vadigepalli, R.; Fainsod, A. Retinoic Acid Fluctuation Activates an Uneven, Direction-Dependent Network-Wide Robustness Response in Early Embryogenesis. Front. Cell Dev. Biol. 2021, 9, 747969. [Google Scholar] [CrossRef]
  28. Eldar, A.; Shilo, B.-Z.; Barkai, N. Elucidating mechanisms underlying robustness of morphogen gradients. Curr. Opin. Genet. Dev. 2004, 14, 435–439. [Google Scholar] [CrossRef]
  29. Ohno, S.; Wolf, U.; Atkin, N.B. Evolution from fish to mammals by gene duplication. Hereditas 1968, 59, 169–187. [Google Scholar] [CrossRef] [PubMed]
  30. Ohno, S. Gene duplication and the uniqueness of vertebrate genomes circa 1970-1999. Semin. Cell Dev. Biol. 1999, 10, 517–522. [Google Scholar] [CrossRef] [PubMed]
  31. MacKintosh, C.; Ferrier, D.E.K. Recent advances in understanding the roles of whole genome duplications in evolution. [version 2; peer review: 2 approved]. F1000Research 2017, 6, 1623. [Google Scholar] [CrossRef] [Green Version]
  32. Session, A.M.; Uno, Y.; Kwon, T.; Chapman, J.A.; Toyoda, A.; Takahashi, S.; Fukui, A.; Hikosaka, A.; Suzuki, A.; Kondo, M.; et al. Genome evolution in the allotetraploid frog Xenopus laevis. Nature 2016, 538, 336–343. [Google Scholar] [CrossRef] [Green Version]
  33. Wolf, Y.I.; Koonin, E.V. Genome reduction as the dominant mode of evolution. Bioessays 2013, 35, 829–837. [Google Scholar] [CrossRef] [Green Version]
  34. Newton, M.S.; Arcus, V.L.; Gerth, M.L.; Patrick, W.M. Enzyme evolution: Innovation is easy, optimization is complicated. Curr. Opin. Struct. Biol. 2018, 48, 110–116. [Google Scholar] [CrossRef]
  35. Albalat, R.; Cañestro, C. Evolution by gene loss. Nat. Rev. Genet. 2016, 17, 379–391. [Google Scholar] [CrossRef] [PubMed]
  36. Morin, R.D.; Chang, E.; Petrescu, A.; Liao, N.; Griffith, M.; Chow, W.; Kirkpatrick, R.; Butterfield, Y.S.; Young, A.C.; Stott, J.; et al. Sequencing and analysis of 10,967 full-length cDNA clones from Xenopus laevis and Xenopus tropicalis reveals post-tetraploidization transcriptome remodeling. Genome Res. 2006, 16, 796–803. [Google Scholar] [CrossRef] [PubMed] [Green Version]
  37. Hellsten, U.; Harland, R.M.; Gilchrist, M.J.; Hendrix, D.; Jurka, J.; Kapitonov, V.; Ovcharenko, I.; Putnam, N.H.; Shu, S.; Taher, L.; et al. The genome of the Western clawed frog Xenopus tropicalis. Science 2010, 328, 633–636. [Google Scholar] [CrossRef] [PubMed] [Green Version]
  38. Sémon, M.; Wolfe, K.H. Preferential subfunctionalization of slow-evolving genes after allopolyploidization in Xenopus laevis. Proc. Natl. Acad. Sci. USA 2008, 105, 8333–8338. [Google Scholar] [CrossRef] [PubMed] [Green Version]
  39. Chain, F.J.J.; Dushoff, J.; Evans, B.J. The odds of duplicate gene persistence after polyploidization. BMC Genom. 2011, 12, 599. [Google Scholar] [CrossRef] [Green Version]
  40. Watanabe, M.; Yasuoka, Y.; Mawaribuchi, S.; Kuretani, A.; Ito, M.; Kondo, M.; Ochi, H.; Ogino, H.; Fukui, A.; Taira, M.; et al. Conservatism and variability of gene expression profiles among homeologous transcription factors in Xenopus laevis. Dev. Biol. 2017, 426, 301–324. [Google Scholar] [CrossRef]
  41. Michiue, T.; Yamamoto, T.; Yasuoka, Y.; Goto, T.; Ikeda, T.; Nagura, K.; Nakayama, T.; Taira, M.; Kinoshita, T. High variability of expression profiles of homeologous genes for Wnt, Hh, Notch, and Hippo signaling pathways in Xenopus laevis. Dev. Biol. 2017, 426, 270–290. [Google Scholar] [CrossRef] [PubMed]
  42. Suzuki, A.; Yoshida, H.; van Heeringen, S.J.; Takebayashi-Suzuki, K.; Veenstra, G.J.C.; Taira, M. Genomic organization and modulation of gene expression of the TGF-β and FGF pathways in the allotetraploid frog Xenopus laevis. Dev. Biol. 2017, 426, 336–359. [Google Scholar] [CrossRef]
  43. Nieuwkoop, P.D.; Faber, J. Normal Table of Xenopus laevis (Daudin): A Systematical and Chronological Survey of the Development from the Fertilized Egg till the End of Metamorphosis; North-Holland Publishing Company: Amsterdam, The Netherland, 1967; p. 260. [Google Scholar]
  44. Nenni, M.J.; Fisher, M.E.; James-Zorn, C.; Pells, T.J.; Ponferrada, V.; Chu, S.; Fortriede, J.D.; Burns, K.A.; Wang, Y.; Lotay, V.S.; et al. Xenbase: Facilitating the use of xenopus to model human disease. Front. Physiol. 2019, 10, 154. [Google Scholar] [CrossRef] [Green Version]
  45. Naito, Y.; Hino, K.; Bono, H.; Ui-Tei, K. CRISPRdirect: Software for designing CRISPR/Cas guide RNA with reduced off-target sites. Bioinformatics 2015, 31, 1120–1123. [Google Scholar] [CrossRef]
  46. Moreno-Mateos, M.A.; Vejnar, C.E.; Beaudoin, J.-D.; Fernandez, J.P.; Mis, E.K.; Khokha, M.K.; Giraldez, A.J. CRISPRscan: Designing highly efficient sgRNAs for CRISPR-Cas9 targeting in vivo. Nat. Methods 2015, 12, 982–988. [Google Scholar] [CrossRef] [Green Version]
  47. Naert, T.; Tulkens, D.; Edwards, N.A.; Carron, M.; Shaidani, N.-I.; Wlizla, M.; Boel, A.; Demuynck, S.; Horb, M.E.; Coucke, P.; et al. Maximizing CRISPR/Cas9 phenotype penetrance applying predictive modeling of editing outcomes in Xenopus and zebrafish embryos. Sci. Rep. 2020, 10, 14662. [Google Scholar] [CrossRef] [PubMed]
  48. Shen, M.W.; Arbab, M.; Hsu, J.Y.; Worstell, D.; Culbertson, S.J.; Krabbe, O.; Cassa, C.A.; Liu, D.R.; Gifford, D.K.; Sherwood, R.I. Predictable and precise template-free CRISPR editing of pathogenic variants. Nature 2018, 563, 646–651. [Google Scholar] [CrossRef]
  49. Hoshijima, K.; Jurynec, M.J.; Klatt Shaw, D.; Jacobi, A.M.; Behlke, M.A.; Grunwald, D.J. Highly Efficient CRISPR-Cas9-Based Methods for Generating Deletion Mutations and F0 Embryos that Lack Gene Function in Zebrafish. Dev. Cell 2019, 51, 645–657.e4. [Google Scholar] [CrossRef]
  50. Brinkman, E.K.; Chen, T.; Amendola, M.; van Steensel, B. Easy quantitative assessment of genome editing by sequence trace decomposition. Nucleic Acids Res. 2014, 42, e168. [Google Scholar] [CrossRef]
  51. Hsiau, T.; Maures, T.; Waite, K.; Yang, J.; Kelso, R.; Holden, K.; Stoner, R. Inference of CRISPR Edits from Sanger Trace Data. BioRxiv 2018. [Google Scholar] [CrossRef]
  52. Kanehisa, M.; Sato, Y.; Kawashima, M. KEGG mapping tools for uncovering hidden features in biological data. Protein Sci. 2021. [Google Scholar] [CrossRef]
  53. Yanai, I.; Peshkin, L.; Jorgensen, P.; Kirschner, M.W. Mapping gene expression in two Xenopus species: Evolutionary constraints and developmental flexibility. Dev. Cell 2011, 20, 483–496. [Google Scholar] [CrossRef] [Green Version]
  54. Savova, V.; Pearl, E.J.; Boke, E.; Nag, A.; Adzhubei, I.; Horb, M.E.; Peshkin, L. Transcriptomic insights into genetic diversity of protein-coding genes in X. laevis. Dev. Biol. 2017, 424, 181–188. [Google Scholar] [CrossRef]
  55. Shannon, S.R.; Moise, A.R.; Trainor, P.A. New insights and changing paradigms in the regulation of vitamin A metabolism in development. Wiley Interdiscip. Rev. Dev. Biol. 2017, 6. [Google Scholar] [CrossRef] [Green Version]
  56. Belyaeva, O.V.; Adams, M.K.; Wu, L.; Kedishvili, N.Y. The antagonistically bifunctional retinoid oxidoreductase complex is required for maintenance of all-trans-retinoic acid homeostasis. J. Biol. Chem. 2017, 292, 5884–5897. [Google Scholar] [CrossRef] [Green Version]
  57. Shabtai, Y.; Shukrun, N.; Fainsod, A. ADHFe1: A novel enzyme involved in retinoic acid-dependent Hox activation. Int. J. Dev. Biol. 2017, 61, 303–310. [Google Scholar] [CrossRef] [PubMed]
  58. Billings, S.E.; Pierzchalski, K.; Butler Tjaden, N.E.; Pang, X.-Y.; Trainor, P.A.; Kane, M.A.; Moise, A.R. The retinaldehyde reductase DHRS3 is essential for preventing the formation of excess retinoic acid during embryonic development. FASEB J. 2013, 27, 4877–4889. [Google Scholar] [CrossRef] [Green Version]
  59. Feng, L.; Hernandez, R.E.; Waxman, J.S.; Yelon, D.; Moens, C.B. Dhrs3a regulates retinoic acid biosynthesis through a feedback inhibition mechanism. Dev. Biol. 2010, 338, 1–14. [Google Scholar] [CrossRef] [Green Version]
  60. Porté, S.; Xavier Ruiz, F.; Giménez, J.; Molist, I.; Alvarez, S.; Domínguez, M.; Alvarez, R.; de Lera, A.R.; Parés, X.; Farrés, J. Aldo-keto reductases in retinoid metabolism: Search for substrate specificity and inhibitor selectivity. Chem. Biol. Interact. 2013, 202, 186–194. [Google Scholar] [CrossRef] [PubMed]
  61. Cui, J.; Michaille, J.-J.; Jiang, W.; Zile, M.H. Retinoid receptors and vitamin A deficiency: Differential patterns of transcription during early avian development and the rapid induction of RARs by retinoic acid. Dev. Biol. 2003, 260, 496–511. [Google Scholar] [CrossRef]
  62. Lohnes, D.; Mark, M.; Mendelsohn, C.; Dollé, P.; Decimo, D.; LeMeur, M.; Dierich, A.; Gorry, P.; Chambon, P. Developmental roles of the retinoic acid receptors. J. Steroid Biochem. Mol. Biol. 1995, 53, 475–486. [Google Scholar] [CrossRef]
  63. Janesick, A.; Wu, S.C.; Blumberg, B. Retinoic acid signaling and neuronal differentiation. Cell. Mol. Life Sci. 2015, 72, 1559–1576. [Google Scholar] [CrossRef] [Green Version]
  64. De Bosscher, K.; Desmet, S.J.; Clarisse, D.; Estébanez-Perpiña, E.; Brunsveld, L. Nuclear receptor crosstalk-defining the mechanisms for therapeutic innovation. Nat. Rev. Endocrinol. 2020, 16, 363–377. [Google Scholar] [CrossRef]
  65. Evans, R.M.; Mangelsdorf, D.J. Nuclear receptors, RXR, and the big bang. Cell 2014, 157, 255–266. [Google Scholar] [CrossRef] [Green Version]
  66. Niederreither, K.; Subbarayan, V.; Dollé, P.; Chambon, P. Embryonic retinoic acid synthesis is essential for early mouse post-implantation development. Nat. Genet. 1999, 21, 444–448. [Google Scholar] [CrossRef] [PubMed]
  67. Begemann, G.; Schilling, T.F.; Rauch, G.J.; Geisler, R.; Ingham, P.W. The zebrafish neckless mutation reveals a requirement for raldh2 in mesodermal signals that pattern the hindbrain. Development 2001, 128, 3081–3094. [Google Scholar] [CrossRef]
  68. Grandel, H.; Lun, K.; Rauch, G.-J.; Rhinn, M.; Piotrowski, T.; Houart, C.; Sordino, P.; Küchler, A.M.; Schulte-Merker, S.; Geisler, R.; et al. Retinoic acid signalling in the zebrafish embryo is necessary during pre-segmentation stages to pattern the anterior-posterior axis of the CNS and to induce a pectoral fin bud. Development 2002, 129, 2851–2865. [Google Scholar] [CrossRef] [PubMed]
  69. Chen, Y.; Pollet, N.; Niehrs, C.; Pieler, T. Increased XRALDH2 activity has a posteriorizing effect on the central nervous system of Xenopus embryos. Mech. Dev. 2001, 101, 91–103. [Google Scholar] [CrossRef]
  70. Durston, A.J.; Timmermans, J.P.; Hage, W.J.; Hendriks, H.F.; de Vries, N.J.; Heideveld, M.; Nieuwkoop, P.D. Retinoic acid causes an anteroposterior transformation in the developing central nervous system. Nature 1989, 340, 140–144. [Google Scholar] [CrossRef] [PubMed]
  71. Schuh, T.J.; Hall, B.L.; Kraft, J.C.; Privalsky, M.L.; Kimelman, D. v-erbA and citral reduce the teratogenic effects of all-trans retinoic acid and retinol, respectively, in Xenopus embryogenesis. Development 1993, 119, 785–798. [Google Scholar] [CrossRef] [PubMed]
  72. Chen, Y.; Huang, L.; Solursh, M. A concentration gradient of retinoids in the early Xenopus laevis embryo. Dev. Biol. 1994, 161, 70–76. [Google Scholar] [CrossRef]
  73. Kraft, J.C.; Schuh, T.; Juchau, M.; Kimelman, D. The retinoid X receptor ligand, 9-cis-retinoic acid, is a potential regulator of early Xenopus development. Proc. Natl. Acad. Sci. USA 1994, 91, 3067–3071. [Google Scholar] [CrossRef] [Green Version]
  74. Creech Kraft, J.; Schuh, T.; Juchau, M.R.; Kimelman, D. Temporal distribution, localization and metabolism of all-trans-retinol, didehydroretinol and all-trans-retinal during Xenopus development. Biochem. J. 1994, 301 Pt 1, 111–119. [Google Scholar] [CrossRef] [Green Version]
  75. Creech Kraft, J.; Kimelman, D.; Juchau, M.R. Xenopus laevis: A model system for the study of embryonic retinoid metabolism. II. Embryonic metabolism of all-trans-3,4-didehydroretinol to all-trans-3,4-didehydroretinoic acid. Drug Metab. Dispos. 1995, 23, 83–89. [Google Scholar] [PubMed]
  76. Kraft, J.C.; Kimelman, D.; Juchau, M.R. Xenopus laevis: A model system for the study of embryonic retinoid metabolism. I. Embryonic metabolism of 9-cis- and all-trans-retinals and retinols to their corresponding acid forms. Drug Metab. Dispos. 1995, 23, 72–82. [Google Scholar]
  77. Dobbs-McAuliffe, B.; Zhao, Q.; Linney, E. Feedback mechanisms regulate retinoic acid production and degradation in the zebrafish embryo. Mech. Dev. 2004, 121, 339–350. [Google Scholar] [CrossRef]
  78. Sive, H.L.; Draper, B.W.; Harland, R.M.; Weintraub, H. Identification of a retinoic acid-sensitive period during primary axis formation in Xenopus laevis. Genes Dev. 1990, 4, 932–942. [Google Scholar] [CrossRef] [Green Version]
  79. Kessel, M.; Gruss, P. Homeotic transformations of murine vertebrae and concomitant alteration of Hox codes induced by retinoic acid. Cell 1991, 67, 89–104. [Google Scholar] [CrossRef] [Green Version]
  80. Papalopulu, N.; Clarke, J.D.; Bradley, L.; Wilkinson, D.; Krumlauf, R.; Holder, N. Retinoic acid causes abnormal development and segmental patterning of the anterior hindbrain in Xenopus embryos. Development 1991, 113, 1145–1158. [Google Scholar] [CrossRef]
  81. Corcoran, J.; So, P.L.; Maden, M. Absence of retinoids can induce motoneuron disease in the adult rat and a retinoid defect is present in motoneuron disease patients. J. Cell Sci. 2002, 115, 4735–4741. [Google Scholar] [CrossRef] [Green Version]
  82. Adams, M.K.; Lee, S.-A.; Belyaeva, O.V.; Wu, L.; Kedishvili, N.Y. Characterization of human short chain dehydrogenase/reductase SDR16C family members related to retinol dehydrogenase 10. Chem. Biol. Interact. 2017, 276, 88–94. [Google Scholar] [CrossRef] [PubMed]
  83. Belyaeva, O.V.; Lee, S.-A.; Adams, M.K.; Chang, C.; Kedishvili, N.Y. Short chain dehydrogenase/reductase rdhe2 is a novel retinol dehydrogenase essential for frog embryonic development. J. Biol. Chem. 2012, 287, 9061–9071. [Google Scholar] [CrossRef] [PubMed] [Green Version]
  84. Belyaeva, O.V.; Kedishvili, N.Y. Human pancreas protein 2 (PAN2) has a retinal reductase activity and is ubiquitously expressed in human tissues. FEBS Lett. 2002, 531, 489–493. [Google Scholar] [CrossRef] [Green Version]
  85. Kam, R.K.T.; Shi, W.; Chan, S.O.; Chen, Y.; Xu, G.; Lau, C.B.-S.; Fung, K.P.; Chan, W.Y.; Zhao, H. Dhrs3 protein attenuates retinoic acid signaling and is required for early embryonic patterning. J. Biol. Chem. 2013, 288, 31477–31487. [Google Scholar] [CrossRef] [PubMed] [Green Version]
Figure 1. Evolutionary conservation of the RA metabolic and gene-regulatory network genes in Xenopus laevis. Composition of the RA metabolic and gene-regulatory network in the Xenopus laevis genome based on KEGG and Xenbase database analysis and literature searches [44,52]. Expression of the RA network components during gastrula stages was summarized from our own and published transcriptomic datasets. The relative expression shown (blue shades) during gastrula stages is based on Session et al. [32]. Dark blue, ≥10 TPM; middle blue, 0.5–10 TPM; light blue, ≤0.5 TPM; white, no data in the transcriptomic dataset. The homoeolog/singleton status of each gene is marked (L and/or S). The relative expression levels between homoeologs are summarized: =, similar expression levels; <, 3–6 fold difference; <<, more than 6 fold difference. Asterisks indicate whether temporal expression patterns of the homoeologs are similar (no asterisk), partially divergent (*), or highly divergent (**).
Cells 11 00327 g001
Figure 2. Homoeolog and singleton status of genes involved in vitamin D metabolism and signaling. KEGG analysis of the vitamin D metabolic and signaling network identified 21 genes in the X. laevis genome. The homoeolog/singleton status of each gene is marked (L and/or S). In the metabolic part of the pathway leading to cholesterol production (above the red dotted line), the pathway runs in parallel from lanosterol and dehydrolanosterol. The relative expression levels between homoeologs are summarized: =, similar expression levels; <, 3–6 fold difference; <<, more than 6 fold difference. Asterisks indicate whether temporal expression patterns of the homoeologs are similar (no asterisk), partially divergent (*), or highly divergent (**).
Cells 11 00327 g002
Figure 3. Genomic rearrangements involving RA network genes. Schematic examples of the types of genomic deletions and rearrangements observed in the deletion of homoeologs. The gene conserved, i.e., singleton, is marked in green. The flanking genes selected to determine the interval that was deleted are marked in red. Additional genes or putative coding sequences within the regions are marked in gray. (A) Generation of the sdr16c5.L singleton apparently involved the deletion of a small genomic region on chromosome 6S. (B) The deletion to create the rdh16.L singleton involved deleting about 100 Kb on chromosome 2S including multiple genes. (C) The genomic reorganization and deletion on chromosome 1 created the adh7.S singleton on chromosome 1S and singletons for adh1.L, adh4.L, and adh5.L on chromosome 1L.
Cells 11 00327 g003
Figure 4. Comparative temporal expression pattern of homoeologs and singletons. Embryos were collected at different developmental stages from blastula to mid-neurula. The temporal expression pattern of each gene was determined by qPCR. (A) Expression of the rdh10.L, rdh10.S, and sdr16c5.L genes (Producers 1). (B) Temporal expression pattern of dhrs3.L, dhrs3.S, and rdh14.L (Suppressors). (C) Expression pattern of aldh1a2.L, aldh1a2.S, aldh1a3.L, and aldh1a3.S (Producers 2).
Cells 11 00327 g004
Figure 5. Responsiveness of homoeologs and singletons to RA manipulations. Embryos were treated from late blastula with 10 or 25 nM RA. Samples were collected at early gastrula (st. 10.25) and analyzed by qPCR for the RA responsiveness of individual homoeologs and singletons using the primers listed in Table 1. Expression changes were normalized to transcript levels in control embryos.
Cells 11 00327 g005
Figure 6. Recovery of RA metabolic gene expression following transient RA manipulation. (A) Embryos were subjected to a two-hour (T-2–T0) RA treatment (10 or 25 nM) from late blastula (st. 9) to early gastrula (st. 10.25). At T0 the treatment was terminated (washed; green arrowhead) and the embryos were further incubated. Samples were collected at different times (red and black arrowheads) for expression analysis. (B,C) Kinetic analysis of rdh10.L, rdh10.S, and sdr16c5 expression changes. (D,E) qPCR analysis of the expression of dhrs3.L, dhrs3.S, and rdh14. (F,G) Analysis of the aldh1a2.L, aldh1a2.S, aldh1a3.L, and aldh1a3.S expression.
Cells 11 00327 g006
Figure 7. Gene expression changes in RA responsive genes as a result of homoeolog knockdown. RA network component gene specific knockdowns were induced by targeting genes with CRISPR/Cas9. The rdh10.L, rdh10.S, and sdr16c5 (A,C,E,G,I), and dhrs3.L and dhrs3.S (B,D,F,H,J) genes were targeted with specific sgRNAs. CRISPant embryos were treated with RA (10 nM) and sibling embryos were treated with RA only as controls. (A,B) Gene expression change analysis at T0 normalized to control expression. (CJ) Kinetic analysis of gene expression changes in CRISPant embryos normalized to RA-induced changes at each time point. Genes analyzed: (C,D) cyp26a1.L, (E,F) hoxd1.L/S, (G,H) hoxa1.L, (I,J) hoxa2.L/S.
Cells 11 00327 g007
Figure 8. Regulation tightness score of the RA-responsive genes in CRISPant embryos. To calculate the regulation tightness score (∑∆), the sum of the expression fold change was calculated for the RA-responsive genes: cyp26a1.L, hoxd1.L/S, hoxa1.L, hoxa1.S, hoxa2.L/S, hoxb4.S, hoxb1.L, and hoxb1.S. (A) Analysis in rdh10.L, rdh10.S, and sdr16c5 RA-treated CRISPants. (B) Analysis in dhrs3.L and dhrs3.S RA-treated CRISPants. *, p < 0.05; ns, not significant.
Cells 11 00327 g008
Table 1. Sequences for qPCR and genomic DNA amplification primers and sgRNAs.
GeneForward PrimerReverse Primer
qPCR Analysis
cyp26a1.LTCGAGGTTCGGCTTCATCCGGCACAATTCCACAACA
hoxb1.LTTGCCCCAGTGCCAATGACTCCCCCTCCAACAACAAACC
hoxb1.SCCAACTTCACGACCAAACAAGTGGCTGCGATCTCTACTCTC
hoxd1.L/STTCTTGCGGGGATGTTTTCCGACTGGCATAAAGGAATG
hoxa1.LCCGCTCACTATATCCACCATTCTGGCAGGAGAACGACAAAC
hoxa1.SAATTATGAGATGATGGAATGGTAAATGACTGTAAACACCTAGTAAATGAGAG
hoxb4.SCCAAGGATCTGTGCGTCAAGCAGGATGGAGGCGAACT
hoxa2.L/SGGAGATTGCAGCCCTGTTGGGTTTGCCTCTTGTGTTTC
sdr16c5.LTTTGTGGTTCCTTCCCTCTCGTGCCATCAGTCTCCCTATACC
rdh14.LTGCCCGTACACAAAGACAGAGAGACCAAGGAGGTGGTGAG
dhrs3.LCAGGCGCAAGAAATCCTAAGCAAAGGCCACGTTCAAGGAT
dhrs3.STGCAGATGGTATTGTCCCTTCTCCTTAGCGAGGTGTCGG
rdh10.LCGTCTCTTTGCCCTGGAGTTTCACCATCTCCGCCGTCTC
rdh10.STTGCTTGGCCTGTAGAAGAGATGCATGGCGAAATAGGAGTAG
slc35b1.LCGCATTTCCAAACAGGCTCCCAAGAAGTCCCAGAGCTCGC
Genomic Nested PCR
Outer Genomic PCR
dhrs3.LTGACTGTAAGAATAGCCGCGTAGCGGGCAGACAAGACAAAT
dhrs3.SACCGCTATAGAACCACAGTCGGAAACACTTCATTCCTTTTAGTGGA
rdh10.LTAAGTTGGCAGCGGTTTGGGGAGAGACCCCACATAACTCAGC
rdh10.STCCAGAGCGAAAATCTGACGATCCCATGGTCATGAAACTCCTCAG
sdr16c5ACTGTCTTCATAGTCGAGCCCTGGTCCGAATAGAAAATCTGGG
rdh14CACACCAAACATGGCGACTTTGAAGGGCGTTGACTGTGAC
Inner Genomic PCR
sdr16c5GTTCCACCTTTCTGTCAATGCTCAGCATTTGTCCTCAGCGTTTT
rdh14GAGTAACAGCGTCAGAGCCGTGAAGGGCGTTGACTGTGAC
dhrs3.LGAGTCTCAGCACAGGGCAAATCAAAGGGTGACAGGGAACG
dhrs3.SCACAGTCGTTGGCTTGAGTGCCTTTCACTTTTTGCAGGATTCA
rdh10.LCGCACGGAACTTACTGTCCATTGGACCCTGGAGCTGTACT
rdh10.STCCAGAGCGAAAATCTGACGAGAGTGGCAGTAGAGTGAAGTCAG
sgRNA (crRNA)
sdr16c5AAACAAAGAGACCTGTAGAC
rdh14GTCTGTCCGGCGATTCTGTC
dhrs3.LCTTATTGGGCATCAGCAAGT
dhrs3.SGTCCTAGTGTGTTAATGTGT
rdh10.LGCGCAGCAGCCACTTGCCCG
rdh10.SAGGCGGAGGACTCTGCGCGG
Table 2. Singleton distribution in Xenopus laevis metabolic and signaling pathways.
PathwayTotal GenesSingletons% Singletons
High Singleton
Vitamin D from 7-dehydrocholesterol 19666.7%
RA up to RAL 1282175%
Folic acid metabolism 1271970.4%
DNA repair574578.9%
Average Genome Singletons
De novo Purine biosynthesis 115746.7%
Thyroid hormone synthesis 1522344.2%
Protein-coding 2>13,781>600843.6%
RA signaling metabolism and signaling472246.8%
Vitamin D incl. 7-dehydrocholesterol 121838.1%
Suppressed Singletons
Glycolysis/Gluconeogenesis/Krebs cycle 144920.5%
Notch 348816.7%
MicroRNAs 21802413.3%
Transcription Factors 42182812.8%
Wnt 31081312%
Hippo 348510.4%
BMP/TGFβ 51261310.3%
RA from RAL 11915.2%
FGF 56035%
cis-regulatory elements (non-coding) 255091.6%
Hh 31800%
HSPG 31600%
TLE 3400%
1 Data from KEGG, this work; 2 Session et al., 2016; 3 Michiue et al., 2017; 4 Watanabe et al., 2017; 5 Suzuki et al., 2017.
Table 3. Genomic changes in the generation of RA network singletons.
NameL/S 1Transcribed Region Length (bp)Flanking Genes 2Genes in the L
Genomic Region
Genes in the S
Genomic Region
Genomic Length (bp) 3Length Difference (Kb)Deletion Type
LS
Producers 1
sdr16c56L18,952plag1-penkchchd7, sdr16c5-89,21479,699.5Restricted
adh7
adh4
adh1b
1S
1L
1L
9948
13,797
18,159
dapp1-metap1LOC108710849, MGC83376, adh1b, adh4, adh1-a, LOC108719623, adh5LOC398377, LOC108706741, adh1a, adh7277,881196,62781.3Complex
rdh162L11,580rdh7.2-gpr182rdh16, XB5807236, rdh7, LOC108708580, rdh9, hsd17b6, LOC10870858-116,91114,959102.0Large
dhrs99_10L9073stk39-klhl41dhrs9, LOC108701361, nostrin, LOC108701845, XB5957220, lrp2, LOC108701363, LOC108701365, LOC108701364, bbs5LOC108702983, abcb11.2, LOC108702985, LOC108702267521,928283,492238.4Complex
Suppressors
adhFe16S19,503rrs1-mybl1LOC108718816, vxnLOC121395160, adhFe163.463.30.1Restricted
rdh135L10,266slc30a6-sos1rdh13-42,225587836.3Restricted
rdh145L4946kcns3-
osr1
LOC121393845, LOC108717194, LOC121393566, rdh14-609,595488,124121.5Large
Producers 3
bco14L20,949gan-
cenpn
bco1, LOC108714031, LOC108714032, gcsh, LOC108714033, LOC108714034, LOC108714035, cdk10, LOC121403143, LOC121403144, LOC108714036, LOC108714037, atminLOC108708941, LOC108715382, LOC108715380, LOC108705941306,957114,993192.0Large
bco2
bco2l
2L
2L
14,883
38,972
urpta-1-zbtb16sfxn4, bco2, bco2l, LOC121395554, LOC108697004, nnmt, LOC108695837, LOC108696501, LOC108697006, LOC108696502, LOC121395555, LOC108696503, LOC108697007, LOC121395556, LOC108696506LOC108697615611,546200,702410.8Large
1 Chromosomal location. 2 Flanking genes represent the conserved genes at the ends modified genomic region. 3 Distance between the conserved flanking genes.
Table 4. Regulation tightness score for the RA network homoeologs and singletons.
Gene∑∆ Score 1
10 nM RA 25 nM RA
Suppressors
dhrs3.L 28.129.4
dhrs3.S 15.516.4
rdh14.L 5.25.1
Producers 1
rdh10.L 4.95.2
rdh10.S 4.84.6
sdr16c55.85.3
Producers 2
aldh1a2.L 4.34.4
aldh1a2.S 4.95.2
aldh1a3.L 10.06.4
aldh1a3.S 7.85.5
1 Regulation tightness score.
Publisher’s Note: MDPI stays neutral with regard to jurisdictional claims in published maps and institutional affiliations.

