
Effects of Nitisinone on Oxidative and Inflammatory Markers in Alkaptonuria: Results from SONIA1 and SONIA2 Studies

 ,
,  ,
,  , , , , ,
Abstract
1. Introduction
2. Materials and Methods
2.1. Samples
2.2. Measurements
2.3. Western Blot of Protein Carbonyls
2.4. Patients’ Data
- Knee injury and Osteoarthritis Outcome Score (KOOS)
- Health Assessment Questionnaire (HAQ)
- Short Form-36 (SF-36)
2.5. Statistical Analysis
3. Results
3.1. SONIA1
3.2. SONIA2
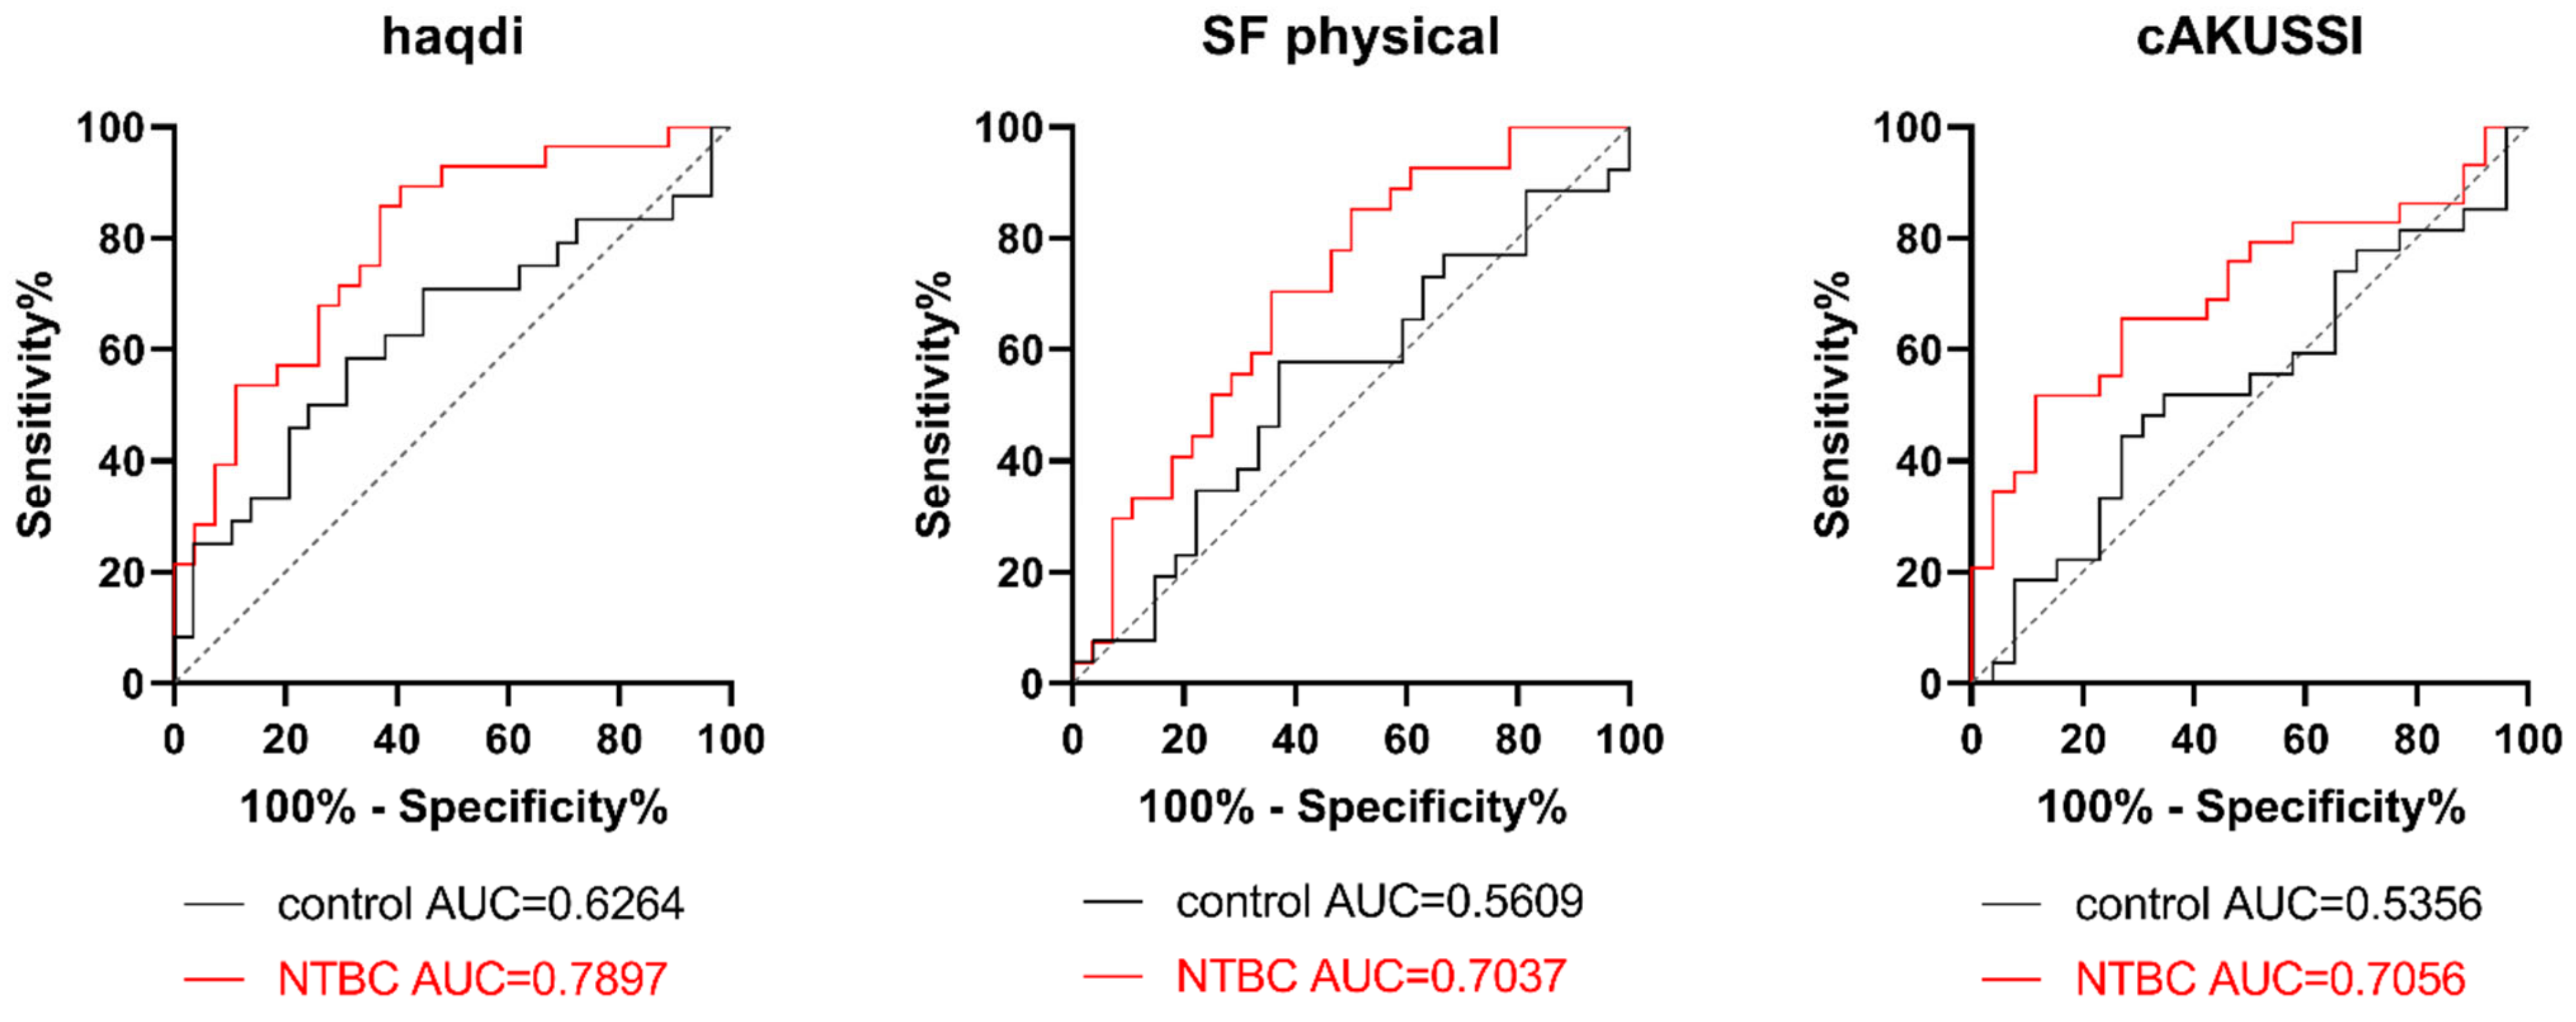
3.3. Correlation analysis in SONIA2
- i.
- A positive correlation with the disability index of HAQ (haqdi), which describes the difficulty in performing some daily life activities; the higher the haqdi, the higher the difficulty.
- ii.
- Negative correlations with the physical component of SF-36 (a lower score indicates higher disability), as well as activities of daily living, sport, and quality of life scores from the KOOS questionnaire (the lower the scores, the higher the knee-related problems).
- iii.
- A positive correlation with the eye pigment score from cAKUSSI (the higher the score, the more abundant the ochronotic pigment).
4. Discussion
5. Conclusions
Supplementary Materials
Author Contributions
Funding
Institutional Review Board Statement
Informed Consent Statement
Data Availability Statement
Acknowledgments
Conflicts of Interest
References
- Phornphutkul, C.; Introne, W.J.; Perry, M.B.; Bernardini, I.; Murphey, M.D.; Fitzpatrick, D.L.; Anderson, P.D.; Huizing, M.; Anikster, Y.; Gerber, L.H.; et al. Natural history of alkaptonuria. N. Engl. J. Med. 2002, 347, 2111–2121. [Google Scholar] [CrossRef] [PubMed]
- Ranganath, L.R.; Milan, A.M.; Hughes, A.T.; Dutton, J.J.; Fitzgerald, R.; Briggs, M.C.; Bygott, H.; Psarelli, E.E.; Cox, T.F.; Gallagher, J.A.; et al. Suitability of nitisinone In alkaptonuria 1 (SONIA 1): An international, multicentre, randomised, open-label, no-treatment controlled, parallel-group, dose-response study to investigate the effect of once daily nitisinone on 24-h urinary homogentisic acid. Ann. Rheum. Dis. 2016, 75, 362–367. [Google Scholar] [CrossRef] [PubMed]
- Ranganath, L.R.; Psarelli, E.E.; Arnoux, J.B.; Braconi, D.; Briggs, M.; Bröijersén, A.; Loftus, N.; Bygott, H.; Cox, T.F.; Davison, A.S.; et al. Efficacy and safety of once-daily nitisinone for patients with alkaptonuria (SONIA 2): An international, multicentre, open-label, randomised controlled trial. Lancet Diabetes Endocrinol. 2020, 8, 762–772. [Google Scholar] [CrossRef]
- Schmidt, L.; Sehic, O.; Wild, C. EU FP7 research funding for an orphan drug (Orfadin®) and vaccine (Hep C) development: A success and a failure? J. Pharm. Policy Pract. 2021, 14, 37. [Google Scholar] [CrossRef] [PubMed]
- Ranganath, L. Alkaptonuria: Current Perspectives. Appl. Clin. Genet. 2020, 13, 37–47. [Google Scholar] [CrossRef]
- Witko-Sarsat, V.; Friedlander, M.; Capeillère-Blandin, C.; Nguyen-Khoa, T.; Nguyen, A.T.; Zingraff, J.; Jungers, P.; Descamps-Latscha, B. Advanced oxidation protein products as a novel marker of oxidative stress in uremia. Kidney Int. 1996, 49, 1304–1313. [Google Scholar] [CrossRef] [PubMed]
- Braconi, D.; Giustarini, D.; Marzocchi, B.; Peruzzi, L.; Margollicci, M.; Rossi, R.; Bernardini, G.; Millucci, L.; Gallagher, J.A.; Le Quan Sang, K.H.; et al. Inflammatory and oxidative stress biomarkers in alkaptonuria: Data from the DevelopAKUre project. Osteoarthr. Cartil. 2018, 26, 1078–1086. [Google Scholar] [CrossRef]
- Dalle-Donne, I.; Rossi, R.; Giustarini, D.; Milzani, A.; Colombo, R. Protein carbonyl groups as biomarkers of oxidative stress. Clin. Chim. Acta 2003, 329, 23–38. [Google Scholar] [CrossRef]
- Cox, T.F.; Ranganath, L. A quantitative assessment of alkaptonuria: Testing the reliability of two disease severity scoring systems. J. Inherit. Metab. Dis. 2011, 34, 1153–1162. [Google Scholar] [CrossRef]
- Plotly Technologies Inc. Collaborative Data Science; Plotly Technologies Inc: Montréal, QC, Canada, 2015. Available online: https://plot.ly (accessed on 1 November 2022).
- Lachmann, H.J.; Goodman, H.J.B.; Gilbertson, J.A.; Gallimore, J.R.; Sabin, C.A.; Gillmore, J.D.; Hawkins, P.N. Natural History and Outcome in Systemic AA Amyloidosis. N. Engl. J. Med. 2007, 356, 2361–2371. [Google Scholar] [CrossRef]
- Colombo, G.; Clerici, M.; Altomare, A.; Rusconi, F.; Giustarini, D.; Portinaro, N.; Garavaglia, M.L.; Rossi, R.; Dalle-Donne, I.; Milzani, A. Thiol oxidation and di-tyrosine formation in human plasma proteins induced by inflammatory concentrations of hypochlorous acid. J. Proteom. 2017, 152, 22–32. [Google Scholar] [CrossRef]
- Mitri, E.; Millucci, L.; Merolle, L.; Bernardini, G.; Vaccari, L.; Gianoncelli, A.; Santucci, A. A new light on Alkaptonuria: A Fourier-transform infrared microscopy (FTIRM) and low energy X-ray fluorescence (LEXRF) microscopy correlative study on a rare disease. Biochim. Biophys. Acta Gen. Subj. 2017, 1861, 1000–1008. [Google Scholar] [CrossRef] [PubMed]
- Gambassi, S.; Geminiani, M.; Thorpe, S.D.; Bernardini, G.; Millucci, L.; Braconi, D.; Orlandini, M.; Thompson, C.L.; Petricci, E.; Manetti, F.; et al. Smoothened-antagonists reverse homogentisic acid-induced alterations of Hedgehog signaling and primary cilium length in alkaptonuria. J. Cell. Physiol. 2017, 232, 3103–3111. [Google Scholar] [CrossRef] [PubMed]
- Thorpe, S.D.; Gambassi, S.; Thompson, C.L.; Chandrakumar, C.; Santucci, A.; Knight, M.M. Reduced primary cilia length and altered Arl13b expression are associated with deregulated chondrocyte Hedgehog signaling in alkaptonuria. J. Cell. Physiol. 2017, 232, 2407–2417. [Google Scholar] [CrossRef] [PubMed]
- Bernardini, G.; Leone, G.; Millucci, L.; Consumi, M.; Braconi, D.; Spiga, O.; Galderisi, S.; Marzocchi, B.; Viti, C.; Giorgetti, G.; et al. Homogentisic acid induces morphological and mechanical aberration of ochronotic cartilage in alkaptonuria. J. Cell. Physiol. 2019, 234, 6696–6708. [Google Scholar] [CrossRef]
- Gallagher, J.A.; Ranganath, L.R.; Boyde, A. Lessons from rare diseases of cartilage and bone. Curr. Opin. Pharmacol. 2015, 22, 107–114. [Google Scholar] [CrossRef]
- Gallagher, J.A.; Dillon, J.P.; Sireau, N.; Timmis, O.; Ranganath, L.R. Alkaptonuria: An example of a “fundamental disease”-A rare disease with important lessons for more common disorders. Semin. Cell Dev. Biol. 2016, 52, 53–57. [Google Scholar] [CrossRef]
- Millucci, L.; Braconi, D.; Bernardini, G.; Lupetti, P.; Rovensky, J.; Ranganath, L.; Santucci, A. Amyloidosis in alkaptonuria. J. Inherit. Metab. Dis. 2015, 38, 797–805. [Google Scholar] [CrossRef]
- Braconi, D.; Bernardini, G.; Paffetti, A.; Millucci, L.; Geminiani, M.; Laschi, M.; Frediani, B.; Marzocchi, B.; Santucci, A. Comparative proteomics in alkaptonuria provides insights into inflammation and oxidative stress. Int. J. Biochem. Cell Biol. 2016, 81, 271–280. [Google Scholar] [CrossRef]
- Millucci, L.; Ghezzi, L.; Paccagnini, E.; Giorgetti, G.; Viti, C.; Braconi, D.; Laschi, M.; Geminiani, M.; Soldani, P.; Lupetti, P.; et al. Amyloidosis, inflammation, and oxidative stress in the heart of an alkaptonuric patient. Mediat. Inflamm. 2014, 2014, 258471. [Google Scholar] [CrossRef]
- Millucci, L.; Spreafico, A.; Tinti, L.; Braconi, D.; Ghezzi, L.; Paccagnini, E.; Bernardini, G.; Amato, L.; Laschi, M.; Selvi, E.; et al. Alkaptonuria is a novel human secondary amyloidogenic disease. Biochim. Biophys. Acta Mol. Basis Dis. 2012, 1822, 1682–1691. [Google Scholar] [CrossRef] [PubMed]
- Spreafico, A.; Millucci, L.; Ghezzi, L.; Geminiani, M.; Braconi, D.; Amato, L.; Chellini, F.; Frediani, B.; Moretti, E.; Collodel, G.; et al. Antioxidants inhibit SAA formation and pro-inflammatory cytokine release in a human cell model of alkaptonuria. Rheumatology 2013, 52, 1667–1673. [Google Scholar] [CrossRef]
- Braconi, D.; Millucci, L.; Bernardini, G.; Santucci, A. Oxidative stress and mechanisms of ochronosis in alkaptonuria. Free Radic. Biol. Med. 2015, 88, 70–80. [Google Scholar] [CrossRef] [PubMed]
- Shen, C.; Sun, X.G.; Liu, N.; Mu, Y.; Hong, C.C.; Wei, W.; Zheng, F. Increased serum amyloid A and its association with autoantibodies, acute phase reactants and disease activity in patients with rheumatoid arthritis. Mol. Med. Rep. 2015, 11, 1528–1534. [Google Scholar] [CrossRef] [PubMed]
- Connolly, M.; Veale, D.J.; Fearon, U. Acute serum amyloid A regulates cytoskeletal rearrangement, cell matrix interactions and promotes cell migration in rheumatoid arthritis. Ann. Rheum. Dis. 2011, 70, 1296–1303. [Google Scholar] [CrossRef] [PubMed]
- Vallon, R.; Freuler, F.; Desta-Tsedu, N.; Robeva, A.; Dawson, J.; Wenner, P.; Engelhardt, P.; Boes, L.; Schnyder, J.; Tschopp, C.; et al. Serum Amyloid A (apoSAA) Expression Is Up-Regulated in Rheumatoid Arthritis and Induces Transcription of Matrix Metalloproteinases. J. Immunol. 2001, 166, 2801–2807. [Google Scholar] [CrossRef] [PubMed]
- De Seny, D.; Cobraiville, G.; Charlier, E.; Neuville, S.; Esser, N.; Malaise, D.; Malaise, O.; Calvo, F.Q.; Relic, B.; Malaise, M.G. Acute-Phase Serum Amyloid A in Osteoarthritis: Regulatory Mechanism and Proinflammatory Properties. PLoS ONE 2013, 8, e66769. [Google Scholar] [CrossRef]
- Millucci, L.; Bernardini, G.; Spreafico, A.; Orlandini, M.; Braconi, D.; Laschi, M.; Geminiani, M.; Lupetti, P.; Giorgetti, G.; Viti, C.; et al. Histological and Ultrastructural Characterization of Alkaptonuric Tissues. Calcif. Tissue Int. 2017, 101, 50–64. [Google Scholar] [CrossRef]
- Olsson, B.; Ranganath, L.; Arnoux, J.; Imrich, R.; Milan, A.; Rudebeck, M. Effects of a protein-restricted diet on body weight and serum tyrosine concentrations in patients with alkaptonuria. JIMD Rep. 2021, 63, 41–49. [Google Scholar] [CrossRef]
- Yang, R.Z.; Lee, M.J.; Hu, H.; Pollin, T.I.; Ryan, A.S.; Nicklas, B.J.; Snitker, S.; Horenstein, R.B.; Hull, K.; Goldberg, N.H.; et al. Acute-phase serum amyloid A: An inflammatory adipokine and potential link between obesity and its metabolic complications. PLoS Med. 2006, 3, 0884–0894. [Google Scholar] [CrossRef]
- Zhao, Y.; He, X.; Shi, X.; Huang, C.; Liu, J.; Zhou, S.; Heng, C.K. Association between serum amyloid A and obesity: A meta-analysis and systematic review. Inflamm. Res. 2010, 59, 323–334. [Google Scholar] [CrossRef] [PubMed]
- Gómez-Ambrosi, J.; Azcona, C.; Patiño-García, A.; Frühbeck, G. Serum Amyloid A Concentration is Increased in Obese Children and Adolescents. J. Pediatr. 2008, 153, 71–75. [Google Scholar] [CrossRef] [PubMed]
- Poitou, C.; Coussieu, C.; Rouault, C.; Coupaye, M.; Cancello, R.; Bedel, J.F.; Gouillon, M.; Bouillot, J.L.; Oppert, J.M.; Basdevant, A.; et al. Serum amyloid A: A marker of adiposity-induced low-grade inflammation but not of metabolic status. Obesity 2006, 14, 309–318. [Google Scholar] [CrossRef] [PubMed]
- Reddy, P.; Lent-Schochet, D.; Ramakrishnan, N.; McLaughlin, M.; Jialal, I. Metabolic syndrome is an inflammatory disorder: A conspiracy between adipose tissue and phagocytes. Clin. Chim. Acta 2019, 496, 35–44. [Google Scholar] [CrossRef] [PubMed]
- Han, C.Y.; Tang, C.; Guevara, M.E.; Wei, H.; Wietecha, T.; Shao, B.; Subramanian, S.; Omer, M.; Wang, S.; O’Brien, K.D.; et al. Serum amyloid A impairs the antiinflammatory properties of HDL. J. Clin. Investig. 2016, 126, 266–281. [Google Scholar] [CrossRef] [PubMed]
- Rosso, L.G.; Lhomme, M.; Meroño, T.; Sorroche, P.; Catoggio, L.; Soriano, E.; Saucedo, C.; Malah, V.; Dauteuille, C.; Boero, L.; et al. Altered lipidome and antioxidative activity of small, dense HDL in normolipidemic rheumatoid arthritis: Relevance of inflammation. Atherosclerosis 2014, 237, 652–660. [Google Scholar] [CrossRef] [PubMed]
- Da Fonseca, L.J.S.; Nunes-Souza, V.; Goulart, M.O.F.; Rabelo, L.A. Oxidative Stress in Rheumatoid Arthritis: What the Future Might Hold regarding Novel Biomarkers and Add-On Therapies. Oxid. Med. Cell. Longev. 2019, 2019, 7536805. [Google Scholar] [CrossRef]
- Uslu, A.U.; Aydin, B.; Icagasıoğlu, I.S.; Balta, S.; Deveci, K.; Alkan, F.; Yıldız, G.; Sahin, A. The Relationship Among the Level of Serum Amyloid A, High-Density Lipoprotein and Microalbuminuria in Patients With Familial Mediterranean Fever. J. Clin. Lab. Anal. 2016, 30, 1003–1008. [Google Scholar] [CrossRef]
- Malaviya, A.N.; Sharma, A.; Agarwal, D.; Kapoor, S.; Garg, S.; Sawhney, S. Low-dose and high-dose methotrexate are two different drugs in practical terms. Int. J. Rheum. Dis. 2010, 13, 288–293. [Google Scholar] [CrossRef]
- Kuroda, T.; Wada, Y.; Nakano, M. Diagnosis and Treatment of AA Amyloidosis with Rheumatoid Arthritis: State of the Art. In Amyloidosis; Feng, D., Ed.; IntechOpen: London, UK, 2013. [Google Scholar] [CrossRef]
- Nakamura, T. Amyloid A amyloidosis secondary to rheumatoid arthritis: Pathophysiology and treatment. Clin. Exp. Rheumatol. 2011, 29, 850–857. [Google Scholar] [CrossRef]
- Picken, M.M. Modern approaches to the treatment of amyloidosis: The critical importance of early detection in surgical pathology. Adv. Anat. Pathol. 2013, 20, 424–439. [Google Scholar] [CrossRef] [PubMed]
- Braconi, D.; Millucci, L.; Bernini, A.; Spiga, O.; Lupetti, P.; Marzocchi, B.; Niccolai, N.; Bernardini, G.; Santucci, A. Homogentisic acid induces aggregation and fibrillation of amyloidogenic proteins. Biochim. Biophys. Acta Gen. Subj. 2017, 1861, 135–146. [Google Scholar] [CrossRef] [PubMed]
- Braconi, D.; Bianchini, C.; Bernardini, G.; Laschi, M.; Millucci, L.; Spreafico, A.; Santucci, A. Redox-proteomics of the effects of homogentisic acid in an in vitro human serum model of alkaptonuric ochronosis. J. Inherit. Metab. Dis. 2011, 34, 1163–1176. [Google Scholar] [CrossRef] [PubMed]
- Halliwell, B. Antioxidants in human health and disease. Annu. Rev. Nutr. 1996, 16, 33–50. [Google Scholar] [CrossRef]
- Van Rensburg, S.J.; Van Zyl, J.; Hon, D.; Daniels, W.; Hendricks, J.; Potocnik, F.; Erasmus, R. Biochemical model for inflammation of the brain: The effect of iron and transferrin on monocytes and lipid peroxidation. Metab. Brain Dis. 2004, 19, 97–112. [Google Scholar] [CrossRef] [PubMed]
- Schrag, M.; Mueller, C.; Zabel, M.; Crofton, A.; Kirsch, W.M.; Ghribi, O.; Squitti, R.; Perry, G. Oxidative stress in blood in Alzheimer’s disease and mild cognitive impairment: A meta-analysis. Neurobiol. Dis. 2013, 59, 100–110. [Google Scholar] [CrossRef] [PubMed]
- Lock, E.A.; Gaskin, P.; Ellis, M.; Provan, W.M.; Smith, L.L. Tyrosinemia produced by 2-(2-nitro-4-trifluoromethylbenzoyl)-cyclohexane-1,3-dione (NTBC) in experimental animals and its relationship to corneal injury. Toxicol. Appl. Pharmacol. 2006, 215, 9–16. [Google Scholar] [CrossRef]
- White, A.; Tchan, M.C. Nitisinone-induced keratopathy in alkaptonuria: A challenging diagnosis despite clinical suspicion. JIMD Rep. 2018, 40, 7–9. [Google Scholar] [CrossRef]
- Al Zubi, K.M.; Alsbou, M.S.; Alkhasawneh, M.H.; Al-Shagahin, H.M. Nitisinone-induced keratopathy in alkaptonuria disease: A case report and literature review. J. Clin. Diagnostic Res. 2018, 12, ND01–ND03. [Google Scholar] [CrossRef]
- Khedr, M.; Judd, S.; Briggs, M.C.; Hughes, A.T.; Milan, A.M.; Stewart, R.M.K.; Lock, E.A.; Gallagher, J.A.; Ranganath, L.R. Asymptomatic Corneal Keratopathy Secondary to Hypertyrosinaemia Following Low Dose Nitisinone and a Literature Review of Tyrosine Keratopathy in Alkaptonuria. JIMD Rep. 2018, 40, 31. [Google Scholar] [CrossRef]
- Wolffenbuttel, B.H.R.; Heiner-Fokkema, M.R.; van Spronsen, F.J. Preventive use of nitisinone in alkaptonuria. Orphanet J. Rare Dis. 2021, 16, 4–9. [Google Scholar] [CrossRef] [PubMed]
- Stettler, C.; Witt, N.; Tapp, R.J.; Thom, S.; Allemann, S.; Tillin, T.; Stanton, A.; O’Brien, E.; Poulter, N.; Gallimore, J.R.; et al. Serum amyloid A, C-reactive protein, and retinal microvascular changes in hypertensive diabetic and nondiabetic individuals: An Anglo-Scandinavian Cardiac Outcomes Trial (ASCOT) substudy. Diabetes Care 2009, 32, 1098–1100. [Google Scholar] [CrossRef] [PubMed]
- Ren, S.W.; Qi, X.; Wang, Y.Q. Serum amyloid A and pairing formyl peptide receptor 2 are expressed in corneas and involved in inflammation-mediated neovascularization. Int. J. Ophthalmol. 2014, 7, 187–193. [Google Scholar] [CrossRef] [PubMed][Green Version]
- Dai, M.L.; Fan, S.; Li, Z.; Yu, X.; Lin, D.; Huang, X.F.; Wang, Y. Correlation of serum amyloid A levels, clinical manifestations, treatment, and disease activity in patients with acute anterior uveitis. Eye 2020, 34, 1672. [Google Scholar] [CrossRef] [PubMed]
- Robinson, C.S.; Singer, E.R.; Piviani, M.; Rubio-Martinez, L.M. Are serum amyloid A or D-lactate useful to diagnose synovial contamination or sepsis in horses? Vet. Rec. 2017, 181, 425. [Google Scholar] [CrossRef] [PubMed]
- Connolly, M.; Mullan, R.H.; McCormick, J.; Matthews, C.; Sullivan, O.; Kennedy, A.; FitzGerald, O.; Poole, A.R.; Bresnihan, B.; Veale, D.J.; et al. Acute-phase serum amyloid A regulates tumor necrosis factor α and matrix turnover and predicts disease progression in patients with inflammatory arthritis before and after biologic therapy. Arthritis Rheum. 2012, 64, 1035–1045. [Google Scholar] [CrossRef] [PubMed]
- Millucci, L.; Ghezzi, L.; Braconi, D.; Laschi, M.; Geminiani, M.; Amato, L.; Orlandini, M.; Benvenuti, C.; Bernardini, G.; Santucci, A. Secondary amyloidosis in an alkaptonuric aortic valve. Int. J. Cardiol. 2014, 172, e121–e123. [Google Scholar] [CrossRef]
- Geminiani, M.; Gambassi, S.; Millucci, L.; Lupetti, P.; Collodel, G.; Mazzi, L.; Frediani, B.; Braconi, D.; Marzocchi, B.; Laschi, M.; et al. Cytoskeleton Aberrations in Alkaptonuric Chondrocytes. J. Cell. Physiol. 2017, 232, 1728–1738. [Google Scholar] [CrossRef]
- Orbai, A.M.; Bingham, C.O. Patient Reported Outcomes in Rheumatoid Arthritis Clinical Trials. Curr. Rheumatol. Rep. 2015, 17, 501. [Google Scholar] [CrossRef]
- Cantarini, L.; Giani, T.; Fioravanti, A.; Iacoponi, F.; Simonini, G.; Pagnini, I.; Spreafico, A.; Chellini, F.; Galeazzi, M.; Cimaz, R. Serum amyloid A circulating levels and disease activity in patients with juvenile idiopathic arthritis. Yonsei Med. J. 2012, 53, 1045–1048. [Google Scholar] [CrossRef]
- Ally, M.M.; Hodkinson, B.; Meyer, P.W.A.; Musenge, E.; Tikly, M.; Anderson, R. Serum matrix metalloproteinase-3 in comparison with acute phase proteins as a marker of disease activity and radiographic damage in early rheumatoid arthritis. Mediators Inflamm. 2013, 2013, 183653. [Google Scholar] [CrossRef] [PubMed]
- Sorić Hosman, I.; Kos, I.; Lamot, L. Serum Amyloid A in Inflammatory Rheumatic Diseases: A Compendious Review of a Renowned Biomarker. Front. Immunol. 2021, 11, 631299. [Google Scholar] [CrossRef] [PubMed]
- Li, H.; Xiang, X.; Ren, H.; Xu, L.; Zhao, L.; Chen, X.; Long, H.; Wang, Q.; Wu, Q. Serum Amyloid A is a biomarker of severe Coronavirus Disease and poor prognosis. J. Infect. 2020, 80, 646–655. [Google Scholar] [CrossRef]
- Cicaloni, V.; Spiga, O.; Dimitri, G.M.; Maiocchi, R.; Millucci, L.; Giustarini, D.; Bernardini, G.; Bernini, A.; Marzocchi, B.; Braconi, D.; et al. Interactive alkaptonuria database: Investigating clinical data to improve patient care in a rare disease. FASEB J. 2019, 33, 12696–12703. [Google Scholar] [CrossRef] [PubMed]
- Spiga, O.; Cicaloni, V.; Bernini, A.; Zatkova, A.; Santucci, A. ApreciseKUre: An approach of Precision Medicine in a Rare Disease. BMC Med. Inform. Decis. Mak. 2017, 17, 42. [Google Scholar] [CrossRef] [PubMed]
- Spiga, O.; Cicaloni, V.; Fiorini, C.; Trezza, A.; Visibelli, A.; Millucci, L.; Bernardini, G.; Bernini, A.; Marzocchi, B.; Braconi, D.; et al. Machine learning application for development of a data-driven predictive model able to investigate quality of life scores in a rare disease. Orphanet J. Rare Dis. 2020, 15, 46. [Google Scholar] [CrossRef] [PubMed]
- Rossi, A.; Giacomini, G.; Cicaloni, V.; Galderisi, S.; Milella, M.S.; Bernini, A.; Millucci, L.; Spiga, O.; Bianchini, M.; Santucci, A. AKUImg: A database of cartilage images of Alkaptonuria patients. Comput. Biol. Med. 2020, 122, 103863. [Google Scholar] [CrossRef] [PubMed]
- Spiga, O.; Cicaloni, V.; Dimitri, G.M.; Pettini, F.; Braconi, D.; Bernini, A.; Santucci, A. Machine learning application for patient stratification and phenotype/genotype investigation in a rare disease. Brief. Bioinform. 2021, 22, bbaa434. [Google Scholar] [CrossRef] [PubMed]
- Spiga, O.; Cicaloni, V.; Visibelli, A.; Davoli, A.; Paparo, M.A.; Orlandini, M.; Vecchi, B.; Santucci, A. Towards a Precision Medicine Approach Based on Machine Learning for Tailoring Medical Treatment in Alkaptonuria. Int. J. Mol. Sci. 2021, 22, 1187. [Google Scholar] [CrossRef]


| Baseline | Year 4 | ||||||
|---|---|---|---|---|---|---|---|
| Variable | Control | NTBC | P § | Control | NTBC | P § | |
| n | 69 | 69 | 58 | 55 | |||
| age | 47.59 ± 10.10 | 49.10 ± 11.39 | 0.4121 | 50.91 ± 9.778 | 52.07 ± 10.99 | 0.5554 | |
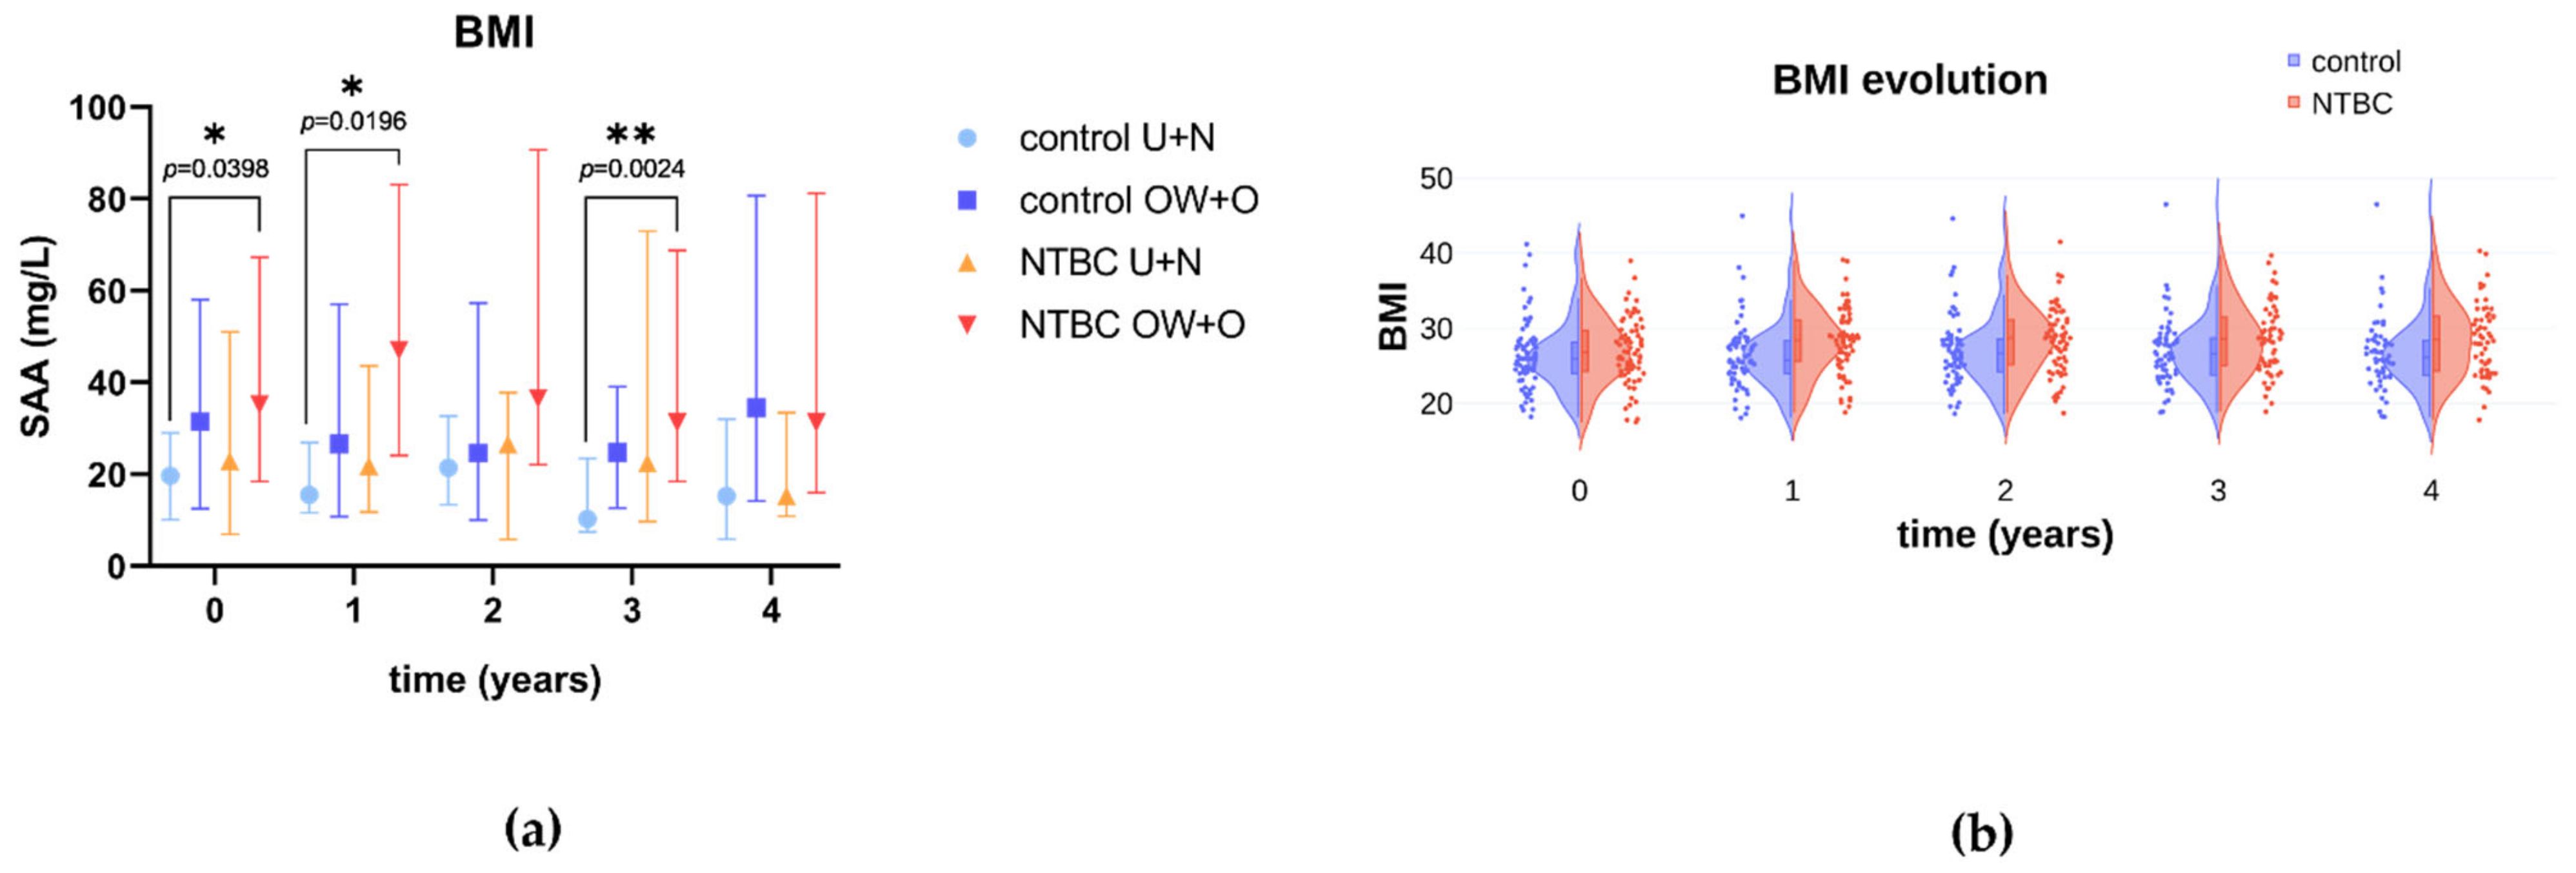
| BMI | 26.00 (24.00, 28.35) | 26.80 (24.25, 29.75) | 0.3093 | 26.10 (23.70, 28.43) | 28.50 (24.25, 31.60) | 0.0275 | |
| HAQ | visual analog scale | 48.00 (24.25, 70.75) | 48.00 (25.00, 70.75) | 0.6777 | 52.00 (27.00, 72.00) | 49.00 (26.00, 70.00) | 0.7214 |
| disability index | 0.9348 ± 0.6480 | 0.8739 ± 0.6434 | 0.8739 | 0.880 (0.500, 1.380) | 1.130 (0.630, 1.500) | 0.2770 | |
| SF-36 | physical | 35.60 ± 10.87 | 35.46 ± 9.237 | 0.9349 | 35.71 ± 10.38 | 35.33 ± 9.715 | 0.8442 |
| mental | 49.72 (38.12, 55.89) | 49.72 (38.12, 55.89) | 0.2064 | 42.00 (34.73, 52.49) | 44.52 (37.02, 57.27) | 0.5722 | |
| KOOS | pain | 66.67 (47.22, 84.03) | 65.28 (47.22, 90.98) | 0.8965 | 66.67 (47.92, 90.98) | 59.38 (50.00, 83.33) | 0.6242 |
| symptoms | 69.65 (49.11, 89.29) | 69.65 (50.00, 89.29) | 0.9336 | 75.00 (4732, 88.40) | 67.86 (53.57, 85.71) | 0.9715 | |
| activities of daily living | 66.18 (51.47, 91.55) | 60.29 (42.28, 93.02) | 0.5717 | 59.79 (45.96, 90.81) | 57.35 (42.65, 80.88) | 0.4988 | |
| sport | 45.00 (16.25, 80.00) | 45.00 (10.00, 78.75) | 0.7845 | 40.00 (16.25, 80.00) | 40.00 (15.00, 71.25) | 0.6486 | |
| quality of life | 53.13 (25.00, 81.25) | 50.00 (18.75, 75.00) | 0.7258 | 50.00 (25.00, 81.25) | 43.75 (25.00, 75.00) | 0.4206 | |
| cAKUSSI | 82.00 (57.50, 105.0) | 91.00 (56.00, 113.0) | 0.2285 | 95.00 (69.25, 122.5) | 97.00 (63.50, 123.8) | 0.9354 | |
| sHGA (µmol/L) | 27.30 (22.45, 32.90) | 28.00 (22.45, 35.85) | 0.4452 | 33.10 (24.28, 44.30) | 0.5100 (0.3400, 1.385) | <0.0001 | |
| uHGA (µmol/L) | 33,742 (26,102, 44,220) | 33,291 (26,148, 42,767) | 0.8023 | 31,689 (28,244, 38,260) | 111.0 (66.00, 312.0) | <0.0001 | |
| sTyr (µmol/L) | 64.52 ± 15.46 | 65.35 ± 15.46 | 0.7490 | 61.50 (54.75, 69.00) | 813 (692, 1013) | <0.0001 | |
| Baseline | Week 4 | ||||||
|---|---|---|---|---|---|---|---|
| Mean | Mean Diff. | 95% CI | Mean | Mean Diff. | 95% CI | ||
| log IL-8 (pg/mL) | control | 0.7384 | 0.8711 | ||||
| NTBC 1 mg | 0.8264 | −0.08796 | [−0.5445; 0.3686] | 0.7995 | 0.07169 | [−0.3849; 0.5282] | |
| NTBC 2 mg | 0.7413 | −0.002917 | [−0.4595; 0.4536] | 0.6696 | 0.2015 | [−0.2550; 0.6581] | |
| NTBC 4 mg | 0.6581 | 0.08028 | [−0.3763; 0.5368] | 0.3608 | 0.5104 | [0.05383; 0.9669] | |
| NTBC 8 mg | 0.9006 | −0.1622 | [−0.6188; 0.2943] | 0.7926 | 0.07851 | [−0.3780; 0.5351] | |
| log CRP (mg/L) | control | 0.07317 | 0.2461 | ||||
| NTBC 1 mg | 0.1300 | −0.05686 | [−0.6992; 0.5855] | 0.3718 | −0.1257 | [−0.7680; 0.5166] | |
| NTBC 2 mg | 0.1834 | −0.1102 | [−0.7525; 0.5322] | 0.2459 | 0.0001408 | [−0.6422; 0.6425] | |
| NTBC 4 mg | −0.1318 | 0.2049 | [−0.4374; 0.8473] | 0.09233 | 0.1538 | [−0.4886; 0.7961] | |
| NTBC 8 mg | 0.3177 | −0.2445 | [−0.8869; 0.3978] | 0.2368 | 0.009251 | [−0.6331; 0.6516] | |
| log SAA (mg/L) | control | 0.7569 | 0.7030 | ||||
| NTBC 1 mg | 0.8183 | −0.06140 | [−0.5853; 0.4625] | 1.007 | −0.3045 | [−0.8284; 0.2194] | |
| NTBC 2 mg | 1.014 | −0.2569 | [−0.7808; 0.2669] | 1.083 | −0.3801 | [−0.9040; 0.1437] | |
| NTBC 4 mg | 0.7530 | 0.003929 | [−0.5199; 0.5278] | 0.8957 | −0.1927 | [−0.7166; 0.3312] | |
| NTBC 8 mg | 1.053 | −0.2958 | [−0.8197; 0.2281] | 1.141 | −0.4383 | [−0.9622; 0.08554] | |
| Analyte | Time (Years) | Mean (Control) | Mean (NTBC) | Mean Diff. | 95% CI |
|---|---|---|---|---|---|
| AOPP | 0 | 1.026 | 1.014 | 0.01177 | [−0.1136; 0.1372] |
| 1 | 1.024 | 0.9941 | 0.03017 | [−0.09484; 0.1552] | |
| 2 | 0.9165 | 0.945 | −0.02851 | [−0.1424; 0.08537] | |
| 3 | 0.9097 | 0.9251 | −0.0154 | [−0.1229; 0.09211] | |
| 4 | 0.9653 | 0.9704 | −0.005068 | [−0.1251; 0.1149] | |
| SAA | 0 | 1.367 | 1.448 | −0.08166 | [−0.2986; 0.1263] |
| 1 | 1.346 | 1.533 | −0.1871 | [−0.4007; 0.02657] | |
| 2 | 1.369 | 1.533 | −0.1644 | [−0.3764; 0.04761] | |
| 3 | 1.265 | 1.503 | −0.2378 | [−0.4398; −0.03570] | |
| 4 | 1.389 | 1.451 | −0.06242 | [−0.3035; 0.1786] |
| Source | Indicator | r | P |
|---|---|---|---|
| age | −0.0278 | ns | |
| BMI | 0.369 | *** <0.0001 | |
| HAQ | hapvas | 0.136 | ns |
| haqdi | 0.360 | *** 0.0001 | |
| SF-36 | physical | −0.283 | ** 0.0030 |
| mental | 0.0320 | ns | |
| KOSS | pain | −0.170 | ns |
| symptoms | −0.180 | ns | |
| ADL | −0.247 | * 0.0102 | |
| sport | −0.231 | * 0.0175 | |
| QoL | −0.227 | * 0.0188 | |
| AKUSSI | joint pain | 0.0445 | ns |
| spinal pain | −0.089 | ns | |
| eye pigment | 0.309 | ** 0.0012 | |
| ear pigment | 0.072 | ns | |
| ostearticular disease joints | 0.194 | ns | |
| ostearticular disease spine | 0.101 | ns | |
| cAKUSSI | 0.181 | ns | |
| metabolites | sHGA | −0.061 | ns |
| u24HGA | −0.078 | ns | |
| sTyr | 0.141 | ns |
Publisher’s Note: MDPI stays neutral with regard to jurisdictional claims in published maps and institutional affiliations. |
© 2022 by the authors. Licensee MDPI, Basel, Switzerland. This article is an open access article distributed under the terms and conditions of the Creative Commons Attribution (CC BY) license (https://creativecommons.org/licenses/by/4.0/).
Share and Cite
Braconi, D.; Geminiani, M.; Psarelli, E.E.; Giustarini, D.; Marzocchi, B.; Rossi, R.; Bernardini, G.; Spiga, O.; Gallagher, J.A.; Le Quan Sang, K.-H.; et al. Effects of Nitisinone on Oxidative and Inflammatory Markers in Alkaptonuria: Results from SONIA1 and SONIA2 Studies. Cells 2022, 11, 3668. https://doi.org/10.3390/cells11223668
Braconi D, Geminiani M, Psarelli EE, Giustarini D, Marzocchi B, Rossi R, Bernardini G, Spiga O, Gallagher JA, Le Quan Sang K-H, et al. Effects of Nitisinone on Oxidative and Inflammatory Markers in Alkaptonuria: Results from SONIA1 and SONIA2 Studies. Cells. 2022; 11(22):3668. https://doi.org/10.3390/cells11223668
Chicago/Turabian StyleBraconi, Daniela, Michela Geminiani, Eftychia Eirini Psarelli, Daniela Giustarini, Barbara Marzocchi, Ranieri Rossi, Giulia Bernardini, Ottavia Spiga, James A. Gallagher, Kim-Hanh Le Quan Sang, and et al. 2022. "Effects of Nitisinone on Oxidative and Inflammatory Markers in Alkaptonuria: Results from SONIA1 and SONIA2 Studies" Cells 11, no. 22: 3668. https://doi.org/10.3390/cells11223668
APA StyleBraconi, D., Geminiani, M., Psarelli, E. E., Giustarini, D., Marzocchi, B., Rossi, R., Bernardini, G., Spiga, O., Gallagher, J. A., Le Quan Sang, K.-H., Arnoux, J.-B., Imrich, R., Al-Sbou, M. S., Gornall, M., Jackson, R., Ranganath, L. R., & Santucci, A. (2022). Effects of Nitisinone on Oxidative and Inflammatory Markers in Alkaptonuria: Results from SONIA1 and SONIA2 Studies. Cells, 11(22), 3668. https://doi.org/10.3390/cells11223668