
Upregulation of YKL-40 Promotes Metastatic Phenotype and Correlates with Poor Prognosis and Therapy Response in Patients with Colorectal Cancer

 , ,
, ,  ,
,  , ,
, ,  , and
, and 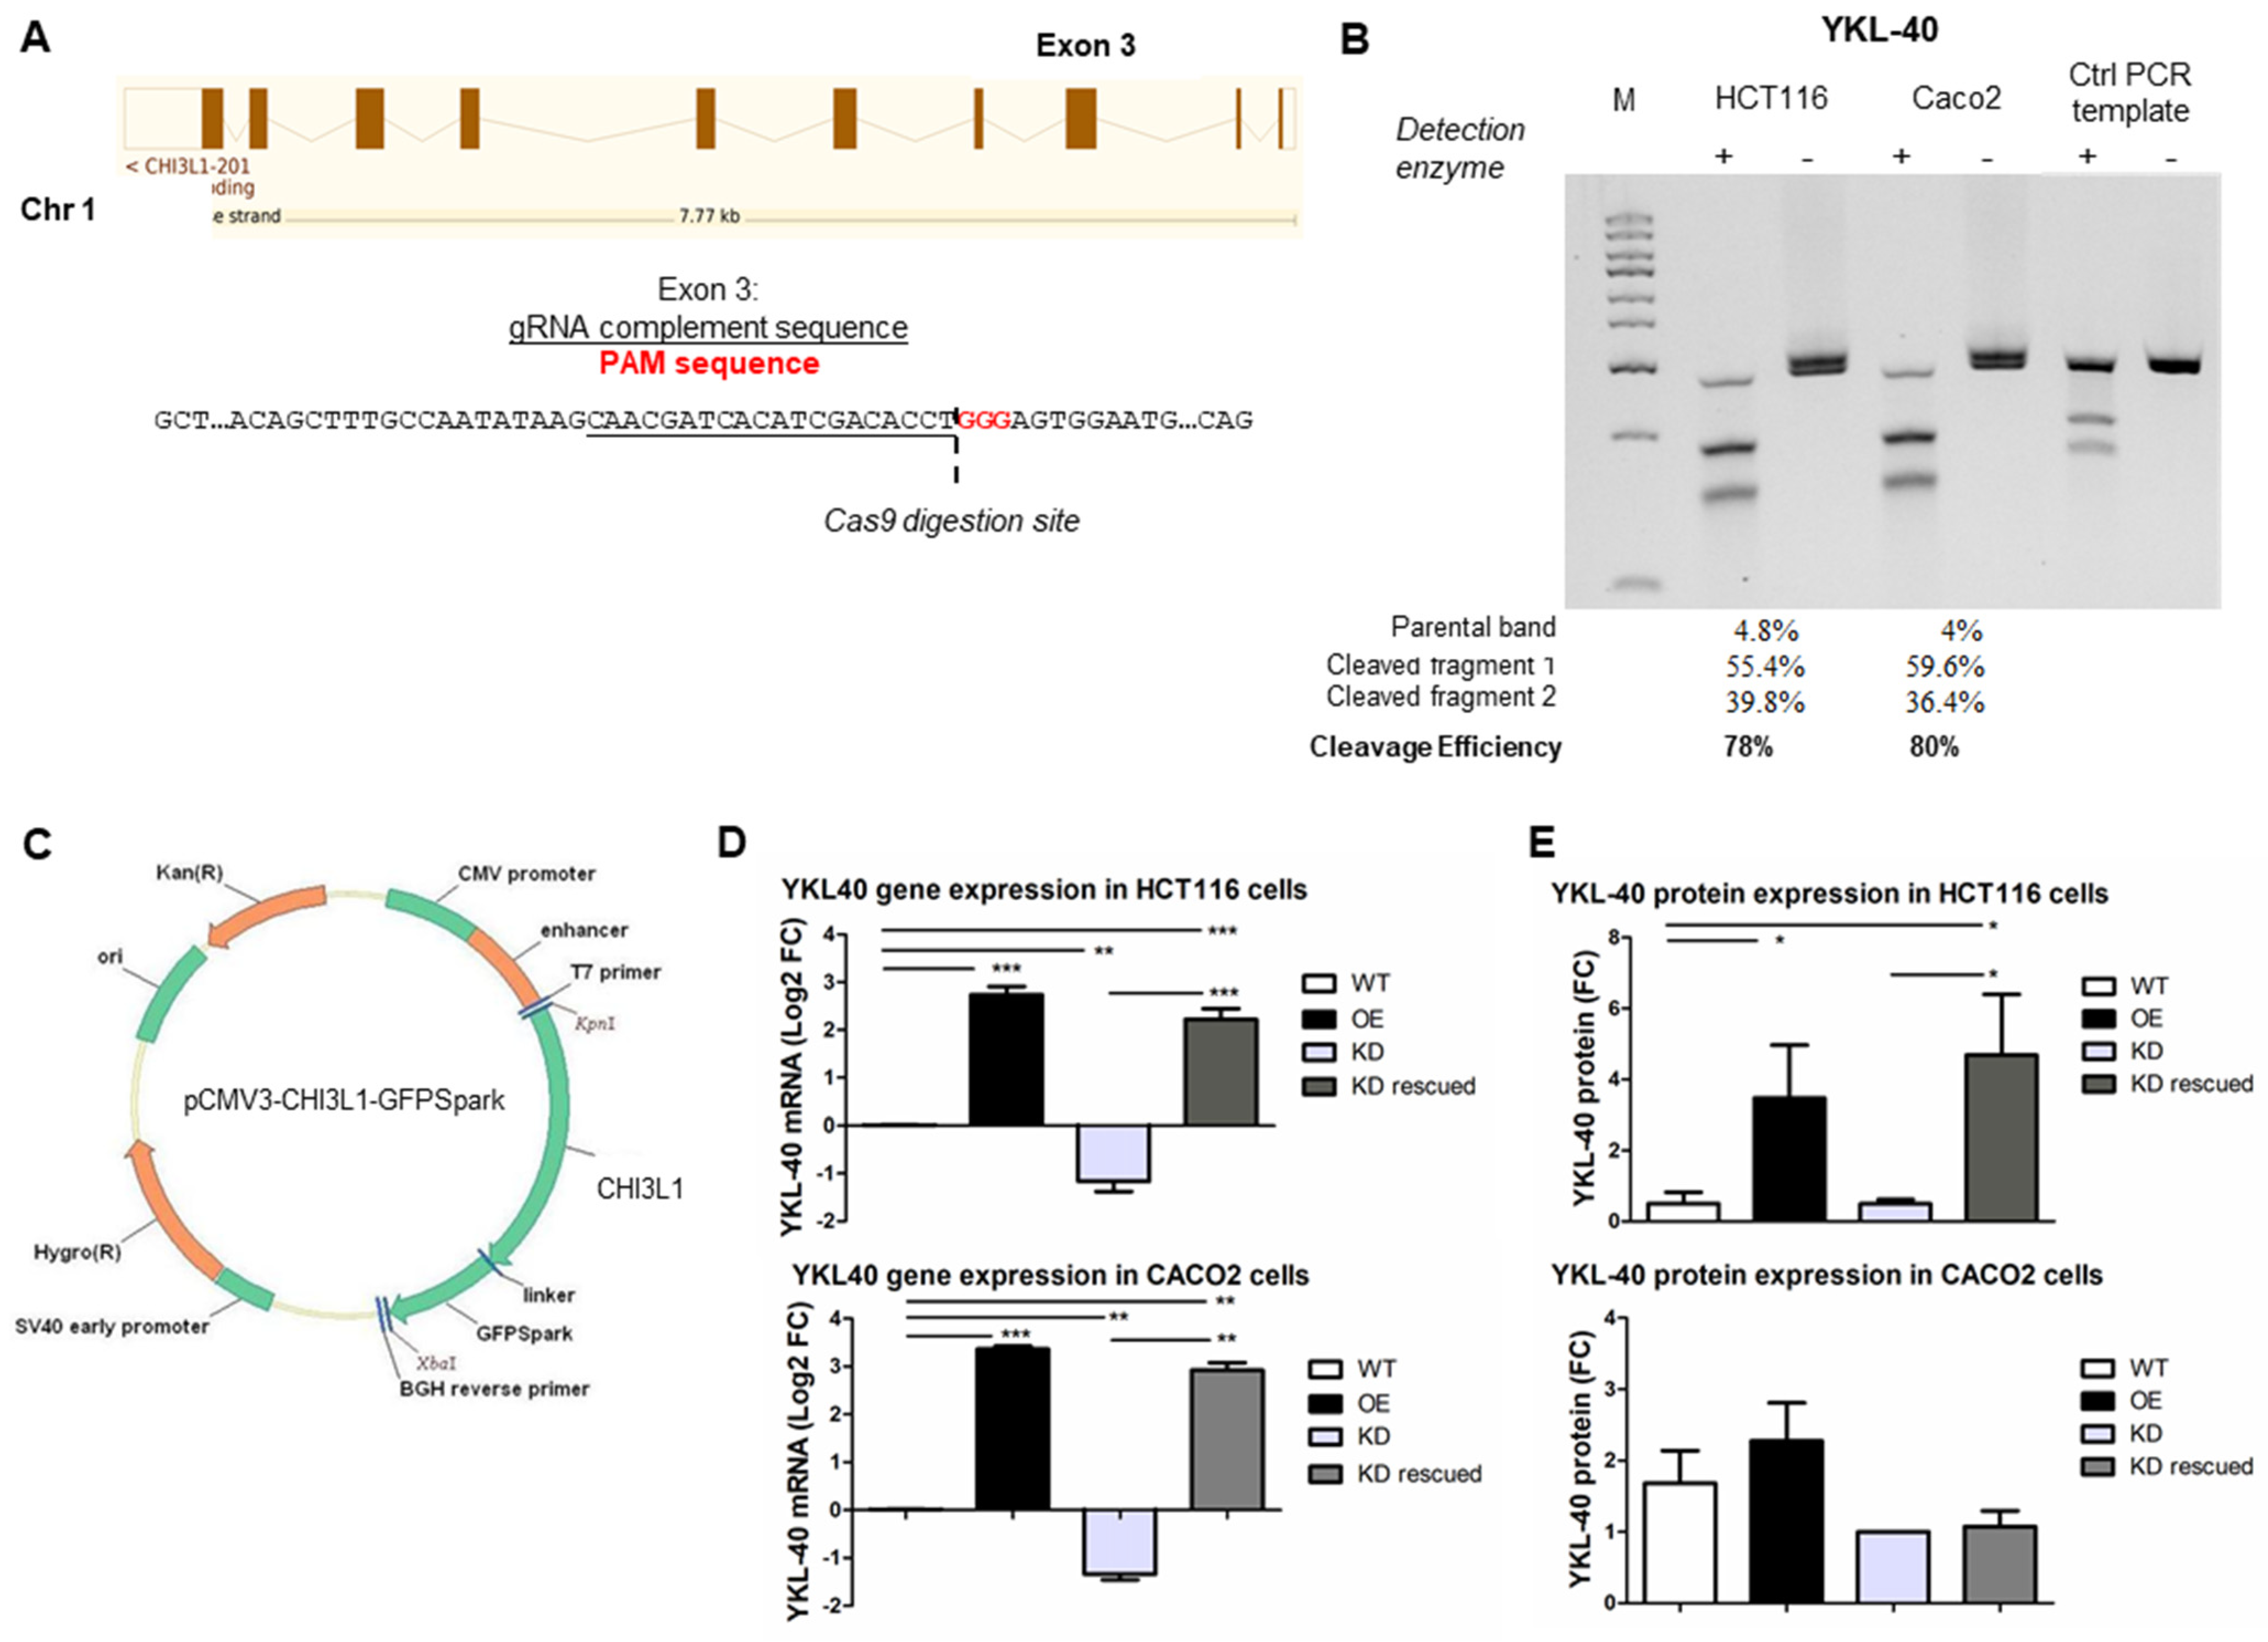
Abstract
1. Introduction
2. Materials and Methods
2.1. Cell Culture
2.2. Modulation of YKL-40 Gene Expression
2.3. Western Blot Analysis
2.4. Cell Migration, Invasion, and Proliferation Assays
2.5. Mice and Tissue Sample Processing
2.6. CRC Patient Sample Collection and Storage
2.7. Immunohistochemical Detection
2.8. ELISA
2.9. RNA Extraction and Quantitative Real-Time PCR (qRT-PCR)
2.10. CRC Patient Databases and Bioinformatics Analysis
2.11. Statistical Analysis
3. Results
3.1. Generation of Genetically Engineered CRC Cells for YKL-40 Expression
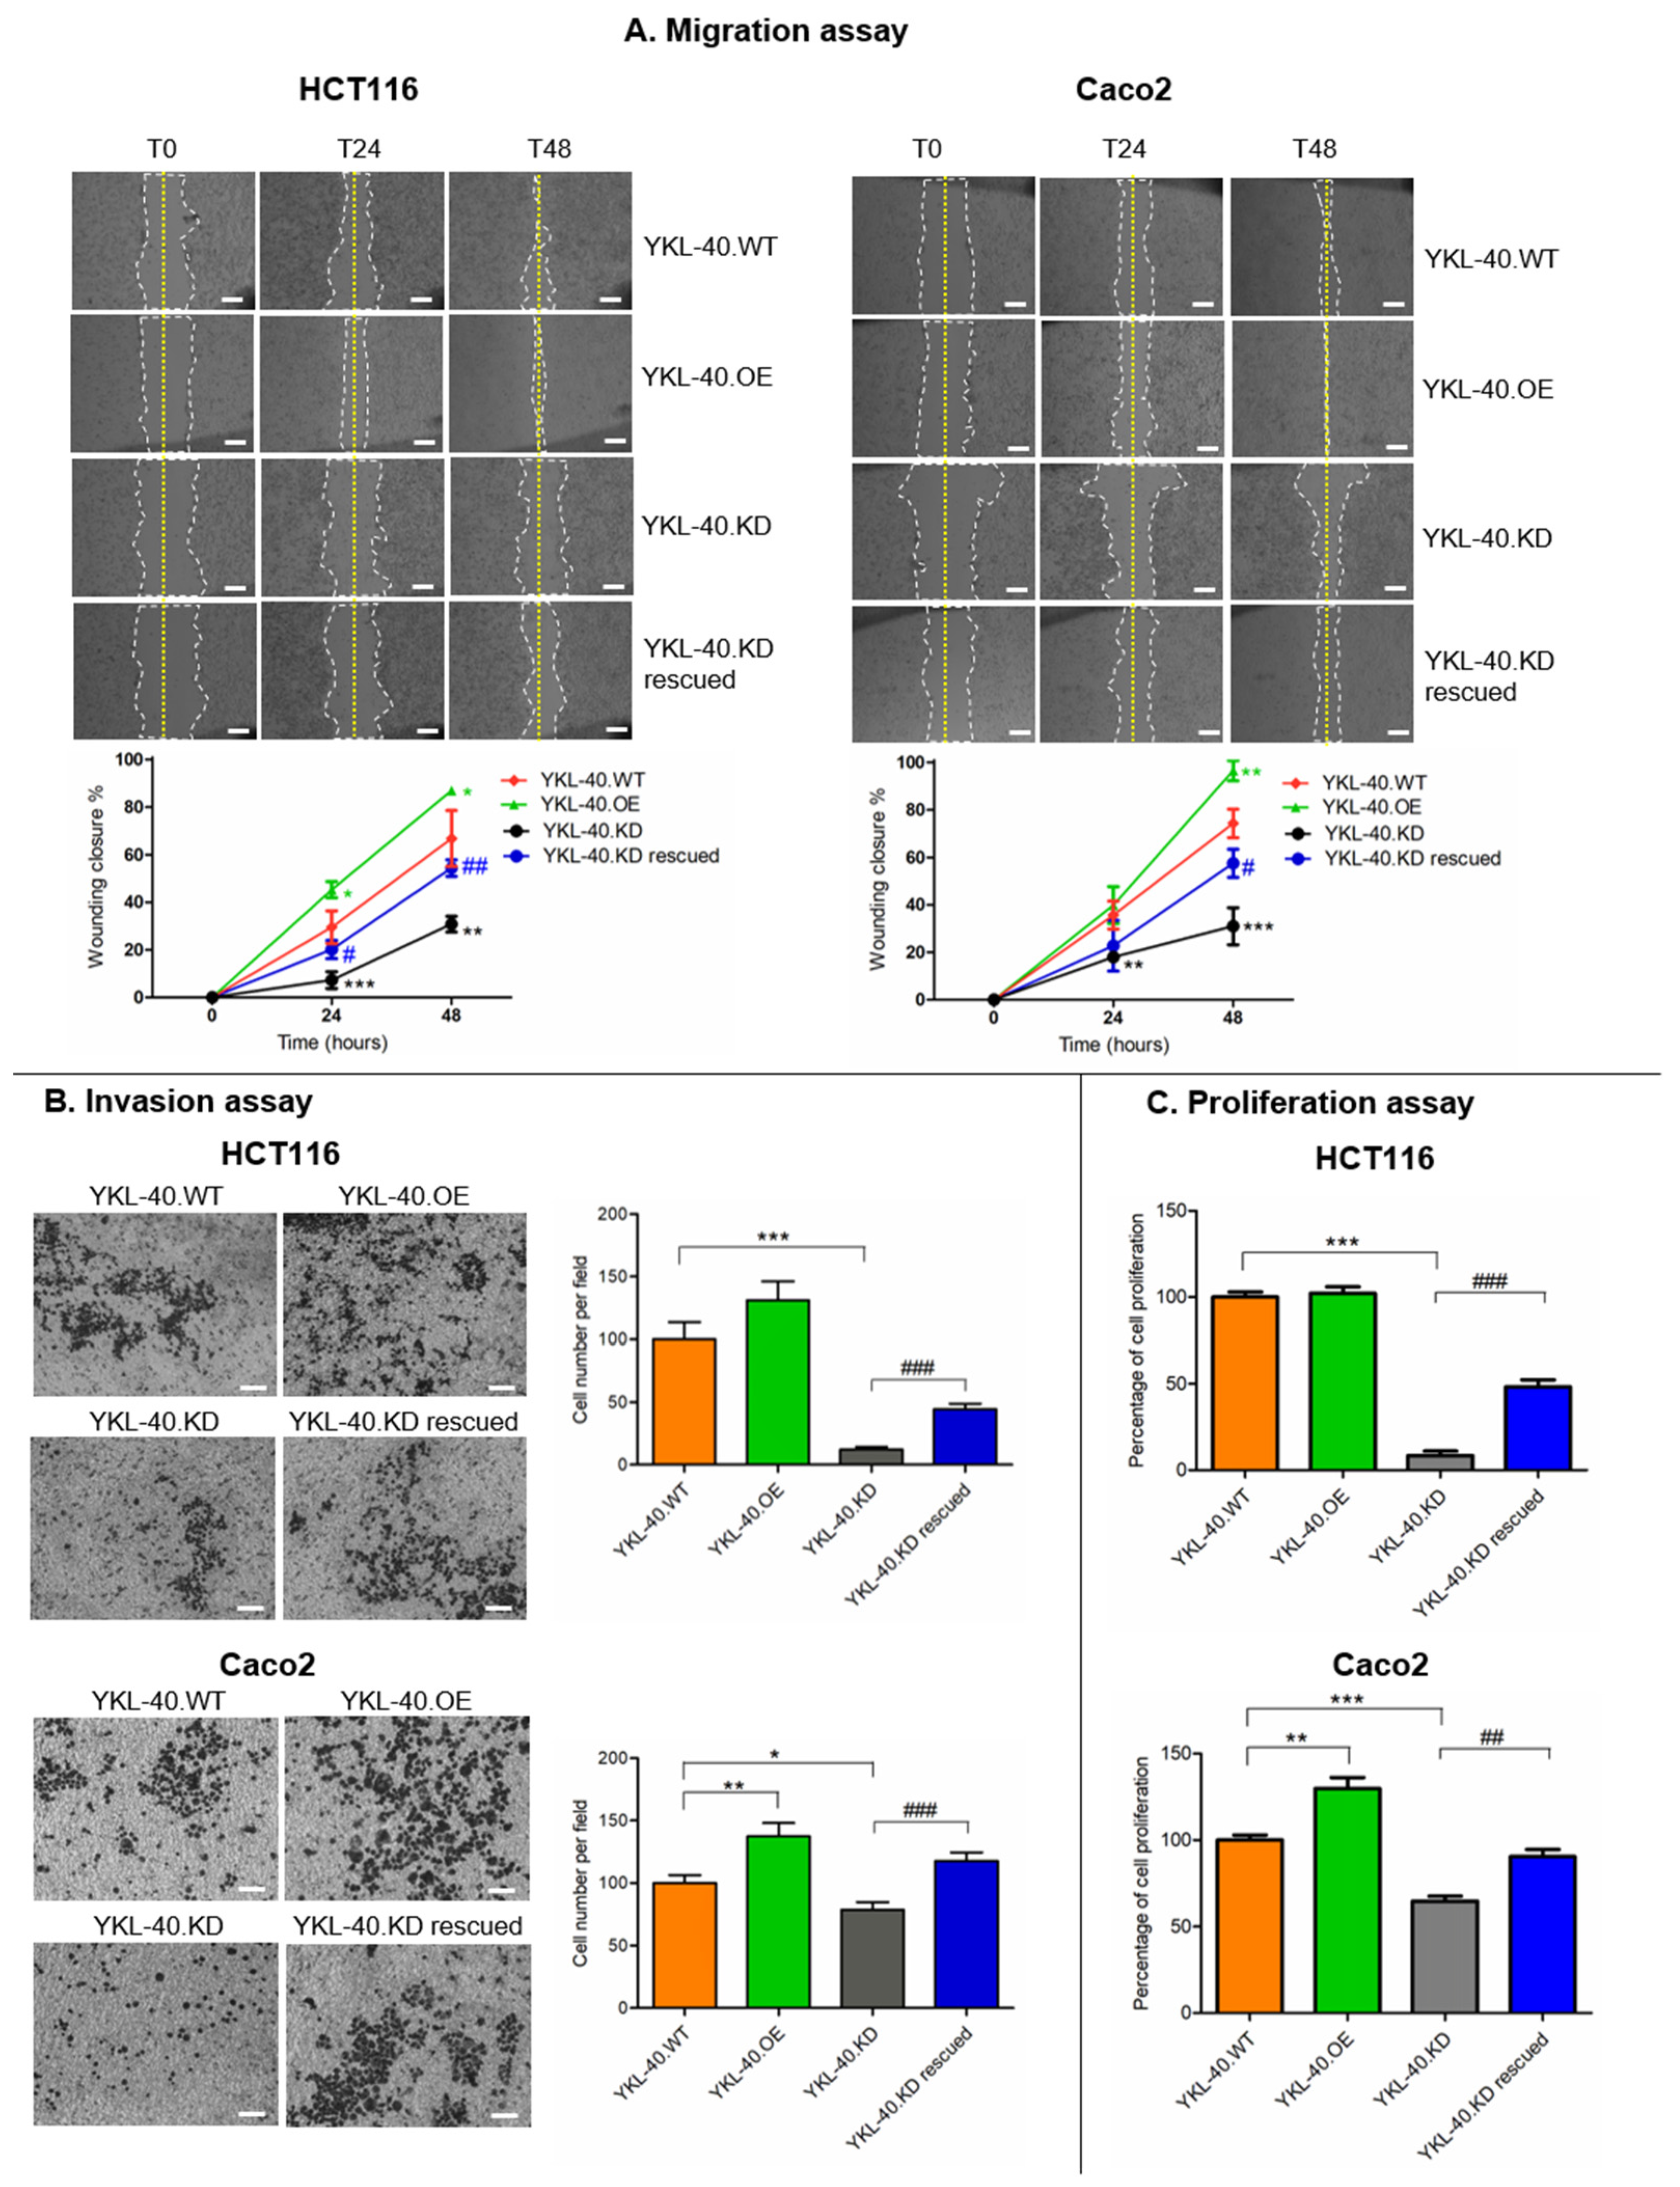
3.2. YKL-40 Affects the Migratory Potential, Invasion, and Proliferation of CRC Cells
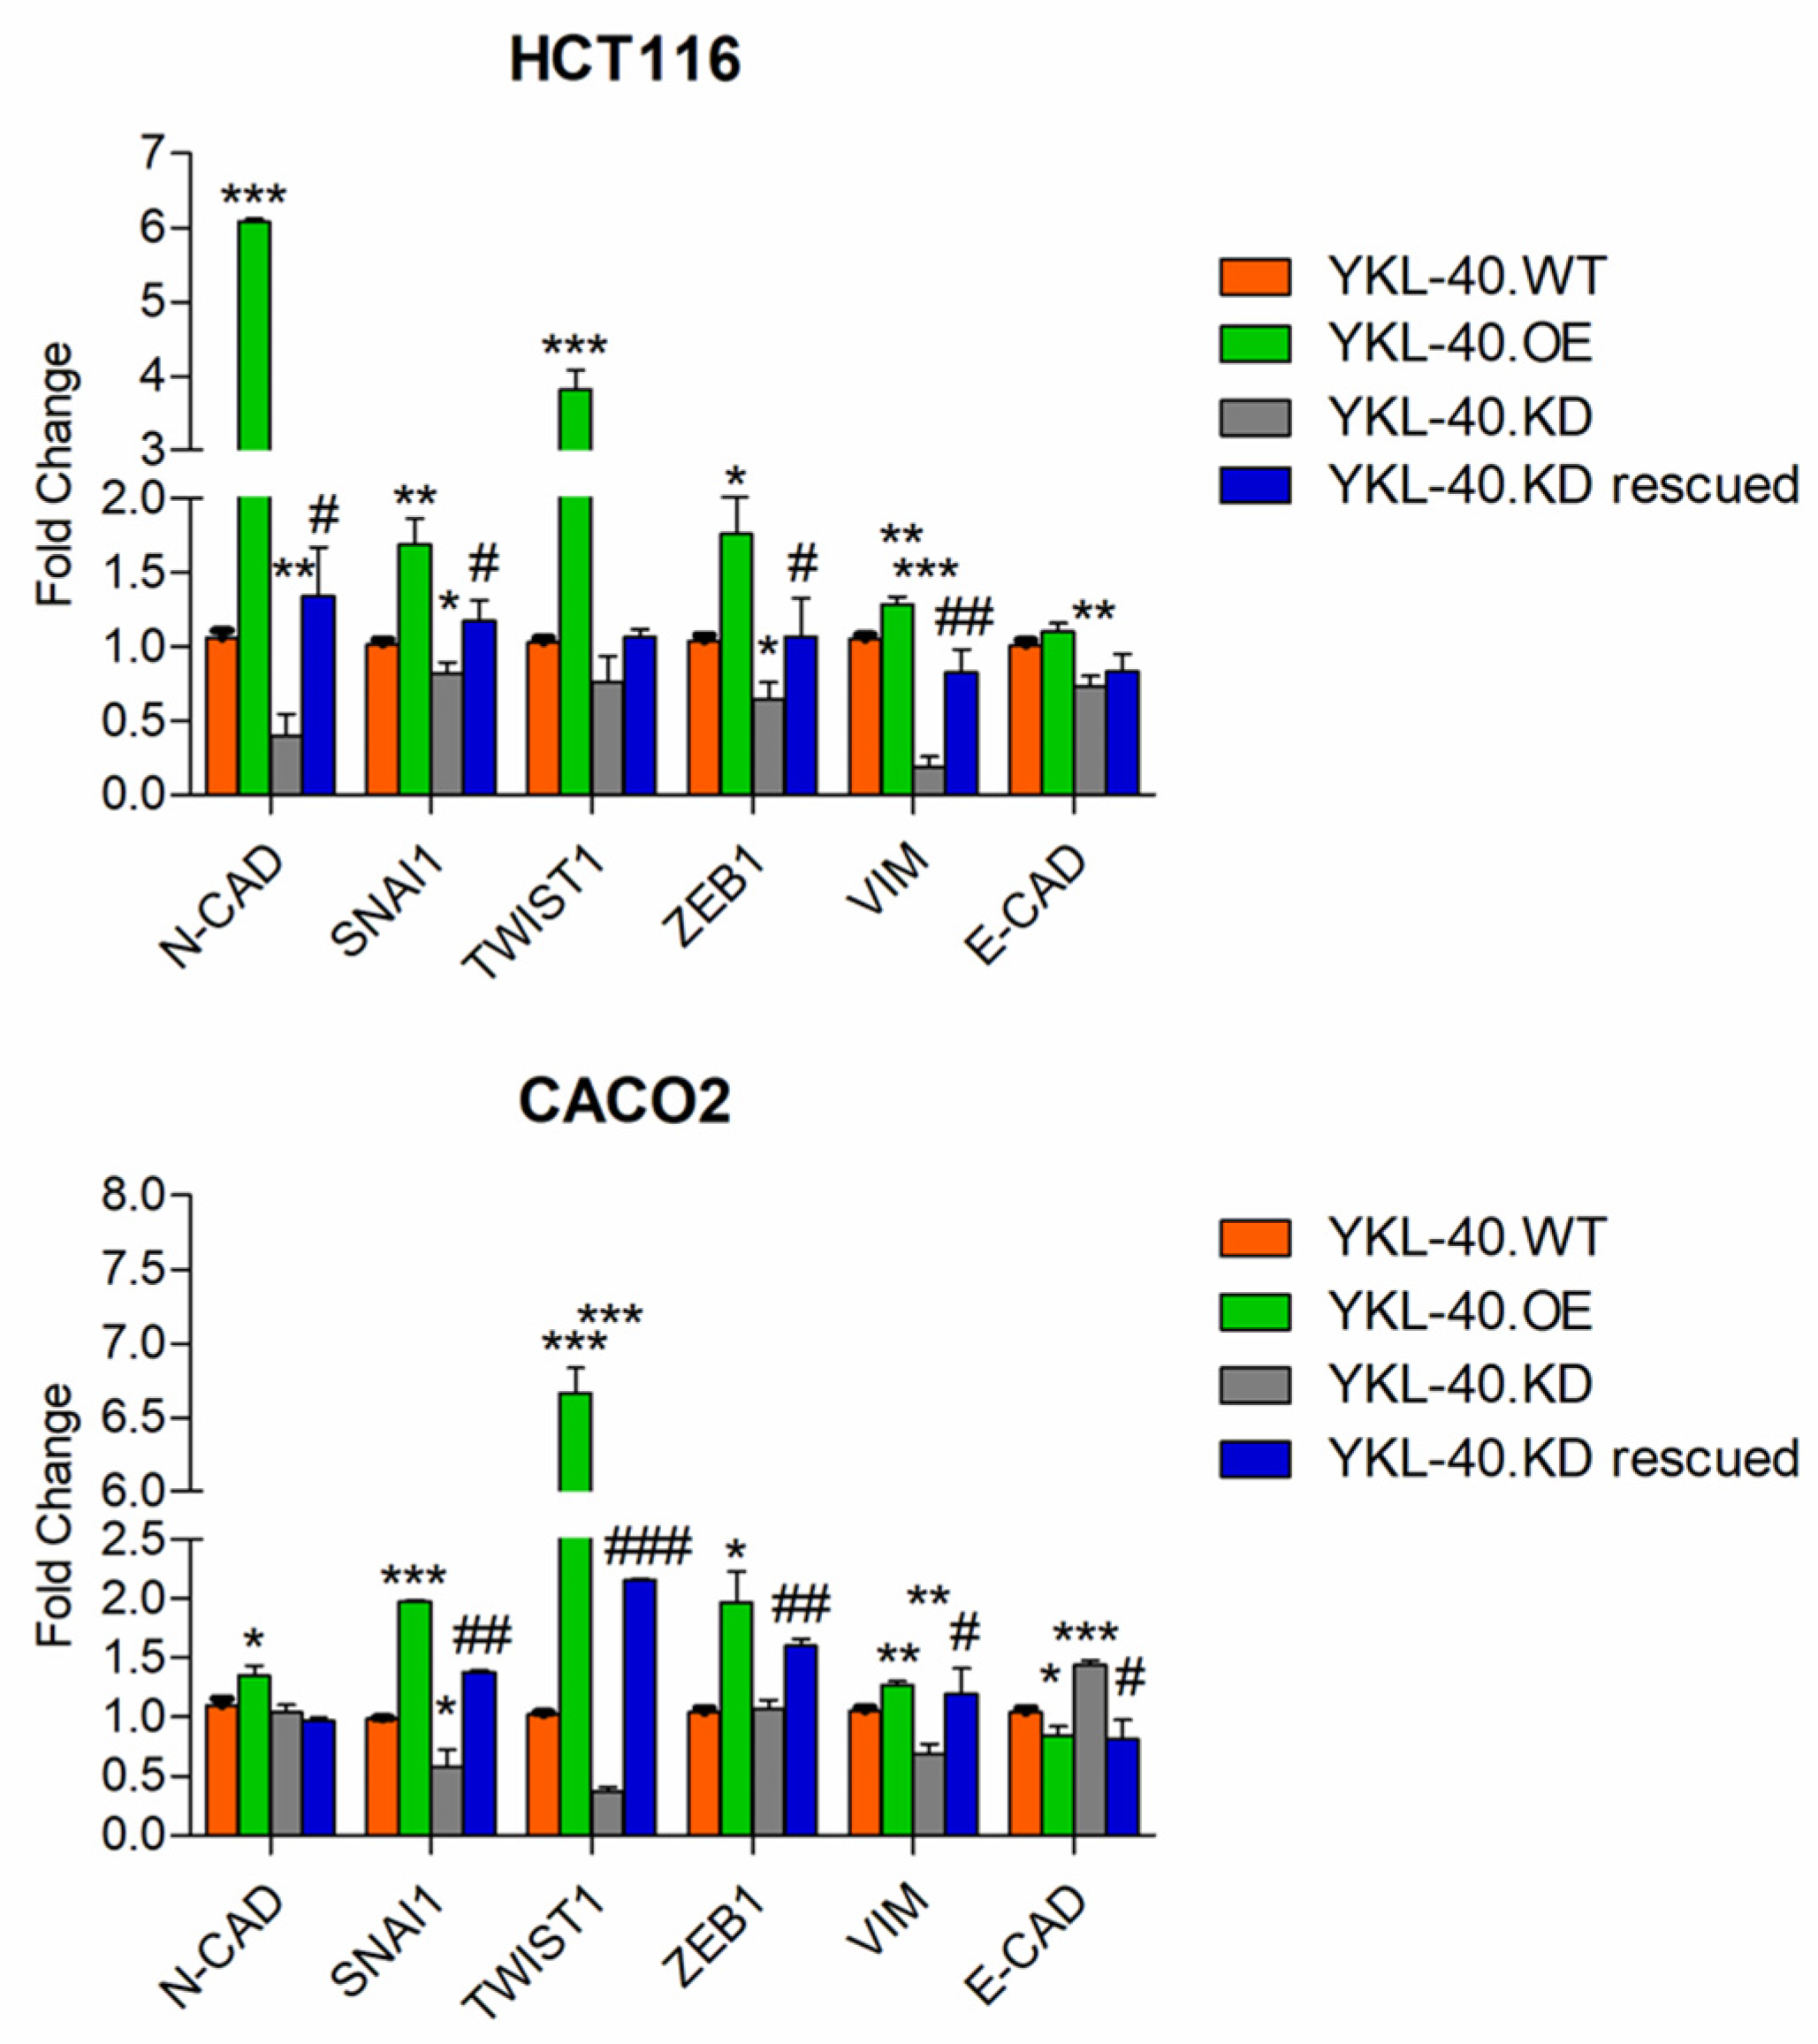
3.3. YKL-40 Promotes Cell Migration/Invasion via Regulating EMT-Related Genes in CRC Cells
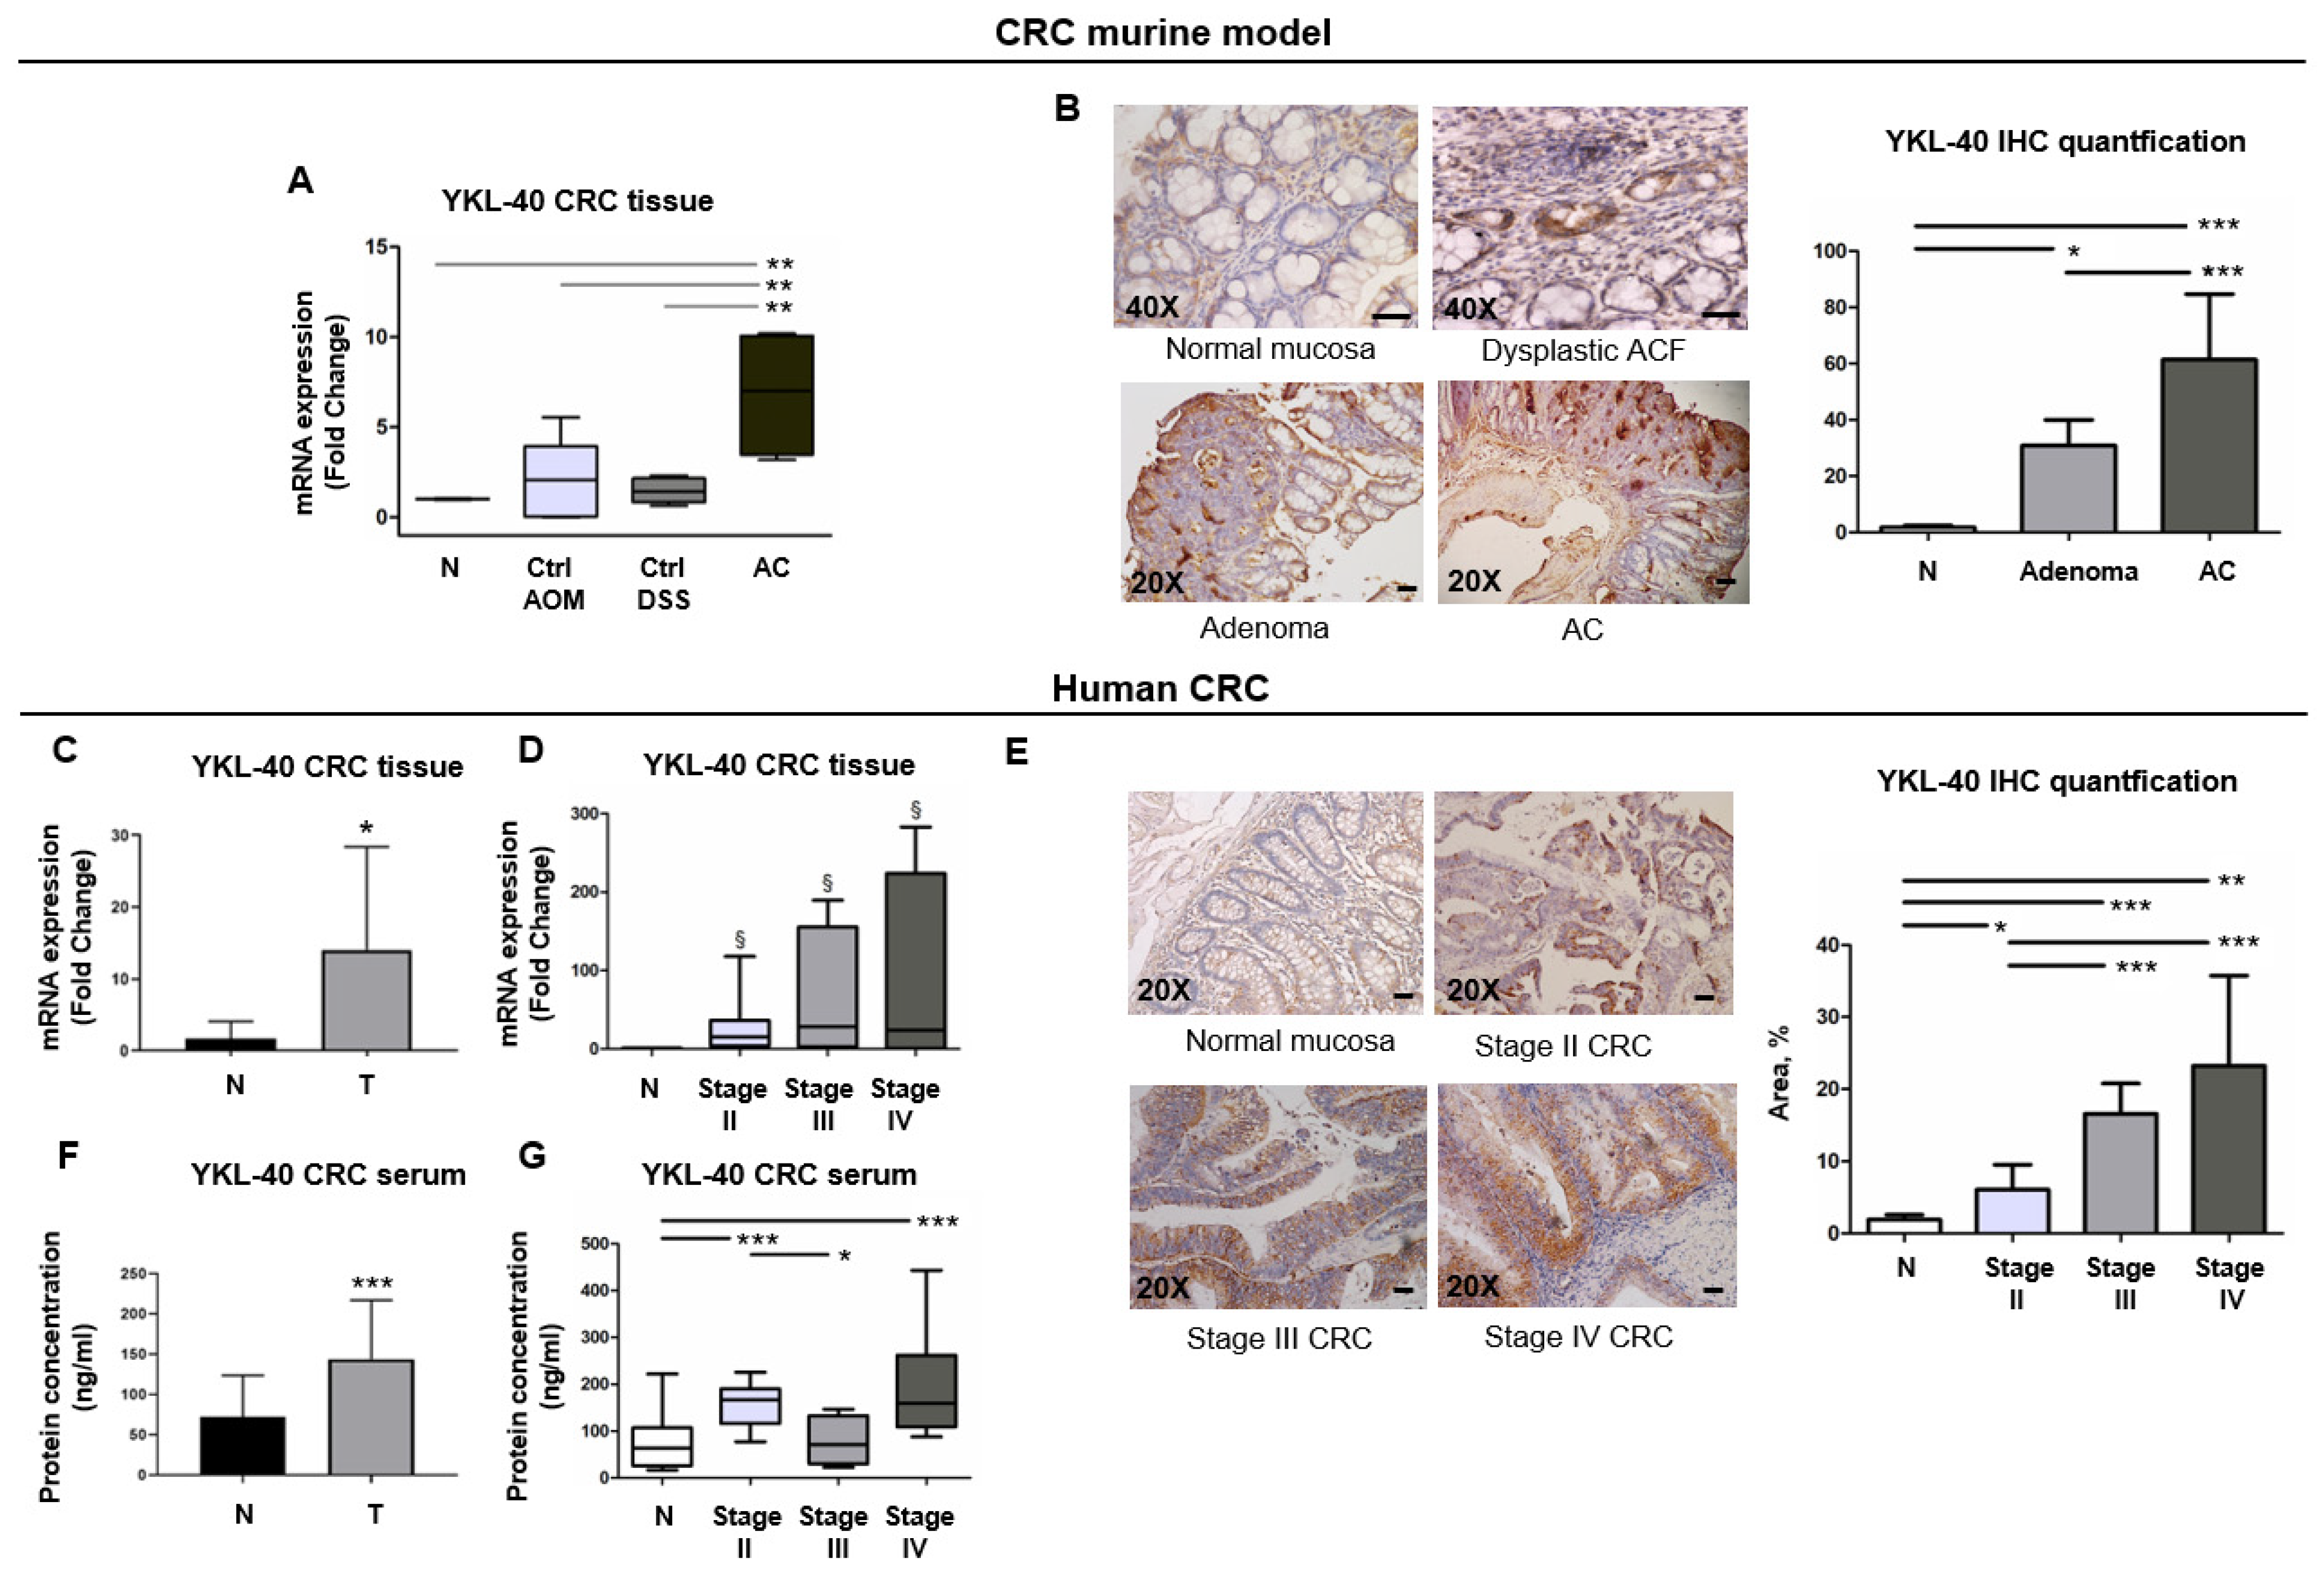
3.4. YKL-40 Is Highly Expressed from ACF to Adenocarcinoma Stages in a CRC Murine Model
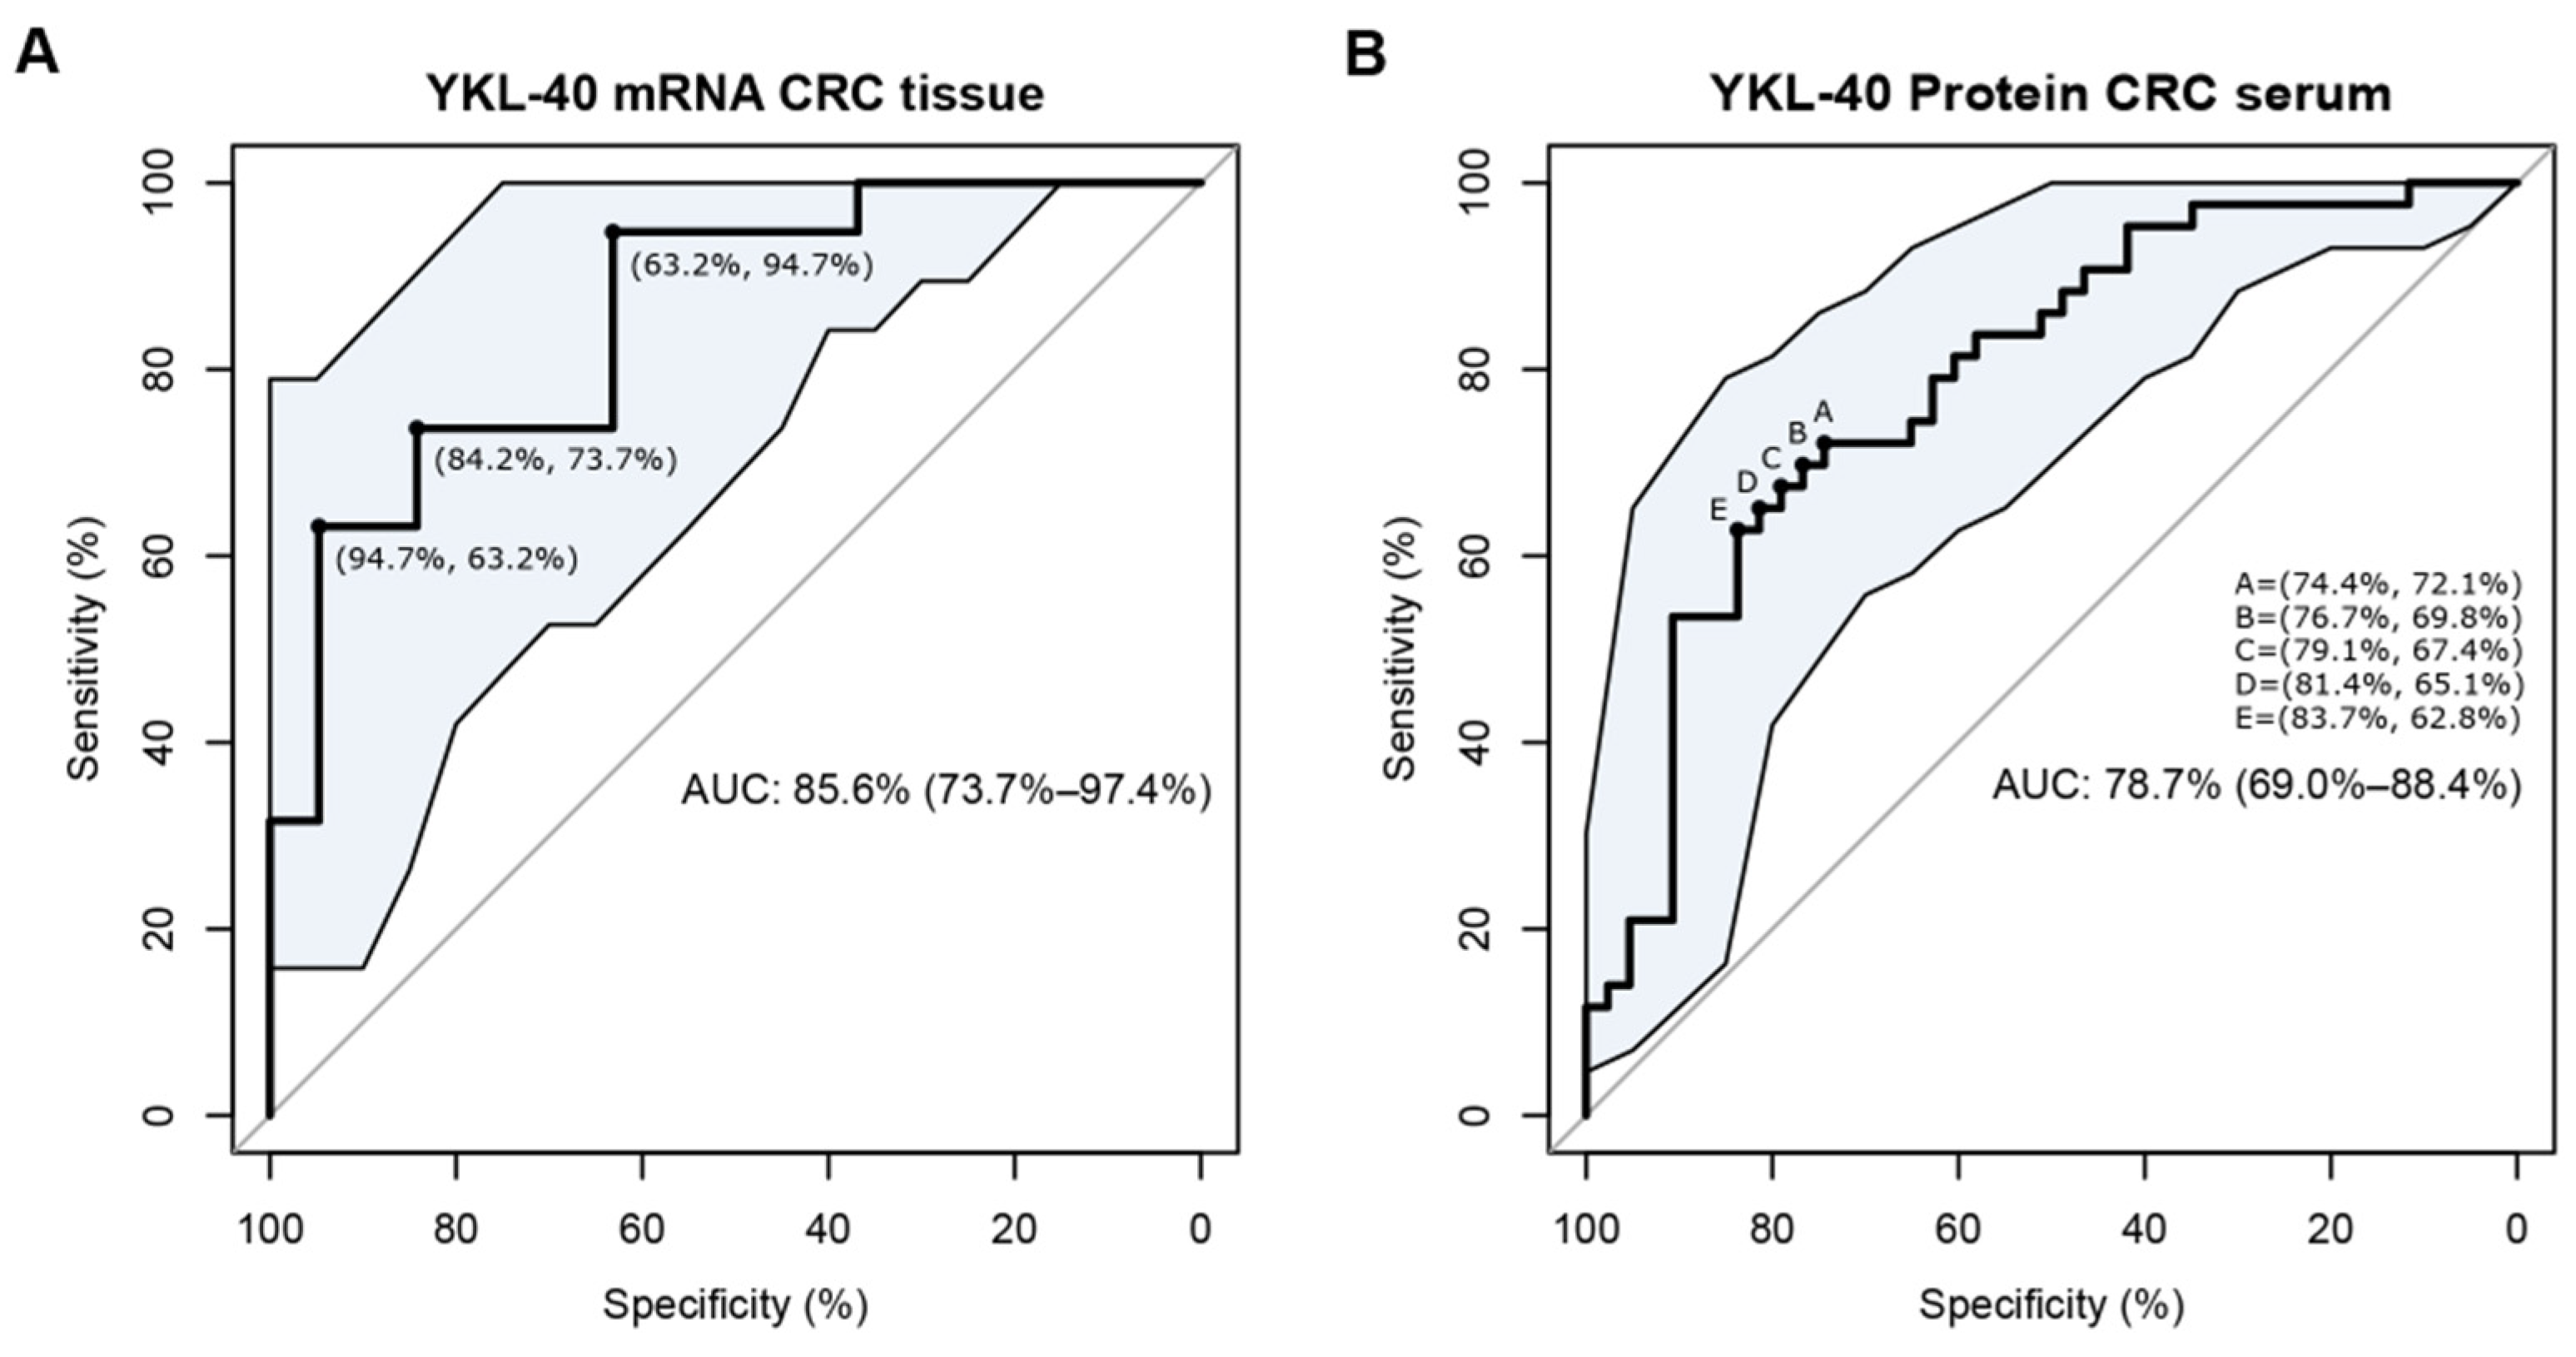
3.5. YKL-40 Is Overexpressed in Cancer Tissues and Sera of Patients with mCRC and Has the Potential to Discriminate CRC Cases from Controls
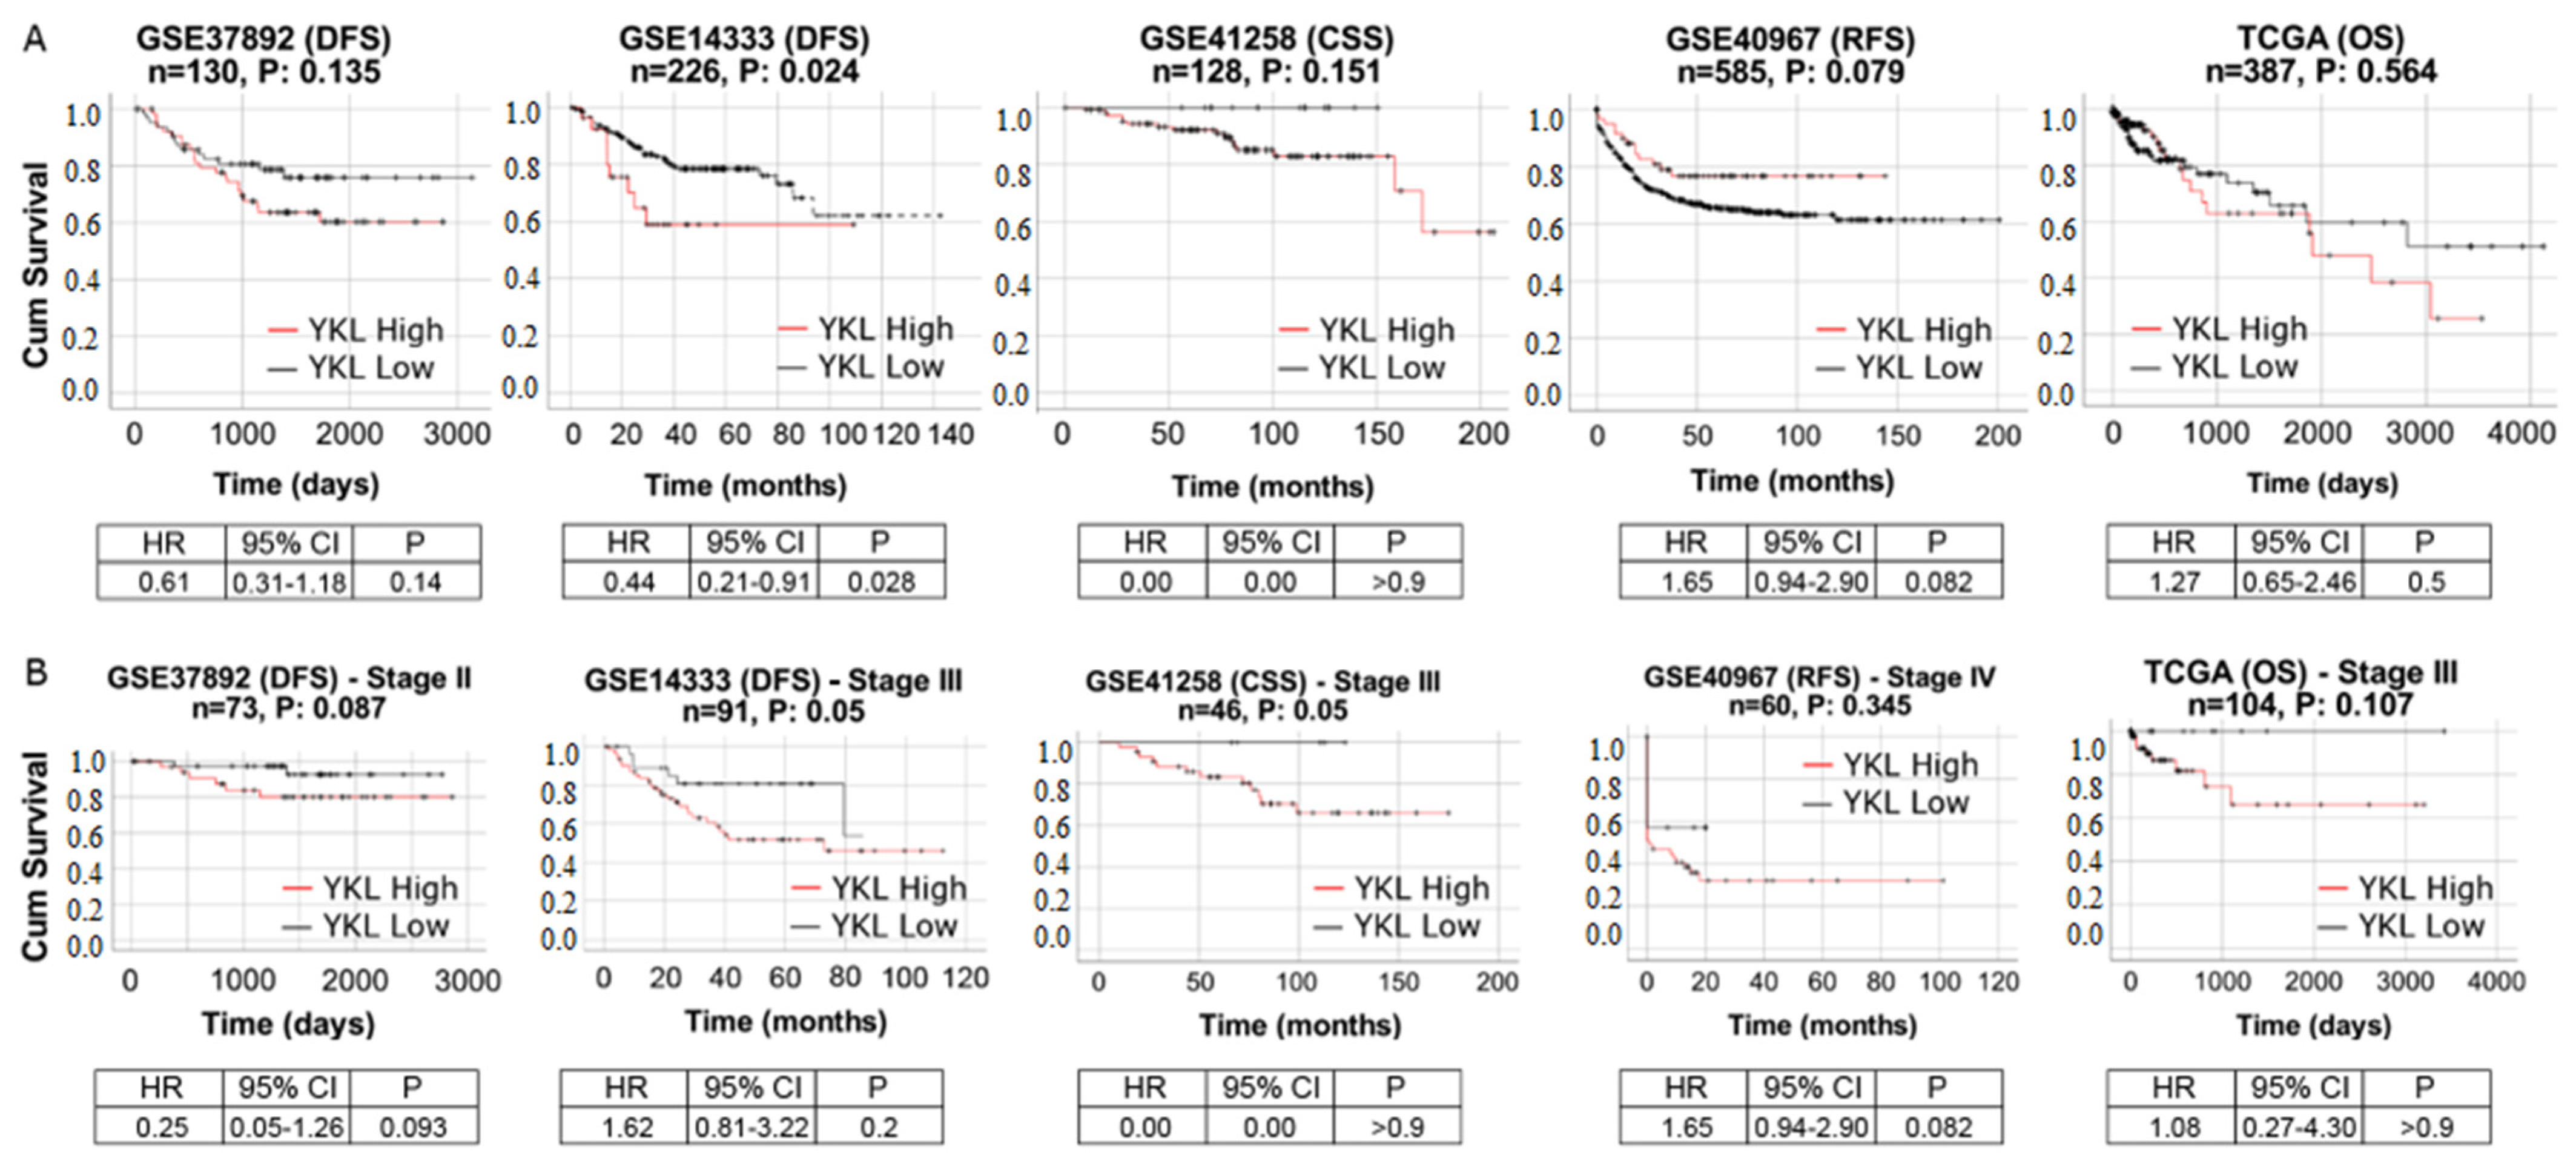
3.6. YKL-40 Shows Prognostic Significance in Patients with mCRC
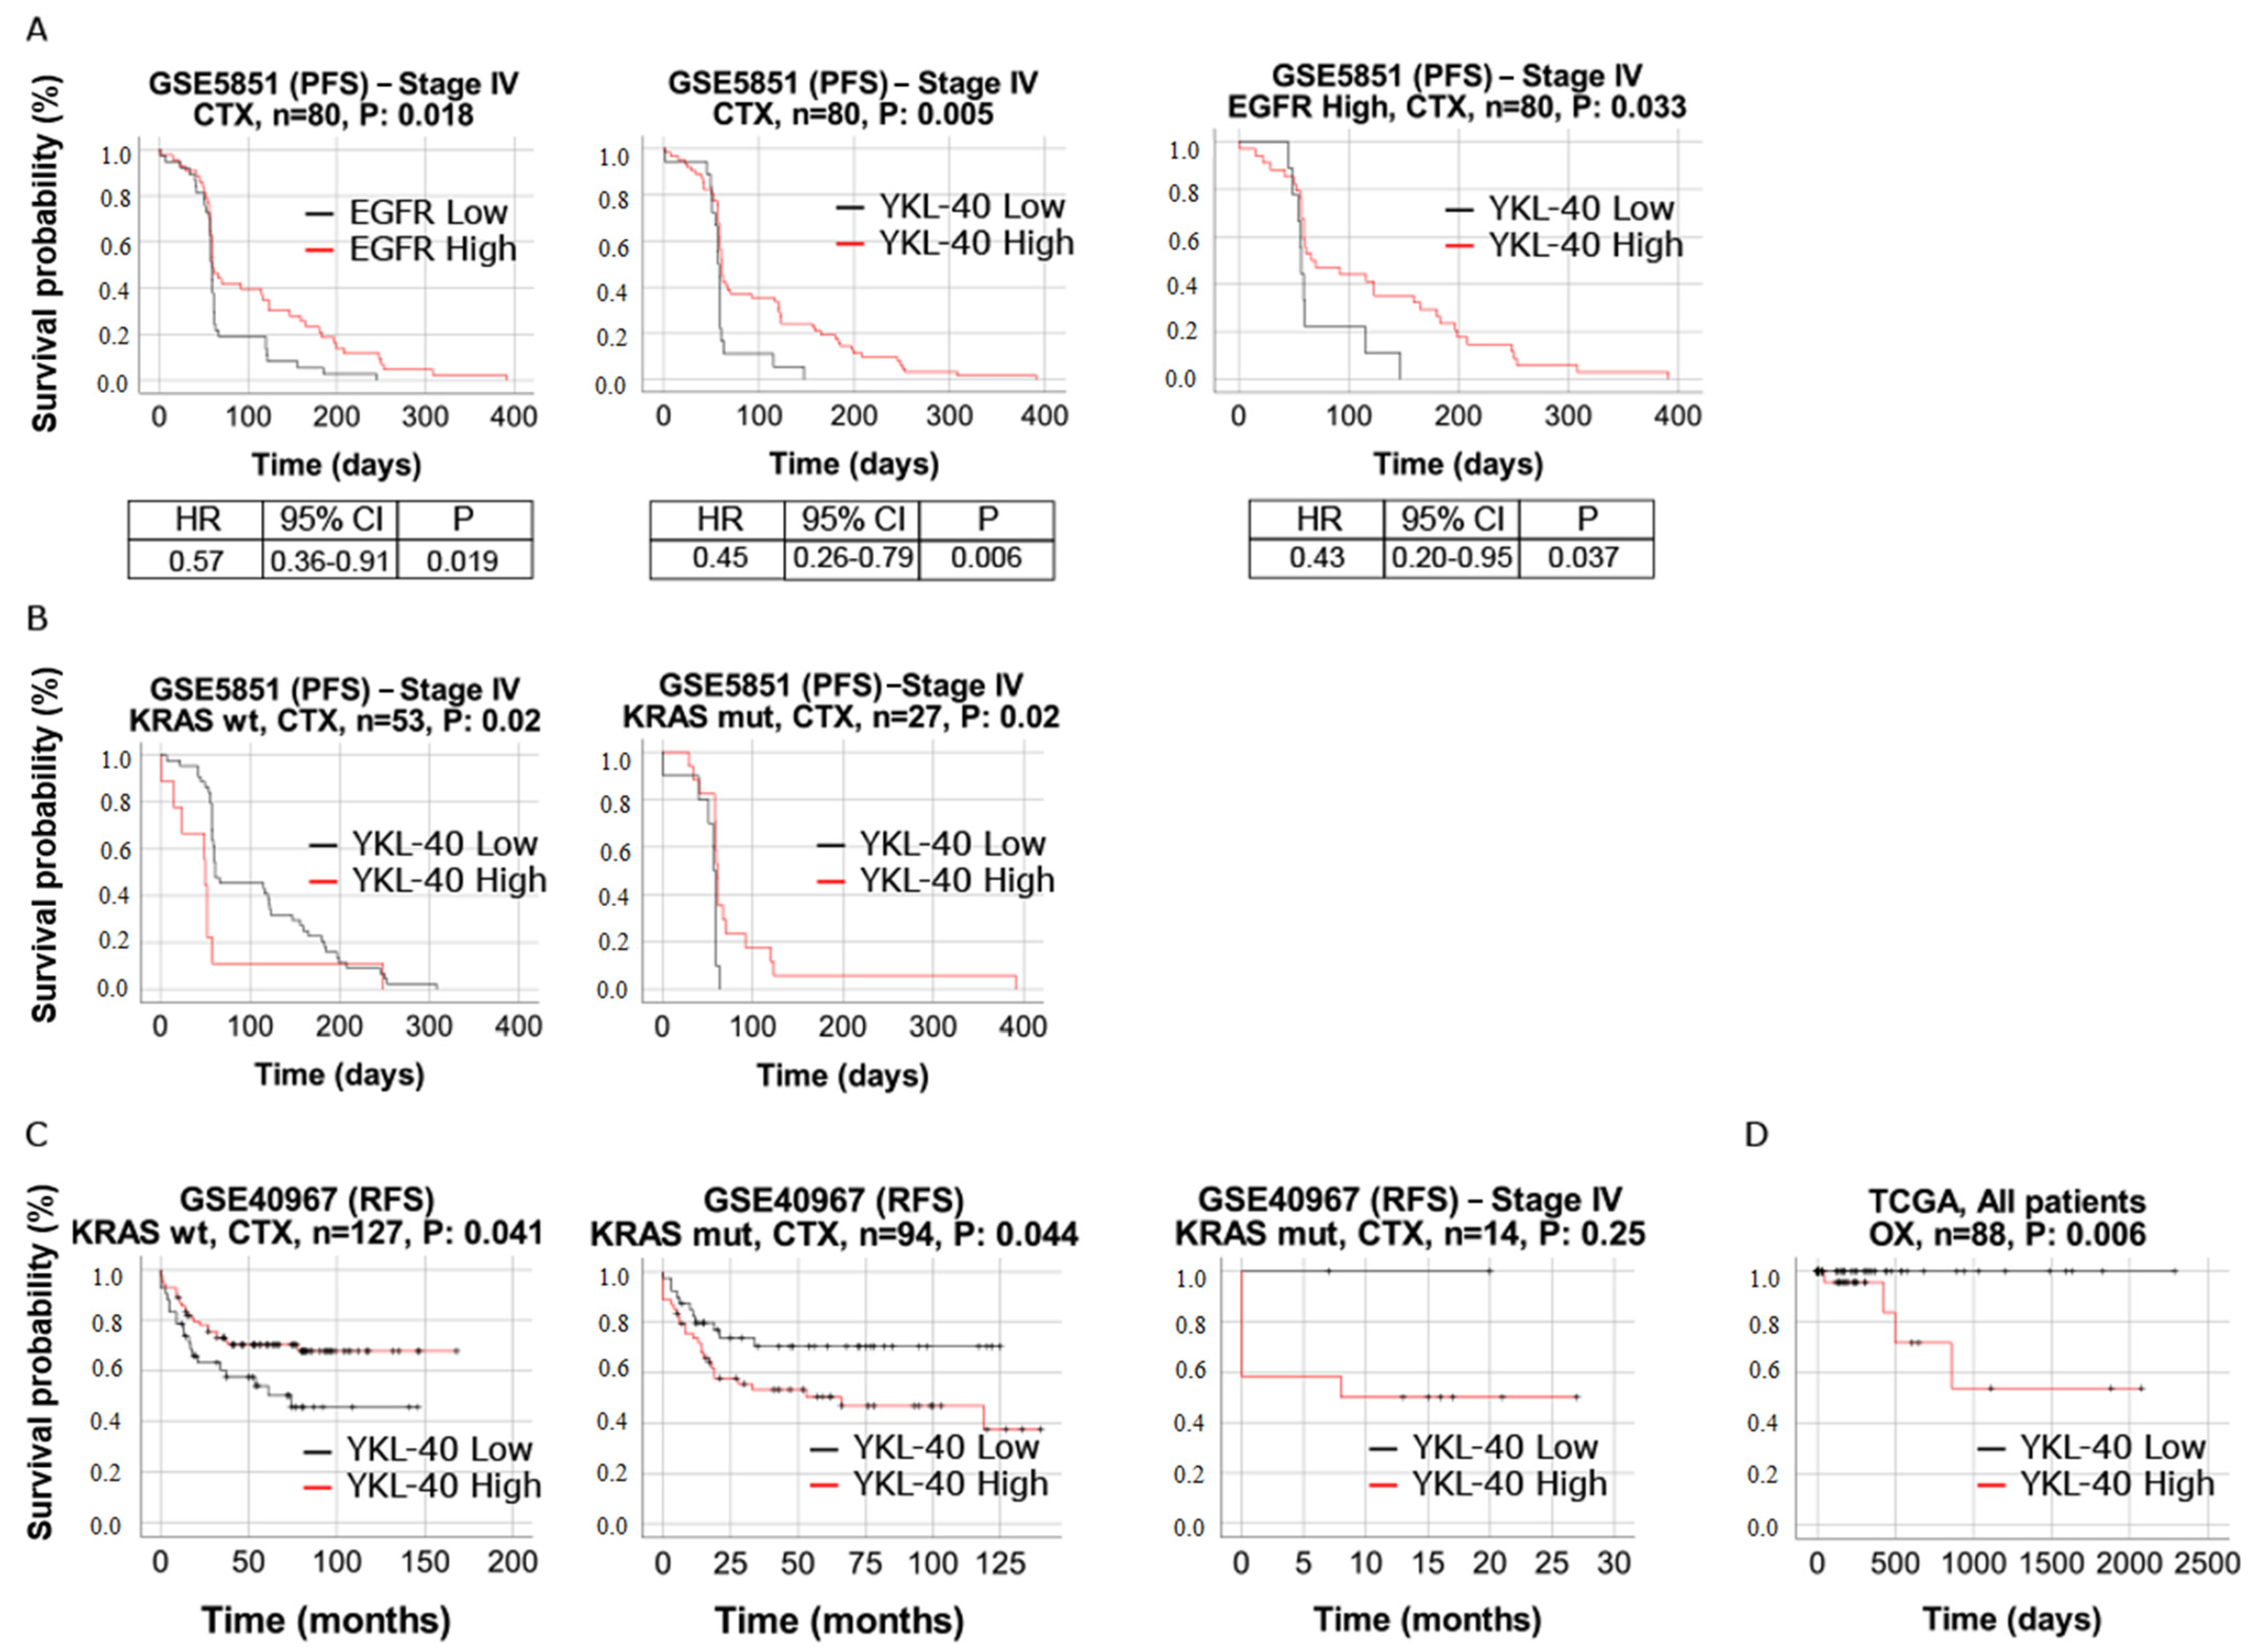
3.7. YKL-40 Shows Predictive Significance in mCRC Patients Treated with Cetuximab and Oxaliplatin
4. Discussion
5. Conclusions
Supplementary Materials
Author Contributions
Funding
Institutional Review Board Statement
Informed Consent Statement
Conflicts of Interest
References
- Rawla, P.; Sunkara, T.; Barsouk, A. Epidemiology of colorectal cancer: Incidence, mortality, survival, and risk factors. Prz. Gastroenterol. 2019, 14, 89–103. [Google Scholar] [CrossRef]
- Keum, N.; Giovannucci, E. Global burden of colorectal cancer: Emerging trends, risk factors and prevention strategies. Nat. Rev. Gastroenterol. Hepatol. 2019, 16, 713–732. [Google Scholar] [CrossRef] [PubMed]
- Zhai, Z.; Yu, X.; Yang, B.; Zhang, Y.; Zhang, L.; Li, X.; Sun, H. Colorectal cancer heterogeneity and targeted therapy: Clinical implications, challenges and solutions for treatment resistance. Semin. Cell Dev. Biol. 2017, 64, 107–115. [Google Scholar] [CrossRef] [PubMed]
- Xie, Y.H.; Chen, Y.X.; Fang, J.Y. Comprehensive review of targeted therapy for colorectal cancer. Signal Transduct. Target Ther. 2020, 5, 22. [Google Scholar] [CrossRef] [PubMed]
- Cutsem, E.V.; Lenz, H.J.; Kohne, C.H.; Heinemann, V.; Tejpar, S.; Melezínek, I.; Beier, F.; Stroh, C.; Rougier, P.; van Krieken, J.H.J.M.; et al. Fluorouracil, leucovorin, and irinotecan plus cetuximab treatment and RAS mutations in colorectal cancer. J. Clin. Oncol. 2015, 33, 692–700. [Google Scholar] [CrossRef]
- Peeters, M.; Karthaus, M.; Rivera, F.; Terwey, J.H.; Douillard, J.Y. Panitumumab in metastatic colorectal cancer: The importance of tumour RAS Status. Drugs 2015, 75, 731–748. [Google Scholar] [CrossRef]
- Bertotti, A.; Papp, E.; Jones, S.; Adleff, V.; Anagnostou, V.; Lupo, B.; Sausen, M.; Phallen, J.; Hruban, C.A.; Tokheim, C.; et al. The genomic landscape of response to EGFR blockade in colorectal cancer. Nature 2015, 526, 263–267. [Google Scholar] [CrossRef]
- Misale, S.; Di Nicolantonio, F.; Sartore-Bianchi, A.; Siena, S.; Bardelli, A. Resistance to anti-EGFR therapy in colorectal cancer: From heterogeneity to convergent evolution. Cancer Discov. 2014, 4, 1269–1280. [Google Scholar] [CrossRef]
- Sorich, M.J.; Wiese, M.D.; Rowland, A.; Kichenadasse, G.; McKinnon, R.A.; Karapetis, C.S. Extended RAS mutations and anti-EGFR monclonal antibody survival benefit in metastatic colorectal cancer: A meta-analysis of randomized, controlled trials. Ann. Oncol. 2015, 26, 13–21. [Google Scholar] [CrossRef]
- Siravegna, G.; Mussolin, B.; Buscarino, M.; Corti, G.; Cassingena, A.; Crisafulli, G.; Ponzetti, A.; Cremolini, C.; Amatu, A.; Lauricella, C.; et al. Clonal evolution and resistance to EGFR blockade in the blood of colorectal cancer patients. Nat. Med. 2015, 21, 795–801. [Google Scholar] [CrossRef]
- Holohan, C.; Van Schaeybroeck, S.; Longley, D.B.; Johnston, P.G. Cancer drug resistance: An evolving paradigm. Nat. Rev. Cancer 2013, 13, 714–726. [Google Scholar] [CrossRef] [PubMed]
- Graves, L.M.; Duncan, J.S.; Whittle, M.C.; Johnson, G.L. The dynamic nature of the kinome. Biochem. J. 2013, 450, 1–8. [Google Scholar] [CrossRef] [PubMed]
- Fuksiewicz, M.; Kotowicz, B.; Rutkowski, A.; Kowalska, M. The matrix metalloproteinase-7 and pro-enzyme of metalloproteinase-1 as a potential marker for patients with rectal cancer without distant metastasis. Tumour Biol. 2015, 36, 3629–3635. [Google Scholar] [CrossRef]
- Shen, A.; Wang, L.; Huang, M.; Sun, J.; Chen, Y.; Shen, Y.-Y.; Yang, X.; Wang, X.; Ding, J.; Geng, M. c-MYC alterations confer therapeutic response and acquired resistance to c-MET inhibitors in MET-addicted cancers. Cancer Res. 2015, 75, 4548–4559. [Google Scholar] [CrossRef]
- Torti, D.; Trusolino, L. Oncogene addiction as a foundational rationale for targeted anti-cancer therapy: Promises and perils. EMBO Mol. Med. 2011, 3, 623–636. [Google Scholar] [CrossRef] [PubMed]
- Elbadawy, M.; Usui, T.; Yamawaki, H.; Sasaki, K. Emerging Roles of C-Myc in Cancer Stem Cell-Related Signaling and Resistance to Cancer Chemotherapy: A Potential Therapeutic Target against Colorectal Cancer. Int. J. Mol. Sci. 2019, 20, 2340. [Google Scholar] [CrossRef] [PubMed]
- Strippoli, A.; Cocomazzi, A.; Basso, M.; Cenci, T.; Ricci, R.; Pierconti, F.; Cassano, A.; Fiorentino, V.; Barone, C.; Bria, E.; et al. c-MYC Expression Is a Possible Keystone in the Colorectal Cancer Resistance to EGFR Inhibitors. Cancers 2020, 12, 638. [Google Scholar] [CrossRef] [PubMed]
- Zheng, R.; Gao, D.; He, T.; Zhang, M.; Zhang, X.; Linghu, E.; Wei, L.; Guo, M. Methylation of DIRAS1 promotes colorectal cancer progression and may serve as a marker for poor prognosis. Clin. Epigenet. 2017, 9, 50. [Google Scholar] [CrossRef]
- Picardo, F.; Romanelli, A.; Muinelo-Romay, L.; Mazza, T.; Fusilli, C.; Parrella, P.; Barbazán, J.; Lopez-López, R.; Barbano, R.; De Robertis, M.; et al. Diagnostic and Prognostic Value of B4GALT1 Hypermethylation and Its Clinical Significance as a Novel Circulating Cell-Free DNA Biomarker in Colorectal Cancer. Cancers 2019, 11, 1598. [Google Scholar] [CrossRef]
- Poeta, M.L.; Massi, E.; Parrella, P.; Pellegrini, P.; De Robertis, M.; Copetti, M.; Rabitti, C.; Perrone, G.; Muda, A.O.; Molinari, F.; et al. Aberrant promoter methylation of beta-1,4 galactosyltransferase 1 as potential cancer-specific biomarker of colorectal tumors. Genes Chromosomes Cancer 2012, 51, 1133–1143. [Google Scholar] [CrossRef]
- De Robertis, M.; Poeta, M.L.; Signori, E.; Fazio, V.M. Current understanding and clinical utility of miRNAs regulation of colon cancer stem cells. Semin. Cancer Biol. 2018, 53, 232–247. [Google Scholar] [CrossRef] [PubMed]
- De Robertis, M.; Mazza, T.; Fusilli, C.; Loiacono, L.; Poeta, M.L.; Sanchez, M.; Massi, E.; Lamorte, G.; Diodoro, M.G.; Pescarmona, E.; et al. EphB2 stem-related and EphA2 progression-related miRNA-based networks in progressive stages of CRC evolution: Clinical significance and potential miRNA drivers. Mol. Cancer 2018, 17, 169. [Google Scholar] [CrossRef] [PubMed]
- Pugh, S.; Thiébaut, R.; Bridgewater, J.; Grisoni, M.-L.; Moutasim, K.; Rousseau, F.; Thomas, G.J.; Griffiths, G.; Liebaert, F.; Primrose, J.; et al. Association between miR-31-3p expression and cetuximab efficacy in patients with KRAS wild-type metastatic colorectal cancer: A post-hoc analysis of the New EPOC trial. Oncotarget 2017, 8, 93856–93866. [Google Scholar] [CrossRef] [PubMed]
- Gomes, S.E.; Simões, A.E.; Pereira, D.M.; Castro, R.E.; Rodrigues, C.M.; Borralho, P.M. miR-143 or miR-145 overexpression increases cetuximab-mediated antibody-dependent cellular cytotoxicity in human colon cancer cells. Oncotarget 2016, 7, 9368–9387. [Google Scholar] [CrossRef]
- Kazakova, M.H.; Sarafian, V.S. YKL-40—A novel biomarker in clinical practice? Folia Med. 2009, 1, 5–14. [Google Scholar]
- Johansen, J.S.; Jensen, B.V.; Roslind, A.; Price, P.A. Is YKL-40 a new therapeutic target in cancer? Expert Opin. Ther. Targets 2007, 11, 219–234. [Google Scholar] [CrossRef] [PubMed]
- Rehli, M.; Krause, S.W.; Andreesen, R. Molecular characterization of the gene for human cartilage gp-39(CHI3L1), a member of the chitinase protein family and marker for late stages of macrophage differentiation. Genomics 1997, 43, 221–225. [Google Scholar] [CrossRef]
- Schultz, N.A.; Johansen, J.S. YKL-40-A protein in the field of translational medicine: A role as a biomarker in cancer patients? Cancers 2010, 2, 1453–1491. [Google Scholar] [CrossRef]
- Lee, C.M.; He, C.H.; Nour, A.M.; Zhou, Y.; Ma, B.; Park, J.W.; Kim, K.H.; Cruz, C.D.; Sharma, L.; Nasr, M.L.; et al. IL-13Ralpha2 uses TMEM219 in chitinase 3-like-1-induced signalling and effector responses. Nat. Commun. 2016, 7, 12752. [Google Scholar] [CrossRef]
- Geng, B.; Pan, J.; Zhao, T.; Ji, J.; Zhang, C.; Che, Y.; Yang, J.; Shi, H.; Li, J.; Zhou, H.; et al. Chitinase 3-like 1-CD44 interaction promotes metastasis and epithelial-to-mesenchymal transition through beta-catenin/Erk/Akt signaling in gastric cancer. J. Exp. Clin. Cancer Res. 2018, 37, 208. [Google Scholar] [CrossRef]
- Zhao, T.; Su, Z.; Li, Y.; Zhang, X.; You, Q. Chitinase-3 like-protein-1 function and its role in diseases. Signal Transduct. Target Ther. 2020, 5, 201. [Google Scholar] [CrossRef] [PubMed]
- Dichev, V.; Mehterov, N.H.; Kazakova, M.H.; Karalilova, R.V.; Batalov, A.Z.; Sarafian, V.S. Serum protein levels of YKL-40 and plasma miR-214 expression in patients with systemic sclerosis. Mod. Rheumatol. 2021, 31, 1010–1018. [Google Scholar] [CrossRef] [PubMed]
- Dichev, V.; Kazakova, M.; Sarafian, V. YKL-40 and neuron-specific enolase in neurodegeneration and neuroinflammation. Rev. Neurosci. 2020, 31, 539–553. [Google Scholar] [CrossRef]
- Roslind, A.; Johansen, J.S. YKL-40: A novel marker shared by chronic inflammation and oncogenic transformation. Methods Mol. Biol. 2009, 511, 159–184. [Google Scholar] [PubMed]
- Bhat, K.P.; Pelloski, C.E.; Zhang, Y.; Kim, S.H.; deLaCruz, C.; Rehli, M.; Aldape, K.D. Selective repression of YKL-40 by NF-kappaB in glioma cell lines involves recruitment of histone deacetylase-1 and -2. FEBS Lett. 2008, 582, 3193–3200. [Google Scholar] [CrossRef] [PubMed]
- Shao, R.; Francescone, R.; Ngernyuang, N.; Bentley, B.; Taylor, S.L.; Moral, L.; Yan, W. Anti-YKL-40 antibody and ionizing irradiation synergistically inhibit tumor vascularization and malignancy in glioblastoma. Carcinogenesis 2014, 35, 373–382. [Google Scholar] [CrossRef] [PubMed]
- Ku, B.M.; Lee, Y.K.; Ryu, J.; Jeong, J.Y.; Choi, J.; Eun, K.M.; Shin, H.Y.; Kim, D.G.; Hwang, E.M.; Yoo, J.C.; et al. CHI3L1 (YKL-40) is expressed in human gliomas and regulates the invasion, growth and survival of glioma cells. Int. J. Cancer 2011, 128, 1316–1326. [Google Scholar] [CrossRef]
- Kastrup, J. Can YKL-40 be a new inflammatory biomarker in cardiovascular disease? Immunobiology 2012, 217, 483–491. [Google Scholar] [CrossRef]
- Eurich, K.; Segawa, M.; Toei-Shimizu, S.; Mizoguchi, E. Potential role of chitinase 3-like-1 in inflammation-associated carcinogenic changes of epithelial cells. World J. Gastroenterol. 2009, 15, 5249–5259. [Google Scholar] [CrossRef]
- Johansen, J.S.; Christensen, I.J.; Jørgensen, L.N.; Olsen, J.; Rahr, H.B.; Nielsen, K.T.; Laurberg, S.; Brünner, N.; Nielsen, H.J. Serum YKL-40 in risk assessment for colorectal cancer: A prospective study of 4,496 subjects at risk of colorectal cancer. Cancer Epidemiol. Biomarkers Prev. 2015, 24, 621–626. [Google Scholar] [CrossRef]
- Zeeberg, K.; Cardone, R.A.; Greco, M.R.; Saccomano, M.; Nøhr-Nielsen, A.; Alves, F.; Pedersen, S.F.; Reshkin, S.J. Assessment of different 3D culture systems to study tumor phenotype and chemosensitivity in pancreatic ductal adenocarcinoma. Int. J. Oncol. 2016, 49, 243–252. [Google Scholar] [CrossRef] [PubMed][Green Version]
- Boivin, G.P.; Washington, K.; Yang, K.; Ward, J.M.; Pretlow, T.P.; Russell, R.; Besselsen, D.G.; Godfrey, V.L.; Doetschman, T.; Dove, W.F.; et al. Pathology of mouse models of intestinal cancer: Consensus report and recommendations. Gastroenterology 2003, 124, 762–777. [Google Scholar] [CrossRef] [PubMed]
- Rasband, W. ImageJ; US National Institutes of Health: Bethesda, MD, USA, 2016. Available online: https://imagej.nih.gov/ij/ (accessed on 30 November 2020).
- Davis, S.; Meltzer, P. GEOquery: A bridge between the Gene Expression Omnibus (GEO) and BioConductor. Bioinformatics 2007, 14, 1846–1847. [Google Scholar] [CrossRef] [PubMed]
- Grossman, R.L.; Heath, A.P.; Ferretti, V.; Varmus, H.E.; Lowy, D.R.; Kibbe, W.A.; Staudt, L.M. Toward a Shared Vision for Cancer Genomic Data. N. Engl. J. Med. 2016, 375, 1109–1112. [Google Scholar] [CrossRef] [PubMed]
- Jorissen, R.N.; Gibbs, P.; Christie, M.; Prakash, S.; Lipton, L.; Desai, J.; Kerr, D.; Aaltonen, L.A.; Arango, D.; Kruhøffer, M.; et al. Metastasis-associated gene expression changes predict poor outcomes in patients with dukes stage B and C colorectal cancer. Clin. Cancer Res. 2009, 15, 7642–7651. [Google Scholar] [CrossRef]
- Smith, J.J.; Deane, N.G.; Wu, F.; Merchant, N.B.; Zhang, B.; Jiang, A.; Lu, P.; Johnson, J.C.; Schmidt, C.; Bailey, C.E.; et al. Experimentally derived metastasis gene expression profile predicts recurrence and death in patients with colon cancer. Gastroenterology 2010, 138, 958–968. [Google Scholar] [CrossRef]
- Sheffer, M.; Bacolod, M.D.; Zuk, O.; Giardina, S.F.; Pincas, H.; Barany, F.; Paty, P.B.; Gerald, W.L.; Notterman, D.A.; Domany, E. Association of survival and disease progression with chromosomal instability: A genomic exploration of colorectal cancer. Proc. Natl. Acad. Sci. USA 2009, 106, 7131–7136. [Google Scholar] [CrossRef]
- Marisa, L.; de Reyniès, A.; Duval, A.; Selves, J.; Gaub, M.P.; Vescovo, L.; Etienne-Grimaldi, M.-C.; Schiappa, R.; Guenot, D.; Ayadi, M.; et al. Gene expression classification of colon cancer into molecular subtypes: Characterization, validation, and prognostic value. PLoS Med. 2013, 10, e1001453. [Google Scholar] [CrossRef]
- Khambata-Ford, S.; Garrett, C.R.; Meropol, N.J.; Basik, M.; Harbison, C.T.; Wu, S.; Wong, T.W.; Huang, X.; Takimoto, C.H.; Godwin, A.K.; et al. Expression of epiregulin and amphiregulin and K-ras mutation status predict disease control in metastatic colorectal cancer patients treated with cetuximab. J. Clin. Oncol. 2007, 25, 3230–3237. [Google Scholar] [CrossRef]
- The Cancer Genome Atlas Project. Comprehensive molecular characterization of human colon and rectal cancer. Nature 2012, 487, 330–337. [Google Scholar] [CrossRef]
- Liu, K.; Jin, M.; Ye, S.; Yan, S. CHI3L1 promotes proliferation and improves sensitivity to cetuximab in colon cancer cells by down-regulating p53. J. Clin. Lab. Anal. 2020, 34, e23026. [Google Scholar] [CrossRef] [PubMed]
- Malinda, K.M.; Ponce, L.; Kleinman, H.K.; Shackelton, L.M.; Millis, A.J. Gp38k, a protein synthesized by vascular smooth muscle cells, stimulates directional migration of human umbilical vein endothelial cells. Exp. Cell Res. 1999, 250, 168–173. [Google Scholar] [CrossRef] [PubMed]
- Hao, H.; Wang, L.; Chen, H.; Xie, L.; Bai, T.; Liu, H.; Wang, D. YKL-40 promotes the migration and invasion of prostate cancer cells by regulating epithelial mesenchymal transition. Am. J. Transl. Res. 2017, 15, 3749–3757. [Google Scholar]
- Park, K.R.; Yun, H.M.; Yoo, K.; Ham, Y.W.; Han, S.B.; Hong, J.T. Chitinase 3 like 1 suppresses the stability and activity of p53 to promote lung tumorigenesis. Cell Commun. Signal 2020, 18, 5. [Google Scholar] [CrossRef] [PubMed]
- Feodorova, Y.; Tashkova, D.; Simitchiev, K.; Todorov, A.; Kostov, G.; Dimov, R.; Sarafian, V. Dependence of YKL-40 mRNA tissue levels on KRAS mutation status in colorectal cancer–preliminary results. Int. J. Surg. Med. 2015, 1, 43–47. [Google Scholar] [CrossRef]
- Recklies, A.D.; White, C.; Ling, H. The chitinase 3-like protein human cartilage glycoprotein 39 (HC-gp39) stimulates proliferation of human connective-tissue cells and activates both extracellular signal-regulated kinase- and protein kinase beta-mediated signalling pathways. Biochem. J. 2002, 365, 119–126. [Google Scholar] [CrossRef]
- Ling, H.; Recklies, A.D. The chitinase 3-like protein human cartilage glycoprotein 39 inhibits cellular responses to the inflammatory cytokines interleukin-1 and tumour necrosis factor-a. Biochem. J. 2004, 380, 651–659. [Google Scholar] [CrossRef]
- Fang, J.Y.; Richardson, B.C. The MAPK signalling pathways and colorectal cancer. Lancet Oncol. 2005, 6, 322–327. [Google Scholar] [CrossRef]
- Larue, L.; Bellacosa, A. Epithelial-mesenchymal transition in development and cancer: Role of phosphatidylinositol 3′ kinase/AKT pathways. Oncogene 2005, 24, 7443–7454. [Google Scholar] [CrossRef]
- Xu, W.; Yang, Z.; Lu, N. A new role for the PI3K/Akt signaling pathway in the epithelial-mesenchymal transition. Cell Adhes. Migr. 2015, 9, 317–324. [Google Scholar] [CrossRef]
- Tang, H.; Sun, Y.; Shi, Z.; Huang, H.; Fang, Z.; Chen, J.; Xiu, Q.; Li, B. YKL-40 induces IL-8 expression from bronchial epithelium via MAPK (JNK and ERK) and NF-kappaB pathways, causing bronchial smooth muscle proliferation and migration. J. Immunol. 2013, 190, 438–446. [Google Scholar] [CrossRef] [PubMed]
- Hao, H.; Chen, H.; Xie, L.; Liu, H. YKL-40 promotes invasion and metastasis of bladder cancer by regulating epithelial mesenchymal transition. Ann. Med. 2021, 53, 1170–1178. [Google Scholar] [CrossRef] [PubMed]
- Hao, H.; Chen, H.; Xie, L.; Liu, H.; Wang, D. LncRNA KCNQ1OT1 Promotes Proliferation, Invasion and Metastasis of Prostate Cancer by Regulating miR-211-5p/CHI3L1 Pathway. Onco. Targets Ther. 2021, 14, 1659–1671. [Google Scholar] [CrossRef]
- Jefri, M.; Huang, Y.N.; Huang, W.C.; Tai, C.S.; Chen, W.L. YKL-40 regulated epithelial-mesenchymal transition and migration/invasion enhancement in non-small cell lung cancer. BMC Cancer 2015, 5, 590. [Google Scholar] [CrossRef] [PubMed]
- Chen, C.C.; Llado, V.; Eurich, K.; Tran, H.T.; Mizoguchi, E. Carbohydrate-binding motif in chitinase 3-like 1 (CHI3L1/YKL-40) specifically activates Akt signaling pathway in colonic epithelial cells. Clin. Immunol. 2011, 140, 268–275. [Google Scholar] [CrossRef] [PubMed]
- Dolin, T.G.; Christensen, I.J.; Johansen, A.Z.; Nielsen, H.J.; Jakobsen, H.L.; Klein, M.F.; Lund, C.M.; Bojesen, S.E.; Nielsen, D.L.; Jensen, B.V.; et al. Pre- and Perioperative Inflammatory Biomarkers in Older Patients Resected for Localized Colorectal Cancer: Associations with Complications and Prognosis. Cancers 2021, 14, 161. [Google Scholar] [CrossRef]
- Libreros, S.; Garcia-Areas, R.; Shibata, Y.; Carrio, R.; Torroella-Kouri, M.; Iragavarapu-Charyulu, V. Induction of proinflammatory mediators by CHI3L1 is reduced by chitin treatment: Decreased tumor metastasis in a breast cancer model. Int. J. Cancer 2012, 131, 377–386. [Google Scholar] [CrossRef]
- Tarpgaard, L.S.; Guren, T.K.; Glimelius, B.; Christensen, I.J.; Pfeiffer, P.; Kure, E.H.; Sorbye, H.; Ikdahl, T.; Yilmaz, M.; Johansen, J.S.; et al. Plasma YKL-40 in patients with metastatic colorectal cancer treated with first line oxaliplatin-based regimen with or without cetuximab: RESULTS from the NORDIC VII Study. PLoS ONE 2014, 9, e87746. [Google Scholar] [CrossRef]
- Jeet, V.; Tevz, G.; Lehman, M.; Hollier, B.; Nelson, C. Elevated YKL40 is associated with advanced prostate cancer (PCa) and positively regulates invasion and migration of PCa cells. Endocr. Relat. Cancer 2014, 21, 723–737. [Google Scholar] [CrossRef]
- Johansen, J.S. Changes of biochemical markers of bone turnover and YKL-40 following hormonal treatment for metastatic prostate cancer are related to survival. Clin. Cancer Res. 2007, 13, 3244–3249. [Google Scholar] [CrossRef]
- Shao, R.; Cao, Q.J.; Arenas, R.B.; Bigelow, C.; Bentley, B.; Yan, W. Breast cancer expression of YKL-40 correlates with tumour grade, poor differentiation, and other cancer markers. Br. J. Cancer 2011, 105, 1203–1209. [Google Scholar] [CrossRef] [PubMed]
- Kazakova, M.H.; Staneva, D.N.; Koev, G.; Staikov, D.G.; Mateva, N.; Timonov, P.T.; Miloshev, G.A.; Sarafian, V.S. Protein and mRNA levels of YKL-40 in high-grade glioma. Folia Biol. 2014, 60, 261–267. [Google Scholar]
- Urbanavičiūtė, R.; Zabitaitė, R.; Kriščiukaitis, A.; Deltuva, V.P.; Skiriutė, D. Serum protein triplet TGF-β1, TIMP-1, and YKL-40 serve as diagnostic and prognostic profile for astrocytoma. Sci. Rep. 2021, 11, 13100. [Google Scholar] [CrossRef]
- Johansen, J.S.; Jensen, B.V.; Roslind, A.; Nielsen, D.; Price, P.A. Serum YKL-40, a new prognostic biomarker in cancer patients? Cancer Epidemiol. Biomarkers Prev. 2006, 15, 194–202. [Google Scholar] [CrossRef] [PubMed]
- Brand, T.M.; Iida MWheeler, D.L. Molecular mechanisms of resistance to the EGFR monoclonal antibody cetuximab. Cancer Biol. Ther. 2011, 11, 777–792. [Google Scholar] [CrossRef]
- Cox, A.D.; Der, C.J. Ras history: The saga continues. Small GTPases 2010, 1, 2–27. [Google Scholar] [CrossRef]


Publisher’s Note: MDPI stays neutral with regard to jurisdictional claims in published maps and institutional affiliations. |
© 2022 by the authors. Licensee MDPI, Basel, Switzerland. This article is an open access article distributed under the terms and conditions of the Creative Commons Attribution (CC BY) license (https://creativecommons.org/licenses/by/4.0/).
Share and Cite
De Robertis, M.; Greco, M.R.; Cardone, R.A.; Mazza, T.; Marzano, F.; Mehterov, N.; Kazakova, M.; Belev, N.; Tullo, A.; Pesole, G.; et al. Upregulation of YKL-40 Promotes Metastatic Phenotype and Correlates with Poor Prognosis and Therapy Response in Patients with Colorectal Cancer. Cells 2022, 11, 3568. https://doi.org/10.3390/cells11223568
De Robertis M, Greco MR, Cardone RA, Mazza T, Marzano F, Mehterov N, Kazakova M, Belev N, Tullo A, Pesole G, et al. Upregulation of YKL-40 Promotes Metastatic Phenotype and Correlates with Poor Prognosis and Therapy Response in Patients with Colorectal Cancer. Cells. 2022; 11(22):3568. https://doi.org/10.3390/cells11223568
Chicago/Turabian StyleDe Robertis, Mariangela, Maria Raffaella Greco, Rosa Angela Cardone, Tommaso Mazza, Flaviana Marzano, Nikolay Mehterov, Maria Kazakova, Nikolay Belev, Apollonia Tullo, Graziano Pesole, and et al. 2022. "Upregulation of YKL-40 Promotes Metastatic Phenotype and Correlates with Poor Prognosis and Therapy Response in Patients with Colorectal Cancer" Cells 11, no. 22: 3568. https://doi.org/10.3390/cells11223568
APA StyleDe Robertis, M., Greco, M. R., Cardone, R. A., Mazza, T., Marzano, F., Mehterov, N., Kazakova, M., Belev, N., Tullo, A., Pesole, G., Sarafian, V., & Signori, E. (2022). Upregulation of YKL-40 Promotes Metastatic Phenotype and Correlates with Poor Prognosis and Therapy Response in Patients with Colorectal Cancer. Cells, 11(22), 3568. https://doi.org/10.3390/cells11223568