

Genotype-by-Environment Interaction Analysis of Metabolites in Pearl Millet Genotypes with High Concentrations of Slowly Digestible and Resistant Starch in Their Grains

 ,
,  ,
,  and
and 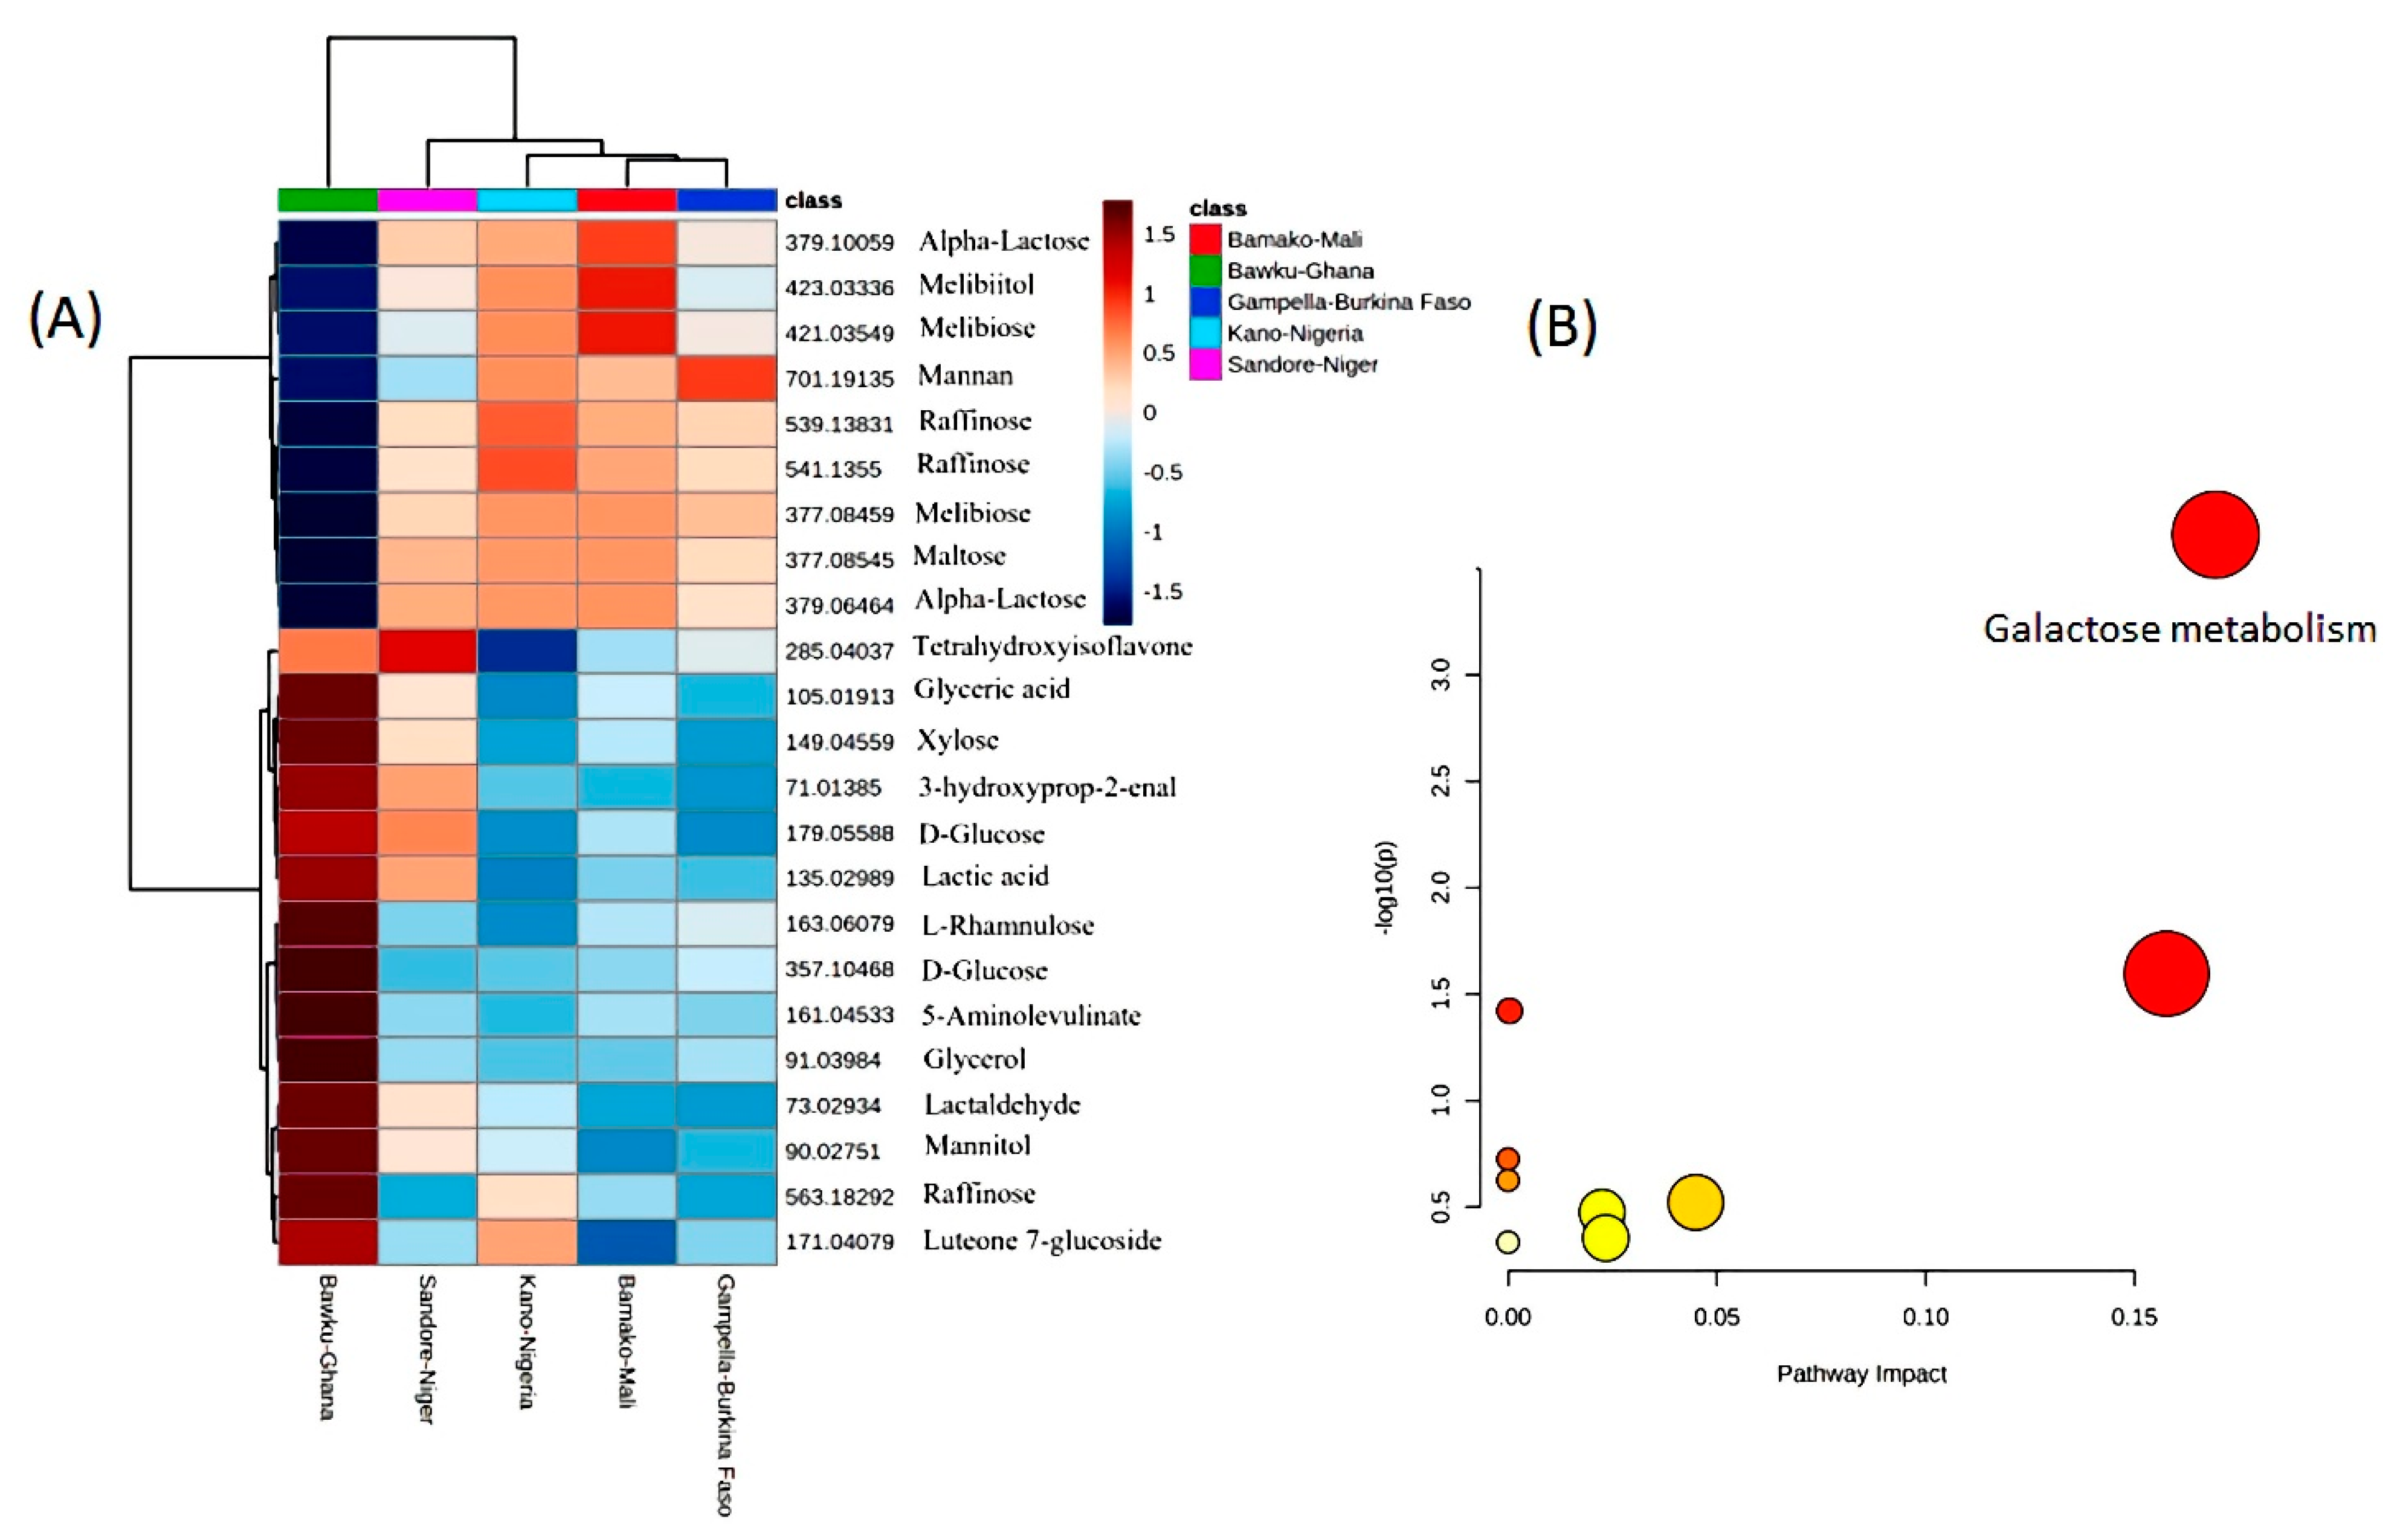
Abstract
1. Introduction
2. Materials and Methods
2.1. Experimental Material, Field Trials, and Data Collection
2.2. Metabolite Fingerprinting
2.3. Statistical Analysis for Phenotypic Variance and Heritability
2.4. Additive Main Effects and Multiplicative Interaction Model
2.5. Genotype plus Genotype-by-Environment Model on Multi-Environment Factor
2.6. Estimation of AMMI- and BLUP-Based Stability
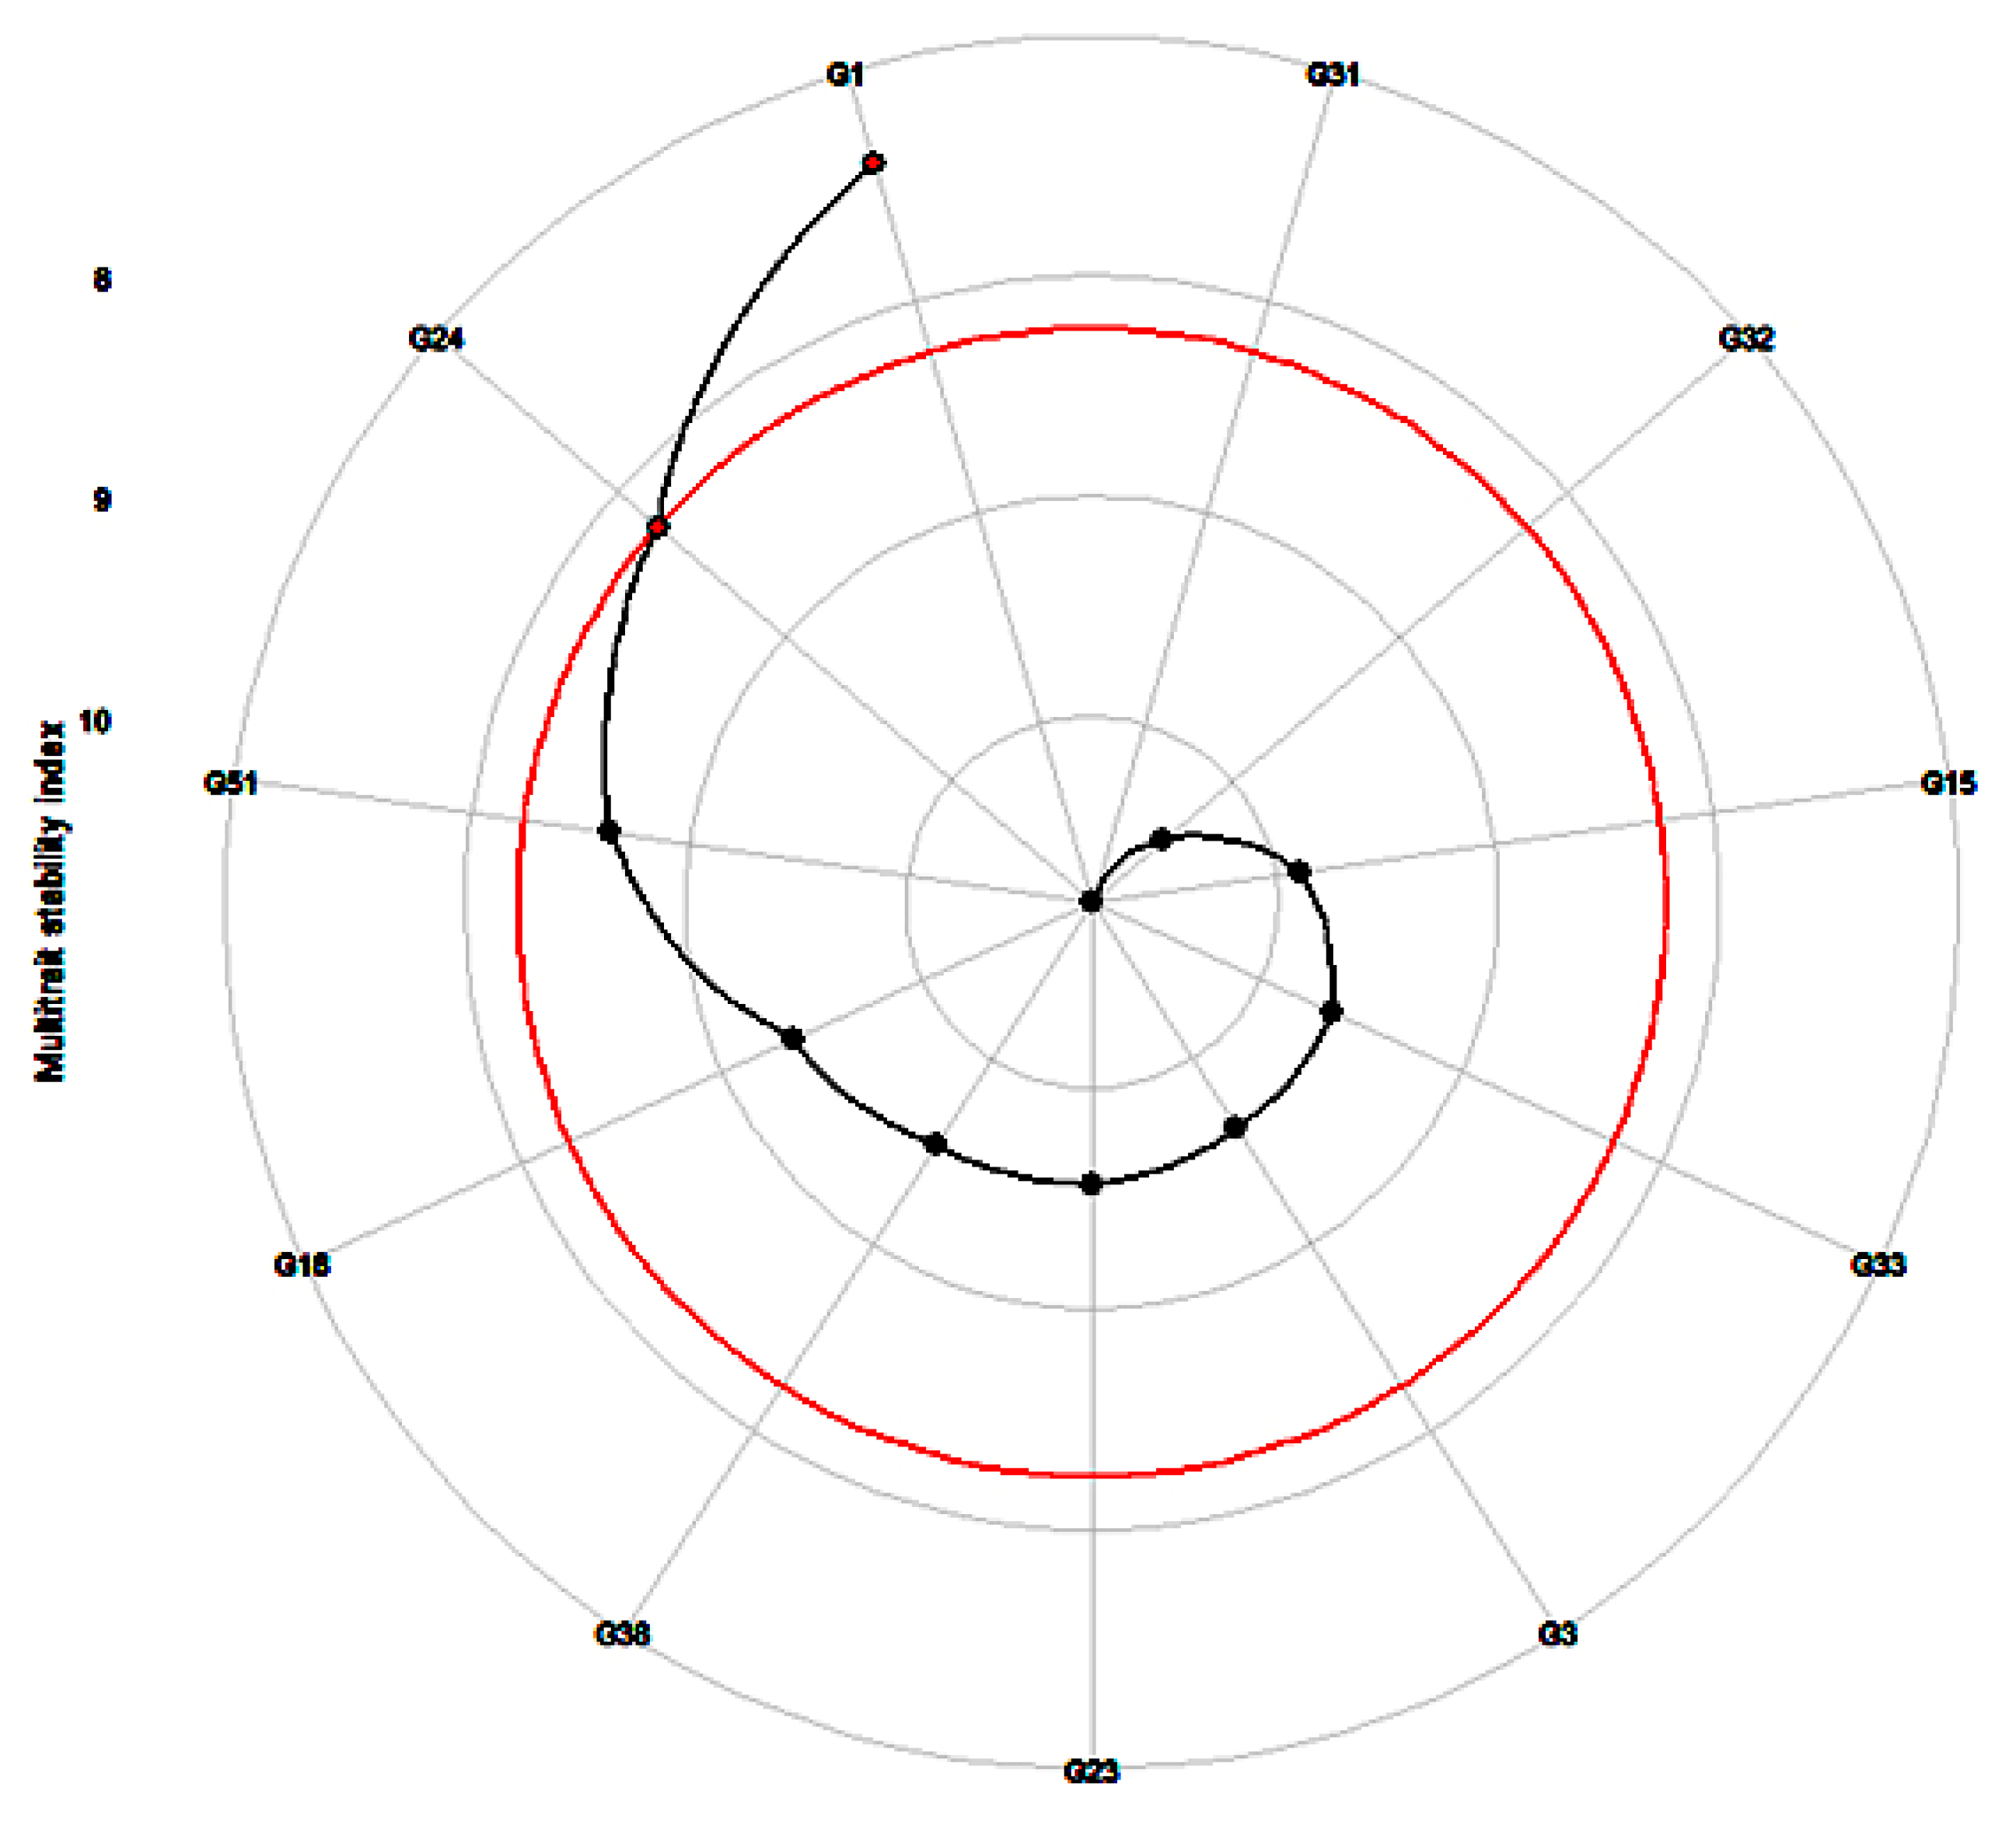
2.7. Multi-Trait Stability Analysis
3. Results
3.1. Metabolite Profiling
3.2. ANOVA for Phenotypic Variance
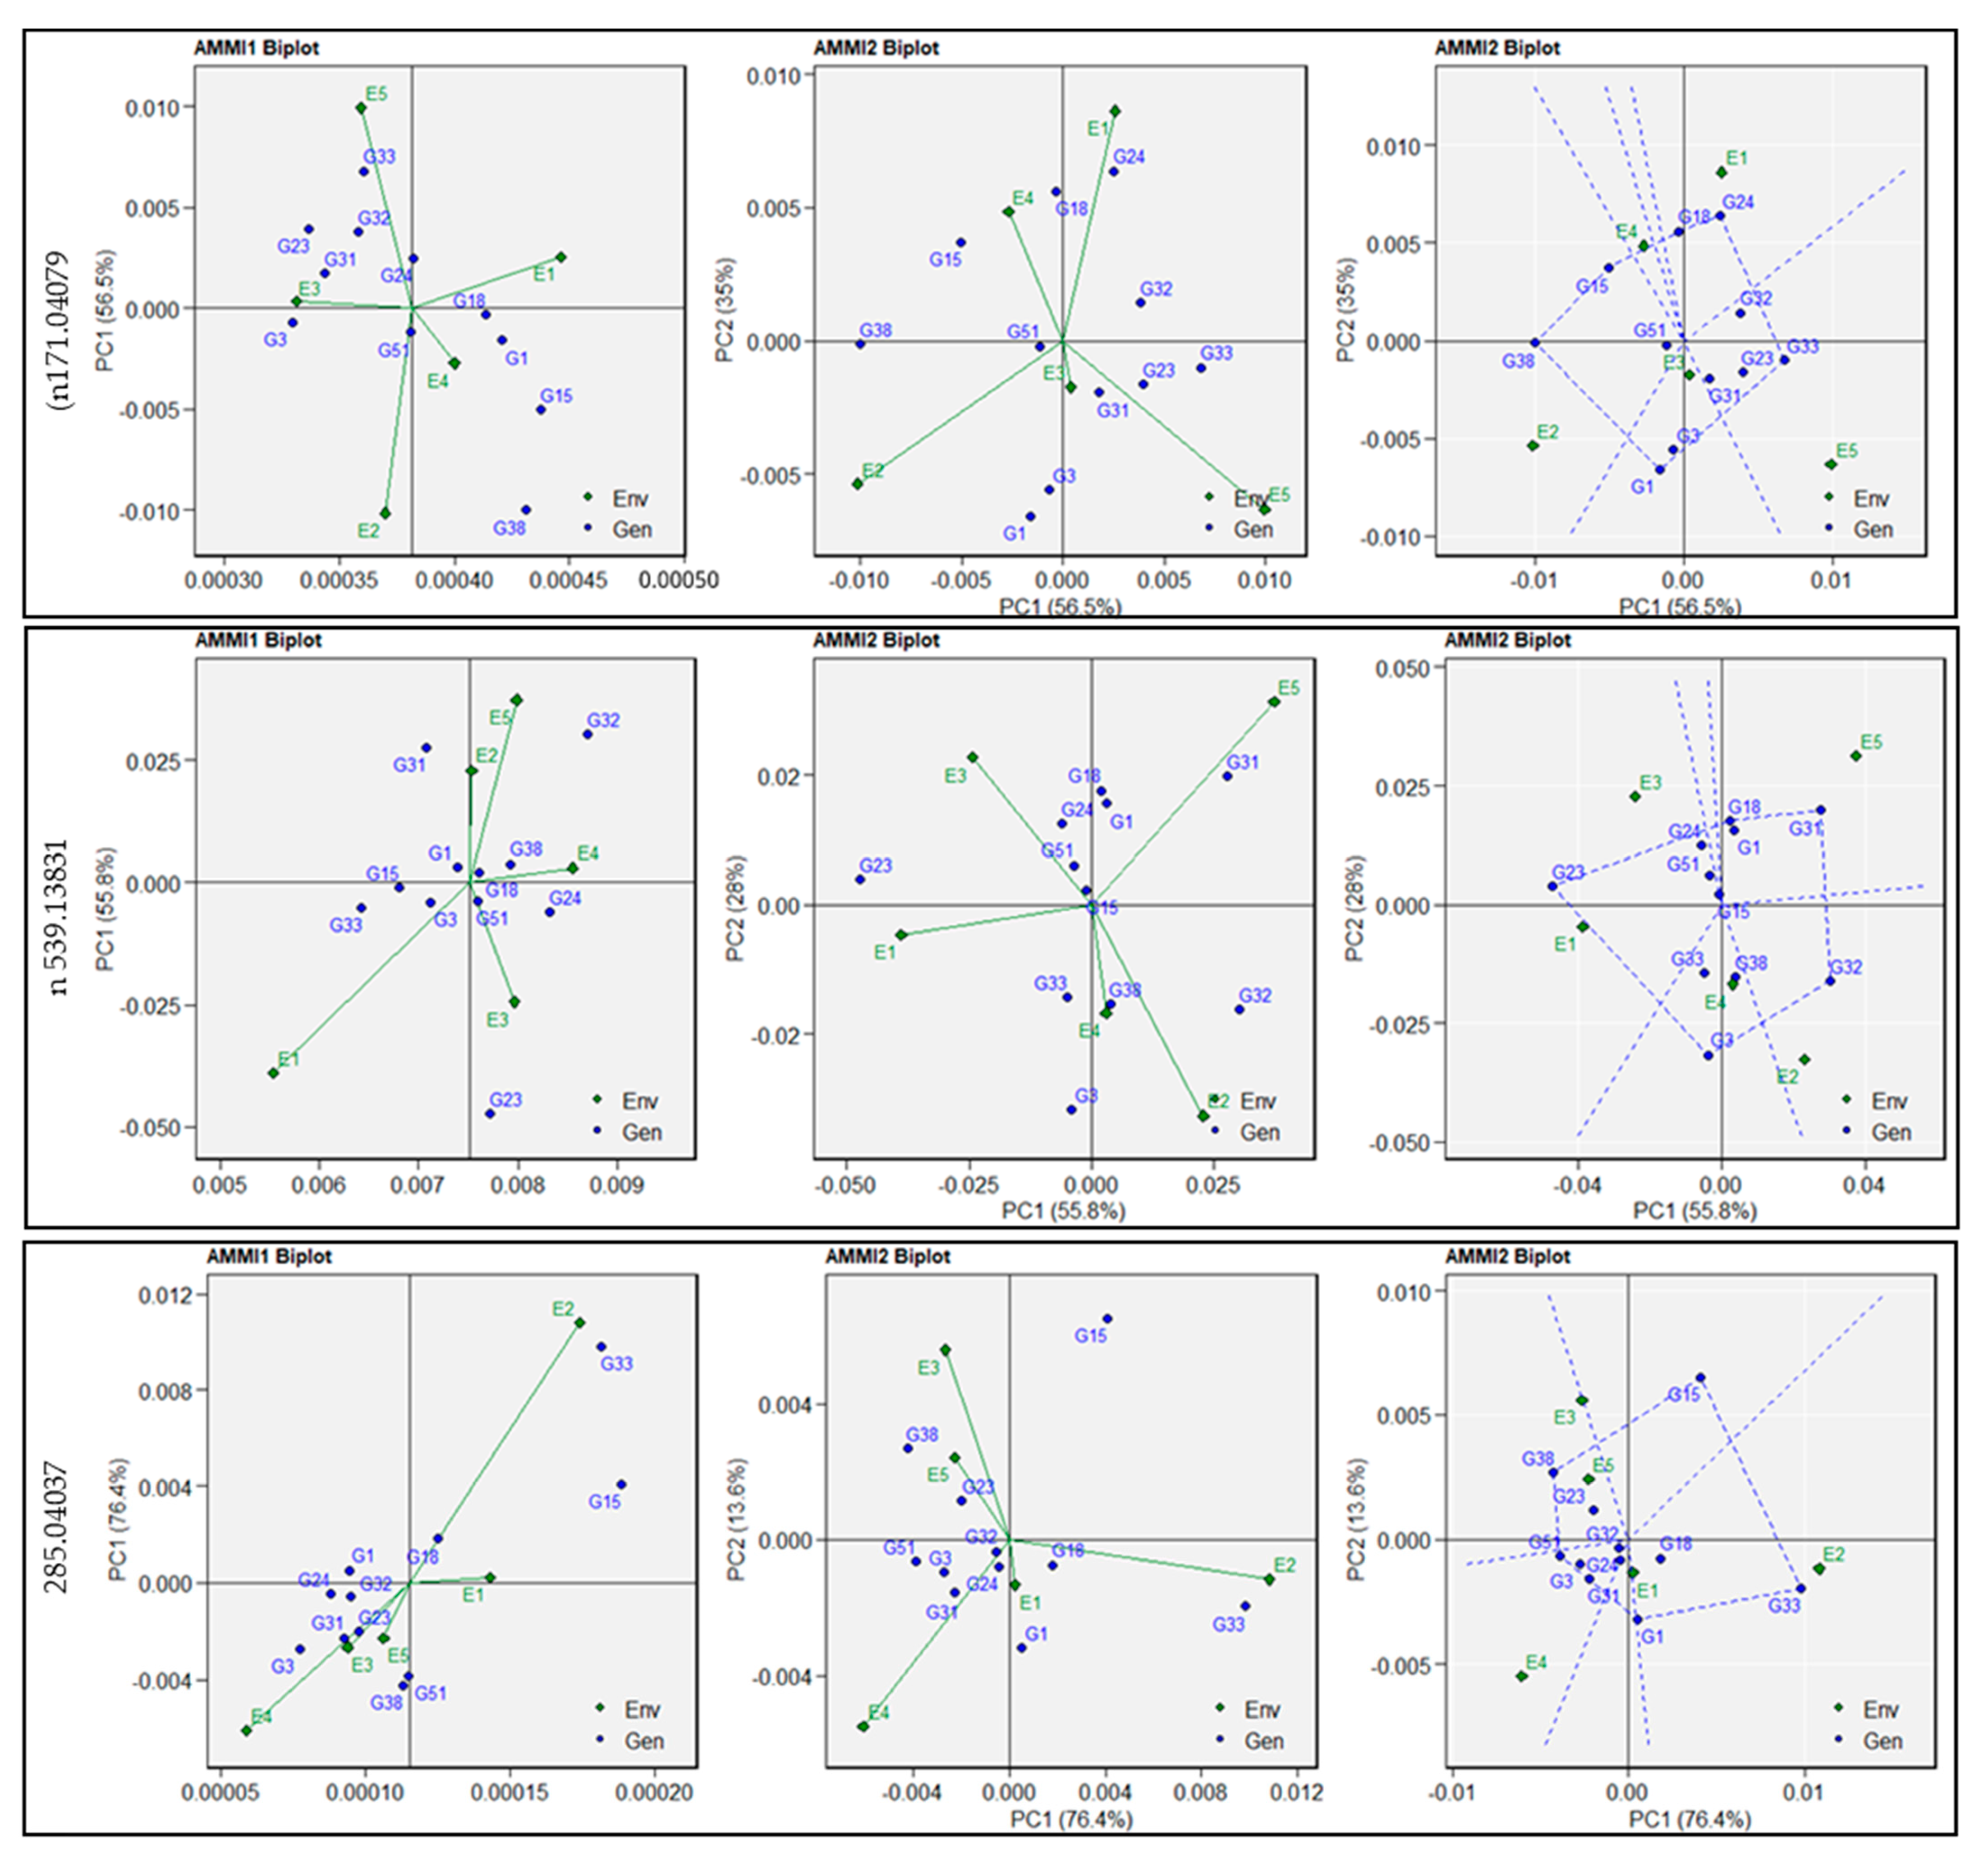
3.3. Additive Main Effects and Multiplicative Interaction Analysis
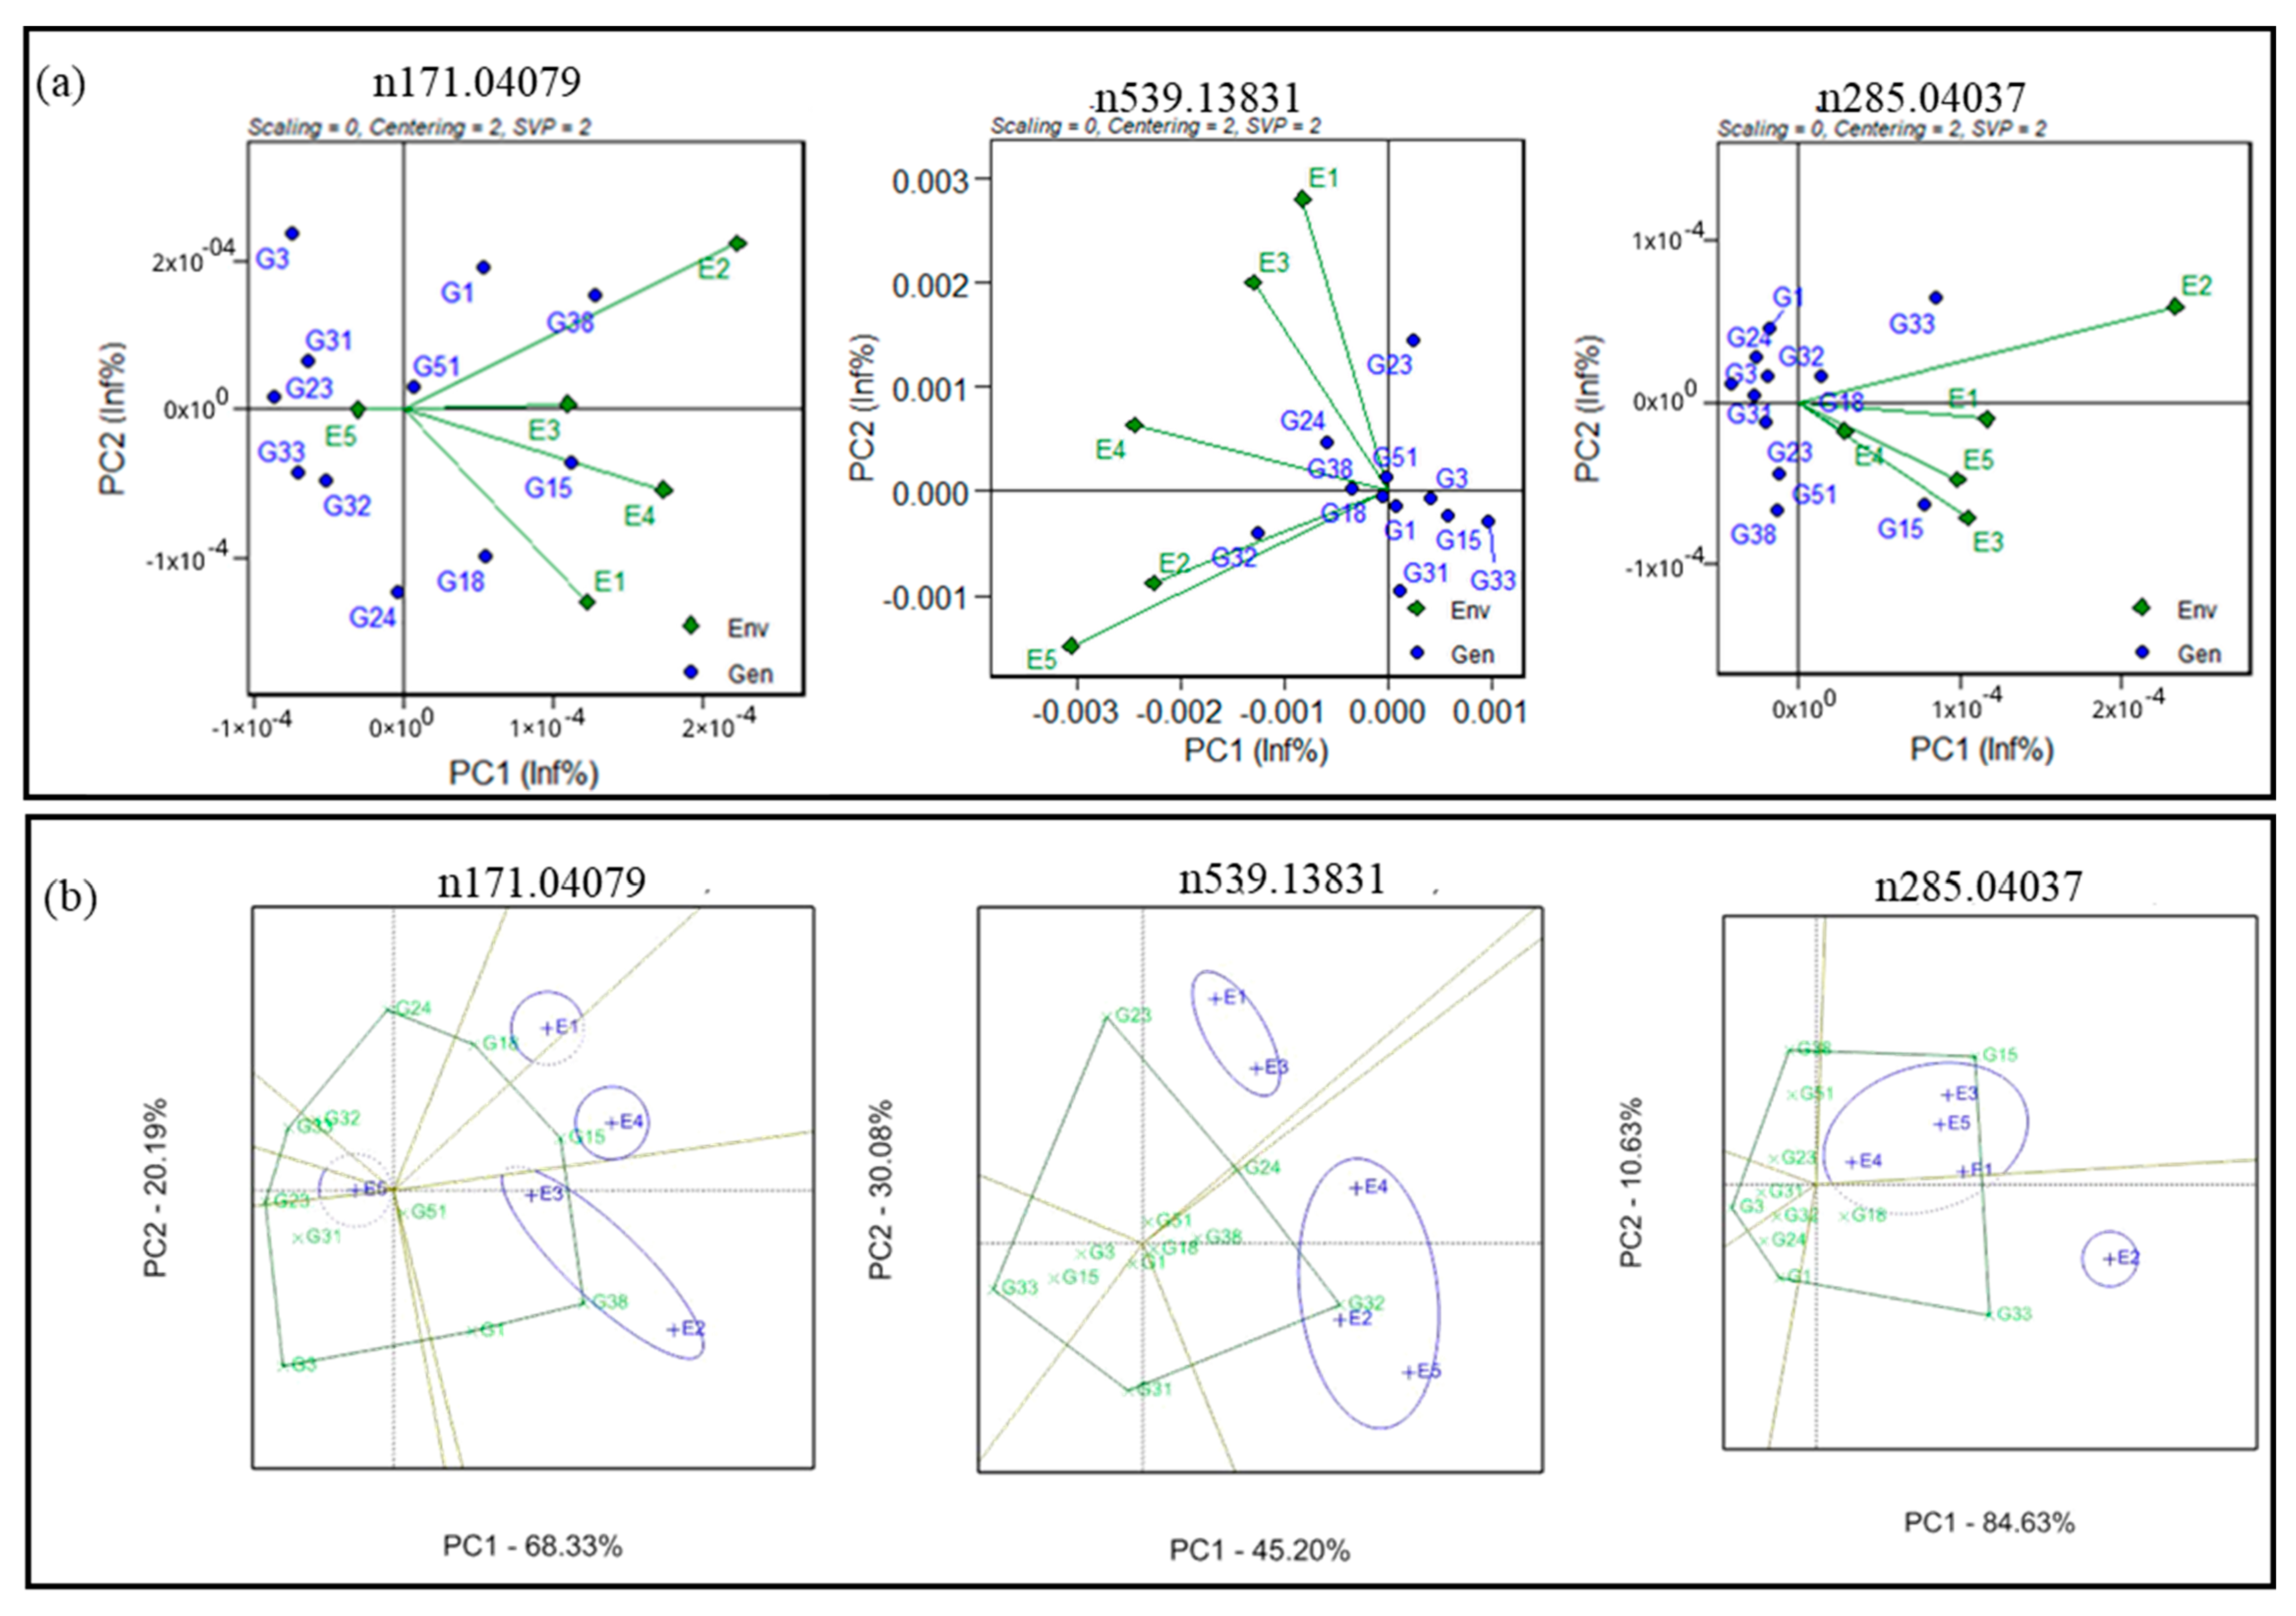
3.4. Genotype plus Genotype-by-Environment Biplots
3.5. Estimation of AMMI-Based Stability Indices
3.6. Estimation of Best-Linear-Unbiased-Prediction-Based Stability Indices
3.7. Best-Performing and Highly Stable Entries
4. Discussion
5. Conclusions
Supplementary Materials
Author Contributions
Funding
Institutional Review Board Statement
Informed Consent Statement
Data Availability Statement
Acknowledgments
Conflicts of Interest
References
- Velu, G.; Rai, K.N.; Muralidharan, V.; Kulkarni, V.N.; Longvah, T.; Raveendra, T.S. Prospects of breeding biofortified pearl millet with high grain iron and zinc content. Plant Breed. 2007, 126, 182–185. [Google Scholar] [CrossRef]
- Rai, K.N.; Gupta, S.K.; Bhattacharjee, R.; Kulkarni, V.N.; Singh, A.K.; Rao, A.S. Morphological Characteristics of ICRISAT-Bred Pearl Millet Hybrid Seed Parents; International Crops Research Institute for the Semi-Arid Tropics: Hyderabad, India, 2009; Volume 7, pp. 1–7. [Google Scholar]
- Yadav, R.S.; Sehgal, D.; Vadez, V. Using genetic mapping and genomics approaches in understanding and improving drought tolerance in pearl millet. J. Exp. Bot. 2011, 62, 397–408. [Google Scholar] [CrossRef] [PubMed]
- Muthayya, S.; Rah, J.H.; Sugimoto, J.D.; Roos, F.F.; Kraemer, K.; Black, R.E. The global hidden hunger indices and maps: An advocacy tool for action. PLoS ONE 2013, 8, e67860. [Google Scholar] [CrossRef] [PubMed]
- Birner, R.; Kone, S.A.; Linacre, N.; Resnick, D. Biofortified foods and crops in West Africa: Mali and Burkina Faso. AgBioForum 2007, 10, 192–200. [Google Scholar]
- Muthamilarasan, M.; Dhaka, A.; Yadav, R.; Prasad, M. Exploration of millet models for developing nutrient rich graminaceous crops. Plant Sci. 2016, 242, 89–97. [Google Scholar] [CrossRef]
- Yadav, C.B.; Tokas, J.; Yadav, D.; Winters, A.; Singh, R.B.; Yadav, R.; Gangashetty, P.; Srivastava, R.K.; Yadav, R.S. Identifying antioxidant biosynthesis genes in pearl millet [Pennisetum glaucum (L.) R. Br.] using genome-wide association analysis. Front. Plant Sci. 2021, 12, 599649. [Google Scholar] [CrossRef]
- Skalska, A.; Beckmann, M.; Corke, F.; Savas Tuna, G.; Tuna, M.; Doonan, J.H.; Hasterok, R.; Mur, L.A.J. Metabolomic variation aligns with two geographically distinct subpopulations of Brachypodium distachyon before and after drought stress. Cells 2021, 10, 683. [Google Scholar] [CrossRef]
- Yadav, C.B.; Srivastava, R.K.; Gangashetty, P.I.; Yadav, R.; Mur, L.A.J.; Yadav, R.S. Metabolite diversity and metabolic genome-wide marker association studies (MGWAS) for health benefiting nutritional traits in pearl millet grains. Cells 2021, 10, 3076. [Google Scholar] [CrossRef]
- Cooper, M.; Delacy, I.H. Relationships among analytical methods used to study genotypic variation and genotype-by environment interaction in plant breeding multi-environment experiments. Theor. Appl. Genet. 1994, 88, 561–572. [Google Scholar] [CrossRef]
- Vargas, M.; Coombs, E.; Alvarado, G.; Atlin, G.; Mathews, K.; Crossa, J. META: A suite of SAS programs to analyze multienvironment breeding trials. Agron. J. 2013, 1, 11–19. [Google Scholar] [CrossRef]
- Alvaradoa, G.; Rodrígueza, F.M.; Pachecoa, A.; Burgueñoa, J.; Crossaa, J.; Vargasa, M.; Rodríguezd, P.P.; Lopez-Cruze, M.A. META-R: A software to analyze data from multi-environment plant breeding trials. Crop J. 2020, 8, 745–756. [Google Scholar] [CrossRef]
- Henderson, C.R. Best linear unbiased estimation and prediction under a selection model. Biometrics 1975, 31, 423–447. [Google Scholar] [CrossRef] [PubMed]
- Searle, S.R.; Casella, G.; McCulloch, C.E. Variance Components; John Wiley & Sons, Inc.: Hoboken, NJ, USA, 1992; pp. 168–260. [Google Scholar]
- Olivoto, T.; Lúcio, A.D. Metan: An R package for multi-environment trial analysis. Methods Ecol. Evol. 2020, 11, 783–789. [Google Scholar] [CrossRef]
- Crossa, J.; Vargas, M.; van Eeuwijk, F.A.; Jiang, C.; Edmeades, G.O.; Hoisington, D. Interpreting genotype × environment interaction in tropical maize using linked molecular markers and environmental covariables. Theor. Appl. Genet. 1999, 99, 611–625. [Google Scholar] [CrossRef] [PubMed]
- Patterson, H.D.; Williams, E.R. A new class of resolvable incomplete block designs. Biometrika 1976, 63, 83–92. [Google Scholar] [CrossRef]
- GenStat. GenStat for Windows, 18th ed.; VSN International: Hemel Hempstead, UK, 2015; Available online: https://Genstat.co.uk (accessed on 18 March 2022).
- Rao, A.R.; Prabhakaran, V.T. Use of AMMI in simultaneous selection of genotypes for yield and stability. J. Indian Soc. Agric. Stat. 2005, 59, 76–82. [Google Scholar]
- Annicchiarico, P. Joint regression vs. AMMI analysis of genotype-environment interactions for cereals in Italy. Euphytica 1997, 94, 53–62. [Google Scholar] [CrossRef]
- Zhang, Z.; Lu, C.; Xiang, Z. Analysis of variety stability based on AMMI model. Acta Agron. Sin. 1998, 24, 304–309. [Google Scholar]
- Jambhulkar, N.N.; Rath, N.C.; Bose, L.K.; Subudhi, H.N.; Biswajit, M.; Lipi, D.; Meher, J. Stability analysis for grain yield in rice in demonstrations conducted during rabi season in India. Oryza 2017, 54, 236–240. [Google Scholar] [CrossRef]
- Olivoto, T.; Lucio, A.D.C.; da Silva, J.A.G.; Marchioro, V.S.; de Souza, V.Q.; Jost, E. Mean Performance and Stability in Multi-Environment Trials I: Combining Features of AMMI and BLUP Techniques. Agron. J. 2019, 111, 2949–2960. [Google Scholar] [CrossRef]
- Zobel, R.W. Stress resistance and root systems. In Proceedings of the Workshop on Adaptation of Plants to Soil Stress, Institute of Agriculture and Natural Resources, University of Nebraska-Lincoln, Lincoln, NE, USA, 1–4 August 1993; Intsormil Publication: Lincoln, NE, USA, 1994; pp. 80–99. [Google Scholar]
- Raju, B.M.K. A study on AMMI model and its biplots. J. Indian Soc. Agric. Stat. 2002, 55, 297–322. [Google Scholar]
- Ajay, B.C.; Aravind, J.; Abdul, F.R.; Bera, S.K.; Kumar, N.; Gangadhar, K.; Kona, P. Modified AMMI Stability Index (MASI) for stability analysis. ICAR-DGR Newsl. 2018, 18, 4–5. [Google Scholar]
- Colombari Filho, J.M.; de Resende, M.D.V.; de Morais, O.P.; de Castro, A.P.; Guimaraes, E.P.; Pereira, J.A.; Utumi, M.M.; Breseghello, F. Upland rice breeding in Brazil: A simultaneous genotypic evaluation of stability, adaptability and grain yield. Euphytica 2013, 192, 117–129. [Google Scholar] [CrossRef]
- Yadav, C.B.; Srivastava, R.K.; Beynon, S.; Englyst, K.; Gangashetty, P.I.; Yadav, R.S. Genetic variability and genome-wide marker association studies for starch traits contributing to low glycaemic index in pearl millet. Food Energy Secur. 2022, 11, e341. [Google Scholar] [CrossRef]
- Anuradha, N.; Patro, T.S.S.K.; Singamsetti, A.; Sandhya Rani, Y.; Triveni, U.; Nirmala, K.A.; Govanakoppa, N.; Lakshmi, P.T.; Tonapi, V.A. Comparative study of AMMI- and BLUP-based simultaneous selection for grain yield and stability of finger millet [Eleusine coracana (L.) Gaertn.] Genotypes. Front. Plant Sci. 2022, 12, 786839. [Google Scholar] [CrossRef]
- Adugna, A.; Tesso, T.; Degu, E.; Tadesse, T.; Merga, F.; Legesse, F.; Tirfessa, A.; Kidane, H.; Wole, A.; Daba, C. Genotype-by-environment interaction and yield stability analysis in finger millet (Eleucine coracana L. Gaertn) in Ethiopia. Am. J. Plant Sci. 2011, 2, 408–415. [Google Scholar] [CrossRef]
- Molla, F.; Alemayehu, A.; Belete, K. AMMI analysis of yield performance and stability of finger millet genotypes across different environments. World J. Agric. Res. 2013, 9, 231–237. [Google Scholar]
- Dagnachew, L.; Masresha, F.; de Villiers, S.; Tesfaye, K. Additive main effects and multiplicative interactions (AMMI) and genotype by environment interaction (GGE) biplot analyses aid selection of high yielding and adapted finger millet varieties. J. Appl. Biosci. 2014, 76, 6291. [Google Scholar]
- Birhanu, M.; Tesfay, M.; Nigus, C.; Wolday, K. Stability analysis of finger millet genotypes in moisture stressed areas of Northern Ethiopia. J. Nat. Sci. Res. 2016, 6, 73–83. [Google Scholar]
- Lakew, T.; Dessie, A.; Tariku, S.; Abebe, D. Evaluation of performance and yield stability analysis based on AMMI and GGE models in introduced upland rice genotypes tested across Northwest Ethiopia. Int. J. Res. Stud. Agric. Sci. 2017, 3, 17–24. [Google Scholar]
- Seyoum, A.; Semahegn, Z.; Nega, A.; Gebreyohannes, A. AMMI and GGE Analysis of G E and yield stability of finger millet [Eleusine coracana (L.) Gaertn] genotypes in Ethiopia. Int. J. Trend Res. 2019, 6, 379–386. [Google Scholar]
- Tolessa, T.T.; Keneni, G.; Sefera, T.; Jarso, M.; Bekele, Y. Genotype environment interaction and performance stability for grain yield in field pea (Pisum sativum L.) genotypes. Int. J. Plant Breed. 2013, 7, 116–123. [Google Scholar]
- Singamsetti, A.; Shahi, J.P.; Zaidi, P.H.; Seetharam, K.; Vinayan, M.T.; Kumar, M.; Singla, S.; Shikha, K.; Madankar, K. Genotype × environment interaction and selection of maize (Zea mays L.) hybrids across moisture regimes. Field Crops Res. 2021, 270, 108224. [Google Scholar] [CrossRef]
- Cheloei, G.; Ranjbar, G.A.; Babaeian Jelodar, N.; Bagheri, N.; Noori, M.Z. Using AMMI model and its parameters for yield stability analysis of rice (Oryza sativa L.) advanced mutant genotypes of Tarrom-Mahalli. Iran. J. Genet. Plant Breed. 2020, 9, 70–83. [Google Scholar]
- Pires, I.E.; Resende, M.D.V.; Silva, R.L.; Resende Júnior, M.F.R. Genéticaflorestal. In Viçosa; UFV: Abbotsford, BC, Canada, 2011; p. 317. [Google Scholar]
- de Resende, M.D.V.; Furlani-Júnior, E.; Moraes, M.L.T.; Fazuoli, L.C. Estimation of genetic parameters and prediction of genotypic values in coffee breeding by the REML/BLUP method. Bragantia 2001, 60, 185–193. [Google Scholar]
- Rosado, R.; Rosado, T.B.; Cruz, C.; Ferraz, A.G.; Conceicao, L.D.H.; Laviola, B.G. Genetic parameters and simultaneous selection for adaptability and stability of macaw palm. Sci. Hortic. 2019, 248, 291–296. [Google Scholar] [CrossRef]
- Alves, R.S.; Peixoto, L.A.; Teodoro, P.E.; Silva, L.A.; Rodrigues, E.V.; Resende, M.D.V.; Laviola, B.G.; Bhering, L.L. Selection of Jatropha curcas families based on temporal stability and adaptability of genetic values. Ind. Crops Prod. 2018, 119, 290–293. [Google Scholar] [CrossRef]
- Szareski, V.J.; Carvalho, I.R.; Kehl, K.; Levien, A.M.; Nardino, M.; Dellagostin, S.M.; Demari, G.H.; Lautenchleger, F.; Villela, F.A.; Pedó, T.; et al. Adaptability and stability of wheat genotypes according to the phenotypic index of seed vigor. Pesqui. Agropecu. Bras. 2018, 53, 727–735. [Google Scholar] [CrossRef]


Publisher’s Note: MDPI stays neutral with regard to jurisdictional claims in published maps and institutional affiliations. |
© 2022 by the authors. Licensee MDPI, Basel, Switzerland. This article is an open access article distributed under the terms and conditions of the Creative Commons Attribution (CC BY) license (https://creativecommons.org/licenses/by/4.0/).
Share and Cite
Yadav, C.B.; Gangashetty, P.I.; Beckmann, M.; Mur, L.A.J.; Yadav, R.S. Genotype-by-Environment Interaction Analysis of Metabolites in Pearl Millet Genotypes with High Concentrations of Slowly Digestible and Resistant Starch in Their Grains. Cells 2022, 11, 3109. https://doi.org/10.3390/cells11193109
Yadav CB, Gangashetty PI, Beckmann M, Mur LAJ, Yadav RS. Genotype-by-Environment Interaction Analysis of Metabolites in Pearl Millet Genotypes with High Concentrations of Slowly Digestible and Resistant Starch in Their Grains. Cells. 2022; 11(19):3109. https://doi.org/10.3390/cells11193109
Chicago/Turabian StyleYadav, Chandra Bhan, Prakash I. Gangashetty, Manfred Beckmann, Luis A. J. Mur, and Rattan S. Yadav. 2022. "Genotype-by-Environment Interaction Analysis of Metabolites in Pearl Millet Genotypes with High Concentrations of Slowly Digestible and Resistant Starch in Their Grains" Cells 11, no. 19: 3109. https://doi.org/10.3390/cells11193109
APA StyleYadav, C. B., Gangashetty, P. I., Beckmann, M., Mur, L. A. J., & Yadav, R. S. (2022). Genotype-by-Environment Interaction Analysis of Metabolites in Pearl Millet Genotypes with High Concentrations of Slowly Digestible and Resistant Starch in Their Grains. Cells, 11(19), 3109. https://doi.org/10.3390/cells11193109