Article

Transcriptome Changes in Glioma Cells Cultivated under Conditions of Neurosphere Formation

by
Natalia S. Vasileva
1,
Elena V. Kuligina
1,
Maya A. Dymova
1,
Yulya I. Savinovskaya
1,
Nikita D. Zinchenko
1,
Alisa B. Ageenko
1,
Sergey V. Mishinov
2,
Anton S. Dome
1,
Grigory A. Stepanov
1,
Vladimir A. Richter
1 and
Dmitry V. Semenov
1,*
1
Institute of Chemical Biology and Fundamental Medicine, Siberian Branch, Russian Academy of Sciences, Lavrentyev Avenue 8, Novosibirsk 630090, Russia
2
Novosibirsk Research Institute of Traumatology and Orthopedics n.a. Ya.L. Tsivyan, Department of Neurosurgery, Frunze Street 17, Novosibirsk 630091, Russia
*
Author to whom correspondence should be addressed.
Cells 2022, 11(19), 3106; https://doi.org/10.3390/cells11193106
Submission received: 11 August 2022 / Revised: 23 September 2022 / Accepted: 27 September 2022 / Published: 2 October 2022
(This article belongs to the Section Cells of the Nervous System)

Abstract

:
Glioma is the most common and heterogeneous primary brain tumor. The development of a new relevant preclinical models is necessary. As research moves from cultures of adherent gliomas to a more relevant model, neurospheres, it is necessary to understand the changes that cells undergo at the transcriptome level. In the present work, we used three patient-derived gliomas and two immortalized glioblastomas, while their cultivation was carried out under adherent culture and neurosphere (NS) conditions. When comparing the transcriptomes of monolayer (ML) and NS cell cultures, we used Enrichr genes sets enrichment analysis to describe transcription factors (TFs) and the pathways involved in the formation of glioma NS. It was observed that NS formation is accompanied by the activation of five common gliomas of TFs, SOX2, UBTF, NFE2L2, TCF3 and STAT3. The sets of transcripts controlled by TFs MYC and MAX were suppressed in NS. Upregulated genes are involved in the processes of the epithelial–mesenchymal transition, cancer stemness, invasion and migration of glioma cells. However, MYC/MAX-dependent downregulated genes are involved in translation, focal adhesion and apical junction. Furthermore, we found three EGFR and FGFR signaling feedback regulators common to all analyzed gliomas—SPRY4, ERRFI1, and RAB31—which can be used for creating new therapeutic strategies of suppressing the invasion and progression of gliomas.

1. Introduction

Among all registered malignant neoplasms, brain and CNS tumors account for 3.5%, whereas gliomas represent 81% of malignant brain and CNS tumors [1]. The most common histological form of glioma is glioblastoma (approximately 45% of all gliomas) [2]. In general, glioblastoma (GBM) is a rare tumor with a global incidence of less than 10 per 100,000 people, but it remains an incurable disease and one of the most aggressive tumors, characterized by an acute course of disease and poor prognosis—a 5-year survival rate of less than 5% with full standard treatment, and a median survival of only 15 months [3]. The poor prognosis of this cancer is due to aggressive diffuse infiltrative growth, drug resistance, tumor heterogeneity, immune evasion, and obstacles to drug delivery, such as the presence of the blood–brain barrier and the blood–brain tumor barrier [4]. The standard treatment of GBM, which today consists of the maximum surgical resection of the tumor followed by radio- and/or chemotherapy, is not effective; therefore, the development of new approaches for diagnostics and therapy remains an urgent task.
In the development of anticancer drugs, various cellular and animal models are used in order to evaluate the cytotoxic effect of the drug in vitro and its antitumor efficacy in vivo. A significant part of the research on the effectiveness of anticancer drugs is carried out using immortalized cell cultures. However, cells of immortalized lines undergo differentiation during long-term cultivation, and the cell culture no longer reflects the cellular heterogeneity, genetic and morphological features that are characteristic of a malignant tumor, including glioblastoma. One solution to this substantial problem is to use cancer cell cultures derived from patient biopsy as an in vitro model [5].
The cultivation of primary tumor cell cultures in media-containing serum leads to the differentiation of tumor cells and the loss of their tumorigenic potential [6]. On the other hand, the cultivation of primary cultures of malignant glioma in a medium without serum, but with the addition of growth factors and nutritional supplements, allows us to form NS [7], which is enriched in cells with characteristic features of tumor stem cells: the potential for unlimited self-renewal and the ability to readily differentiate to into neurons and glial cells. Moreover, these cells demonstrate gene expression profiles and biological behavior that maximally preserved both the phenotype and genotype of the primary tumor and the molecular and phenotypic features of cancer stem cells (CSCs) [8]. They closely mimic their parental primary tumors, in contrast to tumor cells grown under standard culture conditions. In fact, standard culture conditions cannot enrich CSCs, which ultimately leads to an increase in the population of cells that remotely resemble the original tumors.
In 1992, Brent A. Reynolds and Samuel Weiss were the first to demonstrate the ability of neural stem cells to form NS in the presence of the epidermal growth factor (EGF) and a non-adherent substrate [9]. Yuan X. et al. showed that the GBM spheres share many characteristics of stem cells, including self-renewal ability and multipotent differentiation, which can produce daughter cells of all phenotypes present in the GBM. After in vivo implantation, only the isolated tumor stem cells were able to form tumors that contained both neurons and glial cells [10]. Therefore, the analysis of glioma cells in neurospheres quickly became the method of choice, and since has become a valuable tool for isolating and understanding the biology of embryonic and CSCs because the latter are a huge obstacle to the treatment of glioblastoma, due to their drug resistance, radiation resistance, unlimited potential for self-renewal and participation in immune evasion [11,12,13]. Moreover, patient-derived glioma cells cultivated in the form of NS retain the ability to form tumors upon xenotransplantation in immunodeficient animals and thus may be a promising and relevant model for studying the mechanisms of the tumor development, the key glioblastoma signaling pathways, the features of clinical outcome and the response to anticancer drugs [14,15,16,17,18].
For the formation of neurospheres, GBM cells are cultivated in a medium with the addition of growth factors, such as EGF and the fibroblast growth factor (bFGF), thereby artificially activating small GTP-ase—RAS protein. This protein triggers many important downstream signaling pathways resulting in the growth, adhesion, cytoskeletal integrity, differentiation, survival and migration of cells [19]. First, it is the mitogen-activated protein kinase (MAPK) pathway that activates transcription factors such as MYC, FOS, ETS, and JUN, thus promoting cell cycle entry, angiogenesis, and survival by supporting cancer cell proliferation [20]. RAS induces the phosphatidylinositol 3-kinase (PI3K)/protein kinase B (Akt) pathway, the increased activity of which leads to apoptosis evasion and is associated with tumor progression and drug resistance. Moreover, RAS through TIAM1 regulates cytoskeletal organization and cell migration [21]. The RAS/MAPK signaling pathway is believed to induce epithelial–mesenchymal transition (EMT). It stimulates the nuclear expression of EMT-inducing transcription factors and reprograms the expression of genes that are involved in intercellular adhesion, cytoskeletal positioning, invasion and migration [22]. Specifically, for gliomas, the term pro-neural to mesenchymal transition (PMT) is used [23]. Studies of key molecular genetic markers associated with PMT began relatively recently; the activation of such classic transcription factors for oncogenesis as STAT3 and NF-κB has been identified [24].
In this work, a NGS transcriptomic analysis followed by the comparative bioinformatic analysis of glioma cell RNA patterns in the adherent state and in the state of neurospheres was performed. SOX2, UBTF, NFE2L2, TCF3 and STAT3 were underlined as common transcriptional factors, which are responsible for the upregulation of genes involved in processes of the epithelial–mesenchymal transition, cancer stemness, invasion and migration of GBM. We also detected that the upregulation of SPRY4, ERRFI1 and RAB31 provides a condition for feedback regulations of FGF and EGF signaling as well as can be applied in glioma therapy.

2. Materials and Methods

2.1. Cell Lines

Human U87 MG and U343 MG cell lines were obtained from the cell culture collection of the Institute of Molecular and Cellular Biology of the SB RAS (Novosibirsk, Russia). The cells were cultivated in Minimum Essential Medium α (MEM α; Sigma-Aldrich, Saint Louis, MO, USA) with 10% FBS (Gibco BRL Co., Gaithersburg, MD, USA), 2 mM L-glutamine (Sigma-Aldrich, USA), 250 mg/mL amphotericin B, and 100 U/mL penicillin/streptomycin (Gibco BRL Co., Gaithersburg, MD, USA) at 37 °C in a humidified atmosphere containing 5% CO2.

2.2. Patient-Derived Cell Cultures

Cancer tissue samples were obtained with informed consent from patients at the Novosibirsk Research Institute of Traumatology and Orthopedics n.a. Ya.L. Tsivyan (Novosibirsk, Russia). The study was approved by the Committee on the Ethics of Novosibirsk Research Institute of Traumatology and Orthopedics n.a. Ya.L. Tsivyan (protocol number № 050/17 68 of 11 September 2017).
All samples were collected from treatment-naïve patients. According to the transcriptome data, the analyzed glioma cultures do not have mutations in the coding regions of the IDH1 and IDH2 mRNAs.
Glioma tissue specimens were mechanically dissociated in Iscove’s modified Dulbecco’s media (IMDM, Sigma-Aldrich, Saint Louis, MO, USA). Specimens dissociated into single cells were washed with a 10× excess volume of phosphate-buffered saline (PBS), and separated cells were collected through centrifugation at 300× g. Cells were plated in IMDM medium with 10% FBS, 2 mM L-glutamine, 100 U/mL penicillin, 100 μg/mL streptomycin, and 250 mg/mL amphotericin B for cell adhesion. At the next passages, cells were cultured in complete IMDM medium supplemented with Mito + Serum Extender (BD Biosciences—Discovery Labware, San Jose, CA, USA), 2 mM L-glutamine, 100 U/mL penicillin, 100 μg/mL streptomycin, and 250 mg/mL amphotericin B, and were cultivated in 6-well plates at 37 °C in a humidified atmosphere containing 5% CO2. When 70–80% confluence was reached, cells were harvested using TripLE Express (Gibco BRL Co., Gaithersburg, MD, USA) and subcultured for further experiments. The cell cultures tested negative for mycoplasma contamination.

2.3. Cell Culture for Neurosphere Formation

For neurosphere formation, cells were cultured in Dulbecco’s Modified Eagle Medium: Nutrient Mixture F-12 (DMEM: F12, Sigma-Aldrich, Saint Louis, MO, USA) supplemented with B-27 and N-2 Supplements, 20 ng/mL bFGF (Gibco BRL Co., Gaithersburg, MD, USA) and 20 ng/mL EGF (Sigma-Aldrich, Saint Louis, MO, USA) in non-treated cell culture dishes (Eppendorf, Germany) at 37 °C in a humidified atmosphere containing 5% CO2. Phase-contrast microscopy was performed using the Nicon Eclipse Ti-S microscope (Nikon, Japan). U87 MG and U343 MG were collected at 3 passages. BR1 and BR3 were collected at 4 passages, and MG1 was collected at 8 passages.

2.4. RNA Isolation

Total RNA was extracted from cells with an RNA extraction kit (LRU-100-50, Biolabmix, Russia) following the manufacturer’s protocol. The RNA concentration was assessed using the Qubit 2 fluorometer (Thermo Fisher Scientific, Waltham, MA, USA) with the Qubit RNA HS Assay Kit (Thermo Fisher Scientific, USA). The quality of total RNA expressed as the RNA Integrity Number (RIN) was determined using the Bioanalyzer 2100 instrument (Agilent, Santa Clara, CA, USA) with an Agilent RNA Pico 6000 Kit (Agilent, Santa Clara, CA, USA). A threshold RIN reading of greater than 8.0 was taken as the cut-off point for the transition to the stage of library preparation.

2.5. RNA Sequencing

The construction of Illumina cDNA libraries was performed according to a standard protocol using a NEBNext Ultra II Directional RNA library preparation kit (New England Biolabs, Ipswich, UK) and NEBNext mRNA Magnetic Isolation Module (New England Biolabs, UK), as well as massive parallel sequencing on a NextSeq Illumina 1500 platform, at the Institute of Fundamental Medicine and Biology, Kazan Federal University (Kazan, Russia). For the isolation of mRNA, and the fragmentation and priming procedure, 1 μg of the total RNA was used. A NextSeq 500/550 High Output v2.5 Kit (100-nucleotide single-end reads) (Illumina, San Diego, CA, USA) was used. For the prepared sequencing libraries, fragment size distribution was analyzed using a Bioanalyzer 2100 instrument (Agilent, USA) with an Agilent High Sensitivity DNA Kit (Agilent, USA) and quantified using the Qubit 2.0 Fluorometer (Invitrogen, Waltham, MA, USA) with the Qubit dsDNA HS Assay Kit (Thermo Fisher Scientific, USA). Fragment sizes ranged between 250 bp and 700 bp, with a clear peak at 300 bp.

2.6. Transcriptome Analysis

Raw sequencing reads (100-nucleotide single-end reads) were subjected to Illumina adapter removal using Trimmomatic [25]. Adapter trimmed sequencing reads were filtered with Bowtie2 [26] using a reference containing sequences of human: rRNAs (RefSeq); tRNAs; snRNA; SINE-, LINE-, and DNA-repeat consensus sequences (RepBase [27]); low-complexity simple repeats, as well as mitochondrial DNA (NC_012920.1). Filtered reads were mapped to a human genome (GRCh37/hg19) with STAR 2.7.1a [28] using RefGene human genome annotation (https://hgdownload.cse.ucsc.edu/goldenPath/hg19/database/ accessed on 5 June 2021). Aligned reads were quantified using QoRTs v1.3.6 [29]. Differential gene expression analysis was performed with DESeq2 1.36.0 [30], R version 4.1.3 and Bioconductor 3.14. The results of differential gene expression analysis, lists of up/downregulated genes, were analyzed with Enrichr using R interface [31]. We also used GSEA MsigDB for the independent analysis of gene sets [32,33].

2.7. Real Time RT-PCR Analysis of RNA

To confirm the RNAseq results with qRT-PCR, we randomly selected 8 mRNAs: CXCL1, ERRFI1, NFKBIA, NRP2, PDGFRA, SOX2, TRIB2, and ZEB1. Total cellular RNA was isolated using an RNA extraction kit (LRU-100-50, Biolabmix, Russia) with additional Dnase I and Rnase-free (Thermo Fisher Scientific, USA) digestion according to the manufacturer’s protocol. The forward and reverse primers were synthesized in ICBFM SB RAS, Russia (Table S1). Real-time PCR was performed on a CFX96 Touch Real-Time PCR Detection System (Bio-Rad, Hercules, CA, USA), using the reagent kit BioMaster RT-PCR SYBR Blue (2×) (Biolabmix, Novosibirsk, Russia). The RT-PCR conditions included the synthesis of cDNA at 45 °C for 30 min, initial activation at 95 °C for 5 min, 40 cycles with denaturation at 95 °C for 10 s, annealing at 61.5 °C for 20 s and extension step at 72 °C for 30 s selected for primers GAPDH, SOX2, ERRFI, TRIB2, and NRP2, or annealing at 58 °C for 10 s and an extension step at 72 °C for 20 s selected for primers GAPDH, NFKBIA, CXCL1, PDGFRA, and ZEB1. The melting curves were analyzed to ensure the specificity of the products. Each sample was analyzed in triplicate. The levels of mRNA were represented as relative values normalized to the level of GAPDH. To confirm the amplification of targeted gene fragments, PCR products were separated through electrophoresis in 1.5% agarose gel, stained with ethidium bromide and documented with the Gel Doc XR System (Bio-Rad, Hercules, CA, USA).

2.8. Statistical Analysis

Data are presented as the mean ± SD. The number of replicates for each experiment is stated in the figure legends. Statistical differences between the 2 groups were evaluated using a 2-tailed t-test; p < 0.05 was considered to be statistically significant.

3. Results

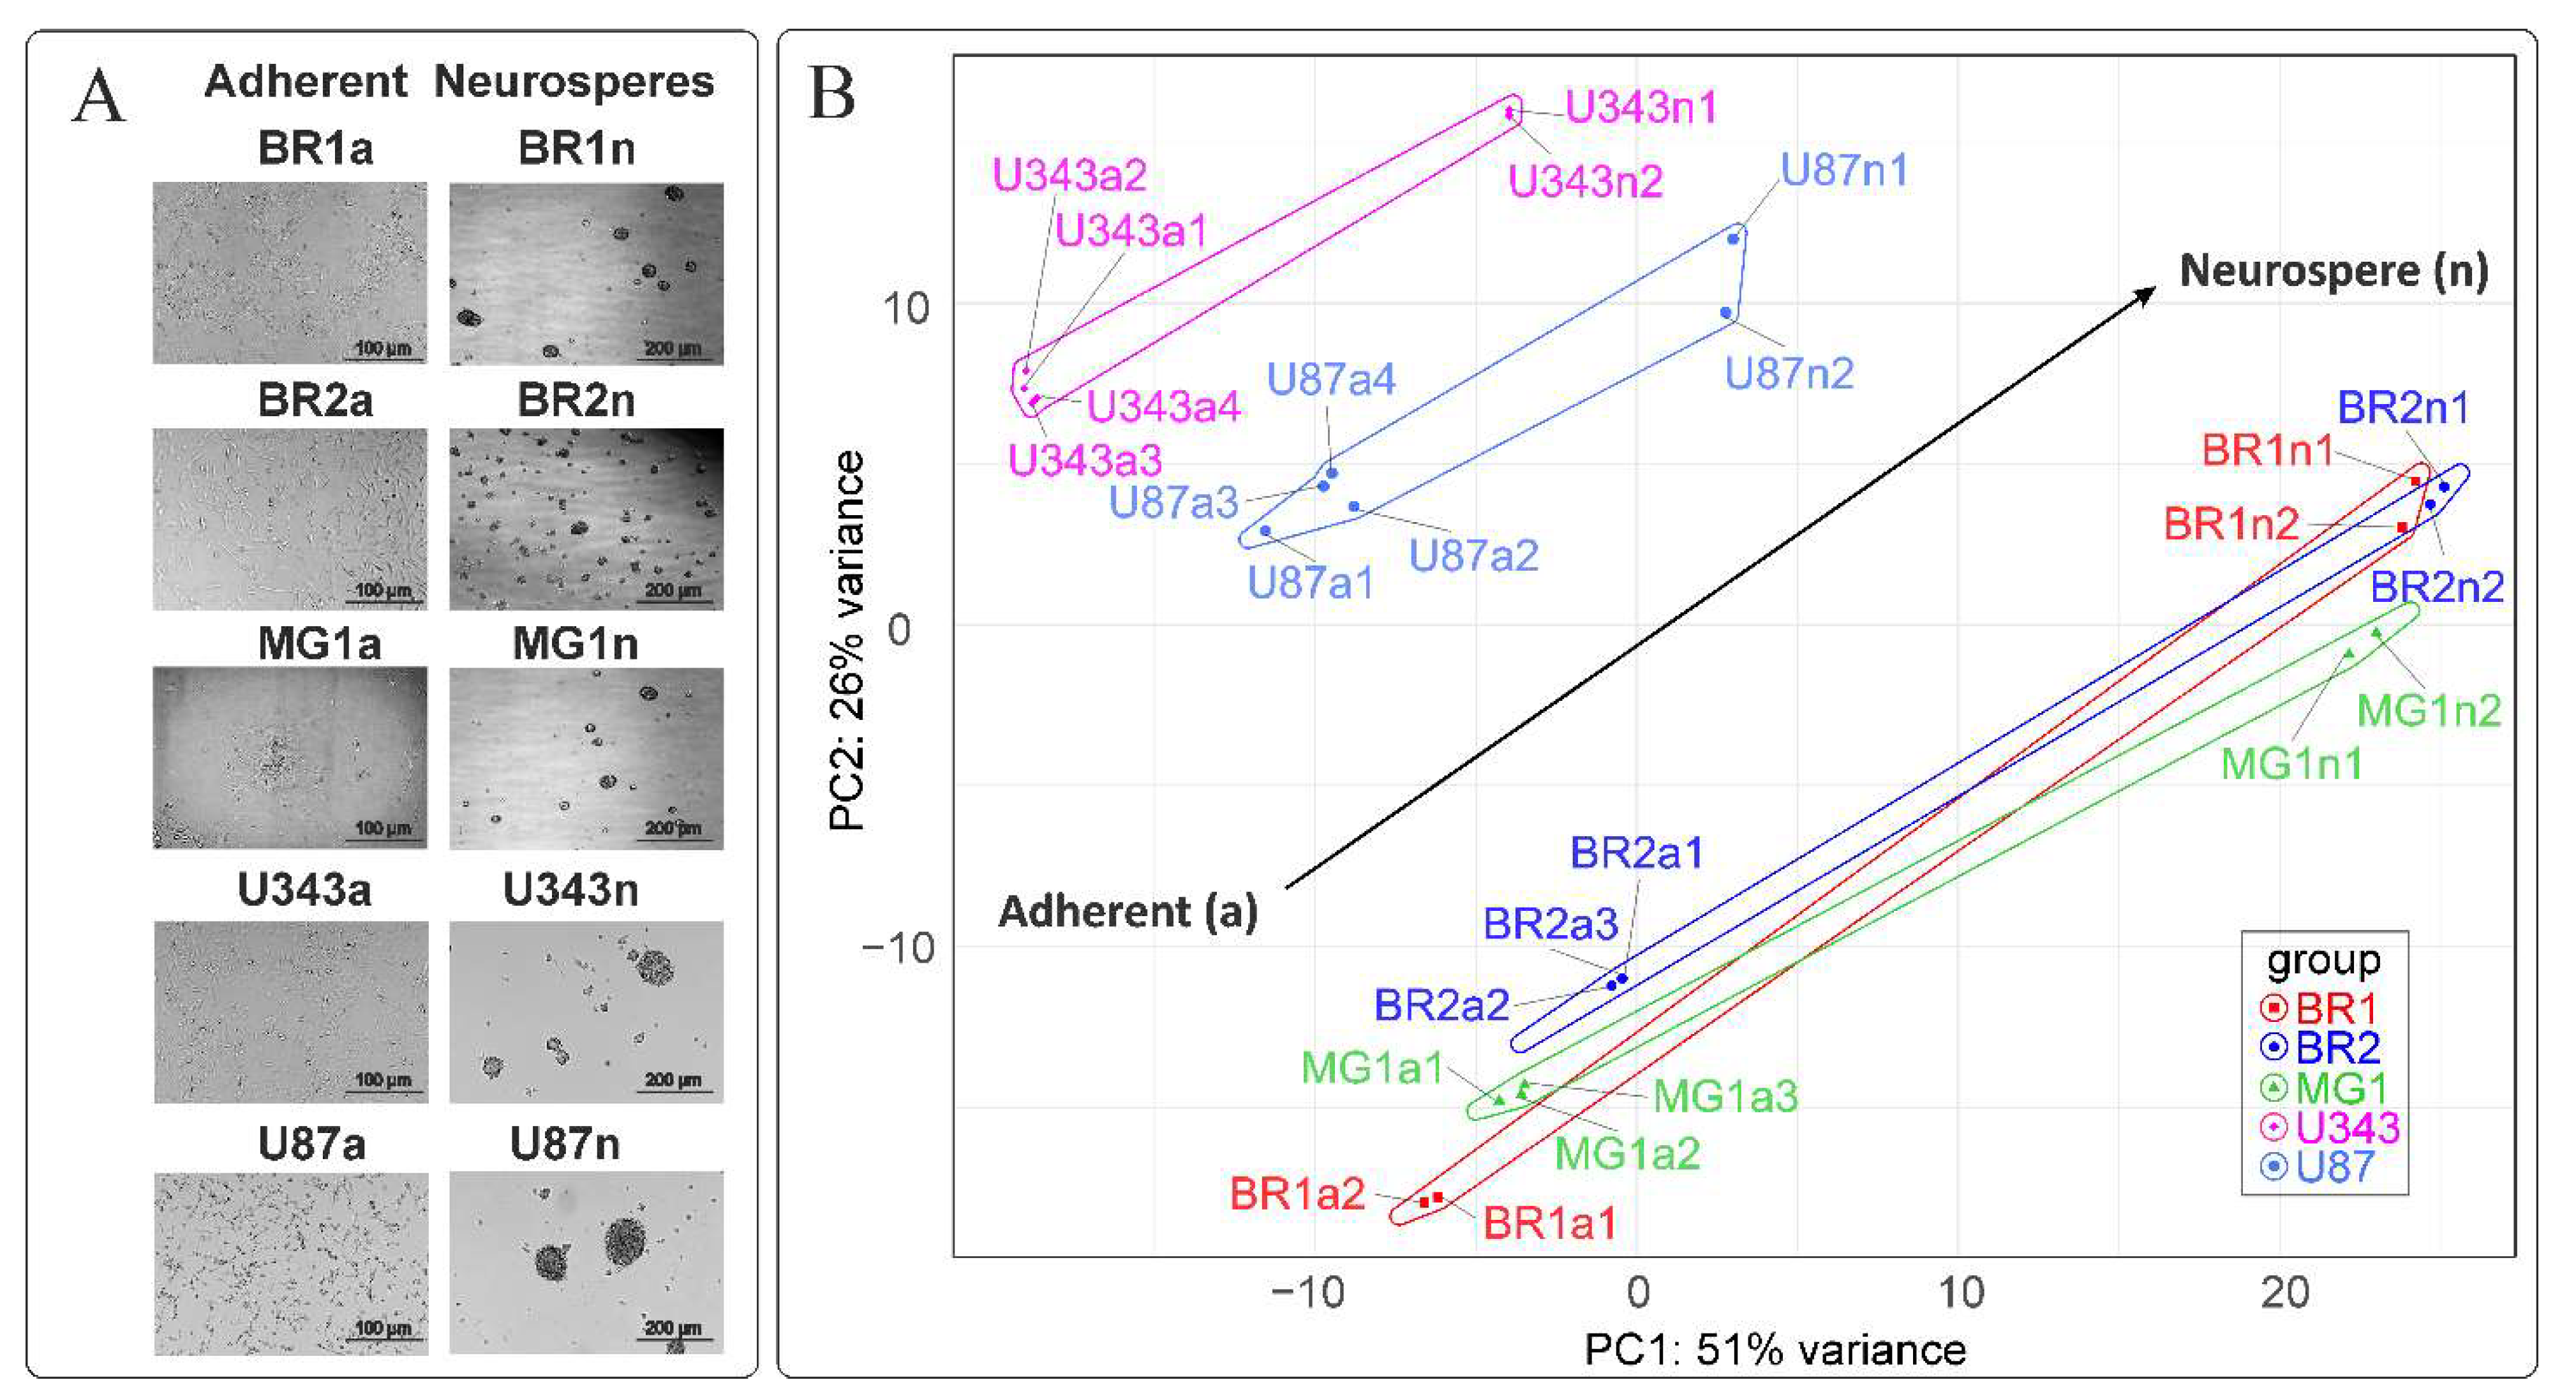
3.1. Neurosphere Formation from Primary Brain Tumors and Immortalized Cell Lines

In order to obtain patient-derived glioma cell cultures, we used three solid primary brain tumors (Table 1), which were acutely dissociated into individual cells. We used culture conditions that favored stem cell growth, developed for the isolation of neural stem cells in the form of neurospheres [7,34,35]. We also cultivated cells of immortalized lines U87 MG and U353 MG in the same conditions for neurosphere formation (Table 1).
Both patient-derived and immortalized glioma cells formed neurospheres (Figure 1A). Neurospheres obtained from immortalized cells formed faster, reaching a size of approximately 150 μm within 3–4 days. The efficiency of neurosphere formation by cells obtained from patients varied significantly for different cell cultures. Thus, MG1 cells formed spheres of 150 μm in size by 8–10 days of cultivation, while BR2 cells formed neurospheres within 3–5 days.

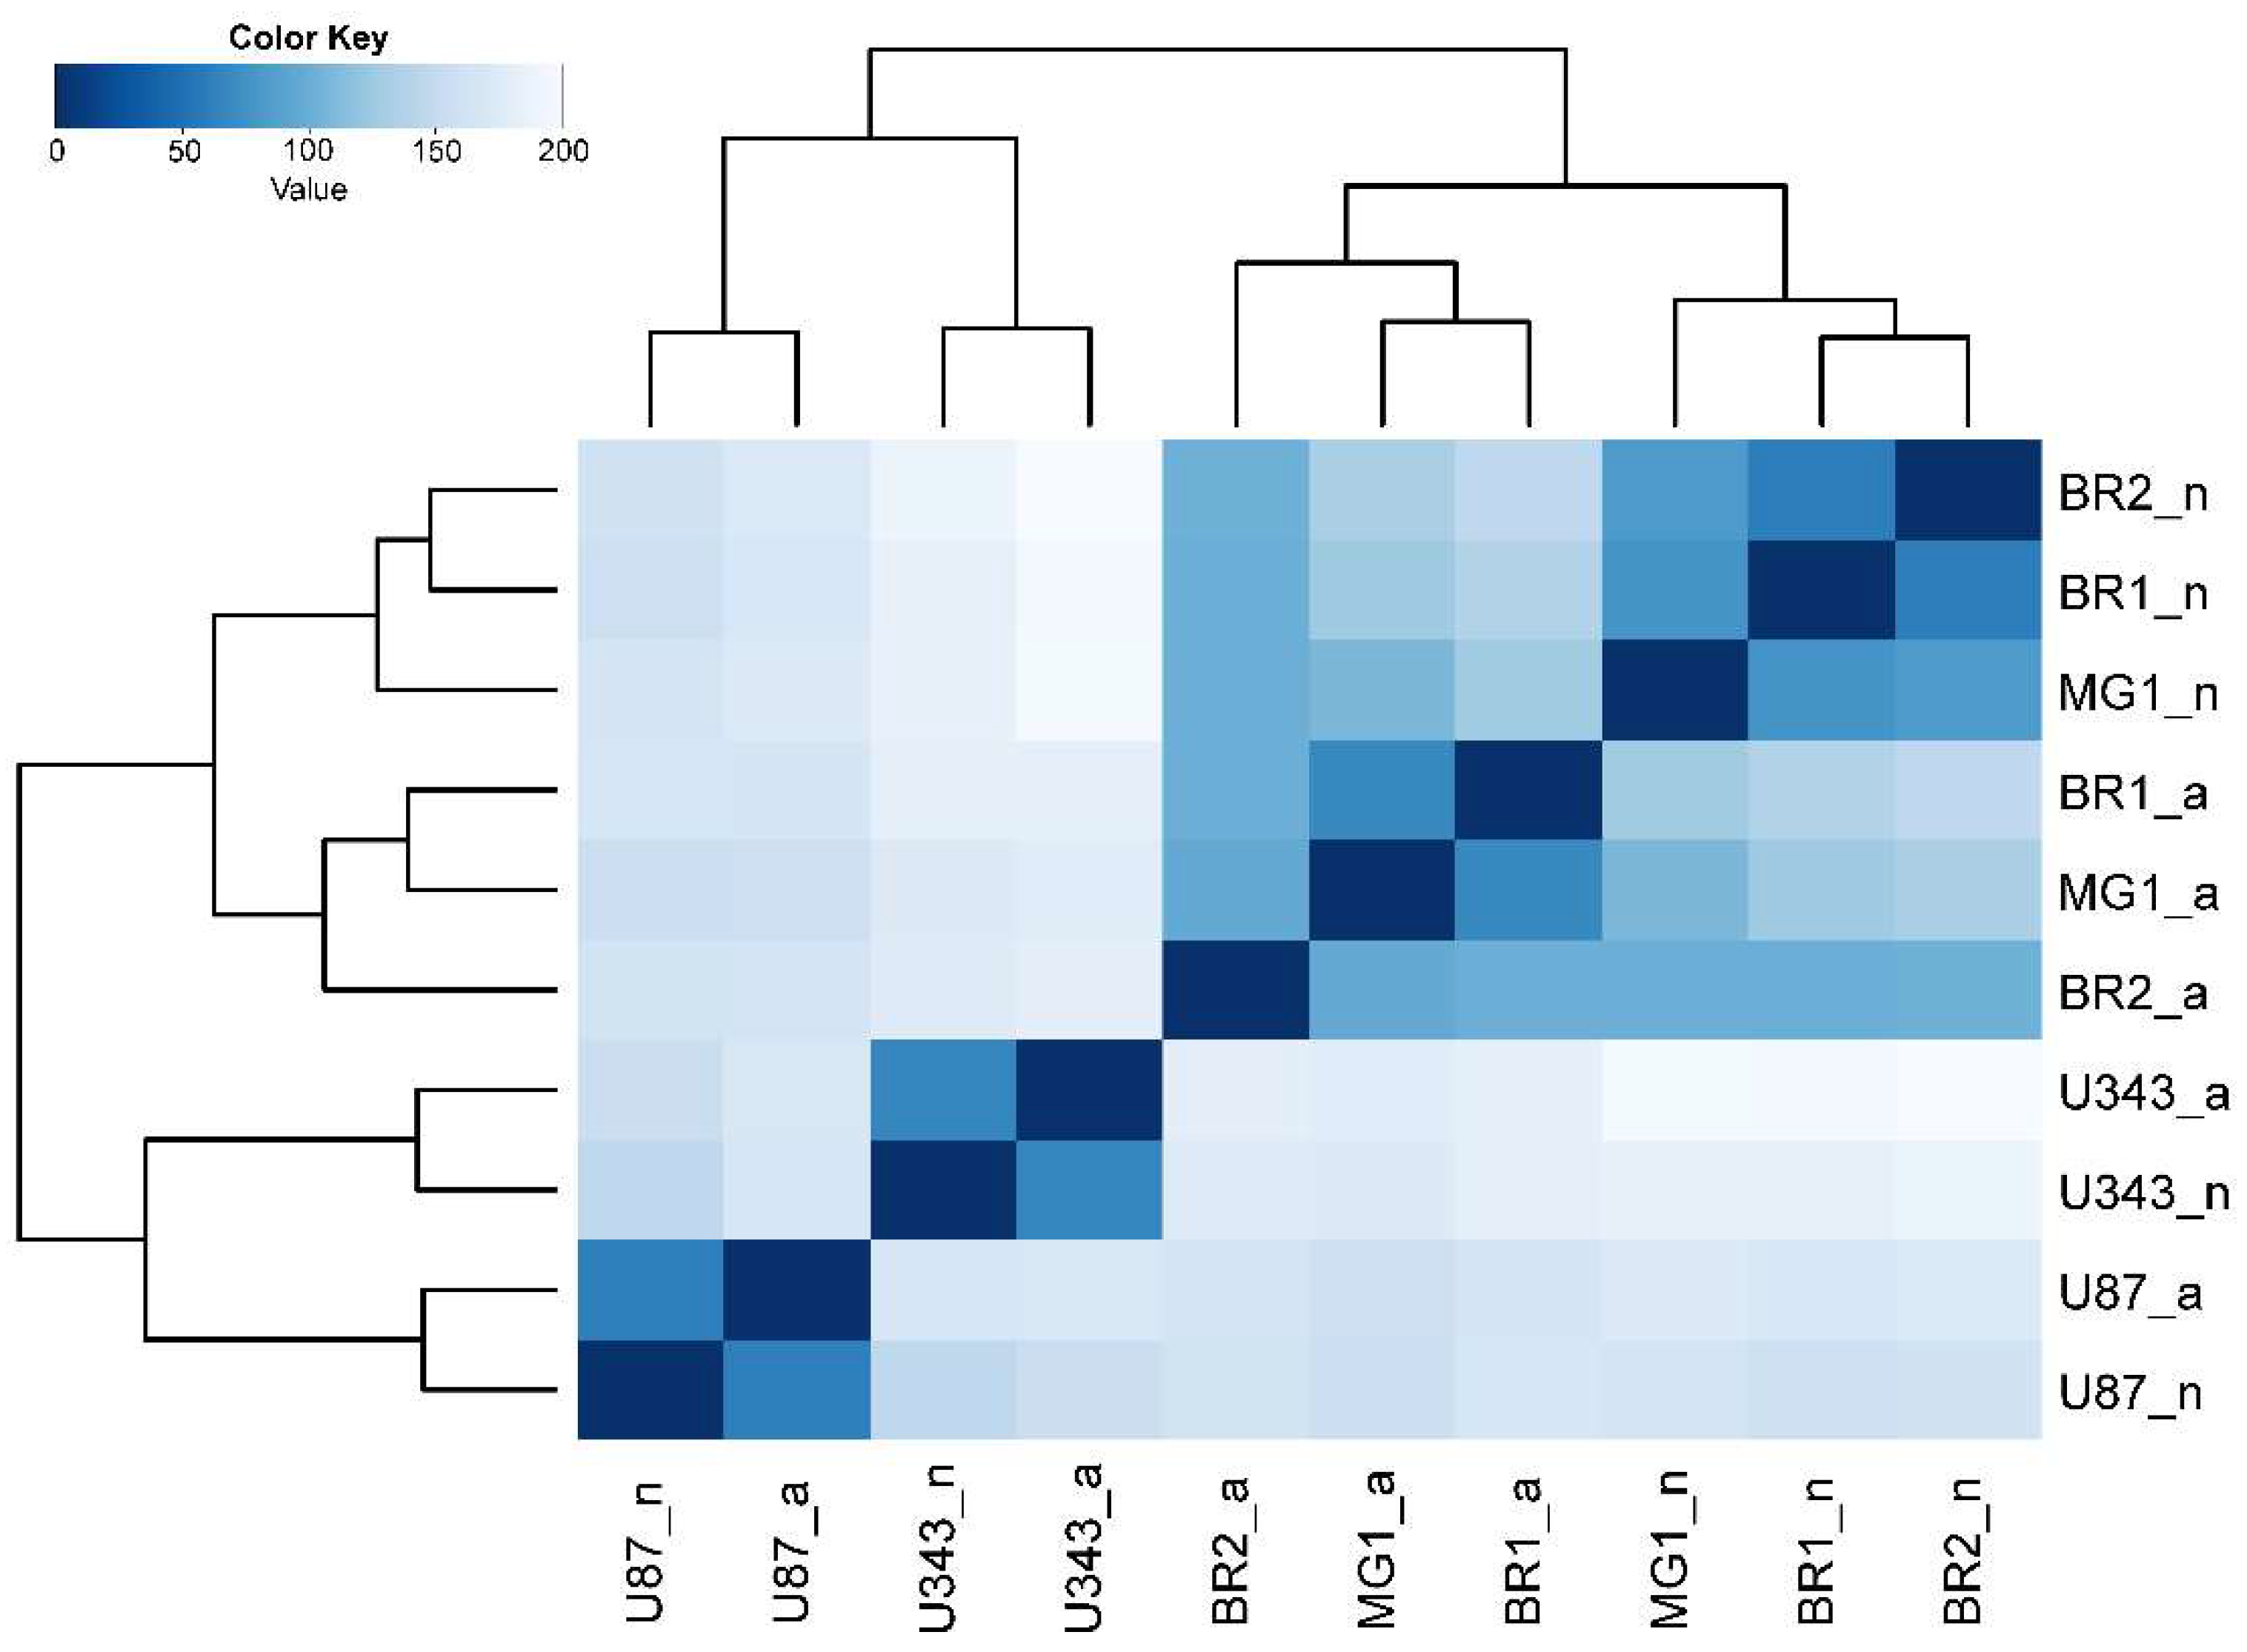
3.2. The Formation of Neurospheres Occurs in a Common Way in Patient-Derived Glioma Cell Cultures and Immortalized Cell Lines

We performed transcriptome analysis based on Illumina 1500 NGS platform and obtained from ~1.9 × 10⁷ to ~4.6 × 10⁷ experimental reads for each of gliomas cell cultures in adherent and neurosphere (Table 1).
To create a general description of transcriptome changes under the condition of NS formation, we started with the principal component analysis and hierarchical clustering (HC) of RNA sequencing data. The PCA shows that the formalized RNA expression data of immortalized cell lines U87 MG and U343 MG form distinct non-overlapping areas of points with that of the patient-derived glioma cultures BR1, BR2 and MG1. Patient-derived cells tend to form closely related and even overlapping areas in PCA graphs (Figure 1B). The HC, in conformity with PCA, shows that the transcriptomes of U87 a/n as well as U343 a/n cells form separate branches of the tree when compared to patient-derived cultures (Figure 2). In HC, clade included the adherent cultures BR1a, BR2a and MG1a consisting of separate branches, which are clearly distinguished from the corresponding neurospheres (Figure 1 and Figure 2).
This indicates that transcriptome changes in the process of glioma NS formation are determined to a greater extent by the initial cell-specific context of gene expression, but strongly modulated by the conditions of cultivation in the presence of bFGF and EGF. In light of this, the common trend of PC1:PC2 coordinate changes is observed for all analyzed gliomas (Figure 1B). Thus, the formation of NS has common transcriptional features and, possibly, common gene patterns for all analyzed gliomas.

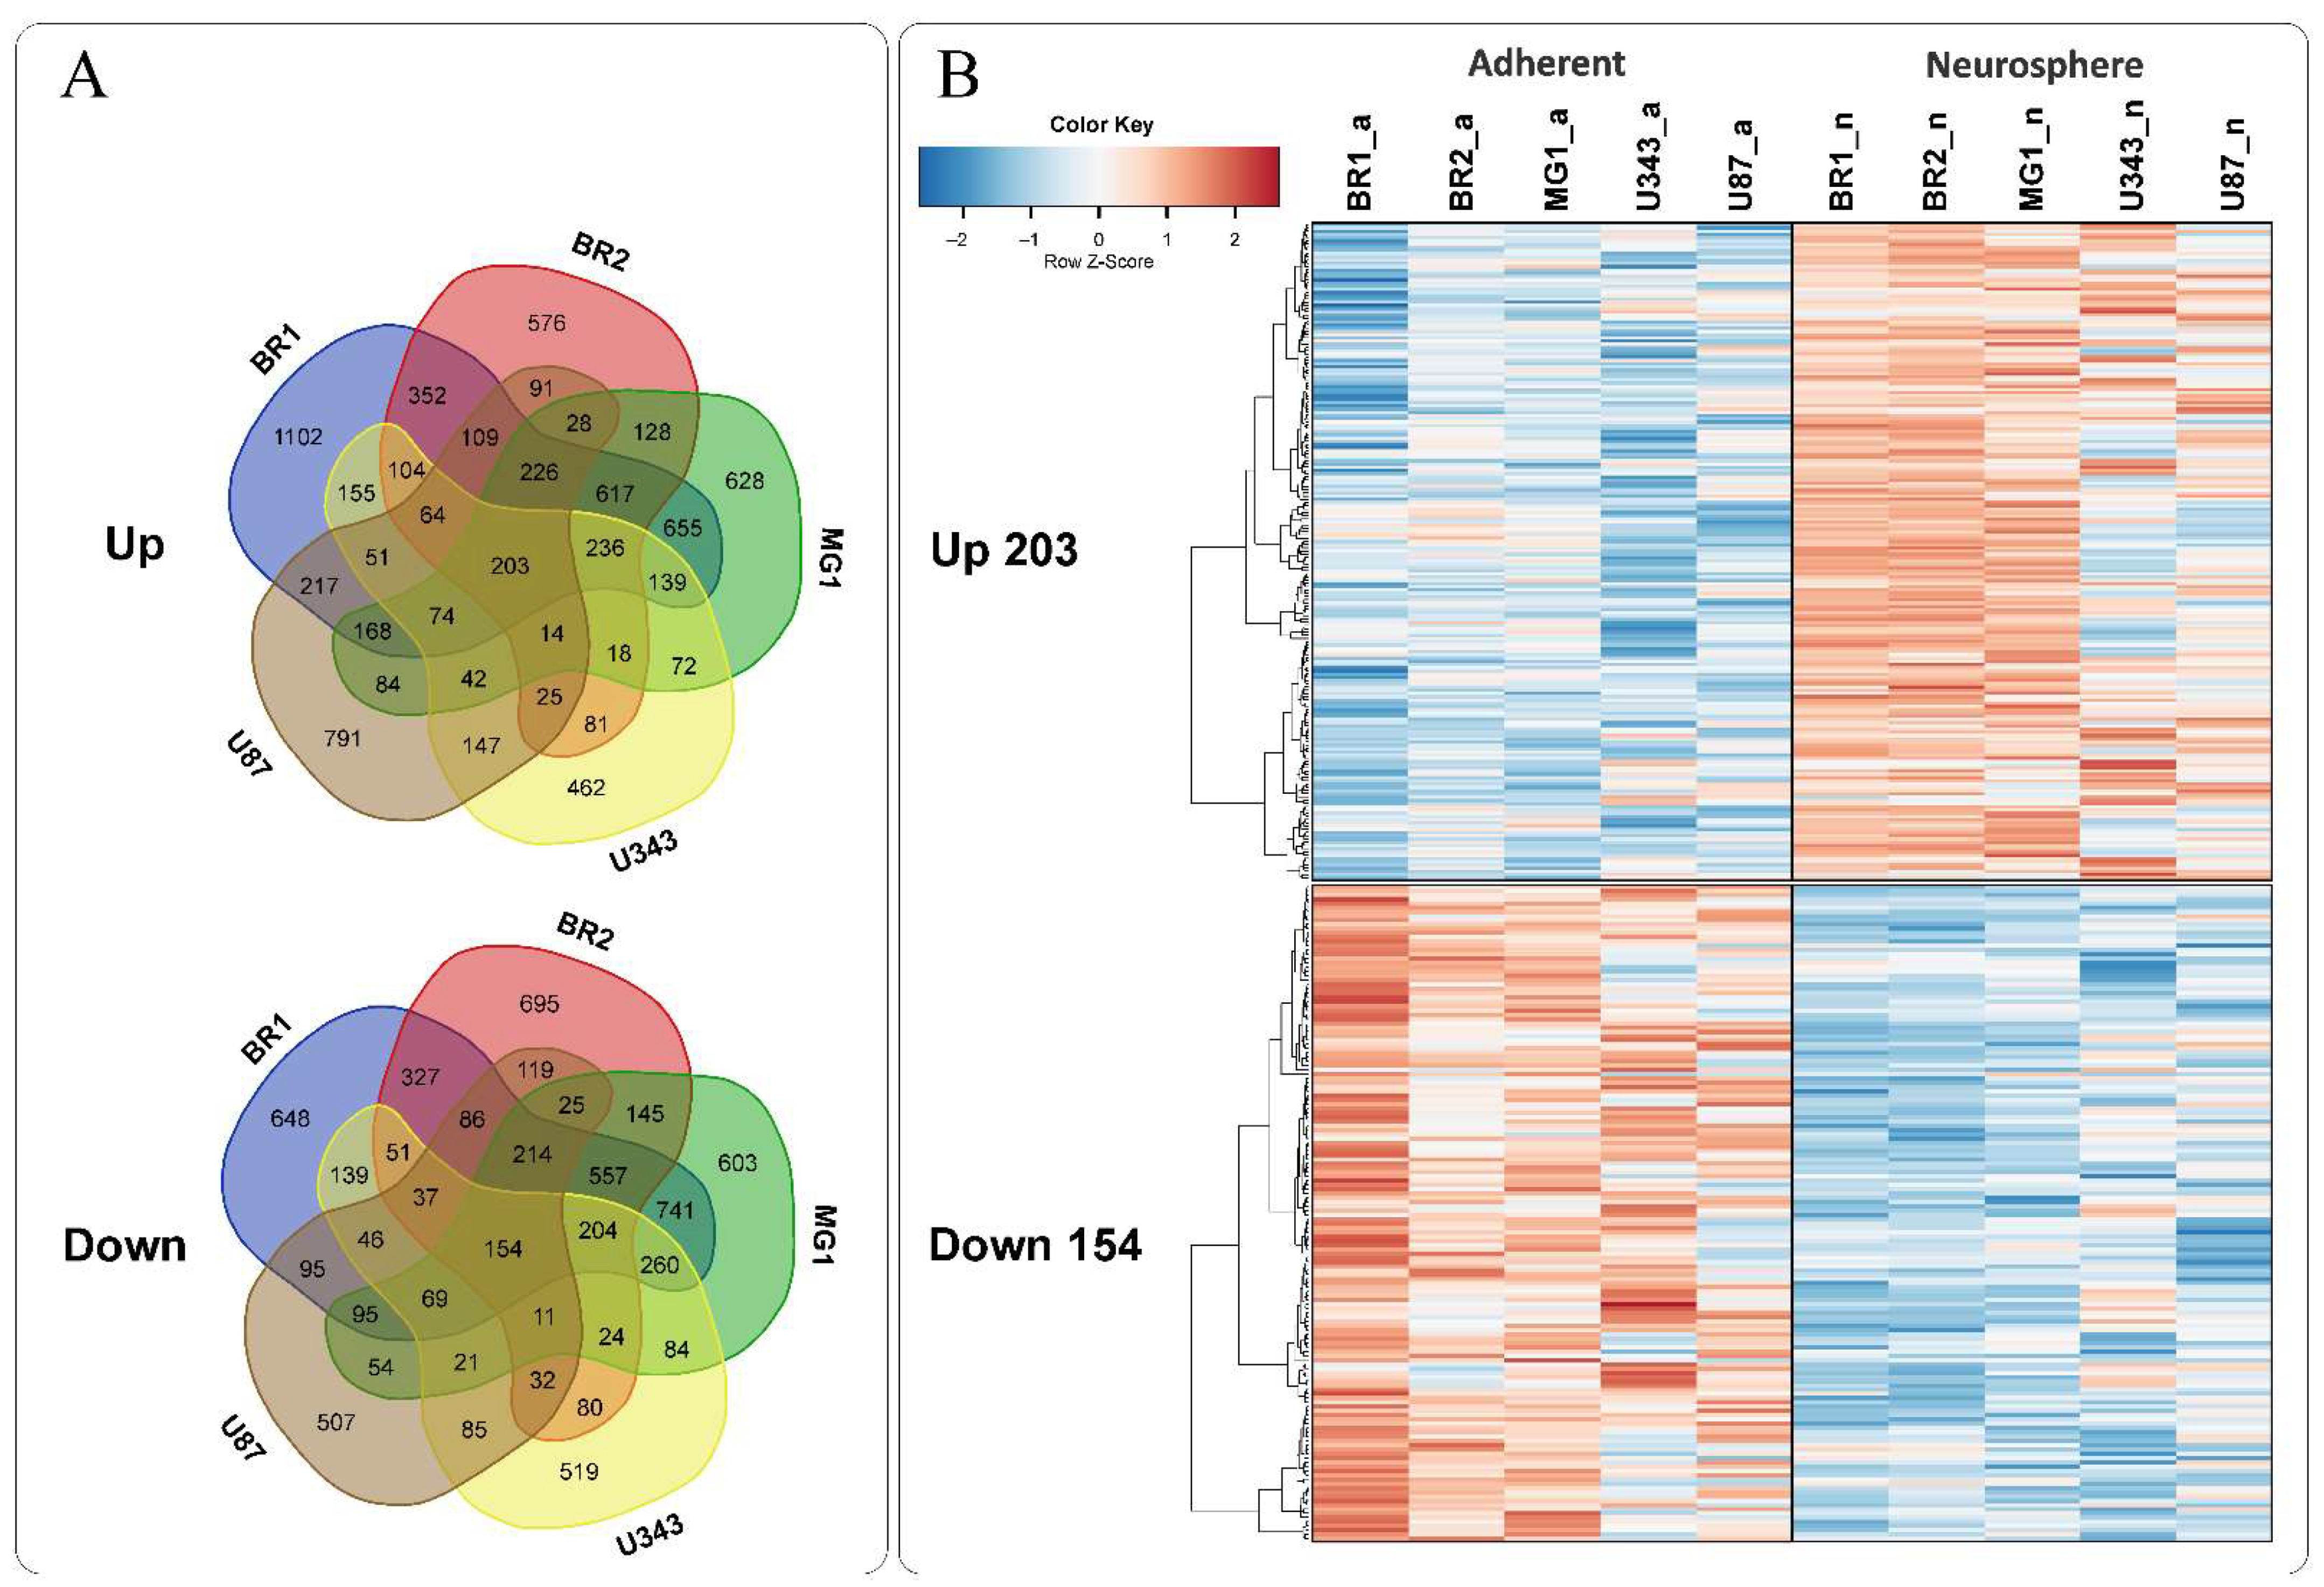
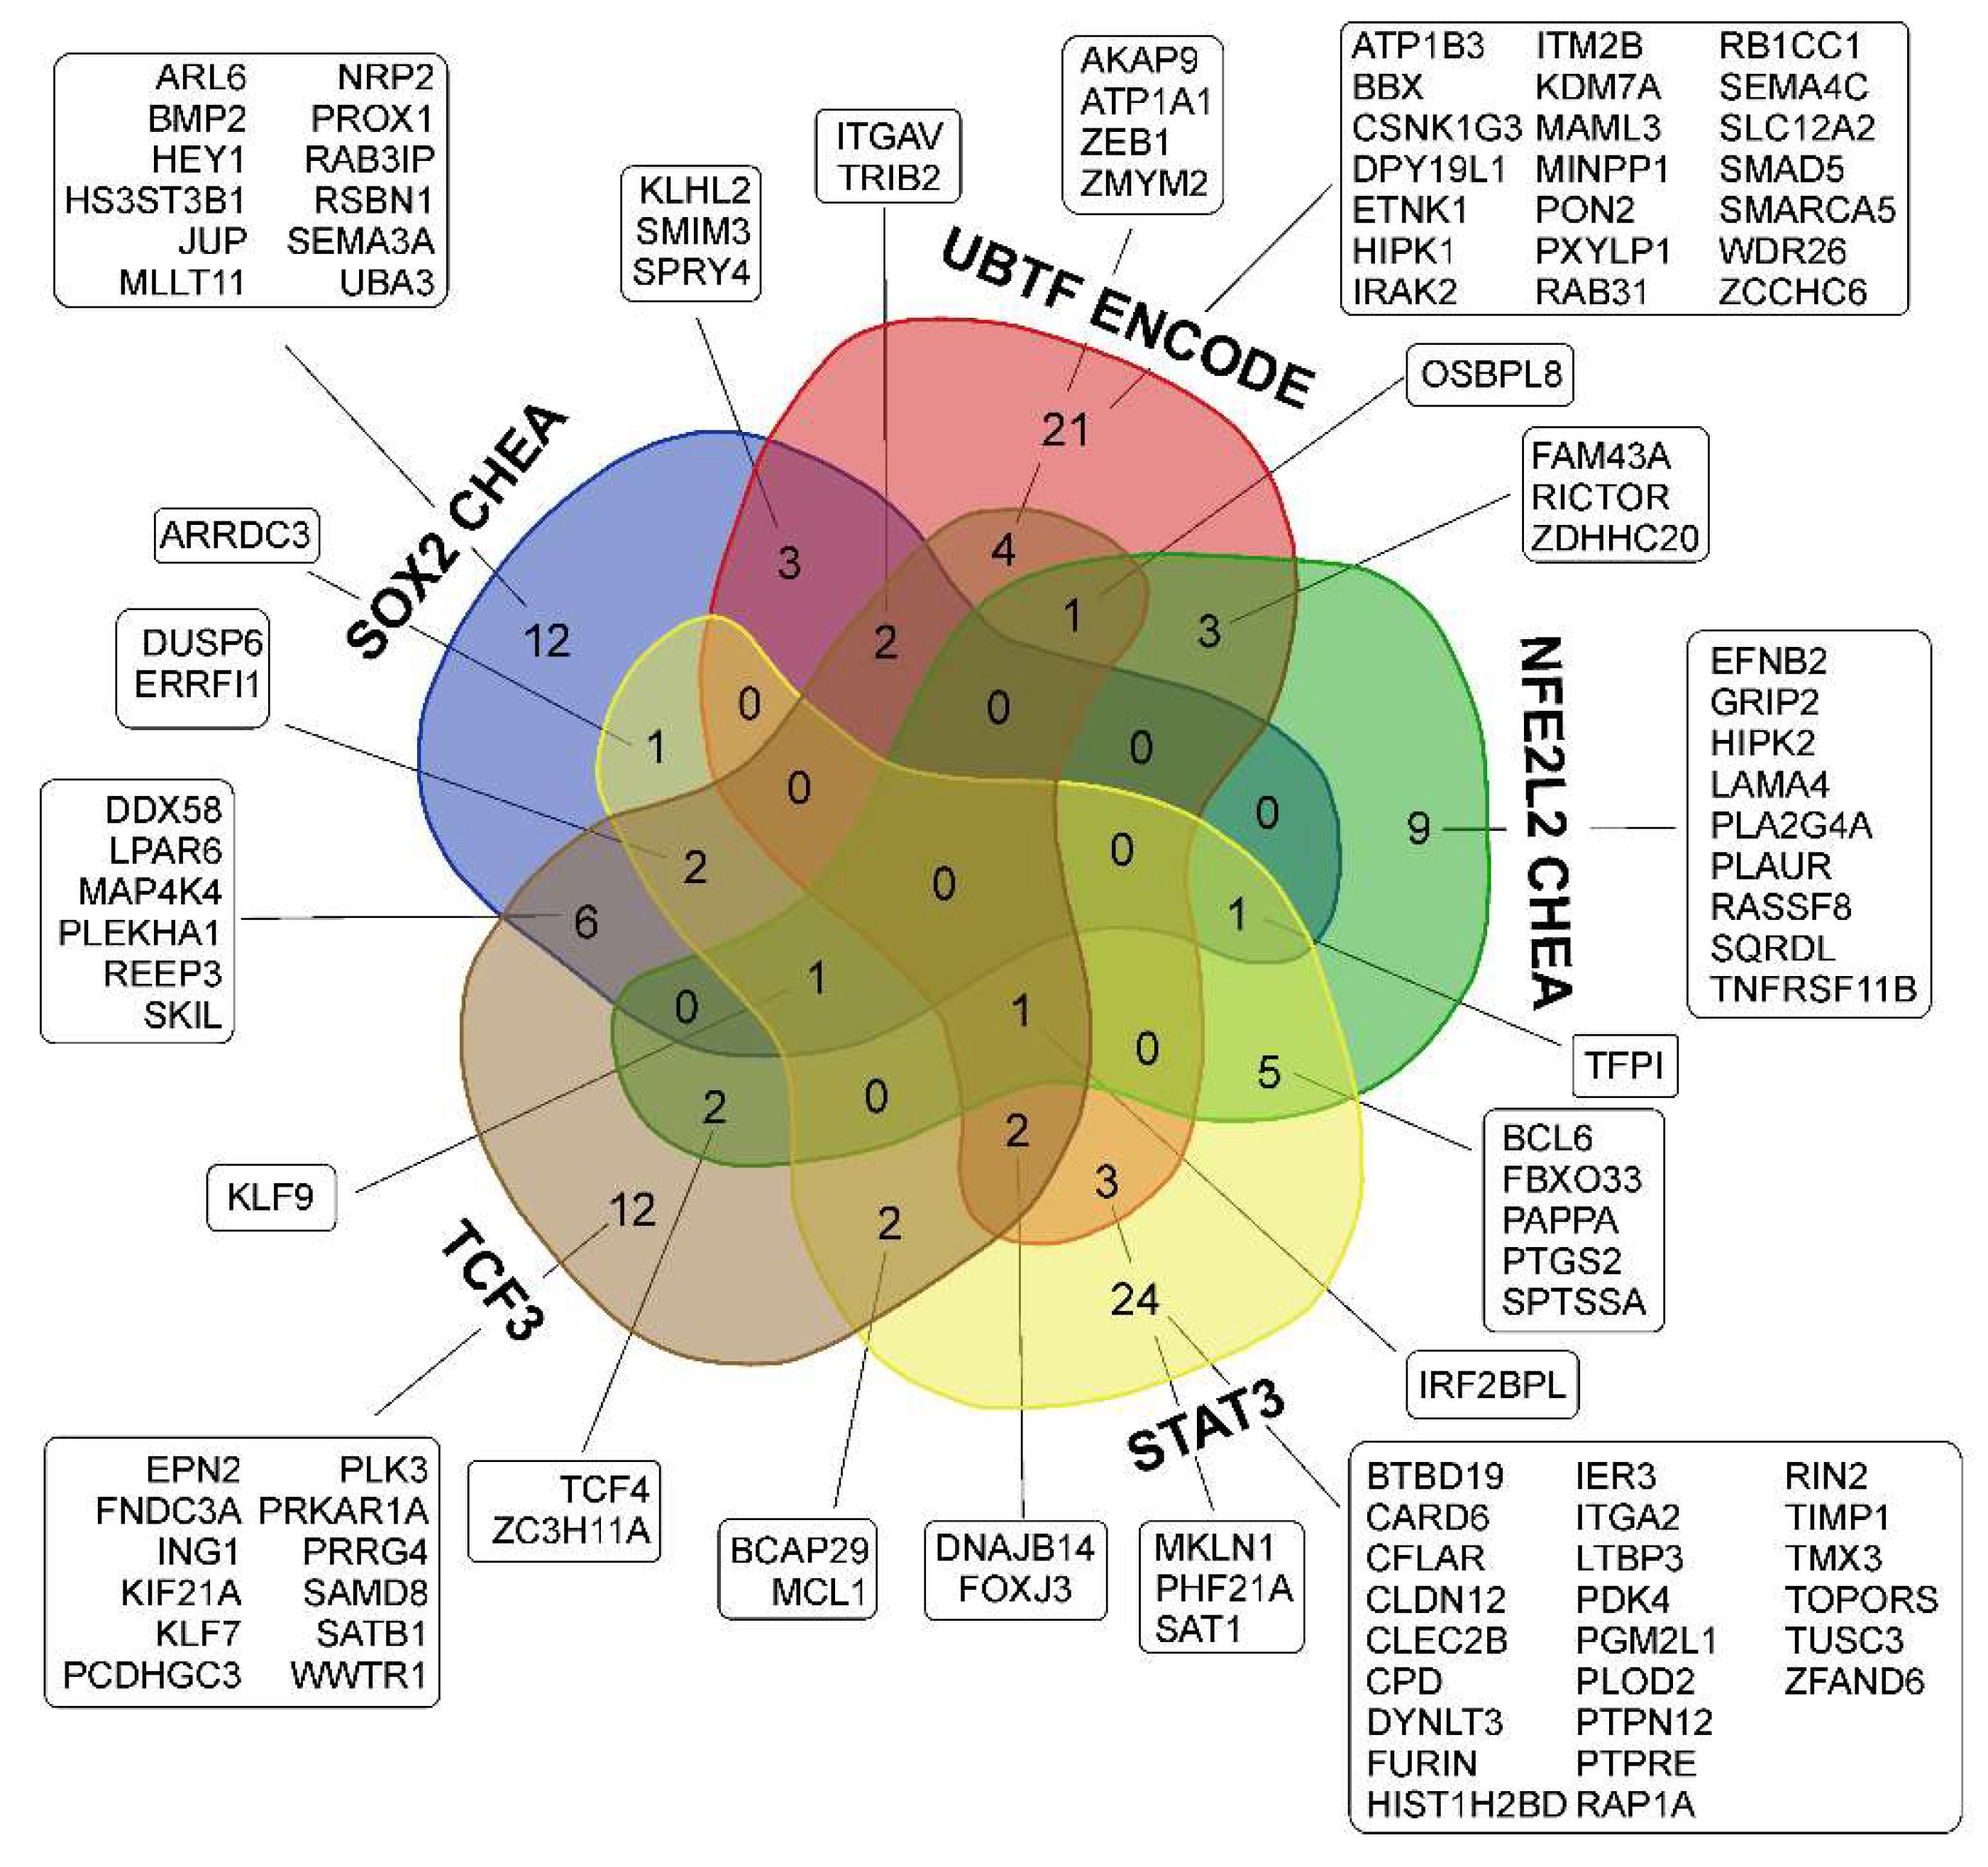
3.3. Common Gene Expression Changes in Both Patient-Derived and Immortalized Glioma Cell Cultures

To search for transcripts with similar trends in expression changes in the conditions of glioma NS formation, we used a direct approach, including the comparison of transcriptomes in specific monolayer/neurosphere (MN/NS) pairs separately and the determination of common overlapping transcripts for all analyzed pairs (Figure 3A).
We found 203 synchronously activated and, separately, 154 synchronously repressed overlapping transcripts in the gene expression sets of individual MN/NS pairs (Figure 3, Table 2).
To describe the common features of glioma cell NS formation, we used Enrichr [31]. For the overall description of TFs, controlling gene expression changes, we explored the Enrichr library “ENCODE and ChEA Consensus TFs from ChIP-X”. From the data in Table 3, it can be seen that in the sets of all upregulated transcripts, statistically significant increases were observed in those controlled by the transcription factors SOX2, UBTF, and NFE2L2.
SOX2, UBTF and NFE2L2 are among the 10 most significant factors responsible for increased expression both in particular MN/NS pairs and in the group of common overlapping genes. The downregulation of the activity of transcription factors MYC and MAX is observed in the Enrichr data for both specific MN/NS pairs and the corresponding set of overlapping genes (Table 3 and Table S2).

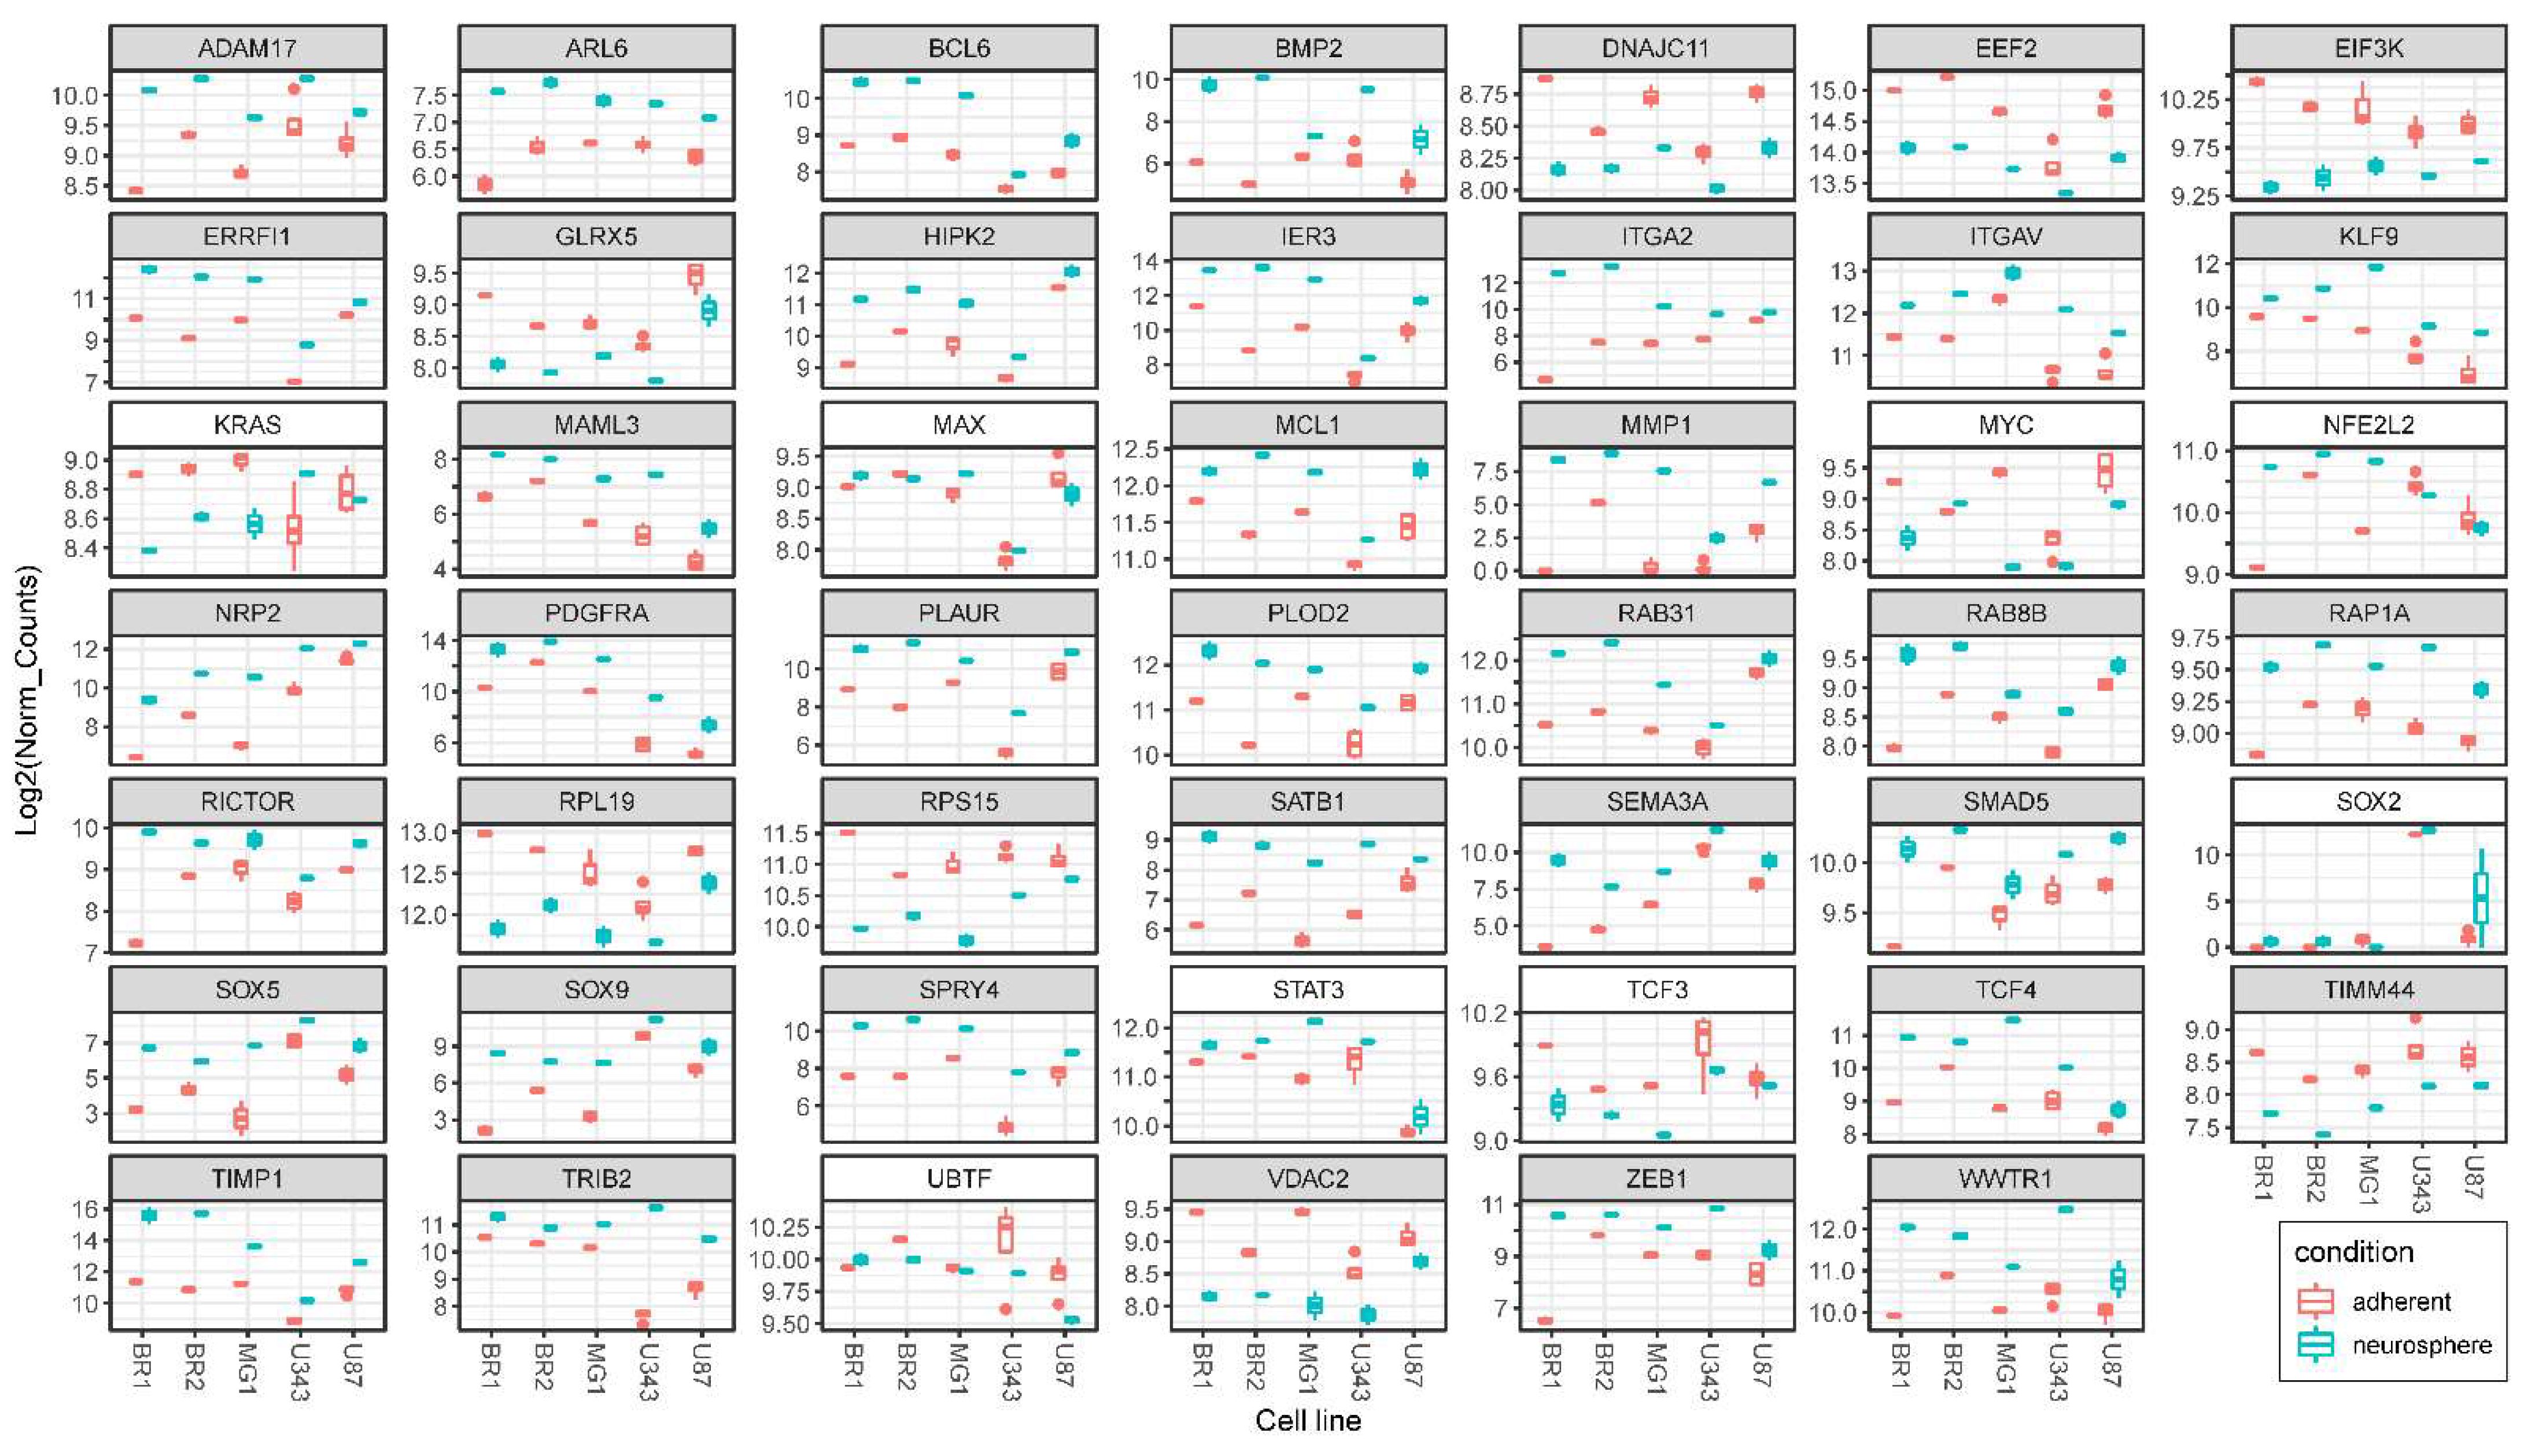
3.3.1. SOX2-Dependent Gene Activation under Conditions of Neurosphere Formation by Glioma Cells

It is known that the overexpression of transcription factor SOX2 has been found in different human cancers, including glioma. SOX2 regulates cell processes by activating or repressing target genes via binding its promoters. Traditionally, in the case of malignant neoplasms, the activation of SOX2 is associated with the development and maintenance of the stemness of tumor cells, increased cell proliferation, the activation of Wnt/β-catenin signaling, JAK/STAT3 signaling, apoptosis evasion, EMT promotion, invasion and metastasis. Additionally, different studies have shown the participation of SOX2 conferring drug resistance [36,37].
We found that the basic level of SOX2 mRNA significantly differs in glioma cells. The baseline level of SOX2 mRNA in immortalized cells is higher than in cells of patient-derived cultures. In light of this, for four out of the five analyzed cultures (except for MG1), an increase in the SOX2 mRNA level in NS cell cultures was detected (Figure 4).
Thus, changes in the relative level of SOX2 mRNA were not unidirectional for all analyzed cell cultures under conditions of NS formation. At the same time, there was a significant enrichment in SOX2-dependent transcripts in the lists of activated genes of individual cell cultures, as well as in the overlapping list of genes (“SOX2 CHEA” in Table 3 and Table S2, Figure 5). It can be proposed that the observed activation of the SOX2 TF is determined to a greater extent through the post-translational modifications of the SOX2 protein and/or its interaction with other factors, rather than through its level of mRNA in glioma cells.
Among the SOX2-dependent genes, the following should be highlighted: ITGAV, BMP2, SPRY4, NRP2, and SEMA3A. The ITGAV (Integrin αvβ3) plays a key role in FGF/FGFR signaling [38]. BMP2 (Bone Morphogenetic Protein 2) acts as a ligand for TGF-beta receptors that activate SMAD family transcription factors [39]. SEMA3A (Semaphorin 3A) is known to promote the invasion and migration of glioma cells, while NRP2 (Neuropilin-2) regulates the migratory ability of glioma cells in response to SEMA3A [40]. Importantly, SPRY4 is a factor that suppresses FGF/FGFR signaling by interacting with serine/threonine-protein kinase RAF1 and inhibiting its activity [41]. Therefore, the SOX2-dependent activation of SPRY4 provides feedback regulation of FGF/FGFR signaling in conditions of NS formation.
Thus, the activation of SOX2-dependent transcription creates a unified basis for the processes of intercellular interaction at the level of the FGF and TGF-beta/SMAD signaling pathways during the formation of NS by glioma cells. In addition, the activation of gene transcription whose products mediate the invasion and migration of glioma cells may indicate the triggering of the pro-neural to mesenchymal transition (Figure 6).

3.3.2. Activation of UBTF-Dependent Genes

UBTF (Upstream Binding Transcription Factor, UBF1), which is known as a key component of the Pol I pre-initiation complex, mediates the recruitment of RNA polymerase I to rDNA promoter regions. In light of this, UBTF is also involved in the modulation of RNA polymerase II transcription [42].
In our data, the level of UBTF mRNA did not undergo unidirectional changes during the transition from MN to NS (Figure 4). Therefore, it can be proposed that the observed increase in the expression of UBTF-dependent genes (Figure 4 and Figure 5, Table 3 and Table S2) is associated with the post-translational activation of the protein and/or its interaction with other factors.
The list of UBTF-upregulated genes includes ITGAV, SPRY4 (see above), MAML3, SMAD5, TRIB2 and ZEB1 (Table S2). MAML3 acts as a transcriptional coactivator for Notch proteins and Notch signaling in the nucleus [43]. SMAD5 is one of the key participants in the BMP signaling pathway, functioning as a transcriptional modulator activated by BMP type 1 receptors [44]. TRIB2 interacts with NF-κB and with substrates of the ubiquitin-proteasome system (TCF4, β-catenin, C/EBPα and CDC25B/C) [45].
Little is known about the involvement of UBTF in cancer progression. In melanoma, UBTF has been shown to act as cell cycle regulator. UBTF facilitates the transcription of G-protein-coupled receptor kinase-interacting protein 1, thereby activating MEK1/2-ERK1/2 signaling [46]. UBTF is also involved in the regulation of TOR signaling [47]. Our data confirm that in gliomas, during the formation of neurospheres, the activation of UBTF commonly leads to an increase in the mRNA level of the key component of mTORC2—RICTOR (Figure 4 and Figure 5). RICTOR, through cellular signaling downstream of receptor tyrosine kinase (PI3K/AKT/mTOR), is actively involved in cytoskeleton assembly, cancer invasion processes, proliferation, metastasis and poor prognosis [48].
Thus, the activation of UBTF-dependent genes potentially modulates Notch-, TCF4- and BMP-signaling, as well as the mTORC2 pathway.

3.3.3. ZEB1 Transcription Factor mRNA- and ZEB1-Controlled Genes

The list of UBTF-upregulated transcripts also includes ZEB1 mRNA (Figure 5, Table S2). TF ZEB1 plays an important role in GBM progression by acting as a pro-tumoral effector, and ZEB1 expression in GBM predicts the shorter survival and poor response to temozolomide [49,50].
Importantly, ZEB1-controlled transcripts are indexed in the Enrichr library “ENCODE and ChEA Consensus TFs from ChIP-X”. Despite the fact that the level of ZEB1 mRNA is statistically significantly and unidirectionally elevated in NS cultures (Figure 4), we did not reveal a significant enrichment in ZEB1-dependent transcripts, as shown in the top 10 TFs list (Table 3). Thus, an increase in the level of ZEB1 mRNA does not necessarily lead to the common and large-scale activation of ZEB1-dependent genes in glioma cells.

3.3.4. Activation of NFE2L2-Dependent Genes

NFE2L2 (NFE2 Like BZIP Transcription Factor 2, Nrf2) is a TF that is mainly involved in iron metabolism, oxidative defense, and redox imbalance in ferroptosis [51]. The mRNA level of the NFE2L2, as well as the mRNA level of the SOX2 and UBTF, did not undergo unidirectional changes under the conditions of NS formation (Figure 4). In light of this, in Enrichr data, we observed the statistically significant enrichment of NFE2L2-controlled transcripts in lists of all particular MN/NS pairs, as well as in the list of common upregulated genes (Table 3 and Table S2, Figure 5).
The list of genes controlled by NFE2L2 includes PLAUR, HIPK2, and TCF4 (Figure 5, Table S2). PLAUR encodes the urokinase receptor (uPAR). PLAUR has been shown to promote glioblastoma NS cell survival and is associated with a more aggressive mesenchymal subtype of glioblastoma tissue [52]. HIPK2 is involved in TP53-mediated cellular apoptosis and the regulation of the cell cycle [53]. TCF4 in glioma cells mainly acts in the Wnt/β-catenin-signaling pathway and interacts with TRIB2 [45]. The transcription factor TCF4, forming the complex with β-catenin, binds with Akt2 promoter and activates Akt signaling cascades [54].
Recently, the NFE2L2 mRNA level has been shown to correlate with poor prognosis in patients with low-grade glioma [55]. NFE2L2 is involved in mediating TMZ glioblastoma resistance via MMP-2 [56]. NFE2L2 is also directly involved in the stabilization of the hybrid epithelial/mesenchymal state in RT4 urinary bladder transitional cell papilloma and UM-UC-1 bladder transitional cell carcinoma. Experimental–computational analysis revealed that the Nrf2(NFE2L2)-EMT-Notch1 network coordinates cancer cells in the migrating front during collective migration [57].
Thus, our results and the literature data indicate a significant role of the transcription factor NFE2L2, not only in the regulation of the formation of glioma neurospheres, but also in the stabilization of the hybrid epithelial–mesenchymal phenotype, which promotes the migration and invasion of cancer cells.

3.3.5. Activation of STAT3 TF- and STAT3-Dependent Genes

STAT3 (signal transducer and transcription activator 3) plays a critical role in the pathogenesis of gliomas, immune suppression, immune cell tolerance, the proliferation and migration of glioma cells, promoting angiogenesis, and the stemness maintenance of CSCs. The activation of STAT3 is induced by cellular plasma membrane receptors, such as growth factors receptors (EGFR, PDGFR, FGFR, etc.) as well as cytokines receptors [58]. It is worth noting that the role of STAT3 is twofold—it regulates both oncogenes and tumor suppressor genes, so it can stimulate or inhibit oncogenesis depending on its interaction with various signals in the oncogenic environment and/or the presence of two splicing isoforms [59].
In spite of the fact that the “ENCODE and ChEA Consensus TFs from ChIP-X” Enrichr library contains special gene lists of STAT3 indicator genes—” STAT3 ENCODE” and “STAT3 CHEA”—we did not find STAT3 to be a statistically significant TF in the lists of the top 10 common (overlapping) or particular TFs (Table 3). At the same time, enrichment in STAT3-dependent genes is observed when analyzing a list of 203 unidirectionally activated genes in “ChEA 2016” or “ENCODE TF ChIP-seq 2015” libraries separately (Table S2). Here, we used data for STAT3 controlled genes from the Enrichr library “ENCODE TF ChIP-seq 2015” concerning the overlap with the “STAT3 HeLa-S3 hg19” gene list (Table S2, Figure 5).
The list of common upregulated STAT3-controlled genes includes KLF9, BCL6, MCL1, ITGA2 and ERRFI1 (Figure 5). The KLF9 is known to suppress Notch1 signaling and inhibit glioblastoma-initiating stem cells [60]. In turn, BCL6 is known to be a glioma-promoting gene and a biomarker whose activation correlates with the clinical grade. BCL6 protein regulates CSC self-renewal through Notch signaling [61]. Such data may indicate the presence of a negative feedback loop between the activation of Notch signaling by upregulated STAT3-controlled genes and the maintenance of stemness. PTGS2 activates the NF-κB signaling pathway, leading to tumor cell proliferation and tolerance to radiotherapy [62]. MCL1 modulates cell division through interactions with cell cycle regulators, acts as a molecular switch for double-strand break DNA repair, regulates autophagy and mitophagy, and modifies calcium homeostasis at the ER and mitochondrial membranes [63]. MCL1 silencing has been shown to lead to the senescence and apoptosis of glioma cells through the inhibition of the PI3K/Akt signaling pathway [64]. ITGA2 (encodes integrin α2 subunit, CD49b) plays a role in cancer cell migration, cancer stemness and differentiation [65]. Importantly, ERRFI1 mediates EGFR endocytosis and lysosomal degradation, and promotes the ubiquitination and degradation of the receptor, which qualifies it as a bona fide feedback inhibitor of the EGFR signal transduction pathway [66]. Thus, the STAT3-dependent (as well as SOX2- and TCF3-dependent) increase in ERRFI1 expression provides the common glioma path for the regulation of EGFR signaling.

3.3.6. Transcription Factor TCF3 and TCF3-Dependent Genes

Our data show that TCF3 is represented in the list of the top 10 activated TFs of all analyzed glioma NS, except BR2 (Table 3). Accordingly, the enrichment of the glioma’s overlapping activated genes in those controlled by TCF3 is not highly statistically significant (Enrichr p-value < 0.01; adjusted p-value > 0.05; Table S2). However, a growing body of new data on TCF3 points to the high importance of genes controlled by TCF3 and TCF3 itself in the development and invasion of glioma cells.
TCF3 is a member of the E protein family of the helix–loop–helix transcription factors belonging to the Tcf/Lef family of Wnt signaling effector molecules. TCF3 is involved in neuronal differentiation, and is considered as an intracellular inhibitor of pluripotent cell self-renewal that acts by limiting the sustained levels of self-renewal factors [67]. The overexpression of TCF3 has been detected in several types of human cancers, including Wilms’ tumor, breast cancer, renal carcinoma and embryonal carcinoma [68]. The TCF3-β-catenin complex activates the classic Wnt signaling pathway, regulates cell proliferation, and is closely associated with the onset and development of tumors. TCF3 also promotes glioma development through PI3K/Akt and MAPK-Erk signaling pathways [69].
Our data show that the relative level of TCF3 mRNA is downregulated in NS (Figure 4). With that from the set of upregulated genes 17 and 19 TCF3 controlled transcripts are indexed in the “TCF3 ENCODE” and “TCF3 CHEA” Enrichr libraries, respectively (Figure 5, Table S2), including MCL1, TCF4 mentioned above and ATP1A1, ZMYM2, IRF2BL2, SAT1, WWTR1, SATB1 and others.
The subunit of Na+/K+-ATPase a1 (ATP1A1), which is overexpressed in GSCs, is considered as a new therapeutic target for gliomas [70]. ZMYM2 promotes the association of the BRCA1 factor with double strand breaks, thus playing an important role in DSB mainly through homologous recombination [71]. It was shown that IRF2BPL drives the ubiquitylation and degradation of β-catenin, which points to a reverse loop in the regulation of the Wnt signaling pathway [72]. The overexpression WWTR1, a transcriptional coactivator with the PDZ-binding motif, leads to tumor proliferation and CSC renewal [73]. Phosphorylated special AT-rich sequence-binding protein 1 (SATB1) is a TF associated with the progression and poor prognosis of glioma [74]. SATB1 knockdown is known to affect important oncogenes, including Myc, Bcl-2, Pim-1, EGFR, β-catenin, and survivin, with molecules involved in the cell cycle, EMT, and cell adhesion. It was found that there is a positive feedback loop between mediators of the Wnt signaling pathway TCFL2/β-catenin and SATB1: the maintenance of Wnt signaling by SATB1 and the induction of SATB1 expression through the activation of Wnt signaling. This indicates the functioning of reverse regulation between the transcription factors of the TCF family and the transcription factor SATB1. The feedback between TCFs and SATB1 can potentially be considered as an essential component of the transcriptional network that regulates the formation of neurospheres by glioma cells, as well as the maintenance of the stemness, migration, and invasion of gliomas.
In general, the activation of TF TCF3 and elevated levels of TCF3-dependent transcripts is associated with the regulation of Wnt-, PI3K/Akt and MAPK-Erk signaling pathways.

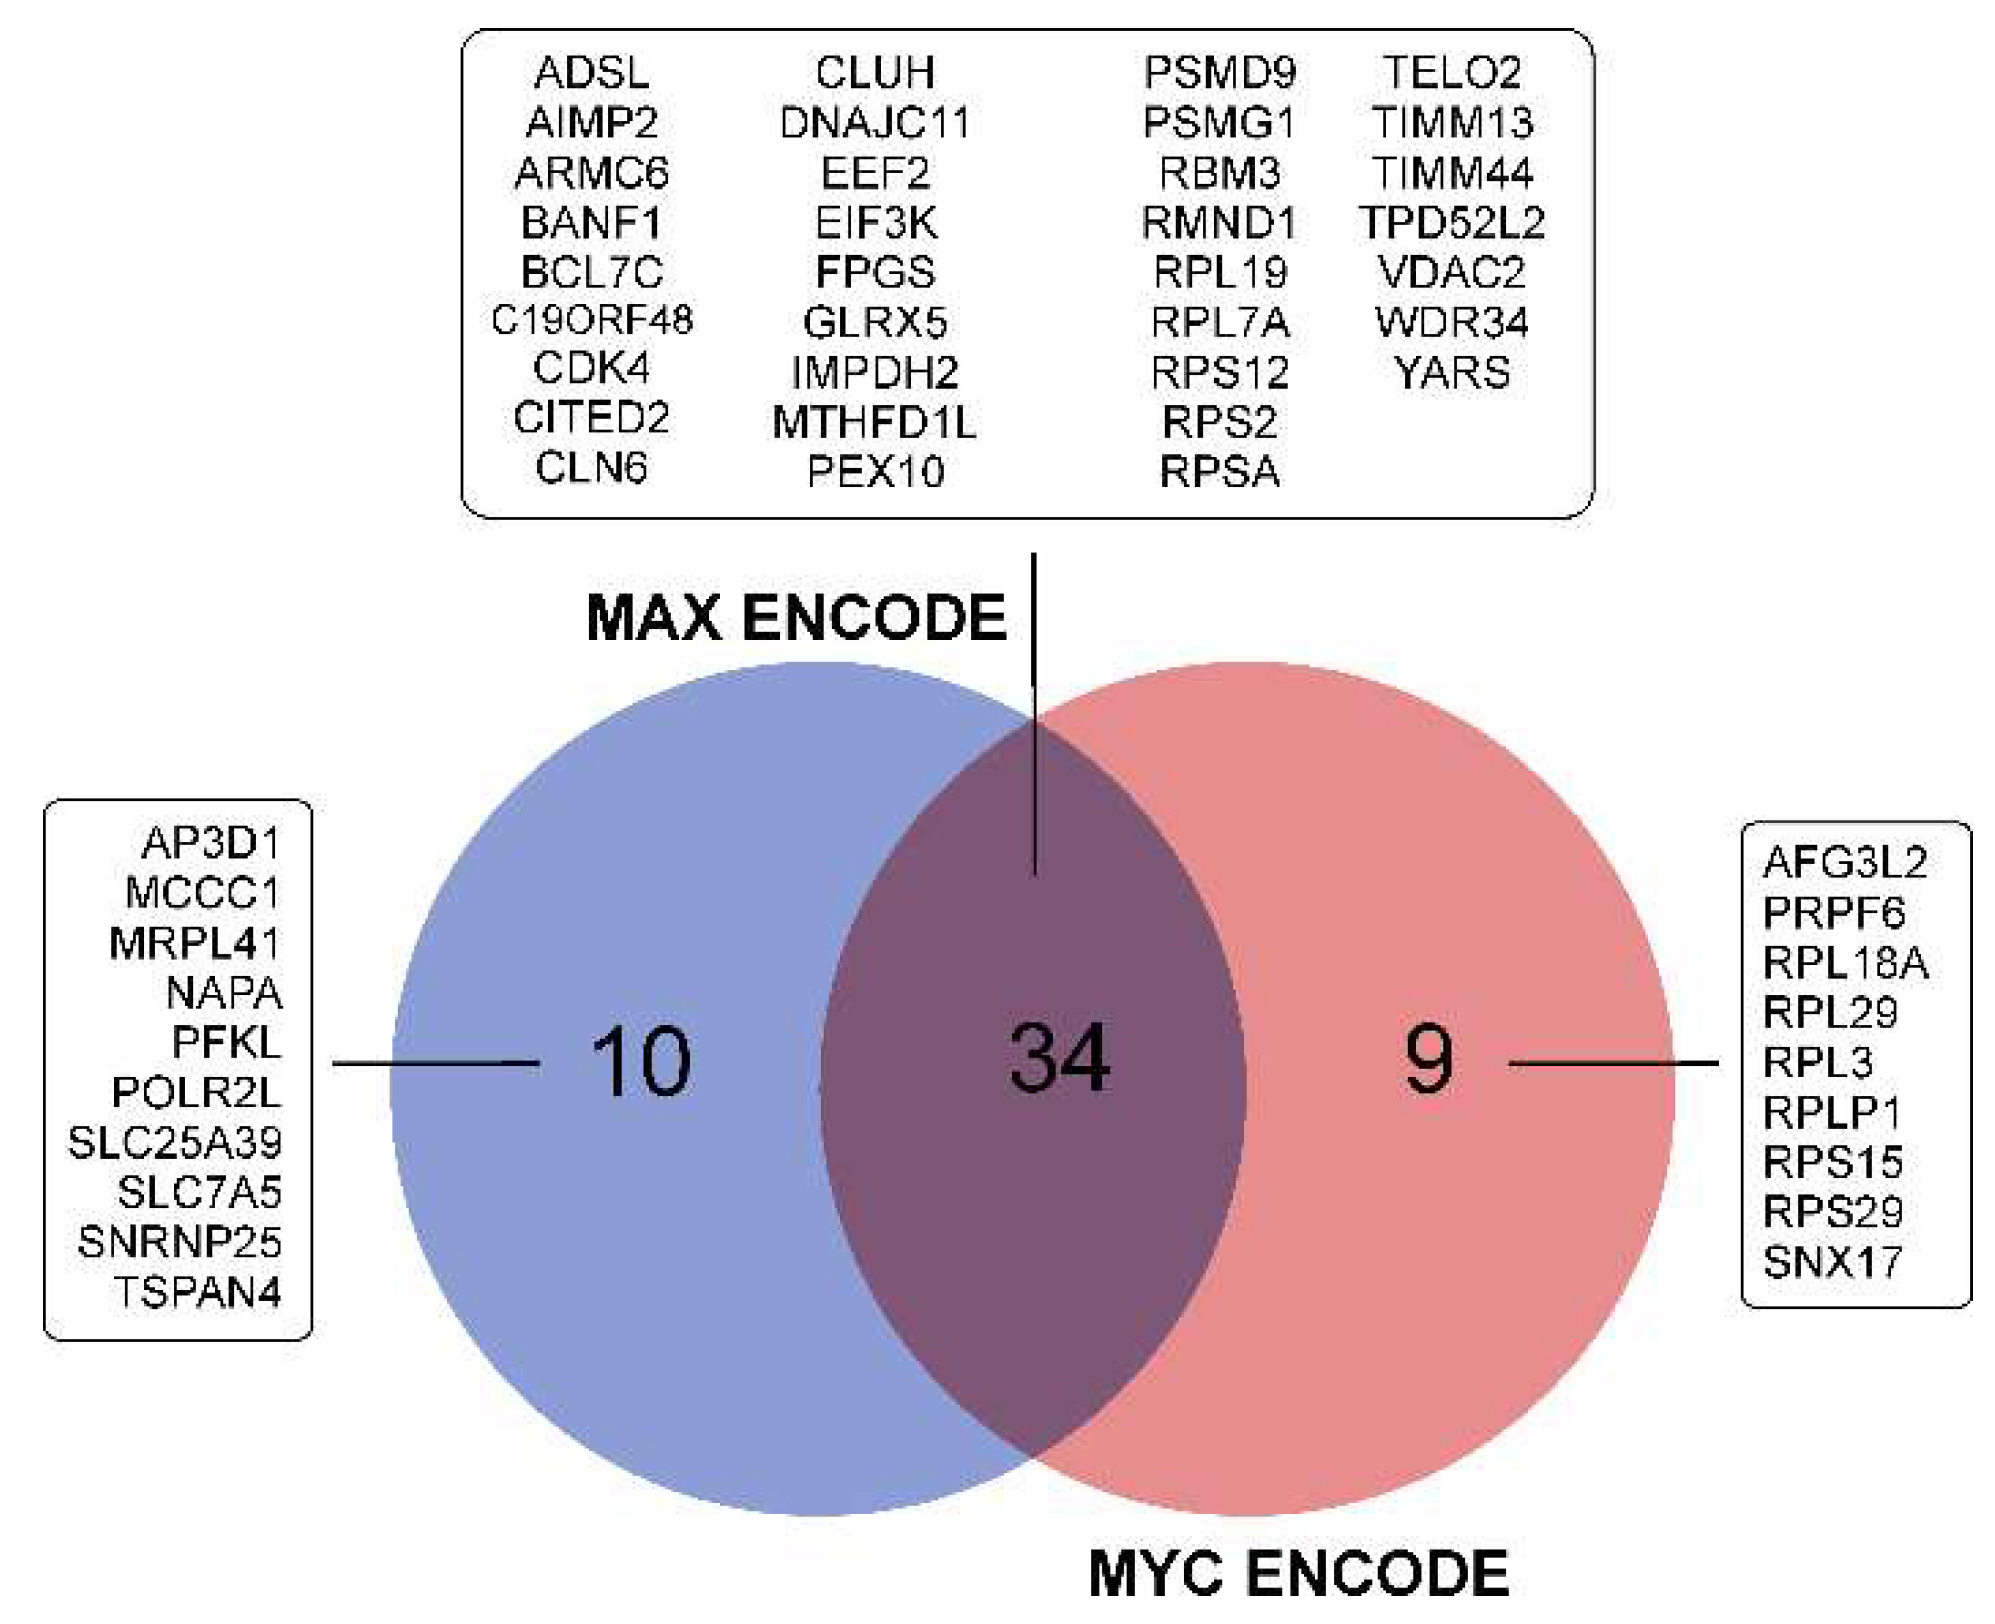
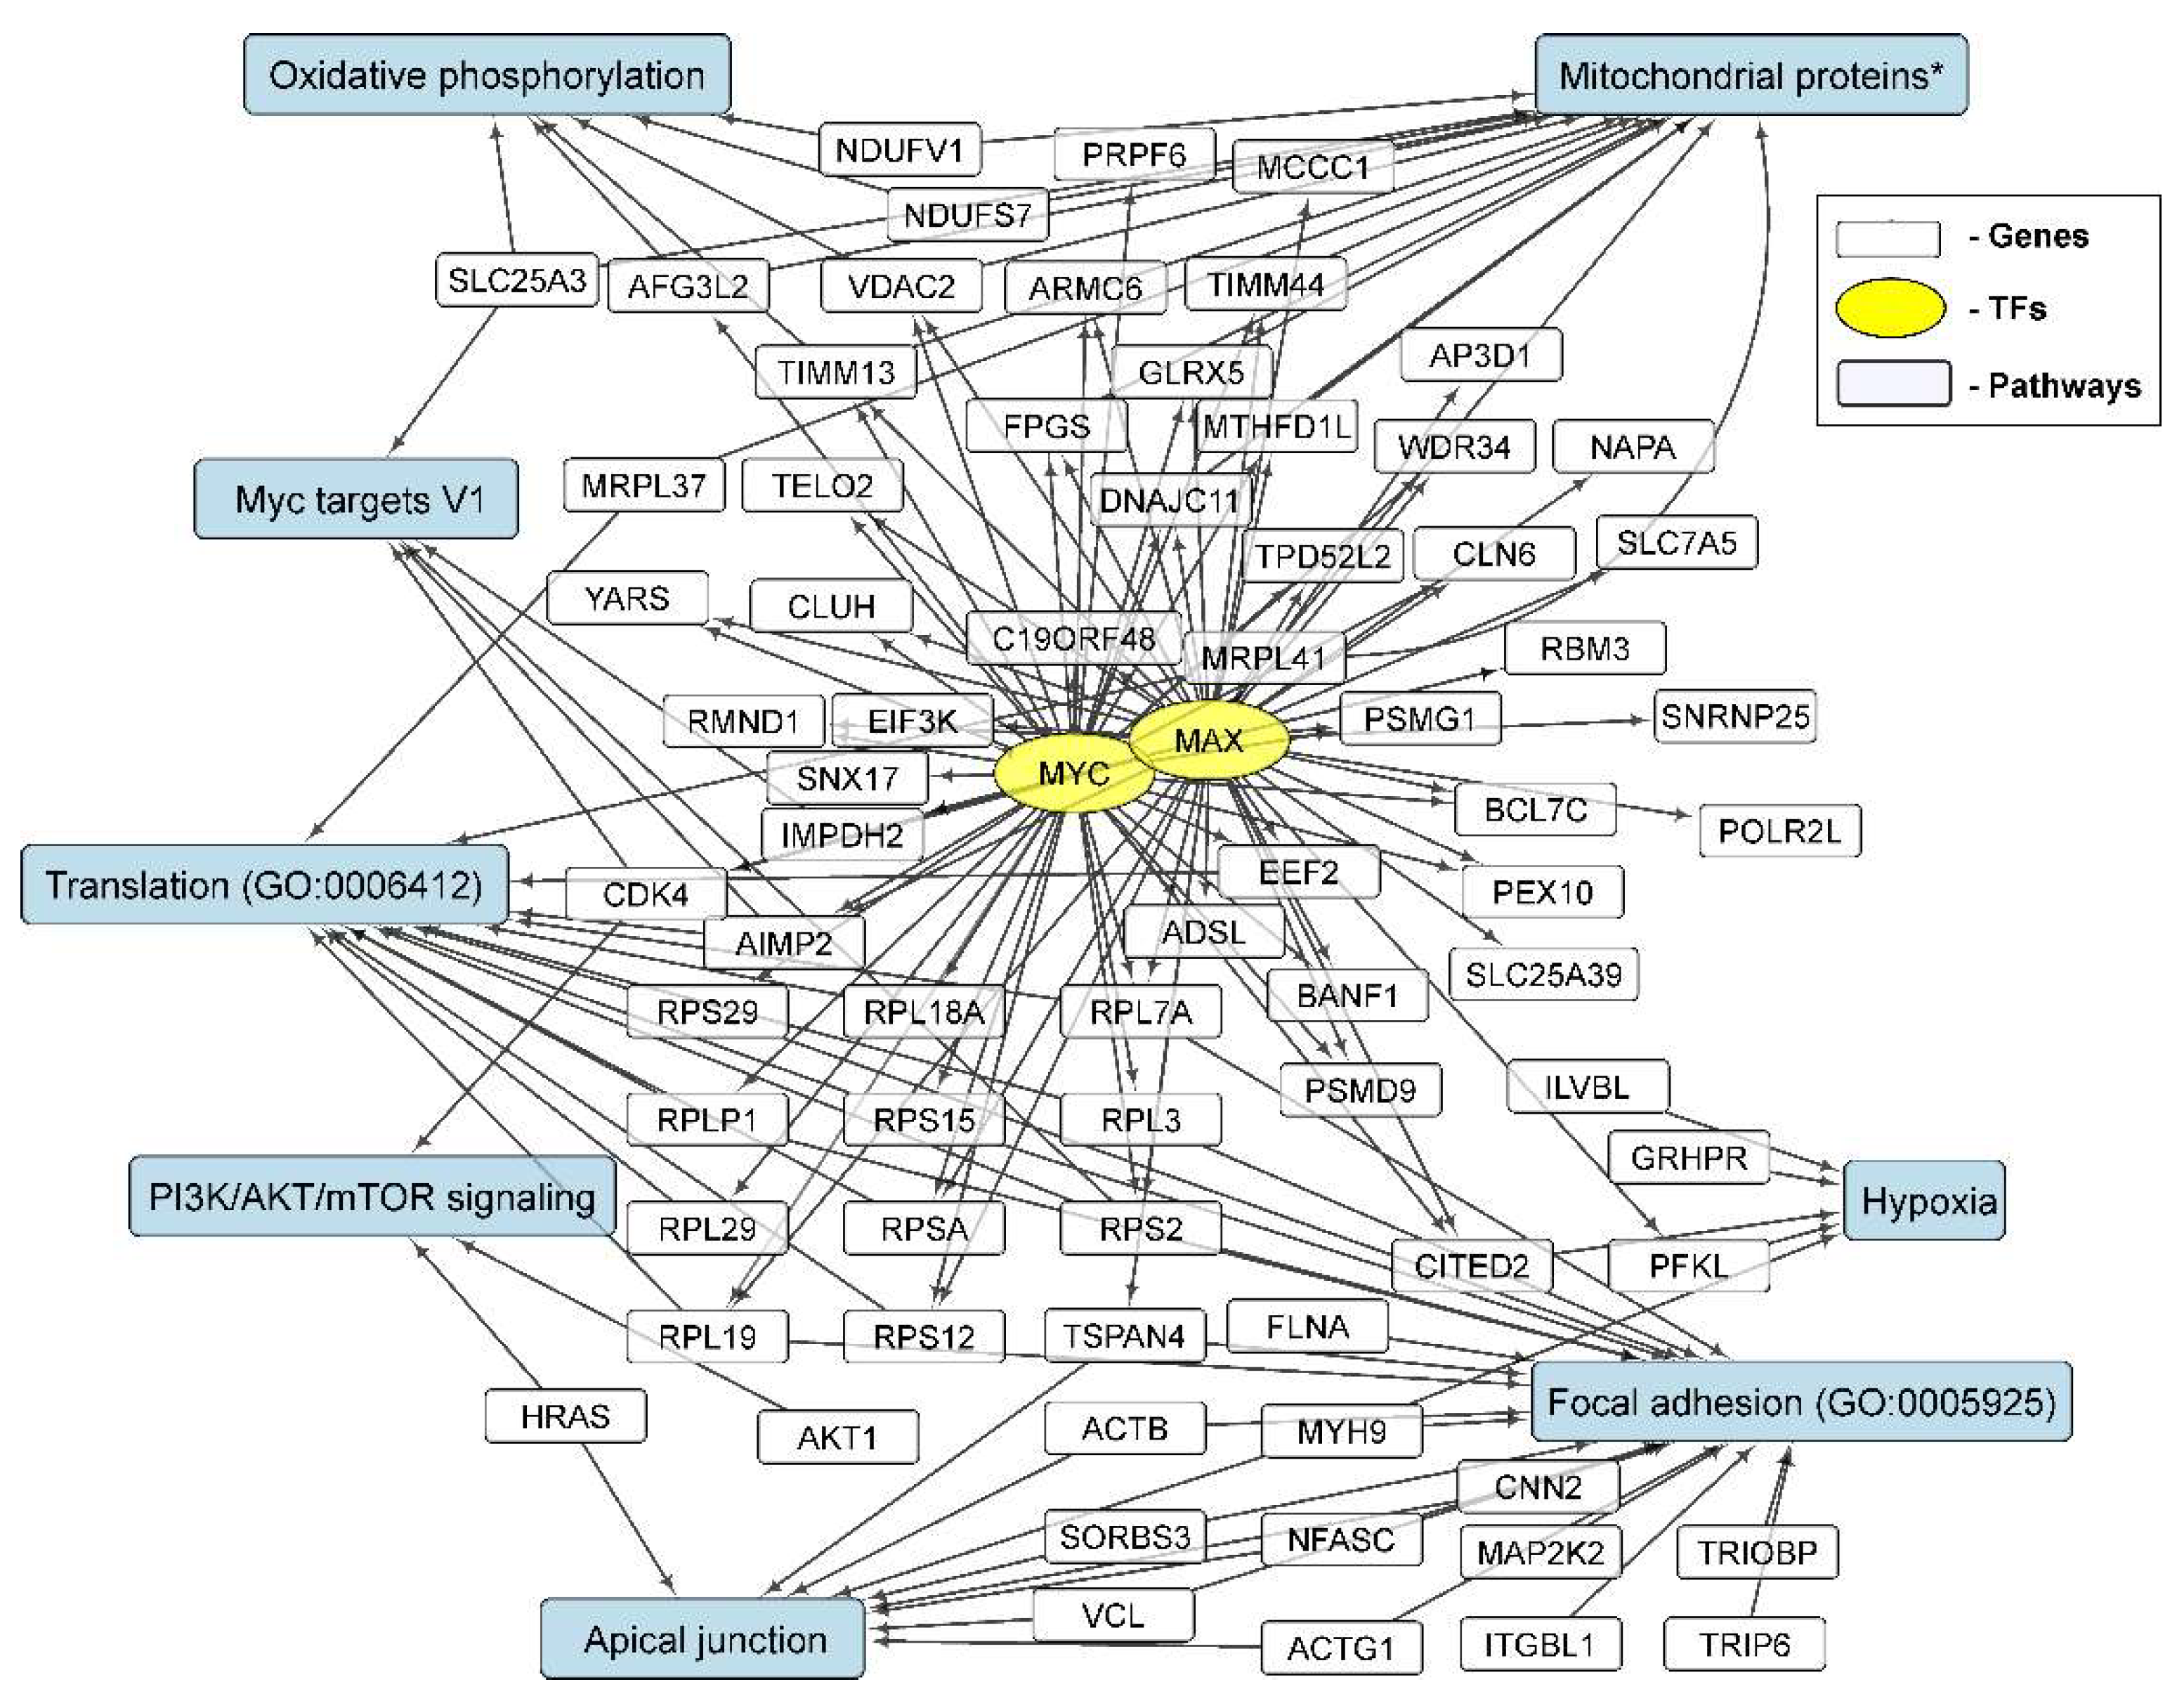
3.3.7. Repression of MYC- and MAX-Controlled Genes

Members of the MYC family of TFs play a critical role in the regulation of a wide range of biological processes, including metabolic processes, translation, cell proliferation, stemming, and neoplastic transformation [75].
It can be seen that the level of MYC mRNA, as well as the level of MAX mRNA, changed in different directions during the incubation of glioma cells under conditions of NS formation (Figure 4). At the same time, the list of genes with a reduced expression in neurospheres is statistically significantly enriched in those controlled by MYC/MAX (Table 3 and Table S2). The list of MYC/MAX-controlled downregulated genes includes: genes of ribosomal proteins—RPL18A, RPL19, RPS12, RPS15 and others; translation factors—EEF2 and EIF3K; mitochondrial proteins—MRPL41, DNAJC11, GLRX5, TIMM44, TIMM13 and VDAC2 (Figure 4 and Figure 7, Table S2).
Thus, the formation of neurospheres by glioma cells is accompanied by a decrease in the level of mRNA sets encoding translational and metabolic factors, including mitochondrial ones.
Downregulated genes common to different glioma cell cultures are enriched in transcripts controlled by MYC and MAX. At the same time, the genes controlled by MYC and MAX overlap significantly with each other (Figure 7). This can be explained by the formation of the MYC–MAX heterodimer, which regulates the transcription of target genes. Signaling pathways and cellular processes associated with the downregulation of MYC/MAX-controlled gene expression in NS gliomas are summarized in Figure 8.

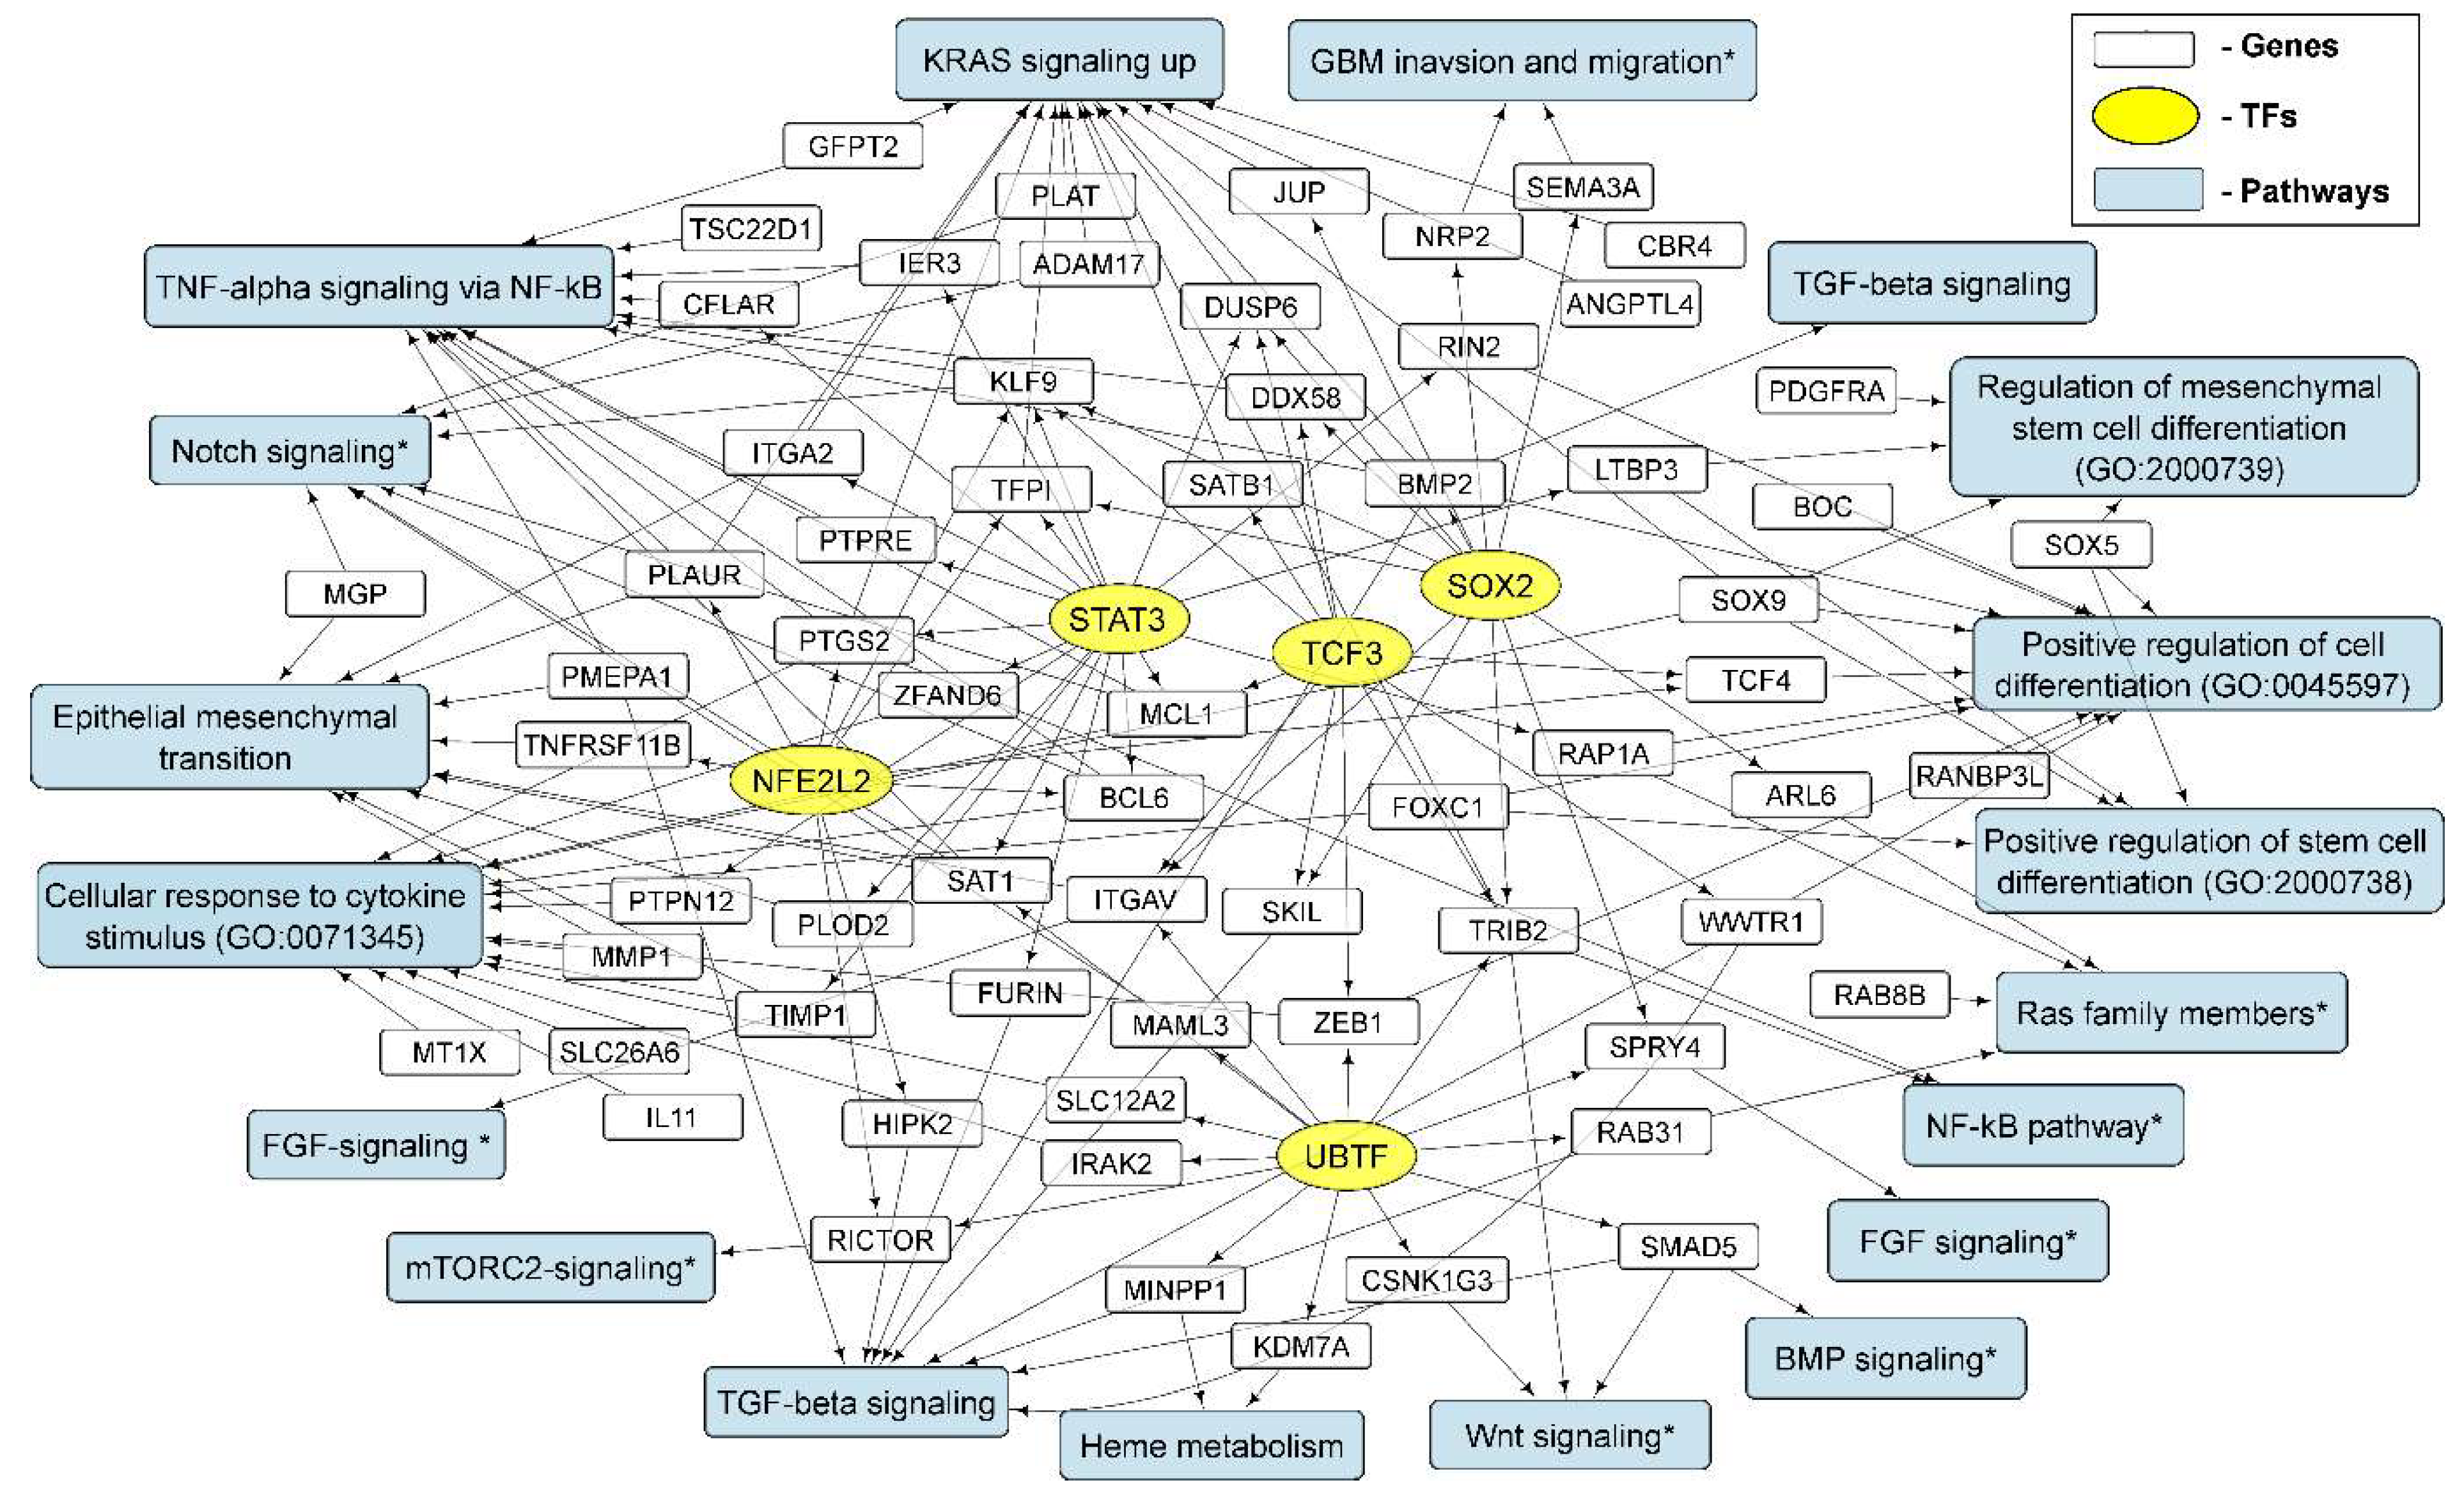
3.4. Cellular Processes and Signaling Pathways Underlying the Formation of Glioma Neurospheres

KRAS signaling, TNF-alpha signaling via NF-kB, TGF-beta signaling and EMT are the common processes determined using Enrichr in the “MSigDB Hallmark 2020” library for upregulated gene sets (Table 4). Confirming the data of the transcription factor analysis (Table 3), the results of cellular processes and signaling pathways indicate a decrease in the level of MYC-dependent genes—the downregulation of Myc-controlled transcripts (“Myc Targets V1” and “Myc Targets V2” in Table 4). Data on cellular processes and signaling pathways obtained using Enrichr are confirmed through an independent analysis of the gene lists on the GSEA platform (Table S4).

3.4.1. KRAS Signaling

KRAS is a member of the RAS protein family, which is known to be a key participant in EGF- and FGF-receptor signal transduction pathways [76]. In our data, the relative level of KRAS mRNA changed in different directions in glioma cell lines (Figure 4). We found four mRNAs of the RAS superfamily members, RAP1A, RAB8B, RAB31 and ARL6, which were unidirectionally and statistically significantly activated in all analyzed NS cell cultures. Three of the four activated mRNAs of the RAS superfamily encode proteins involved in intracellular vesicle transport—RAB8B, RAB31 and ARL6. Importantly, RAB31 is a key protein that is directly involved in EGFR delivery to late endosomes, which leads to receptor degradation [77]. Thus, an increase in the expression of RAB31 provides a feedback regulation of EGFR signaling.
In addition to members of the RAS superfamily, our data highlight the following upregulated genes whose products are involved in KRAS (Ras) signaling processes: BMP2, TRIB2, ITGA2 (see above) and ADAM17 (Table S2, Figure 4). ADAM17 metallopeptidase participates in processing EGFR ligands, and plays a prominent role in the activation of the Notch signaling pathway [78].

3.4.2. TGF-Beta Signaling and TNF-Alpha Signaling via NF-kB

Both the TGF-beta pathway and the TNF-alpha signaling pathway through NF-kB are important molecular processes for glioma growth and invasion [79,80].
Our Enrichr-processed RNA-seq data delineate a list of NS-activated genes whose products are involved in TNF/NF-kB/TGFb regulatory pathways, including BMP2, PLAUR, RAB31, BCL6 and MCL1 (see above). The list also includes IER3 (Table S2, Figure 4). The IER3 encodes a protein that not only participates in the innate immune response (and TNF/NF-kB), but also modulates the MAPK/ERK and PI3K/Akt pathways [81].

3.4.3. Epithelial to Mesenchymal Transition

EMT is considered to be the main cellular process providing the invasion, metastasis and resistance of cancer cells to therapy [22,80].
We determined that the formation of NS by glioma cells includes the significant and unidirectional activation of genes from the EMT group of the Enrichr library “MSigDB Hallmark 2020” (Table 4 and Table S2). The list of common overlapping transcripts of NS related to EMP includes integrins ITGA2, ITGAV and PLAUR (see above). Other indicators of EMT activation in glioma NS include MMP1, TIMP1 and PLOD2 (Figure 4, Table S2). MMP1 encodes the zinc-dependent endopeptidase MMP-1, a key protease in ECM degradation and cell invasion. Previously, MMP-1 and plasminogen urokinase activator (uPA) were identified as potential STAT6 targets responsible for GBM cell invasion [82]. PLOD2, which encodes membrane-bound procollagen lysyl hydroxylase, has been shown to enhance proliferation, invasion, attachment-independent growth and promote the progression of GBM [83].

3.4.4. GO Annotations and KEGG Pathways

Enrichr analysis of up- and downregulated transcripts in the library “GO Biological Process 2021” confirms conclusions about the key processes that determine the formation of glioma neurospheres. Thus, three top ranked GO biological process terms are: “regulation of differentiation of mesenchymal stem cells”, “positive regulation of stem cell differentiation”, and “positive regulation of cell differentiation” (Table S3). In light of this, downregulated genes are enriched in GO terms: “SRP-dependent cotranslational protein targeting to membrane”, “translation”, “cytoplasmic translation”, and “cotranslational protein targeting to membrane” (Table S3).
From the list of upregulated genes indexed in GO terms “mesenchymal stem cell differentiation” and “positive regulation of stem cell differentiation”, we should outline the following genes: PDGFRA, SOX9 and SOX5 (Figure 4, Table S3). PDGFRA encodes receptor tyrosine kinase, which plays a role in glioblastoma initiation and progression and is also known as an indicator of GBM pro-neural subtype [84]. SOX5 and SOX9, as members of the SOX family, are implicated in the development and maintenance of CNS tumors [85].
ADAM17 and MAML3 are indexed in the KEGG “Notch signaling pathway”, and BMP2 and SMAD5 are indexed in the KEGG “TGF-beta signaling pathway” (Tables S2 and S3), which confirms our data on the involvement of these processes in the formation of glioma neurospheres.
Downregulated genes in glioma neurospheres, RPL and RPS families (RPLP1, RPSA and others), are indexed in the GO term “translation” (GO:0006412), as well as in the “KEGG 2021 Human Ribosome” libraries (Table S3). This highlights the involvement of the MYC/MAX family of transcription factors in the regulation of NS formation.
The activation and, separately, the suppression of gene expression through transcription factors and the impact on biological processes and signaling pathways in glioma neurospheres are summarized in Figure 6 and Figure 8.

3.5. Validation of NGS Data with qRT-PCR

In order to confirm RNA sequencing data using an independent approach, we performed qRT-PCR analysis of eight randomly selected transcripts, CXCL1, ERRFI1, NFKBIA, NRP2, PDGFRA, SOX2, TRIB2, and ZEB1. Relative transcript levels were analyzed via real-time PCR using RNAs from independent samples of adherent and neurosphere glioma cultures. For all analyzed genes, it was determined that the linear regression between the relative expression obtained from the DESeq normalized gene values and the qPCR genes levels were characterized by Pearson R2 from 0.60 to 0.97 (Table S5). Thus, the high correlation of NGS data with independent qRT-PCR results generally confirms our findings.

4. Discussion

The conditions for the neurospheres’ formation are the standard cultivation for both enriching neural stem cells and brain tumor stem cells, as well as for investigating the molecular features of glioma. One of the most commonly used components for neurosphere formation are EGF and bFGF; they allow the generation of spheres that are much more similar to human glioblastoma than to tumors initiated by glioma cell lines [86]. Previously, there have already been attempts to investigate the molecular mechanisms that occur in cells under the influence of serum-free media and the above components, and, accordingly, during the transition from adherent forms to neurospheres. Several groups announced that GBM spheres created in serum-free medium with EGF and bFGF had the ability to be highly invasive, to proliferate and retain their multipotency; that is, they can differentiate into cells expressing astrocytic, oligodendroglial and neuronal markers, through binding to the EGF and FGF receptors and triggering the corresponding signal transduction pathways [6,7,10].
A number of studies have conducted the transcriptome analysis of glioblastoma stem cells, explants and neurospheres [87,88,89,90], which demonstrates the relevance of such models for preclinical investigations. At the same time, only a few studies have compared the metabolomic, transcriptomic, and proteomic data of glioma cells cultivated under adherent culture and neurosphere conditions. In 2014, attempts were made to identify common and distinct proteins of adherent cells and neurospheres using proteomic analysis with nano-LC/Q-TOF MS [91]. It was shown that the proteomic patterns of adherent cells and neurospheres are different; the former are characterized by patterns of cell adhesion and invasion, whereas the latter are characterized by proteins involved in the cell cycle and protein metabolism. Baskaran S. et al. compared genome copy number variations with changes in gene expression in three patient-derived GBM cell cultures propagated in conditions that are quite similar to NS formation. Consistent transcriptional changes between earlier (<10) and later (<30) passages of GBM cultures showed the induction of pathways associated with GSEA ribosomal biogenesis, oxidative phosphorylation, tricarboxylic acid cycle, mTOR-signaling, and hypoxia [5]. Peixoto J. et al. analyzed metabolic discrepancies between the GBM cell line (U87) and a patient-derived GBM stem-like cell line (NCH644) exposed to neurospheres or monolayer culture conditions using transcriptomics and metabolomics. It was found that arginine biosynthesis was the most significantly regulated pathway in neurospheres and that GSCs may exhibit classical auxotrophy [92]. Thus, a comprehensive study of the transcriptome during the transition from adherent cell cultures to neurospheres under the influence of growth factors (EGF and bFGF) is currently lacking.
This is why aim of this work was to perform an exhaustive study of differences in the transcriptome data of immortalized and patient-derived cell cultures during the transition from adherent cultures to neurospheres using the most commonly used bioinformatics tools. In the present work, we used five cell cultures, three of which are patient-derived gliomas—BR1, BR2, and MG1—and two of which are immortalized GBM cell lines—U87 MG and U343 MG. We cultivated the cells in conditions of NS formation using four to eight passages and compared the transcriptomes of MN and NS cells in each particular MN/MS pair, as well as in terms of the overlapping set of upregulated and downregulated genes.
In order to describe TFs involved in the adaptation of the transcriptome of glioma cells to the conditions of culturing neurospheres, we used Enrichr gene set enrichment analysis [31]. We observed that NS formation is accompanied by the activation of transcription factors SOX2, UBTF, TCF3 and NFE2L2 (Table 3). We also detected that STAT3-controlled genes were upregulated in glioma NS (Table S2). The sets of transcripts controlled by MYC and MAX (Figure 7) were suppressed in NS (Table 3). The genes controlled by SOX2, UBTF, NFE2L2, TCF3 and STAT3 (Figure 5) are involved in the processes of EMT, the regulation of mesenchymal stem cell differentiation, the invasion and migration of GBM and others (Figure 6), while MYC/MAX-dependent downregulated genes (Figure 7) are involved in translation, focal adhesion apical junction and other processes summarized in Figure 8.
Interestingly, we found three commonalities for all analyzed glioma feedback regulators of the EGFR and FGFR signaling pathways: SPRY4, ERRFI1 and RAB31 (Figure 9).
ERRFI1 has been found to be significant tumor suppressor gene and is frequently deleted, mutated or downregulated in various types of cancer, including glioblastomas [66]. ERRFI1 overexpression has been shown to reduce proliferation in GBM cells by binding EGFR to Syntaxin-8 and targeting internalized EGFR to late endosomes for degradation, while knockdown of ERRFI1 expression resulted in increased tumor invasion [68,79,93]. RAB31 genes products involved in EGFR endocytosis and lysosomal degradation also as ERRFI1. Moreover, RAB31 is on the list of genes with the greatest influence on the development of the highest-grade astrocytoma, glioblastoma multiforme. The genes on this list can predict tumor status with 96–100% confidence using logistic regression, cross-validation, and support vector machine analysis [94]. Earlier was shown the tumor-suppressing role in GBM-derived cell lines of the Spry4 protein which has important functions in many receptor tyrosine kinase-mediated signal transduction cascades [93]. It specifically interferes with MAPK-ERK activation and phospholipase C-induced pathway, affects the PI3K pathway [41]. Thus, the activation of the expression of these genes can be considered as naturally functioning processes of control of the epithelial–mesenchymal transition and cancer stemness, which is common for glioma cells. In general, the activation of SPRY4, ERRFI1, and RAB31 can be used for developing new approaches to glioma therapy.

5. Conclusions

In this work, we focused on key transcription factors and the genes controlled by them during the formation of neurospheres in glioma cell cultures. In the transition from the adherent cell model to neurospheres, when using serum-free media and different growth factors as components, it is necessary to clearly understand the changes that occur at the cellular level. This is of fundamental importance, as it helps us to understand the molecular mechanisms of the activation of signal transduction pathways that trigger oncogenesis, as well as practical importance in the development of both the targeted drugs for the treatment of glioma and the diagnostic signatures that have a prognostic effect.
In general, our data emphasize the role of transcription factors, the participation of which has already been described earlier in the processes of epithelial–mesenchymal and/or neuro-mesenchymal transition—SOX2, STAT3, and TCF3. In addition, we revealed the involvement of transcription factors UBTF and NFE2L2, which, to the best of our knowledge, have not been previously associated with the formation of aggressive forms, invasion, and metastasis of gliomas. The identification of the SPRY4, ERRFI1, and RAB31 as genes whose natural activation provides the inverse regulation of the processes of neurosphere formation can be used for creating new strategies of suppressing the invasion and progression of gliomas.

Supplementary Materials

The following supporting information can be downloaded at: https://www.mdpi.com/article/10.3390/cells11193106/s1. Table S1: Sequences of primers used for the real time RT-PCR Analysis of RNA. Table S2: Selected results of the analysis of the Enrichr gene lists with overexpression and underexpression of common genes (indicated in the first column as “up:library” or “dn:library”, respectively). The second column shows the rang of the Enrichr terms, sorted by ascending p-value. Table S3: Top 10 of GO Biological Process, GO Cellular Component, GO Molecular Function and KEGG pathways results of Enrichr analysis of 203 common upregulated and 154 downregulated genes (Figure 3). Table S4: Results of gene enrichment analysis of 203 commonly upregulated (tab “Up”) and 154 downregulated (tab “Dn”) genes lists with GSEA msigdb collection H. Table S5: Validation of RNA-Seq results with qRT-PCR of randomly selected RNAs.

Author Contributions

Conceptualization D.V.S.; methodology N.S.V., Y.I.S. and A.B.A.; software D.V.S., G.A.S. and A.S.D.; validation Y.I.S., N.D.Z. and N.S.V.; formal analysis D.V.S.; investigation E.V.K.; resources S.V.M.; data curation D.V.S.; writing—original draft preparation D.V.S., N.S.V., M.A.D.; writing—review and editing D.V.S., M.A.D., N.S.V. and E.V.K.; visualization D.V.S., N.S.V., Y.I.S. and N.D.Z.; supervision E.V.K.; project administration V.A.R.; funding acquisition V.A.R. All authors have read and agreed to the published version of the manuscript.

Funding

This study was supported by the Russian Science Foundation grant No. 21-14-00195, https://rscf.ru/en/project/21-14-00195/, accessed on 26 September 2022.

Institutional Review Board Statement

Not applicable.

Informed Consent Statement

Informed consent was obtained from all subjects involved in the study.

Data Availability Statement

RNAseq data of five glioma cell cultures in MN and NS state have been deposited at the SRA database under the accession code PRJNA869596. All the other data supporting the findings of this study are available within the article and supplementary files.

Conflicts of Interest

The authors declare no conflict of interest.

Abbreviations

bFGFbasic fibroblast growth factor
CNScentral nervous system
CSCscancer stem cells
EGFepidermal growth factor
EMTepithelial-mesenchymal transition
GBMglioblastoma
HChierarchical clustering
MNmonolayer
NGSnext generation sequencing
NSneurosphere
PMTpro-neural to mesenchymal transition
TFstranscription factors

References

  1. Ostrom, Q.T.; Bauchet, L.; Davis, F.G.; Deltour, I.; Fisher, J.L.; Langer, C.E.; Pekmezci, M.; Schwartzbaum, J.A.; Turner, M.C.; Walsh, K.M.; et al. The epidemiology of glioma in adults: A “state of the science” review. Neuro. Oncol. 2014, 16, 896–913. [Google Scholar] [CrossRef] [Green Version]
  2. Miller, K.D.; Ostrom, Q.T.; Kruchko, C.; Patil, N.; Tihan, T.; Cioffi, G.; Fuchs, H.E.; Waite, K.A.; Jemal, A.; Siegel, R.L.; et al. Brain and other central nervous system tumor statistics, 2021. CA. Cancer J. Clin. 2021, 71, 381–406. [Google Scholar] [CrossRef]
  3. Hanif, F.; Muzaffar, K.; Perveen, K.; Malhi, S.M.; Simjee, S.U. Glioblastoma Multiforme: A Review of its Epidemiology and Pathogenesis through Clinical Presentation and Treatment. Asian Pac. J. Cancer Prev. 2017, 18, 3–9. [Google Scholar] [CrossRef]
  4. Wang, D.; Wang, C.; Wang, L.; Chen, Y. A comprehensive review in improving delivery of small-molecule chemotherapeutic agents overcoming the blood-brain/brain tumor barriers for glioblastoma treatment. Drug Deliv. 2019, 26, 551–565. [Google Scholar] [CrossRef]
  5. Baskaran, S.; Mayrhofer, M.; Kultima, H.G.; Bergström, T.; Elfineh, L.; Cavelier, L.; Isaksson, A.; Nelander, S. Primary glioblastoma cells for precision medicine: A quantitative portrait of genomic (in)stability during the first 30 passages. Neuro. Oncol. 2018, 20, 1080–1091. [Google Scholar] [CrossRef] [Green Version]
  6. Lee, J.; Kotliarova, S.; Kotliarov, Y.; Li, A.; Su, Q.; Donin, N.M.; Pastorino, S.; Purow, B.W.; Christopher, N.; Zhang, W.; et al. Tumor stem cells derived from glioblastomas cultured in bFGF and EGF more closely mirror the phenotype and genotype of primary tumors than do serum-cultured cell lines. Cancer Cell 2006, 9, 391–403. [Google Scholar] [CrossRef] [PubMed] [Green Version]
  7. Ignatova, T.N.; Kukekov, V.G.; Laywell, E.D.; Suslov, O.N.; Vrionis, F.D.; Steindler, D.A. Human cortical glial tumors contain neural stem-like cells expressing astroglial and neuronal markers in vitro. Glia 2002, 39, 193–206. [Google Scholar] [CrossRef] [PubMed]
  8. Wislet-Gendebien, S.; Leprince, P.; Moonen, G.; Rogister, B. Regulation of neural markers nestin and GFAP expression by cultivated bone marrow stromal cells. J. Cell Sci. 2003, 116, 3295–3302. [Google Scholar] [CrossRef] [PubMed] [Green Version]
  9. Reynolds, B.A.; Weiss, S. Generation of Neurons and Astrocytes from Isolated Cells of the Adult Mammalian Central Nervous System. Science 1992, 255, 1707–1710. [Google Scholar] [CrossRef] [Green Version]
  10. Yuan, X.; Curtin, J.; Xiong, Y.; Liu, G.; Waschsmann-Hogiu, S.; Farkas, D.L.; Black, K.L.; Yu, J.S. Isolation of cancer stem cells from adult glioblastoma multiforme. Oncogene 2004, 23, 9392–9400. [Google Scholar] [CrossRef]
  11. Bao, S.; Wu, Q.; McLendon, R.E.; Hao, Y.; Shi, Q.; Hjelmeland, A.B.; Dewhirst, M.W.; Bigner, D.D.; Rich, J.N. Glioma stem cells promote radioresistance by preferential activation of the DNA damage response. Nature 2006, 444, 756–760. [Google Scholar] [CrossRef]
  12. Lathia, J.D.; Mack, S.C.; Mulkearns-Hubert, E.E.; Valentim, C.L.L.; Rich, J.N. Cancer stem cells in glioblastoma. Genes Dev. 2015, 29, 1203–1217. [Google Scholar] [CrossRef] [Green Version]
  13. Marzagalli, M.; Fontana, F.; Raimondi, M.; Limonta, P. Cancer Stem Cells—Key Players in Tumor Relapse. Cancers 2021, 13, 376. [Google Scholar] [CrossRef]
  14. Joseph, J.V.; van Roosmalen, I.A.M.; Busschers, E.; Tomar, T.; Conroy, S.; Eggens-Meijer, E.; Peñaranda Fajardo, N.; Pore, M.M.; Balasubramanyian, V.; Wagemakers, M.; et al. Serum-Induced Differentiation of Glioblastoma Neurospheres Leads to Enhanced Migration/Invasion Capacity That Is Associated with Increased MMP9. PLoS ONE 2015, 10, e0145393. [Google Scholar] [CrossRef] [Green Version]
  15. Peñaranda-Fajardo, N.M.; Meijer, C.; Liang, Y.; Dijkstra, B.M.; Aguirre-Gamboa, R.; den Dunnen, W.F.A.; Kruyt, F.A.E. ER stress and UPR activation in glioblastoma: Identification of a noncanonical PERK mechanism regulating GBM stem cells through SOX2 modulation. Cell Death Dis. 2019, 10, 690. [Google Scholar] [CrossRef] [PubMed] [Green Version]
  16. Tilghman, J.; Schiapparelli, P.; Lal, B.; Ying, M.; Quinones-Hinojosa, A.; Xia, S.; Laterra, J. Regulation of Glioblastoma Tumor-Propagating Cells by the Integrin Partner Tetraspanin CD151. Neoplasia 2016, 18, 185–198. [Google Scholar] [CrossRef] [PubMed] [Green Version]
  17. Meleis, A.M.; Mahtabfar, A.; Danish, S.; Foty, R.A. Dexamethasone-mediated inhibition of Glioblastoma neurosphere dispersal in an ex vivo organotypic neural assay. PLoS ONE 2017, 12, e0186483. [Google Scholar] [CrossRef] [PubMed] [Green Version]
  18. Alves, A.L.V.; Gomes, I.N.F.; Carloni, A.C.; Rosa, M.N.; da Silva, L.S.; Evangelista, A.F.; Reis, R.M.; Silva, V.A.O. Role of glioblastoma stem cells in cancer therapeutic resistance: A perspective on antineoplastic agents from natural sources and chemical derivatives. Stem Cell Res. Ther. 2021, 12, 206. [Google Scholar] [CrossRef]
  19. Rajalingam, K.; Schreck, R.; Rapp, U.R.; Albert, Š. Ras oncogenes and their downstream targets. Biochim. Biophys. Acta Mol. Cell Res. 2007, 1773, 1177–1195. [Google Scholar] [CrossRef] [Green Version]
  20. McCubrey, J.A.; Steelman, L.S.; Chappell, W.H.; Abrams, S.L.; Wong, E.W.T.; Chang, F.; Lehmann, B.; Terrian, D.M.; Milella, M.; Tafuri, A.; et al. Roles of the Raf/MEK/ERK pathway in cell growth, malignant transformation and drug resistance. Biochim. Biophys. Acta Mol. Cell Res. 2007, 1773, 1263–1284. [Google Scholar] [CrossRef]
  21. Gimple, R.C.; Wang, X. RAS: Striking at the Core of the Oncogenic Circuitry. Front. Oncol. 2019, 9, 965. [Google Scholar] [CrossRef] [Green Version]
  22. Gonzalez, D.M.; Medici, D. Signaling mechanisms of the epithelial-mesenchymal transition. Sci. Signal. 2014, 7, re8. [Google Scholar] [CrossRef] [Green Version]
  23. Liang, Q.; Guan, G.; Li, X.; Wei, C.; Wu, J.; Cheng, P.; Wu, A.; Cheng, W. Profiling pro-neural to mesenchymal transition identifies a lncRNA signature in glioma. J. Transl. Med. 2020, 18, 378. [Google Scholar] [CrossRef]
  24. Zhu, Q.-C.; Gao, R.-Y.; Wu, W.; Qin, H.-L. Epithelial-mesenchymal Transition and Its Role in the Pathogenesis of Colorectal Cancer. Asian Pacific J. Cancer Prev. 2013, 14, 2689–2698. [Google Scholar] [CrossRef] [Green Version]
  25. Bolger, A.M.; Lohse, M.; Usadel, B. Trimmomatic: A flexible trimmer for Illumina sequence data. Bioinformatics 2014, 30, 2114–2120. [Google Scholar] [CrossRef] [PubMed] [Green Version]
  26. Langmead, B.; Salzberg, S.L. Fast gapped-read alignment with Bowtie 2. Nat. Methods 2012, 9, 357–359. [Google Scholar] [CrossRef] [Green Version]
  27. Jurka, J.; Kapitonov, V.V.; Pavlicek, A.; Klonowski, P.; Kohany, O.; Walichiewicz, J. Repbase Update, a database of eukaryotic repetitive elements. Cytogenet. Genome Res. 2005, 110, 462–467. [Google Scholar] [CrossRef]
  28. Dobin, A.; Davis, C.A.; Schlesinger, F.; Drenkow, J.; Zaleski, C.; Jha, S.; Batut, P.; Chaisson, M.; Gingeras, T.R. STAR: Ultrafast universal RNA-seq aligner. Bioinformatics 2013, 29, 15–21. [Google Scholar] [CrossRef] [PubMed]
  29. Hartley, S.W.; Mullikin, J.C. QoRTs: A comprehensive toolset for quality control and data processing of RNA-Seq experiments. BMC Bioinformatics 2015, 16, 224. [Google Scholar] [CrossRef] [Green Version]
  30. Love, M.I.; Huber, W.; Anders, S. Moderated estimation of fold change and dispersion for RNA-seq data with DESeq2. Genome Biol. 2014, 15, 550. [Google Scholar] [CrossRef] [PubMed]
  31. Kuleshov, M.V.; Jones, M.R.; Rouillard, A.D.; Fernandez, N.F.; Duan, Q.; Wang, Z.; Koplev, S.; Jenkins, S.L.; Jagodnik, K.M.; Lachmann, A.; et al. Enrichr: A comprehensive gene set enrichment analysis web server 2016 update. Nucleic Acids Res. 2016, 44, W90–W97. [Google Scholar] [CrossRef] [PubMed] [Green Version]
  32. Mootha, V.K.; Lindgren, C.M.; Eriksson, K.-F.; Subramanian, A.; Sihag, S.; Lehar, J.; Puigserver, P.; Carlsson, E.; Ridderstråle, M.; Laurila, E.; et al. PGC-1α-responsive genes involved in oxidative phosphorylation are coordinately downregulated in human diabetes. Nat. Genet. 2003, 34, 267–273. [Google Scholar] [CrossRef] [PubMed]
  33. Subramanian, A.; Tamayo, P.; Mootha, V.K.; Mukherjee, S.; Ebert, B.L.; Gillette, M.A.; Paulovich, A.; Pomeroy, S.L.; Golub, T.R.; Lander, E.S.; et al. Gene set enrichment analysis: A knowledge-based approach for interpreting genome-wide expression profiles. Proc. Natl. Acad. Sci. USA 2005, 102, 15545–15550. [Google Scholar] [CrossRef] [PubMed] [Green Version]
  34. Iacopino, F.; Angelucci, C.; Piacentini, R.; Biamonte, F.; Mangiola, A.; Maira, G.; Grassi, C.; Sica, G. Isolation of Cancer Stem Cells from Three Human Glioblastoma Cell Lines: Characterization of Two Selected Clones. PLoS ONE 2014, 9, e105166. [Google Scholar] [CrossRef] [PubMed]
  35. Datta, P.K. Neuronal Cell Culture; Methods in Molecular Biology; Amini, S., White, M.K., Eds.; Humana Press: Totowa, NJ, NJ, 2013; Volume 1078, ISBN 978-1-62703-639-9. [Google Scholar]
  36. Shimizu, M.; Shibuya, H.; Tanaka, N. Enhanced O-GlcNAc modification induced by the RAS/MAPK/CDK1 pathway is required for SOX2 protein expression and generation of cancer stem cells. Sci. Rep. 2022, 12, 2910. [Google Scholar] [CrossRef]
  37. Novak, D.; Hüser, L.; Elton, J.J.; Umansky, V.; Altevogt, P.; Utikal, J. SOX2 in development and cancer biology. Semin. Cancer Biol. 2020, 67, 74–82. [Google Scholar] [CrossRef]
  38. Desgrosellier, J.S.; Cheresh, D.A. Integrins in cancer: Biological implications and therapeutic opportunities. Nat. Rev. Cancer 2010, 10, 9–22. [Google Scholar] [CrossRef] [Green Version]
  39. David, C.J.; Massagué, J. Contextual determinants of TGFβ action in development, immunity and cancer. Nat. Rev. Mol. Cell Biol. 2018, 19, 419–435. [Google Scholar] [CrossRef]
  40. Higgins, D.M.O.; Caliva, M.; Schroeder, M.; Carlson, B.; Upadhyayula, P.S.; Milligan, B.D.; Cheshier, S.H.; Weissman, I.L.; Sarkaria, J.N.; Meyer, F.B.; et al. Semaphorin 3A mediated brain tumor stem cell proliferation and invasion in EGFRviii mutant gliomas. BMC Cancer 2020, 20, 1213. [Google Scholar] [CrossRef]
  41. Sasaki, A.; Taketomi, T.; Kato, R.; Saeki, K.; Nonami, A.; Sasaki, M.; Kuriyama, M.; Saito, N.; Shibuya, M.; Yoshimura, A. Mammalian Sprouty4 suppresses Ras-independent ERK activation by binding to Raf1. Nat. Cell Biol. 2003, 5, 427–432. [Google Scholar] [CrossRef]
  42. Sanij, E.; Diesch, J.; Lesmana, A.; Poortinga, G.; Hein, N.; Lidgerwood, G.; Cameron, D.P.; Ellul, J.; Goodall, G.J.; Wong, L.H.; et al. A novel role for the pol I transcription factor ubtf in maintaining genome stability through the regulation of highly transcribed pol II genes. Genome Res. 2015, 25, 201–212. [Google Scholar] [CrossRef] [Green Version]
  43. Kitagawa, M. Notch signalling in the nucleus: Roles of Mastermind-like (MAML) transcriptional coactivators. J. Biochem. 2016, 159, 287–294. [Google Scholar] [CrossRef] [PubMed] [Green Version]
  44. Hegarty, S.V.; O’Keeffe, G.W.; Sullivan, A.M. BMP-Smad 1/5/8 signalling in the development of the nervous system. Prog. Neurobiol. 2013, 109, 28–41. [Google Scholar] [CrossRef]
  45. Mayoral-Varo, V.; Jiménez, L.; Link, W. The Critical Role of TRIB2 in Cancer and Therapy Resistance. Cancers 2021, 13, 2701. [Google Scholar] [CrossRef] [PubMed]
  46. Zhang, J.; Zhang, J.; Liu, W.; Ge, R.; Gao, T.; Tian, Q.; Mu, X.; Zhao, L.; Li, X. UBTF facilitates melanoma progression via modulating MEK1/2-ERK1/2 signalling pathways by promoting GIT1 transcription. Cancer Cell Int. 2021, 21, 543. [Google Scholar] [CrossRef] [PubMed]
  47. Vizoso-Vázquez, A.; Barreiro-Alonso, A.; González-Siso, M.I.; Rodríguez-Belmonte, E.; Lamas-Maceiras, M.; Cerdán, M.E. HMGB proteins involved in TOR signaling as general regulators of cell growth by controlling ribosome biogenesis. Curr. Genet. 2018, 64, 1205–1213. [Google Scholar] [CrossRef]
  48. Ramaiah, M.J.; Kumar, K.R. mTOR-Rictor-EGFR axis in oncogenesis and diagnosis of glioblastoma multiforme. Mol. Biol. Rep. 2021, 48, 4813–4835. [Google Scholar] [CrossRef]
  49. Caramel, J.; Ligier, M.; Puisieux, A. Pleiotropic roles for ZEB1 in cancer. Cancer Res. 2018, 78, 30–35. [Google Scholar] [CrossRef] [Green Version]
  50. Siebzehnrubl, F.A.; Silver, D.J.; Tugertimur, B.; Deleyrolle, L.P.; Siebzehnrubl, D.; Sarkisian, M.R.; Devers, K.G.; Yachnis, A.T.; Kupper, M.D.; Neal, D.; et al. The ZEB1 pathway links glioblastoma initiation, invasion and chemoresistance. EMBO Mol. Med. 2013, 5, 1196–1212. [Google Scholar] [CrossRef]
  51. Anandhan, A.; Dodson, M.; Schmidlin, C.J.; Liu, P.; Zhang, D.D. Breakdown of an Ironclad Defense System: The Critical Role of NRF2 in Mediating Ferroptosis. Cell Chem. Biol. 2020, 27, 436–447. [Google Scholar] [CrossRef]
  52. Gilder, A.S.; Natali, L.; Van Dyk, D.M.; Zalfa, C.; Banki, M.A.; Pizzo, D.P.; Wang, H.; Klemke, R.L.; Mantuano, E.; Gonias, S.L. The Urokinase Receptor Induces a Mesenchymal Gene Expression Signature in Glioblastoma Cells and Promotes Tumor Cell Survival in Neurospheres. Sci. Rep. 2018, 8, 2982. [Google Scholar] [CrossRef] [PubMed] [Green Version]
  53. Feng, Y.; Zhou, L.; Sun, X.; Li, Q. Homeodomain-interacting protein kinase 2 (HIPK2): A promising target for anti-cancer therapies. Oncotarget 2017, 8, 20452–20461. [Google Scholar] [CrossRef] [Green Version]
  54. Zhang, J.; Huang, K.; Shi, Z.; Zou, J.; Wang, Y.; Jia, Z.; Zhang, A.; Han, L.; Yue, X.; Liu, N.; et al. High-catenin/Tcf-4 activity confers glioma progression via direct regulation of AKT2 gene expression. Neuro. Oncol. 2011, 13, 600–609. [Google Scholar] [CrossRef]
  55. Ju, Q.; Li, X.; Zhang, H.; Yan, S.; Li, Y.; Zhao, Y. NFE2L2 Is a Potential Prognostic Biomarker and Is Correlated with Immune Infiltration in Brain Lower Grade Glioma: A Pan-Cancer Analysis. Oxid. Med. Cell. Longev. 2020, 2020, 3580719. [Google Scholar] [CrossRef] [PubMed]
  56. Rajesh, Y.; Biswas, A.; Kumar, U.; Das, S.; Banerjee, I.; Banik, P.; Bharti, R.; Nayak, S.; Ghosh, S.K.; Mandal, M. Targeting NFE2L2, a transcription factor upstream of MMP-2: A potential therapeutic strategy for temozolomide resistant glioblastoma. Biochem. Pharmacol. 2019, 164, 1–16. [Google Scholar] [CrossRef] [PubMed]
  57. Vilchez Mercedes, S.A.; Bocci, F.; Ahmed, M.; Eder, I.; Zhu, N.; Levine, H.; Onuchic, J.N.; Jolly, M.K.; Wong, P.K. Nrf2 Modulates the Hybrid Epithelial/Mesenchymal Phenotype and Notch Signaling During Collective Cancer Migration. Front. Mol. Biosci. 2022, 9, 807324. [Google Scholar] [CrossRef]
  58. Giannopoulou, A.-I.; Kanakoglou, D.S.; Piperi, C. Transcription Factors with Targeting Potential in Gliomas. Int. J. Mol. Sci. 2022, 23, 3720. [Google Scholar] [CrossRef]
  59. Zhang, H.-F.; Lai, R. STAT3 in Cancer—Friend or Foe? Cancers 2014, 6, 1408–1440. [Google Scholar] [CrossRef] [Green Version]
  60. Ying, M.; Sang, Y.; Li, Y.; Guerrero-Cazares, H.; Quinones-Hinojosa, A.; Vescovi, A.L.; Eberhart, C.G.; Xia, S.; Laterra, J. Krüppel-Like Family of Transcription Factor 9, a Differentiation-Associated Transcription Factor, Suppresses Notch1 Signaling and Inhibits Glioblastoma-Initiating Stem Cells. Stem Cells 2011, 29, 20–31. [Google Scholar] [CrossRef] [Green Version]
  61. De Santis, F.; Romero-Cordoba, S.L.; Castagnoli, L.; Volpari, T.; Faraci, S.; Fucà, G.; Tagliabue, E.; De Braud, F.; Pupa, S.M.; Di Nicola, M. BCL6 and the Notch pathway: A signaling axis leading to a novel druggable biotarget in triple negative breast cancer. Cell. Oncol. 2022, 45, 257–274. [Google Scholar] [CrossRef]
  62. Tan, C.; Liu, L.; Liu, X.; Qi, L.; Wang, W.; Zhao, G.; Wang, L.; Dai, Y. Activation of PTGS2 /NF-κB signaling pathway enhances radiation resistance of glioma. Cancer Med. 2019, 8, 1175–1185. [Google Scholar] [CrossRef] [Green Version]
  63. Widden, H.; Placzek, W.J. The multiple mechanisms of MCL1 in the regulation of cell fate. Commun. Biol. 2021, 4, 1029. [Google Scholar] [CrossRef] [PubMed]
  64. Wu, D.-M.; Hong, X.-W.; Wen, X.; Han, X.-R.; Wang, S.; Wang, Y.-J.; Shen, M.; Fan, S.-H.; Zhuang, J.; Zhang, Z.-F.; et al. MCL1 gene silencing promotes senescence and apoptosis of glioma cells via inhibition of the PI3K/Akt signaling pathway. IUBMB Life 2019, 71, 81–92. [Google Scholar] [CrossRef] [PubMed] [Green Version]
  65. Adorno-Cruz, V.; Liu, H. Regulation and functions of integrin α2 in cell adhesion and disease. Genes Dis. 2019, 6, 16–24. [Google Scholar] [CrossRef] [PubMed]
  66. Xu, D.; Li, C. Gene 33/Mig6/ERRFI1, an Adapter Protein with Complex Functions in Cell Biology and Human Diseases. Cells 2021, 10, 1574. [Google Scholar] [CrossRef] [PubMed]
  67. Yi, F.; Pereira, L.; Merrill, B.J. Tcf3 Functions as a Steady-State Limiter of Transcriptional Programs of Mouse Embryonic Stem Cell Self-Renewal. Stem Cells 2008, 26, 1951–1960. [Google Scholar] [CrossRef] [PubMed] [Green Version]
  68. Zhou, N.; Yan, B.; Ma, J.; Jiang, H.; Li, L.; Tang, H.; Ji, F.; Yao, Z. Expression of TCF3 in Wilms’ tumor and its regulatory role in kidney tumor cell viability, migration and apoptosis in vitro. Mol. Med. Rep. 2021, 24, 642. [Google Scholar] [CrossRef]
  69. Li, R.; Li, Y.; Hu, X.; Lian, H.; Wang, L.; Fu, H. Transcription factor 3 controls cell proliferation and migration in glioblastoma multiforme cell lines. Biochem. Cell Biol. 2016, 94, 247–255. [Google Scholar] [CrossRef]
  70. Yu, Y.; Chen, C.; Huo, G.; Deng, J.; Zhao, H.; Xu, R.; Jiang, L.; Chen, S.; Wang, S. ATP1A1 Integrates AKT and ERK Signaling via Potential Interaction With Src to Promote Growth and Survival in Glioma Stem Cells. Front. Oncol. 2019, 9, 320. [Google Scholar] [CrossRef]
  71. Lee, D.; Apelt, K.; Lee, S.O.; Chan, H.R.; Luijsterburg, M.S.; Leung, J.W.C.; Miller, K.M. ZMYM2 restricts 53BP1 at DNA double-strand breaks to favor BRCA1 loading and homologous recombination. Nucleic Acids Res. 2022, 50, 160. [Google Scholar] [CrossRef]
  72. Higashimori, A.; Dong, Y.; Zhang, Y.; Kang, W.; Nakatsu, G.; Ng, S.S.M.; Arakawa, T.; Sung, J.J.Y.; Chan, F.K.L.; Yu, J. Forkhead Box F2 Suppresses Gastric Cancer through a Novel FOXF2–IRF2BPL–β-Catenin Signaling Axis. Cancer Res. 2018, 78, 1643–1656. [Google Scholar] [CrossRef] [PubMed] [Green Version]
  73. Escoll, M.; Lastra, D.; Pajares, M.; Robledinos-Antón, N.; Rojo, A.I.; Fernández-Ginés, R.; Mendiola, M.; Martínez-Marín, V.; Esteban, I.; López-Larrubia, P.; et al. Transcription factor NRF2 uses the Hippo pathway effector TAZ to induce tumorigenesis in glioblastomas. Redox Biol. 2020, 30, 101425. [Google Scholar] [CrossRef]
  74. Frömberg, A.; Engeland, K.; Aigner, A. The Special AT-rich Sequence Binding Protein 1 (SATB1) and its role in solid tumors. Cancer Lett. 2018, 417, 96–111. [Google Scholar] [CrossRef]
  75. Poole, C.J.; van Riggelen, J. MYC—Master Regulator of the Cancer Epigenome and Transcriptome. Genes 2017, 8, 142. [Google Scholar] [CrossRef]
  76. Wennerberg, K.; Rossman, K.L.; Der, C.J. The Ras superfamily at a glance. J. Cell Sci. 2005, 118, 843–846. [Google Scholar] [CrossRef] [Green Version]
  77. Chua, C.E.L.; Tang, B.L. The role of the small GTPase Rab31 in cancer. J. Cell. Mol. Med. 2015, 19, 1–10. [Google Scholar] [CrossRef]
  78. Zunke, F.; Rose-John, S. The shedding protease ADAM17: Physiology and pathophysiology. Biochim. Biophys. Acta Mol. Cell Res. 2017, 1864, 2059–2070. [Google Scholar] [CrossRef]
  79. Mirzaei, S.; Saghari, S.; Bassiri, F.; Raesi, R.; Zarrabi, A.; Hushmandi, K.; Sethi, G.; Tergaonkar, V. NF-κB as a regulator of cancer metastasis and therapy response: A focus on epithelial–mesenchymal transition. J. Cell. Physiol. 2022. [Google Scholar] [CrossRef]
  80. Iser, I.C.; Pereira, M.B.; Lenz, G.; Wink, M.R. The Epithelial-to-Mesenchymal Transition-Like Process in Glioblastoma: An Updated Systematic Review and In Silico Investigation. Med. Res. Rev. 2017, 37, 271–313. [Google Scholar] [CrossRef] [PubMed]
  81. Arlt, A.; Schäfer, H. Role of the immediate early response 3 (IER3) gene in cellular stress response, inflammation and tumorigenesis. Eur. J. Cell Biol. 2011, 90, 545–552. [Google Scholar] [CrossRef] [PubMed]
  82. Merk, B.C.; Owens, J.L.; Lopes, M.-B.S.; Silva, C.M.; Hussaini, I.M. STAT6 expression in glioblastoma promotes invasive growth. BMC Cancer 2011, 11, 184. [Google Scholar] [CrossRef] [PubMed] [Green Version]
  83. Kreße, N.; Schröder, H.; Stein, K.-P.; Wilkens, L.; Mawrin, C.; Sandalcioglu, I.E.; Dumitru, C.A. PLOD2 Is a Prognostic Marker in Glioblastoma That Modulates the Immune Microenvironment and Tumor Progression. Int. J. Mol. Sci. 2022, 23, 6037. [Google Scholar] [CrossRef] [PubMed]
  84. Aldaz, P.; Arozarena, I. Tyrosine Kinase Inhibitors in Adult Glioblastoma: An (Un)Closed Chapter? Cancers 2021, 13, 5799. [Google Scholar] [CrossRef] [PubMed]
  85. de la Rocha, A.M.A.; Sampron, N.; Alonso, M.M.; Matheu, A. Role of SOX family of transcription factors in central nervous system tumors. Am. J. Cancer Res. 2014, 4, 312–324. [Google Scholar]
  86. Zhang, L.; Yu, H.; Yuan, Y.; Yu, J.S.; Lou, Z.; Xue, Y.; Liu, Y. The necessity for standardization of glioma stem cell culture: A systematic review. Stem Cell Res. Ther. 2020, 11, 84. [Google Scholar] [CrossRef] [Green Version]
  87. Pollard, S.M.; Yoshikawa, K.; Clarke, I.D.; Danovi, D.; Stricker, S.; Russell, R.; Bayani, J.; Head, R.; Lee, M.; Bernstein, M.; et al. Glioma Stem Cell Lines Expanded in Adherent Culture Have Tumor-Specific Phenotypes and Are Suitable for Chemical and Genetic Screens. Cell Stem Cell 2009, 4, 568–580. [Google Scholar] [CrossRef] [Green Version]
  88. Vinel, C.; Rosser, G.; Guglielmi, L.; Constantinou, M.; Pomella, N.; Zhang, X.; Boot, J.R.; Jones, T.A.; Millner, T.O.; Dumas, A.A.; et al. Comparative epigenetic analysis of tumour initiating cells and syngeneic EPSC-derived neural stem cells in glioblastoma. Nat. Commun. 2021, 12, 6130. [Google Scholar] [CrossRef]
  89. LeBlanc, V.G.; Trinh, D.L.; Aslanpour, S.; Hughes, M.; Livingstone, D.; Jin, D.; Ahn, B.Y.; Blough, M.D.; Cairncross, J.G.; Chan, J.A.; et al. Single-cell landscapes of primary glioblastomas and matched explants and cell lines show variable retention of inter- and intratumor heterogeneity. Cancer Cell 2022, 40, 379–392. [Google Scholar] [CrossRef]
  90. Bastola, S.; Pavlyukov, M.S.; Yamashita, D.; Ghosh, S.; Cho, H.; Kagaya, N.; Zhang, Z.; Minata, M.; Lee, Y.; Sadahiro, H.; et al. Glioma-initiating cells at tumor edge gain signals from tumor core cells to promote their malignancy. Nat. Commun. 2020, 11, 4660. [Google Scholar] [CrossRef]
  91. Collet, B.; Avril, T.; Aubry, M.; Hamlat, A.; Le Reste, P.-J.; Chiforeanu, D.; Vauleon, E.; Mosser, J.; Quillien, V. Proteomic analysis underlines the usefulness of both primary adherent and stem-like cell lines for studying proteins involved in human glioblastoma. J. Proteomics 2014, 110, 7–19. [Google Scholar] [CrossRef]
  92. Peixoto, J.; Janaki-Raman, S.; Schlicker, L.; Schmitz, W.; Walz, S.; Winkelkotte, A.M.; Herold-Mende, C.; Soares, P.; Schulze, A.; Lima, J. Integrated Metabolomics and Transcriptomics Analysis of Monolayer and Neurospheres from Established Glioblastoma Cell Lines. Cancers 2021, 13, 1327. [Google Scholar] [CrossRef] [PubMed]
  93. Celik-Selvi, B.E.; Stütz, A.; Mayer, C.-E.; Salhi, J.; Siegwart, G.; Sutterlüty, H. Sprouty3 and Sprouty4, Two Members of a Family Known to Inhibit FGF-Mediated Signaling, Exert Opposing Roles on Proliferation and Migration of Glioblastoma-Derived Cells. Cells 2019, 8, 808. [Google Scholar] [CrossRef] [PubMed] [Green Version]
  94. Kunkle, B.W.; Yoo, C.; Roy, D. Reverse Engineering of Modified Genes by Bayesian Network Analysis Defines Molecular Determinants Critical to the Development of Glioblastoma. PLoS ONE 2013, 8, e64140. [Google Scholar] [CrossRef] [PubMed]
Figure 1. (A) Representative images of MN (adherent) and NS glioma cells before cell collection for NGS RNAseq analysis. (B) Principal component analysis of DESeq2 normalized, variance stabilizing transformed (VST) gene expression data. Cell line-specific PC1:PC2 points are annotated with cell line-defined envelopes. The black arrow shows the general trend of PC1:PC2 transition from the MN state to the NS state.
Cells 11 03106 g001
Figure 2. Heatmap and sample tree of Euclidean distances of RNAseq variance stabilizing transformed (VST) gene expression data of glioma cell cultures. The complete agglomeration method for clustering was used.
Cells 11 03106 g002
Figure 3. (A) Venn diagrams showing intersections of gene sets in selected glioma cultures, separately for genes with increased (Up) and decreased (Down) levels compared to the corresponding MN cells. (B) Heatmaps of 203 commonly upregulated and 154 commonly downregulated genes in NS vs. MN glioma cells.
Cells 11 03106 g003
Figure 4. Differences in relative mRNA levels in adherent glioma cultures and neurospheres. Box plots of DESeq2 normalized expression values of mRNAs grouped by glioma cell lines and colored red for monolayer (adherent) cultures and cyan for corresponding NS. Plots with gray shaded headers represent data for differentially expressed genes that meet the criteria DESeq2 padj < 0.05, Log2FoldChange > 0 for upregulated or log2FoldChange < 0 for downregulated transcripts (for all MN/NS pairs in one direction—synchronously “up” or “down”). Plots with white shaded headers represent mRNA levels of TFs and KRAS that do not meet the criteria for differentially expressed genes (discussed in text).
Cells 11 03106 g004
Figure 5. Venn diagram showing intersections of sets of glioma NS upregulated genes controlled by SOX2, UBTF, NFE2L2, STAT3 and TCF3 transcription factors. Glioma NS upregulated genes analyzed using Enrichr library “ENCODE and ChEA Consensus TFs from ChIP-X”. STAT3 controlled genes from the Enrichr library “ENCODE TF ChIP-seq 2015” concerning overlap with “STAT3 HeLa-S3 hg19” gene list. TCF3-dependent genes from the union of “TCF3 ENCODE” and “TCF3 CHEA” Enrichr libraries “ENCODE and ChEA Consensus TFs from ChIP-X”.
Cells 11 03106 g005
Figure 6. The relationship between the activation of transcription factors SOX2, UBTF, NFE2L2, TCF3 and STAT3; individual activated genes and signaling pathways; and biological processes characteristic of the formation of NS glioma cells. The results of the analysis of gene sets using the Enrichr “GO Biologic Process 2021” and “KEGG_2021_Human” libraries are summarized with the addition of recently published data presented in the text (marked with *).
Cells 11 03106 g006
Figure 7. Venn diagram showing intersections of sets of glioma NS-downregulated genes controlled by MYC and MAX transcription factors. Illustrated Enrichr results of glioma NS downregulated genes analyzed using the “ENCODE and ChEA Consensus TFs from ChIP-X” library.
Cells 11 03106 g007
Figure 8. Relationships between MYC and MAX transcription factor repression, particular downregulated genes and signaling pathways, and biological processes common for glioma NS cell cultures formation. Summarized results of gene sets analysis with the Enrichr libraries “GO Biological Process 2021” and “KEGG_2021_Human”, as well as recently published data presented in the text (marked with *).
Cells 11 03106 g008
Figure 9. General scheme of processes in glioma cells under conditions of neurosphere formation. The SPRY4, ERRFI1, and RAB31 genes are indicated, the activation of which provides inverse regulation of both the formation of neurospheres and the processes of tumor progression associated with them, including EMT, invasion, and migration of cancer cells.
Cells 11 03106 g009
Table 1. Characteristics of human brain tumor cell cultures and RNA sequencing data.
Cell CultureHistological
Characteristic
Culture
Conditions
NGS-Library *Number of ReplicatesNumber of NGS-Sequencing Reads (106) ***
BR1GBMMNBR1a222.94
NSBR1n219.45
BR2Diffuse astrocytomaMNBR2a335.47
NSBR2n219.68
MG1GBMMNMG1a334.10
NSMG1n218.98
U343 **GBMMNU343a446.60
NSU343n224.10
U87 **GBMMNU87a446.35
NSU87n222.95
* The names of the NGS libraries used in this article correspond to the names of the cell cultures. ** Also known as U-343-MG and U-87 MG human glioblastoma cell lines. MN—monolayer (adherent); NS—neurospheres. *** Total number of sequencing reads for all replicates of the NGS library.
Table 2. Differentially expressed genes in MN/NS pairs of glioma cell cultures.
Particular MN/NS Pairs
BR1BR2MG1U343U87
Up *44722872333218872334
Down *37232761326118161650
Common (Overlapping) Genes
All Up203
Up/Down **121
All Down154
* Genes selected by DESeq2 padj < 0.05: Log2FoldChange > 0 for upregulated or log2FoldChange < 0 for downregulated. ** Transcripts with padj < 0.05 and with non-unidirectional expression changes in different MN/NS pairs.
Table 3. Transcription factors controlling gene expression during NS formation determined using Enrichr. Top 10 Enrichr records (library “ENCODE and ChEA Consensus TFs from ChIP-X”), ordered by descending p-value (with adjusted p-value < 0.05), for each particular MN/NS pair as well as for the list of overlapping up/downregulated genes. Common top transcription factors for comparison pairs are highlighted in color.
RankOverlappedBR1BR2MG1U343U87
Upregulated
1SOX2 CHEAUBTF ENCODEUBTF ENCODEUBTF ENCODESOX2 CHEAUBTF ENCODE
2UBTF ENCODENFE2L2 CHEANFE2L2 CHEANFE2L2 CHEASUZ12 CHEAAR CHEA
3FOXA2 ENCODEAR CHEATAF1 ENCODESOX2 CHEANFE2L2 CHEANFE2L2 CHEA
4NFE2L2 CHEASOX2 CHEACREB1 CHEASUZ12 CHEAAR CHEASOX2 CHEA
5TP53 CHEASMAD4 CHEASOX2 CHEAZBTB7A ENCODETCF3 CHEAZNF384 ENCODE
6SALL4 CHEATCF7L2 ENCODEBRCA1 ENCODEGATA1 CHEATP63 CHEAGATA1 CHEA
7AR CHEAFOXA2 ENCODEPPARG CHEAAR CHEAUBTF ENCODESMAD4 CHEA
8TCF3 ENCODE *CHD1 ENCODECREB1 ENCODEFOXA2 ENCODEGATA2 CHEATCF3 ENCODE
9TCF3 CHEA *ZNF384 ENCODERUNX1 CHEATCF3 ENCODENANOG CHEACTCF ENCODE
10VDR CHEA *TCF3 ENCODEGATA2 CHEAESR1 CHEASTAT3 CHEATCF3 CHEA
Downregulated
1MYC ENCODENFYB ENCODEUSF1 ENCODEE2F4 ENCODEUSF1 ENCODEE2F4 ENCODE
2MAX ENCODEMAX ENCODEUSF2 ENCODEMAX ENCODEMAX ENCODEE2F6 ENCODE
3MYC CHEAMYC ENCODEKLF4 CHEAMYC ENCODEUSF2 ENCODEMAX ENCODE
4USF2 ENCODENFYA ENCODEMAX ENCODETAF1 ENCODEMYC ENCODEMYC ENCODE
5TAF1 ENCODETAF1 ENCODEBHLHE40 ENCODENFYB ENCODEGABPA ENCODEBRCA1 ENCODE
6USF1 ENCODEBRCA1 ENCODEE2F6 ENCODEMYC CHEAZBTB7A ENCODETAF1 ENCODE
7ATF2 ENCODEGABPA ENCODECTCF ENCODEE2F6 ENCODEYY1 ENCODENFYB ENCODE
8PML ENCODEMYC CHEAZBTB7A ENCODENFYA ENCODEELF1 ENCODEATF2 ENCODE
9NFYA ENCODEE2F4 ENCODESMC3 ENCODESIN3A ENCODETAF1 ENCODECREB1 ENCODE
10ZBTB7A ENCODEYY1 ENCODENFYB ENCODEE2F1 CHEACREB1 CHEAYY1 ENCODE
* Adjusted p-value > 0.05.
Table 4. Cellular processes and signaling pathways. Essential cellular processes and signaling pathways of NS formation determined using Enrichr. Top 10 Enrichr records (library “MSigDB Hallmark 2020”), ordered by descending p- value (with adjusted p-value < 0.05), for each particular MN/NS pair, as well as for the list of overlapping up/downregulated genes. Common processes and signaling pathways are highlighted in color.
# *OverlappedBR1BR2MG1U343U87
Upregulated
1KRAS Signaling UpInterferon Gamma ResponseTNF-alpha Signaling via NF-kBTNF-alpha Signaling via NF-kBTNF-alpha Signaling via NF-kBEMT **
2TNF-alpha Signaling via NF-kBInterferon Alpha ResponseInterferon Gamma ResponseInterferon Gamma ResponseCholesterol HomeostasisUV Response Dn
3TGF-beta SignalingKRAS Signaling UpEMT **Interferon Alpha ResponseApoptosisCholesterol Homeostasis
4EMT **TNF-alpha Signaling via NF-kBInflammatory ResponseKRAS Signaling UpEMT **KRAS Signaling Up
5ApoptosisEMT **KRAS Signaling UpInflammatory ResponseHypoxiaTGF-beta Signaling
6CoagulationTGF-beta SignalingInterferon Alpha ResponseEMT **p53 PathwayTNF-alpha Signaling via NF-kB
7ComplementInflammatory ResponseTGF-beta SignalingTGF-beta SignalingInflammatory ResponseComplement
8Androgen ResponseIL-6/JAK/STAT3 SignalingIL-6/JAK/STAT3 SignalingIL-6/JAK/STAT3 SignalingKRAS Signaling UpHypoxia
9Estrogen Response EarlyIL-2/STAT5 SignalingApoptosisEstrogen Response EarlyAngiogenesisCoagulation
10AngiogenesisUV Response DnIL-2/STAT5 SignalingAngiogenesisEstrogen Response EarlyAndrogen Response
Downregulated
1Apical JunctionMyc Targets V1Cholesterol HomeostasisE2F TargetsMyc Targets V2E2F Targets
2Oxidative PhosphorylationOxidative PhosphorylationFatty Acid MetabolismMyc Targets V1Apical JunctionOxidative Phosphorylation
3HypoxiaE2F Targetsp53 PathwayG2-M CheckpointMitotic SpindleMyc Targets V1
4Myc Targets V1G2-M CheckpointMyogenesisOxidative PhosphorylationEMT **G2-M Checkpoint
5Androgen ResponsemTORC1 SignalingmTORC1 SignalingmTORC1 SignalingUnfolded Protein ResponseDNA Repair
6PI3K/AKT/mTOR SignalingDNA RepairAdipogenesisMitotic SpindleUV Response DnMitotic Spindle
7***AdipogenesisMitotic SpindleGlycolysisAdipogenesisEstrogen Response Late
8***Fatty Acid MetabolismUV Response DnMyc Targets V2PI3K/AKT/mTOR Signalingp53 Pathway
9***Myc Targets V2HypoxiaHypoxiaEstrogen Response EarlyAdipogenesis
10***Cholesterol HomeostasisOxidative PhosphorylationDNA RepairMyc Targets V1Myc Targets V2
* Rank of Enrichr records, ordered by descending p-value. ** EMT—Epithelial Mesenchymal Transition. *** Adjusted p-value > 0.05.
Publisher’s Note: MDPI stays neutral with regard to jurisdictional claims in published maps and institutional affiliations.

