


Obligatory Role of AMPK Activation and Antioxidant Defense Pathway in the Regulatory Effects of Metformin on Cellular Protection and Prevention of Lens Opacity


Abstract
1. Introduction
2. Materials and Methods
2.1. Human Lens Epithelial Cells (hLECs), SRA-hLECs, Primary Emb-hLECs and hLECs Culture and Maintenance
2.2. C57BL/6 Mouse and Mouse Lens Epithelial Cells (mLECs) Isolation from Lenses
2.3. Quantitation of Intracellular Reactive Oxygen Species (ROS) by H2-DCF-DA in Lenses and LECs
2.4. RNA isolation and mRNA Analysis of Different Ages of Mouse Lenses and Mouse or Human LECs Using RT-qPCR
2.5. Assay for Phospholipase A2 (PLA2) Activity
2.6. Assay for Glutathione Peroxidase Activity
2.7. Assay for Catalase Activity
2.8. Assay for SOD Activity
2.9. Cell Viability Assay (MTS Assay)
2.10. Protein Isolation and Western Blot Analysis
2.11. Luciferase Reporter Assay with Promoter Containing 3× Antioxidant Response Element (ARE)
2.12. Extraction of Nuclear and Cytosolic Fractions
2.13. Nrf2 Transactivation Assay
2.14. In-Vivo DNA Binding Assay: Chromatin Immunoprecipitation (ChIP) Experimentation
2.15. Preparation of Prdx6 Promoter-Chloramphenicol Acetyltransferase (CAT) Reporter Vector
2.16. Site-Directed Mutagenesis (SDM)
2.16.1. Nrf2/ARE SDM Primer
2.16.2. Bmal1/E-Box SDM Primer
2.17. shRNA Nrf2 Knock Down Experiment
2.18. Bmal1 Knock down Experiment
2.19. Isolation and Quantification of Metformin in Lens Using LC-MS/MS
2.20. Lens Organ Culture, Metformin and H2O2 Treatment
2.21. Statistical Analysis
3. Results
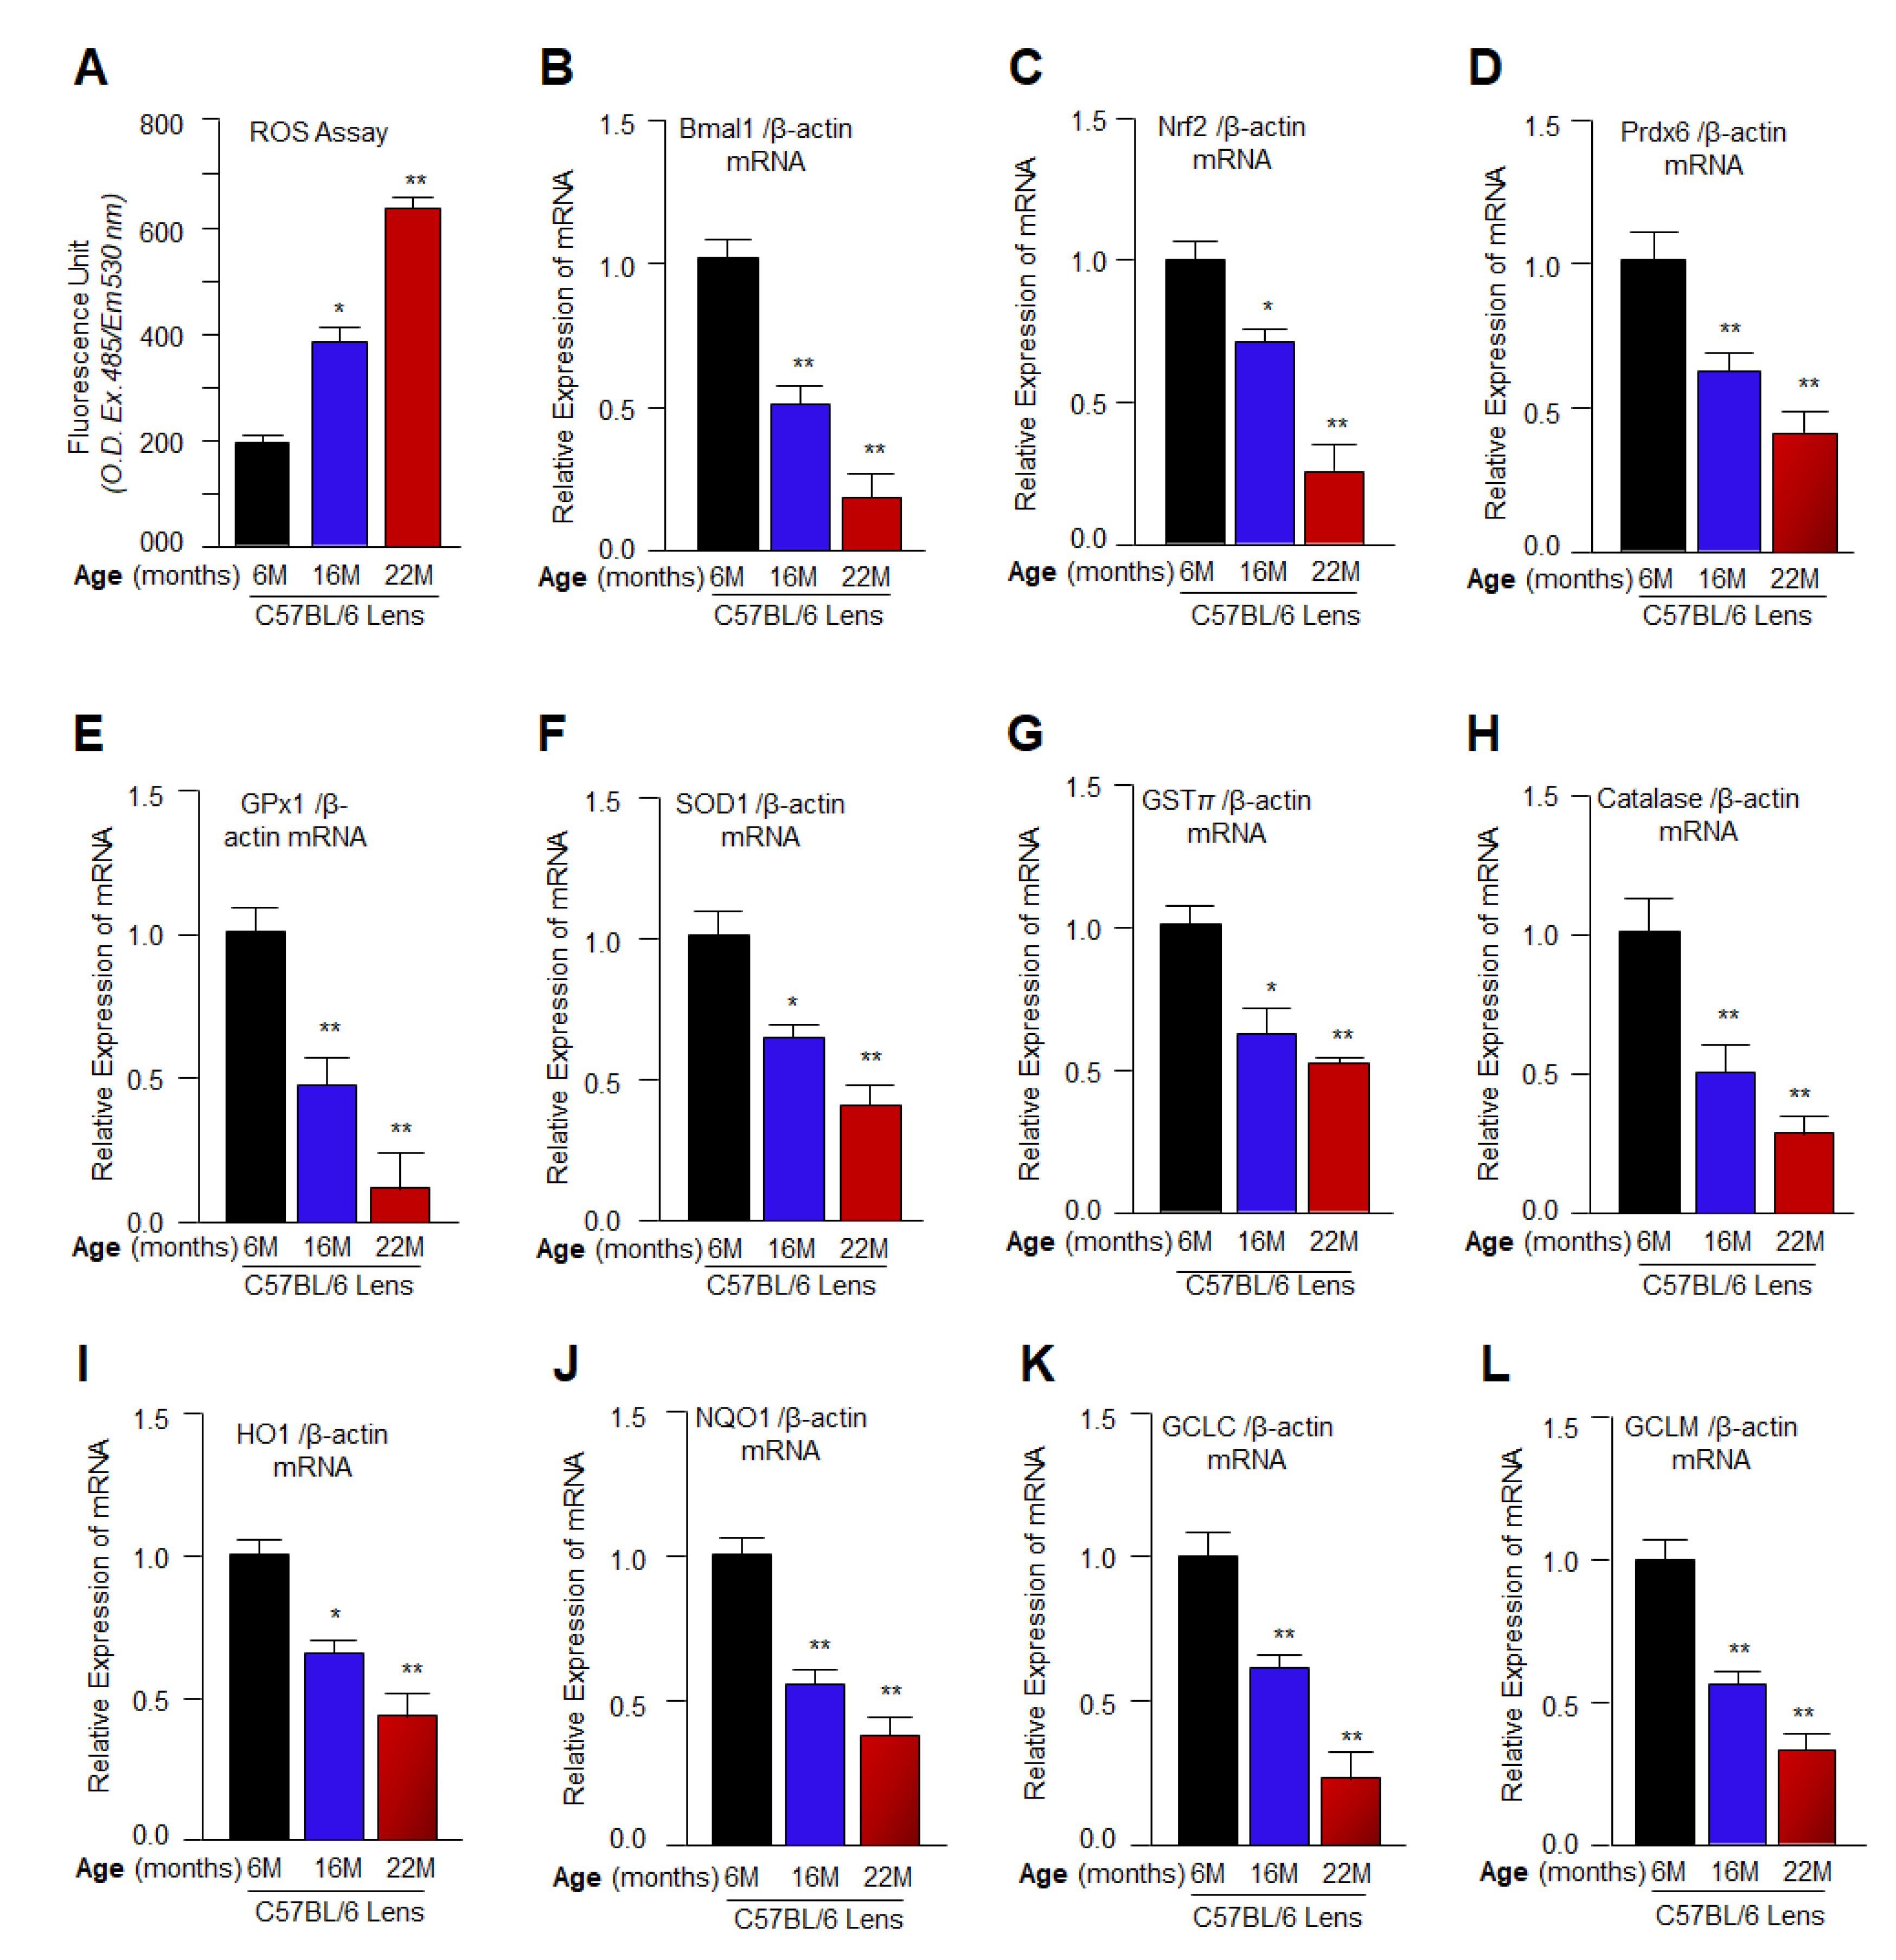
3.1. Aging Mouse Lenses Showed Increased ROS Accumulation, which Was Directly Associated with Reduction in Bmal1, Nrf2 and Nrf2 Antioxidant Genes Expression
3.2. Aging/Aged C57BL/6 Mouse Lenses and hLECs Showed Significant Loss of Antioxidant Activities
3.3. Cell Survival Assays Revealed That 1 mM of Metformin Promoted LECs Growth and Maintained Their Health
3.4. Organic Cation Transporters Present in the LECs and Metformin Enhanced Its Expression Level
3.5. Metformin-Induced Increased Nrf2 Expression Required AMPK Activation as Evidenced by Compound C(CC), an Inhibitor of AMPK, in Human and/or Mouse LECs
3.6. Metformin Treatment Enhanced Antioxidant Genes Transcription via Activation of Nrf2 in General
3.7. Metformin Treatment Augmented Bmal1, Nrf2, and Nrf2/ARE Antioxidant Genes Expression and Amplified the Enzymatic Activities in mLECs
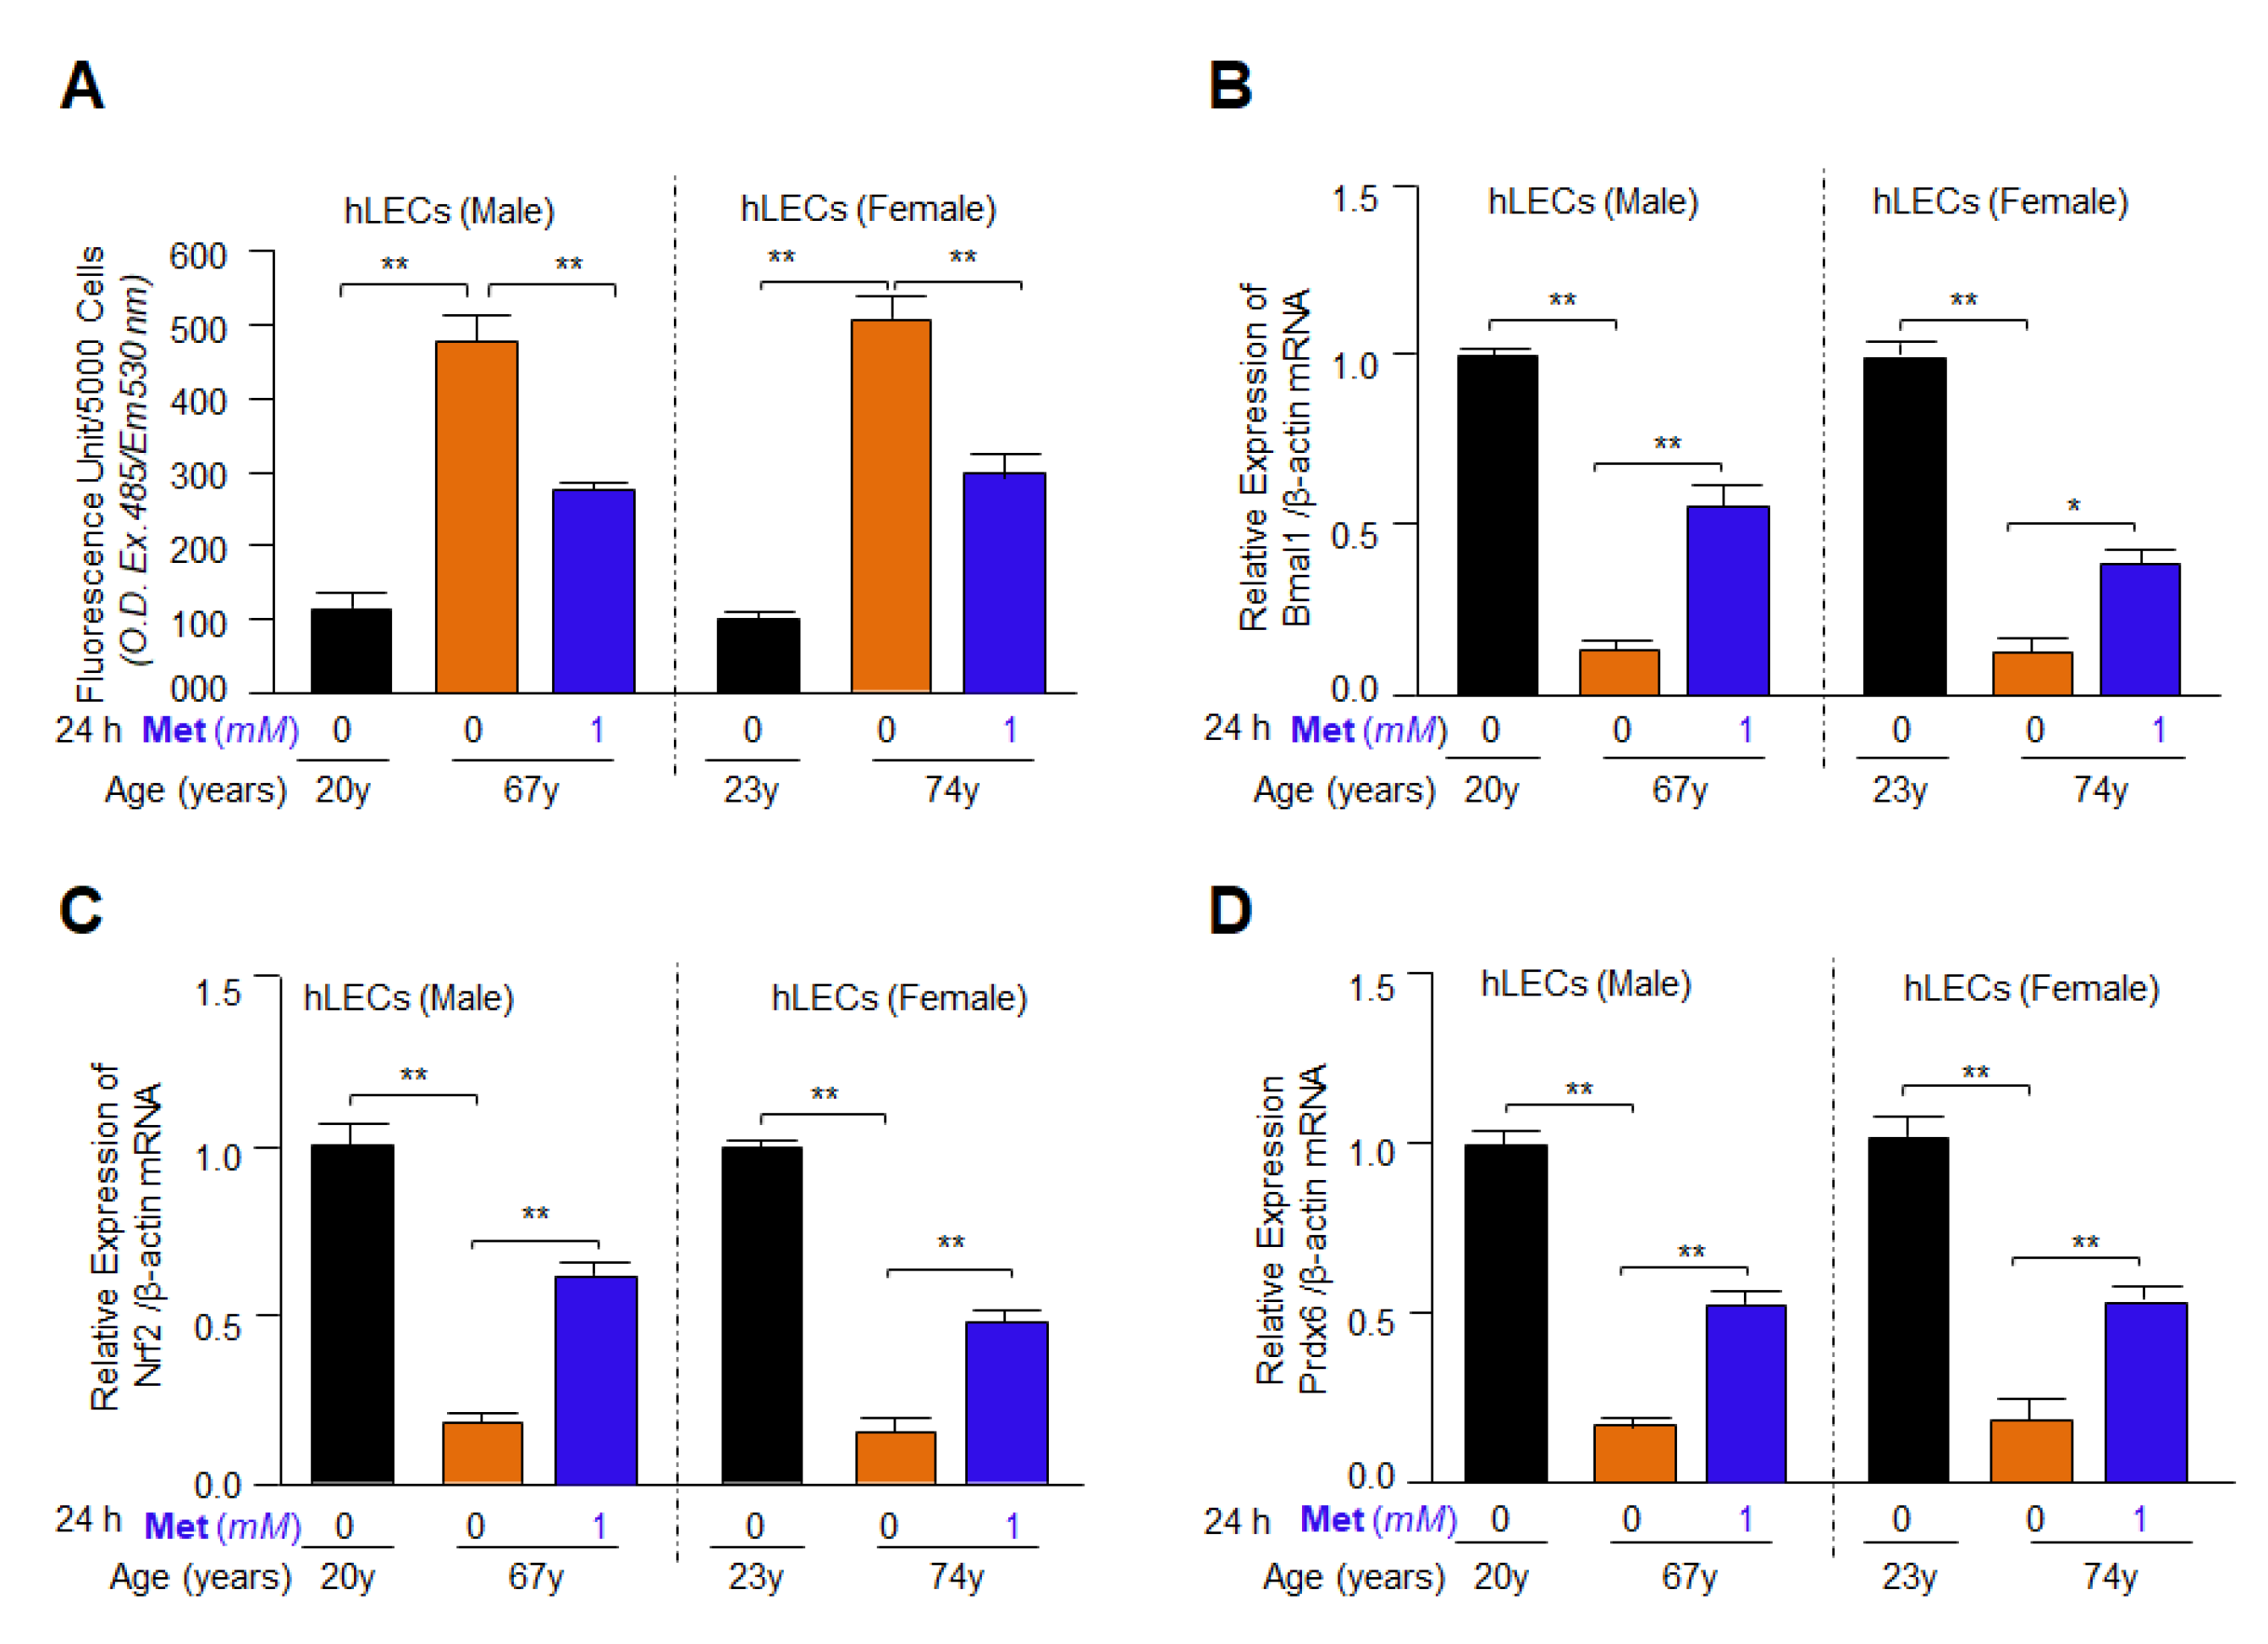
3.8. Metformin Mitigated the ROS Levels by Upregulating Bmal1, Nrf2 and Antioxidant Genes Expression in Different Ages of Primary mLECs Isolated from Male or Female of C57BL/6 Mice
3.9. Metformin Induced Bmal1 and Nrf2-Dependent Antioxidant Gene Transcription in Emb-hLECs
3.10. Metformin-Dependent Increased Expression of Bmal1 and Nrf2 Was Linked to Increased Antioxidants Expression in SRA-hLECs
3.11. Metformin Treatment Revived Bmal1, Nrf2 and Prdx6 Gene Expression and Mitigated the Elevated ROS Levels in Aging hLECs
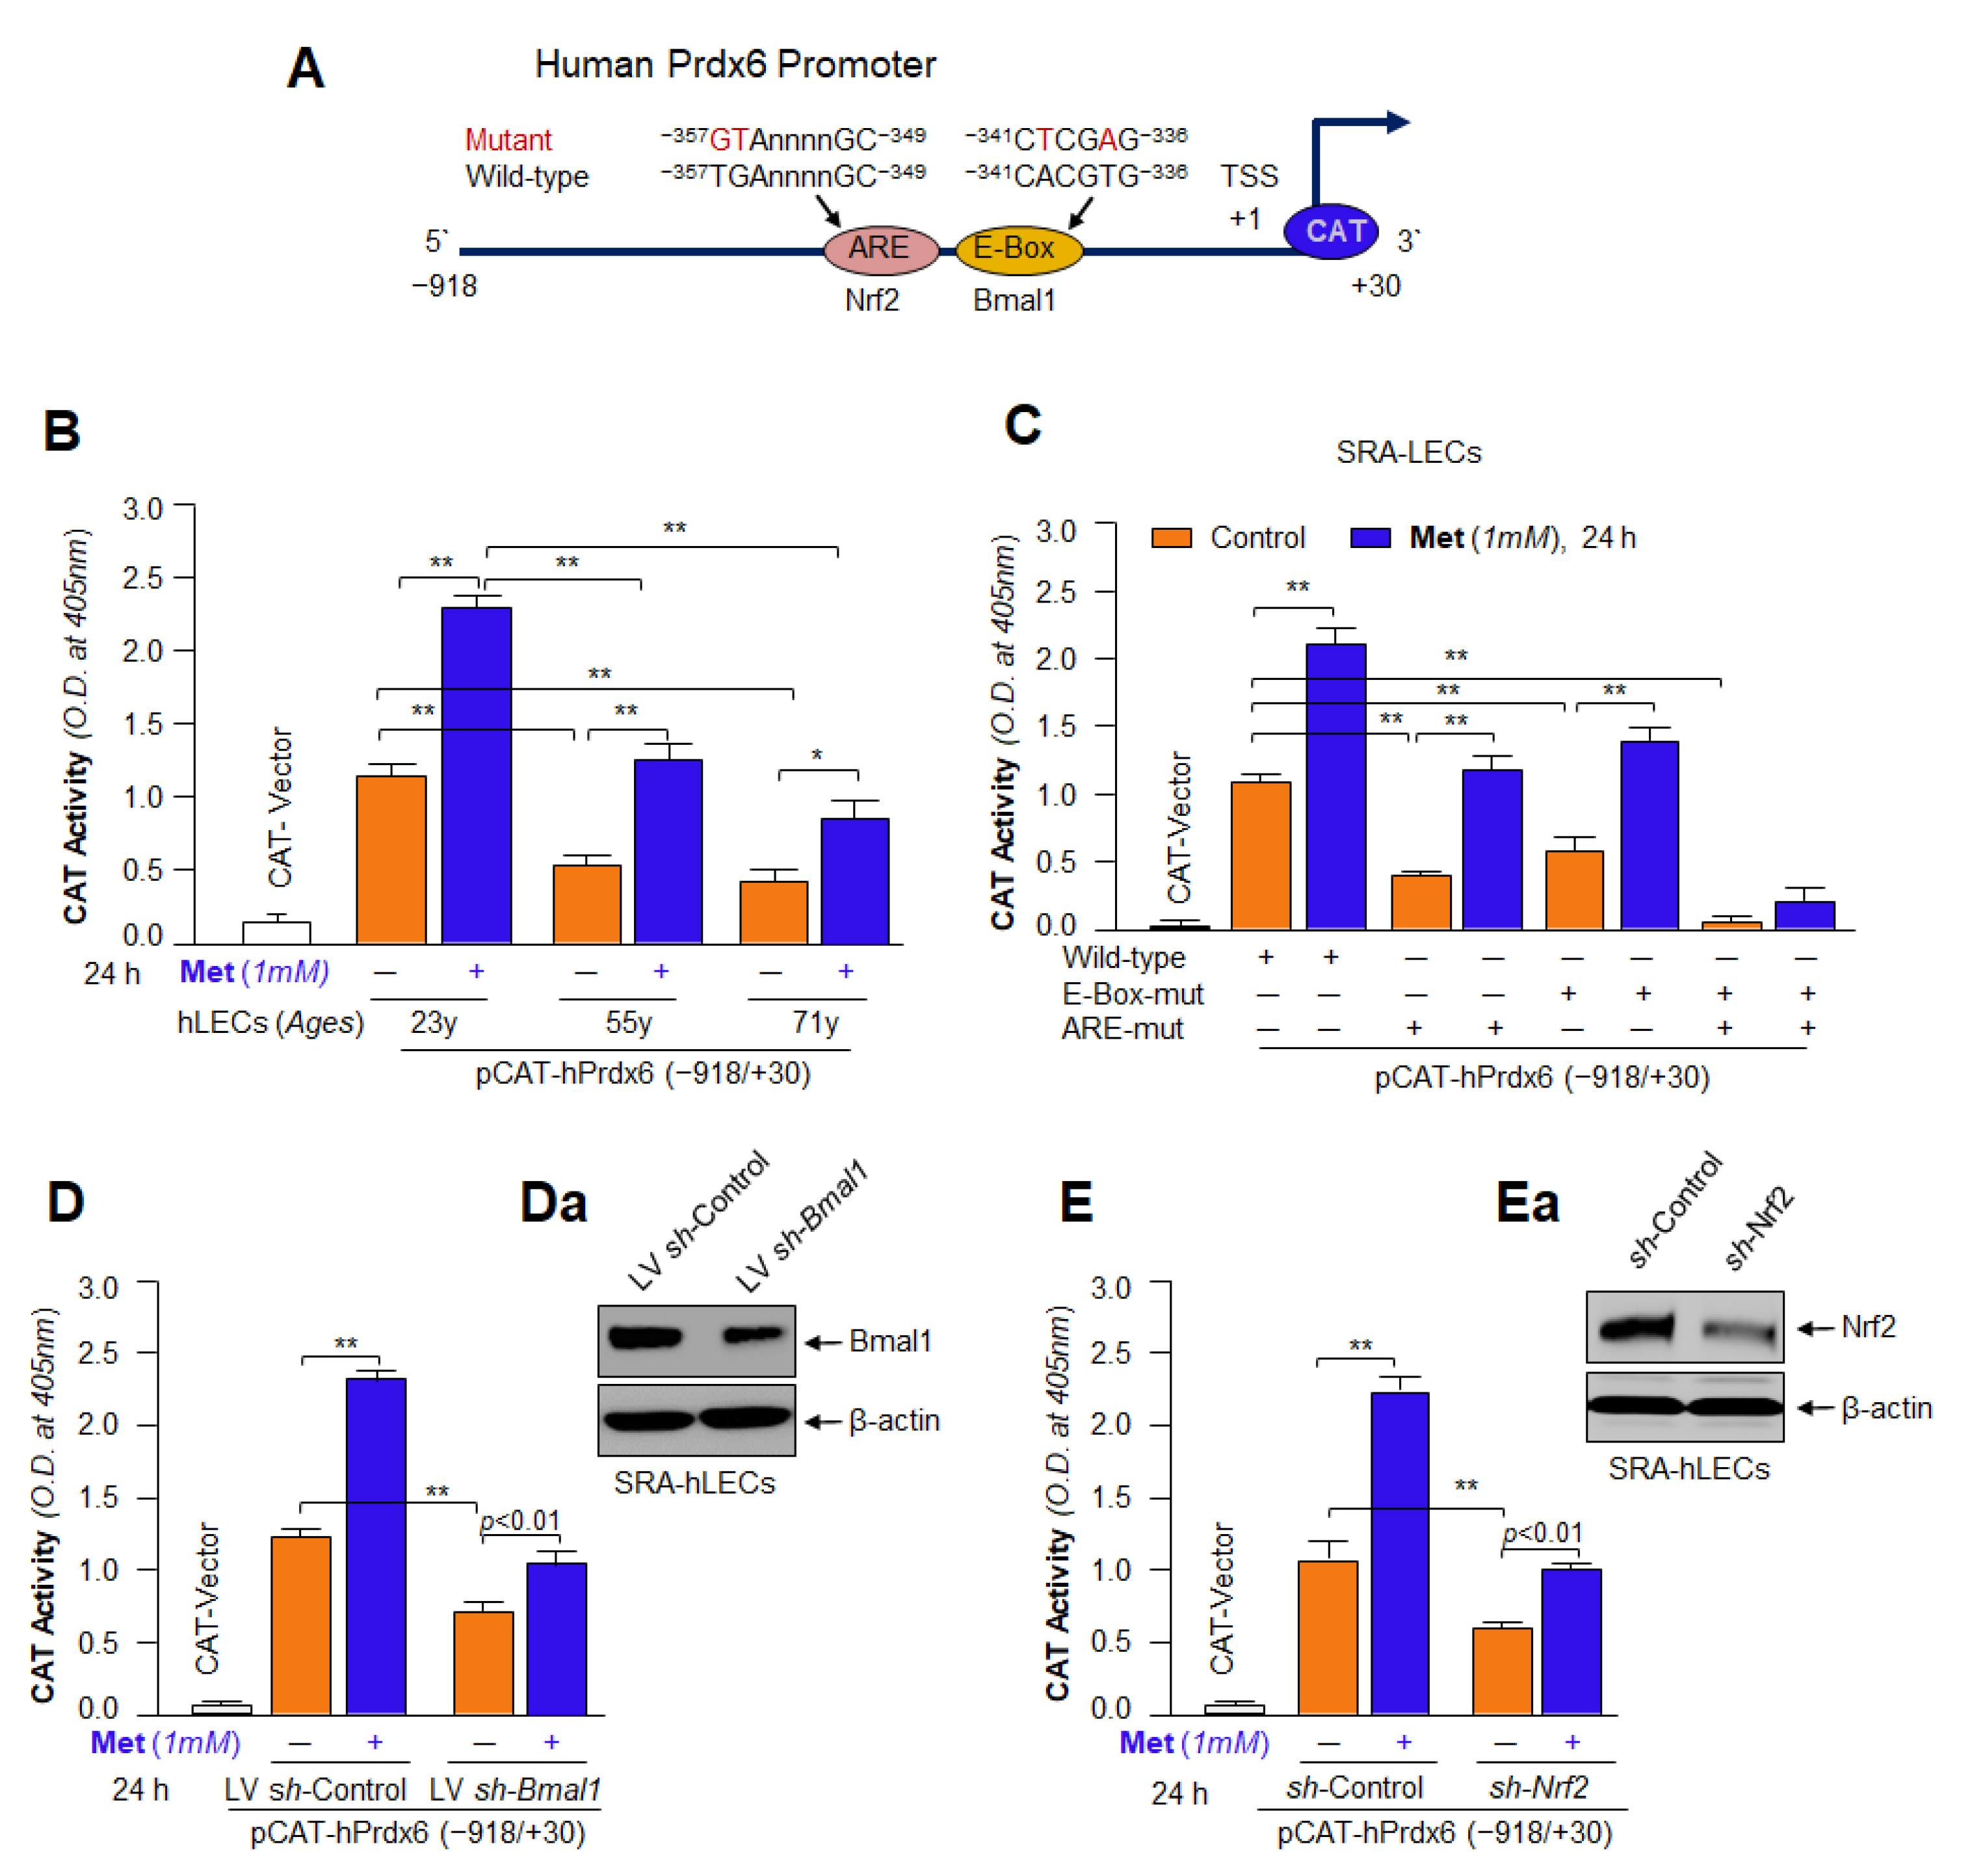
3.12. Metformin Promoted the Interaction of Bmal1/E-Box and Nrf2/ARE in Aging/Aged hLECs
3.13. DNA Binding and Knock Down Studies Demonstrated That Bmal1 or Nrf2 Enrichment at E-Box or ARE Sites Was Linked to Metformin-Induced Increased Cellular Abundance of Bmal1 or Nrf2
3.14. Metformin’s Inefficacy in Activation of Mutant Prdx6 Promoter Uncovered That Transactivation Was Predominately Derived from Direct Binding of Both, Bmal1 to E-Box and Nrf2 to ARE, in Prdx6 Gene Promoter In Vivo
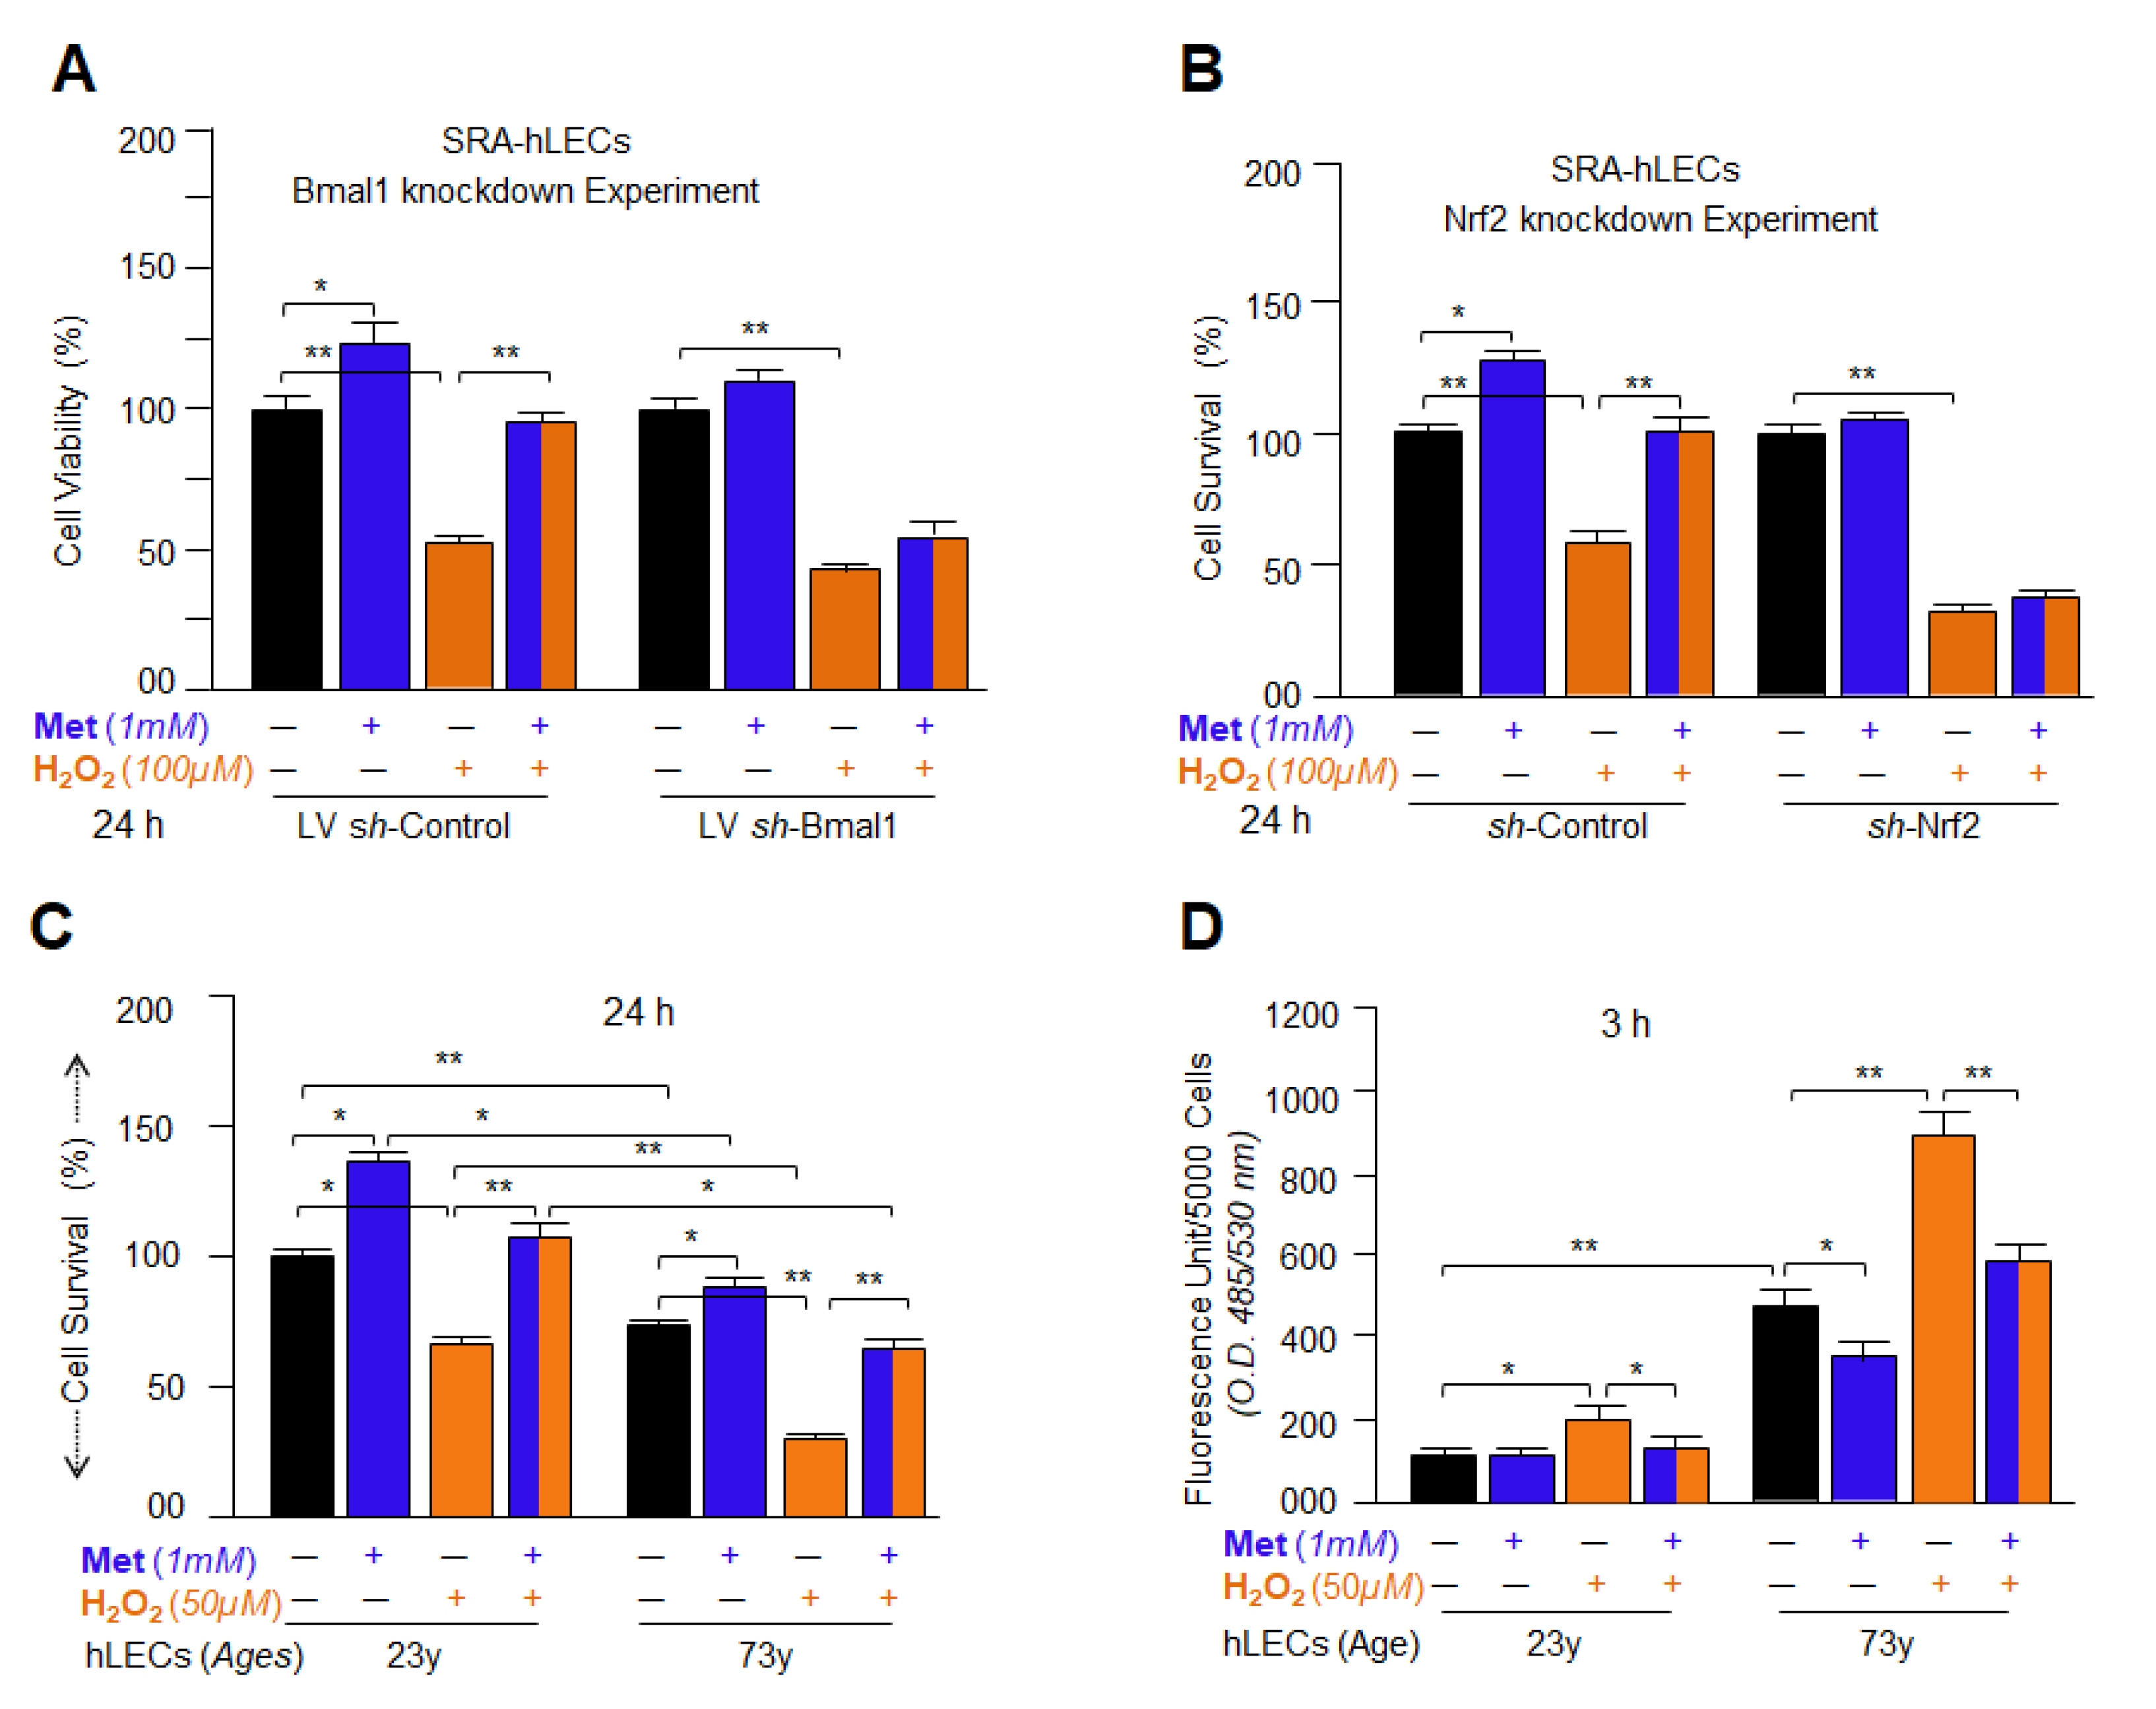
3.15. Knock Down Experiments Revealed That Metformin Treated LECs Engendered Resistance against Oxidative or Aging Stress-Driven Cellular Derangement by Reinforcing Transcriptional Proteins, Bmal1 and Nrf2 Activities
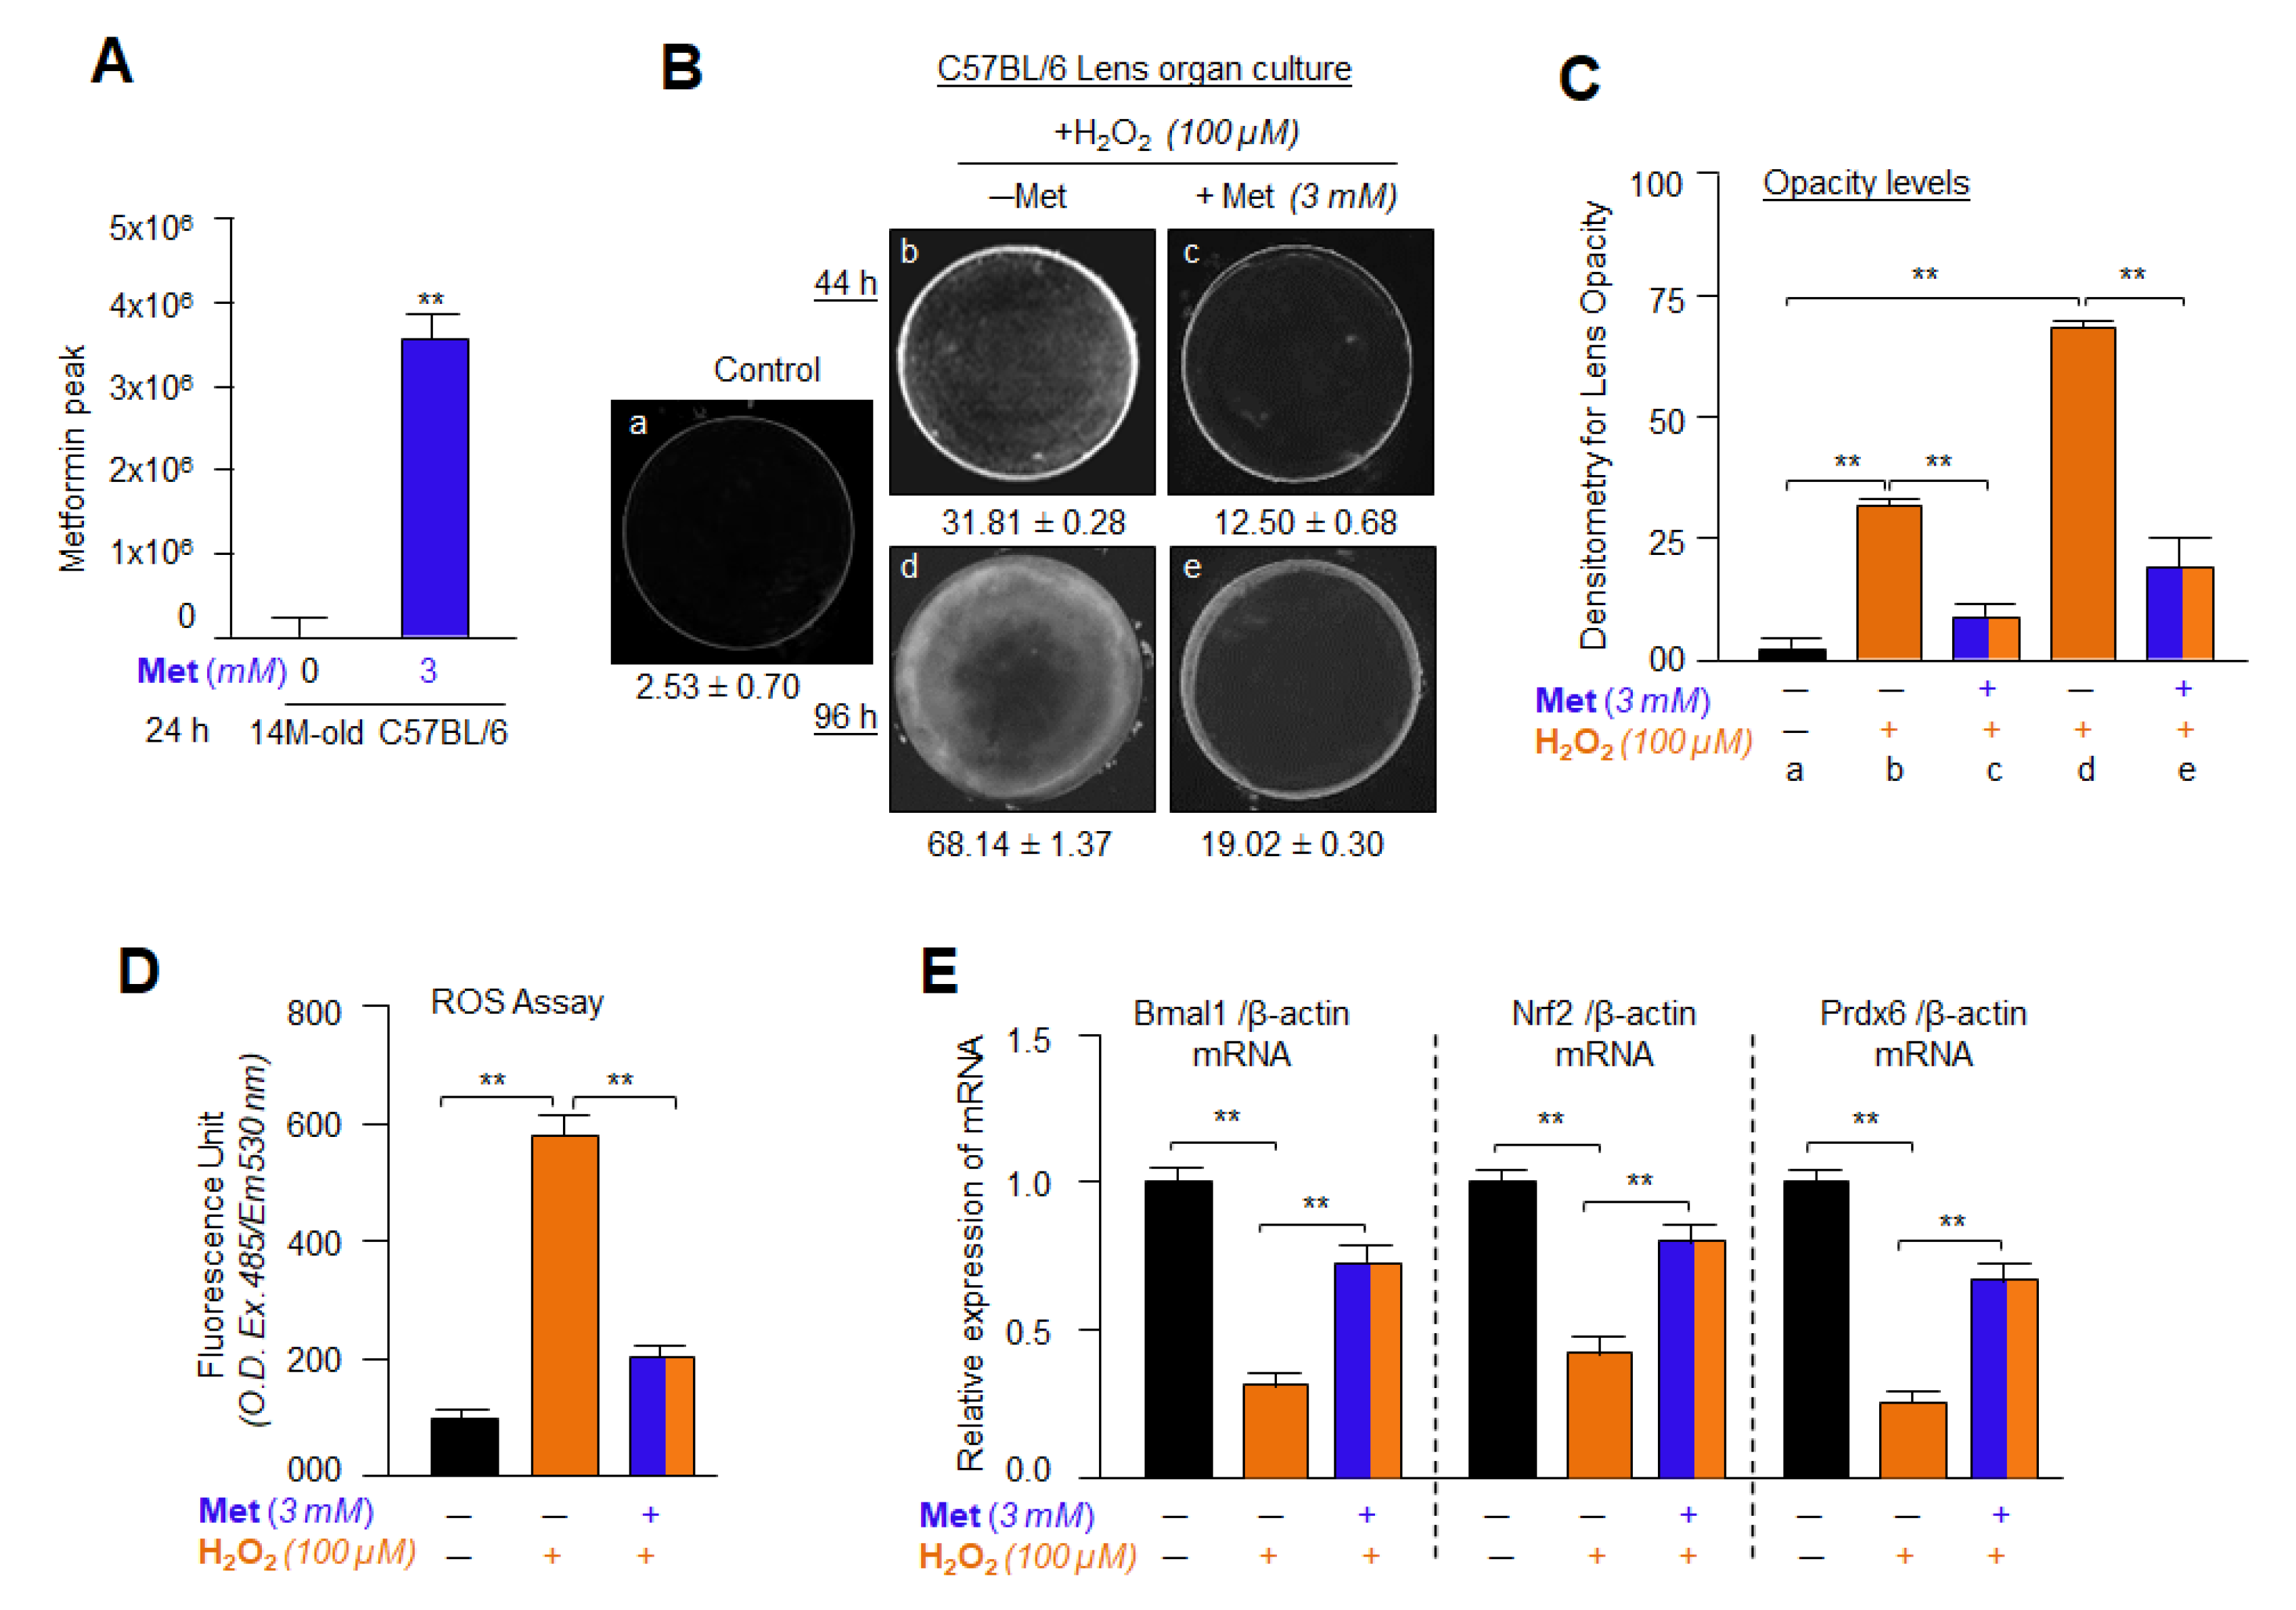
3.16. Metformin Treatment Successfully Internalized into the Lens and Delayed/Prevented Lens Opacity and ROS Generation Induced by H2O2
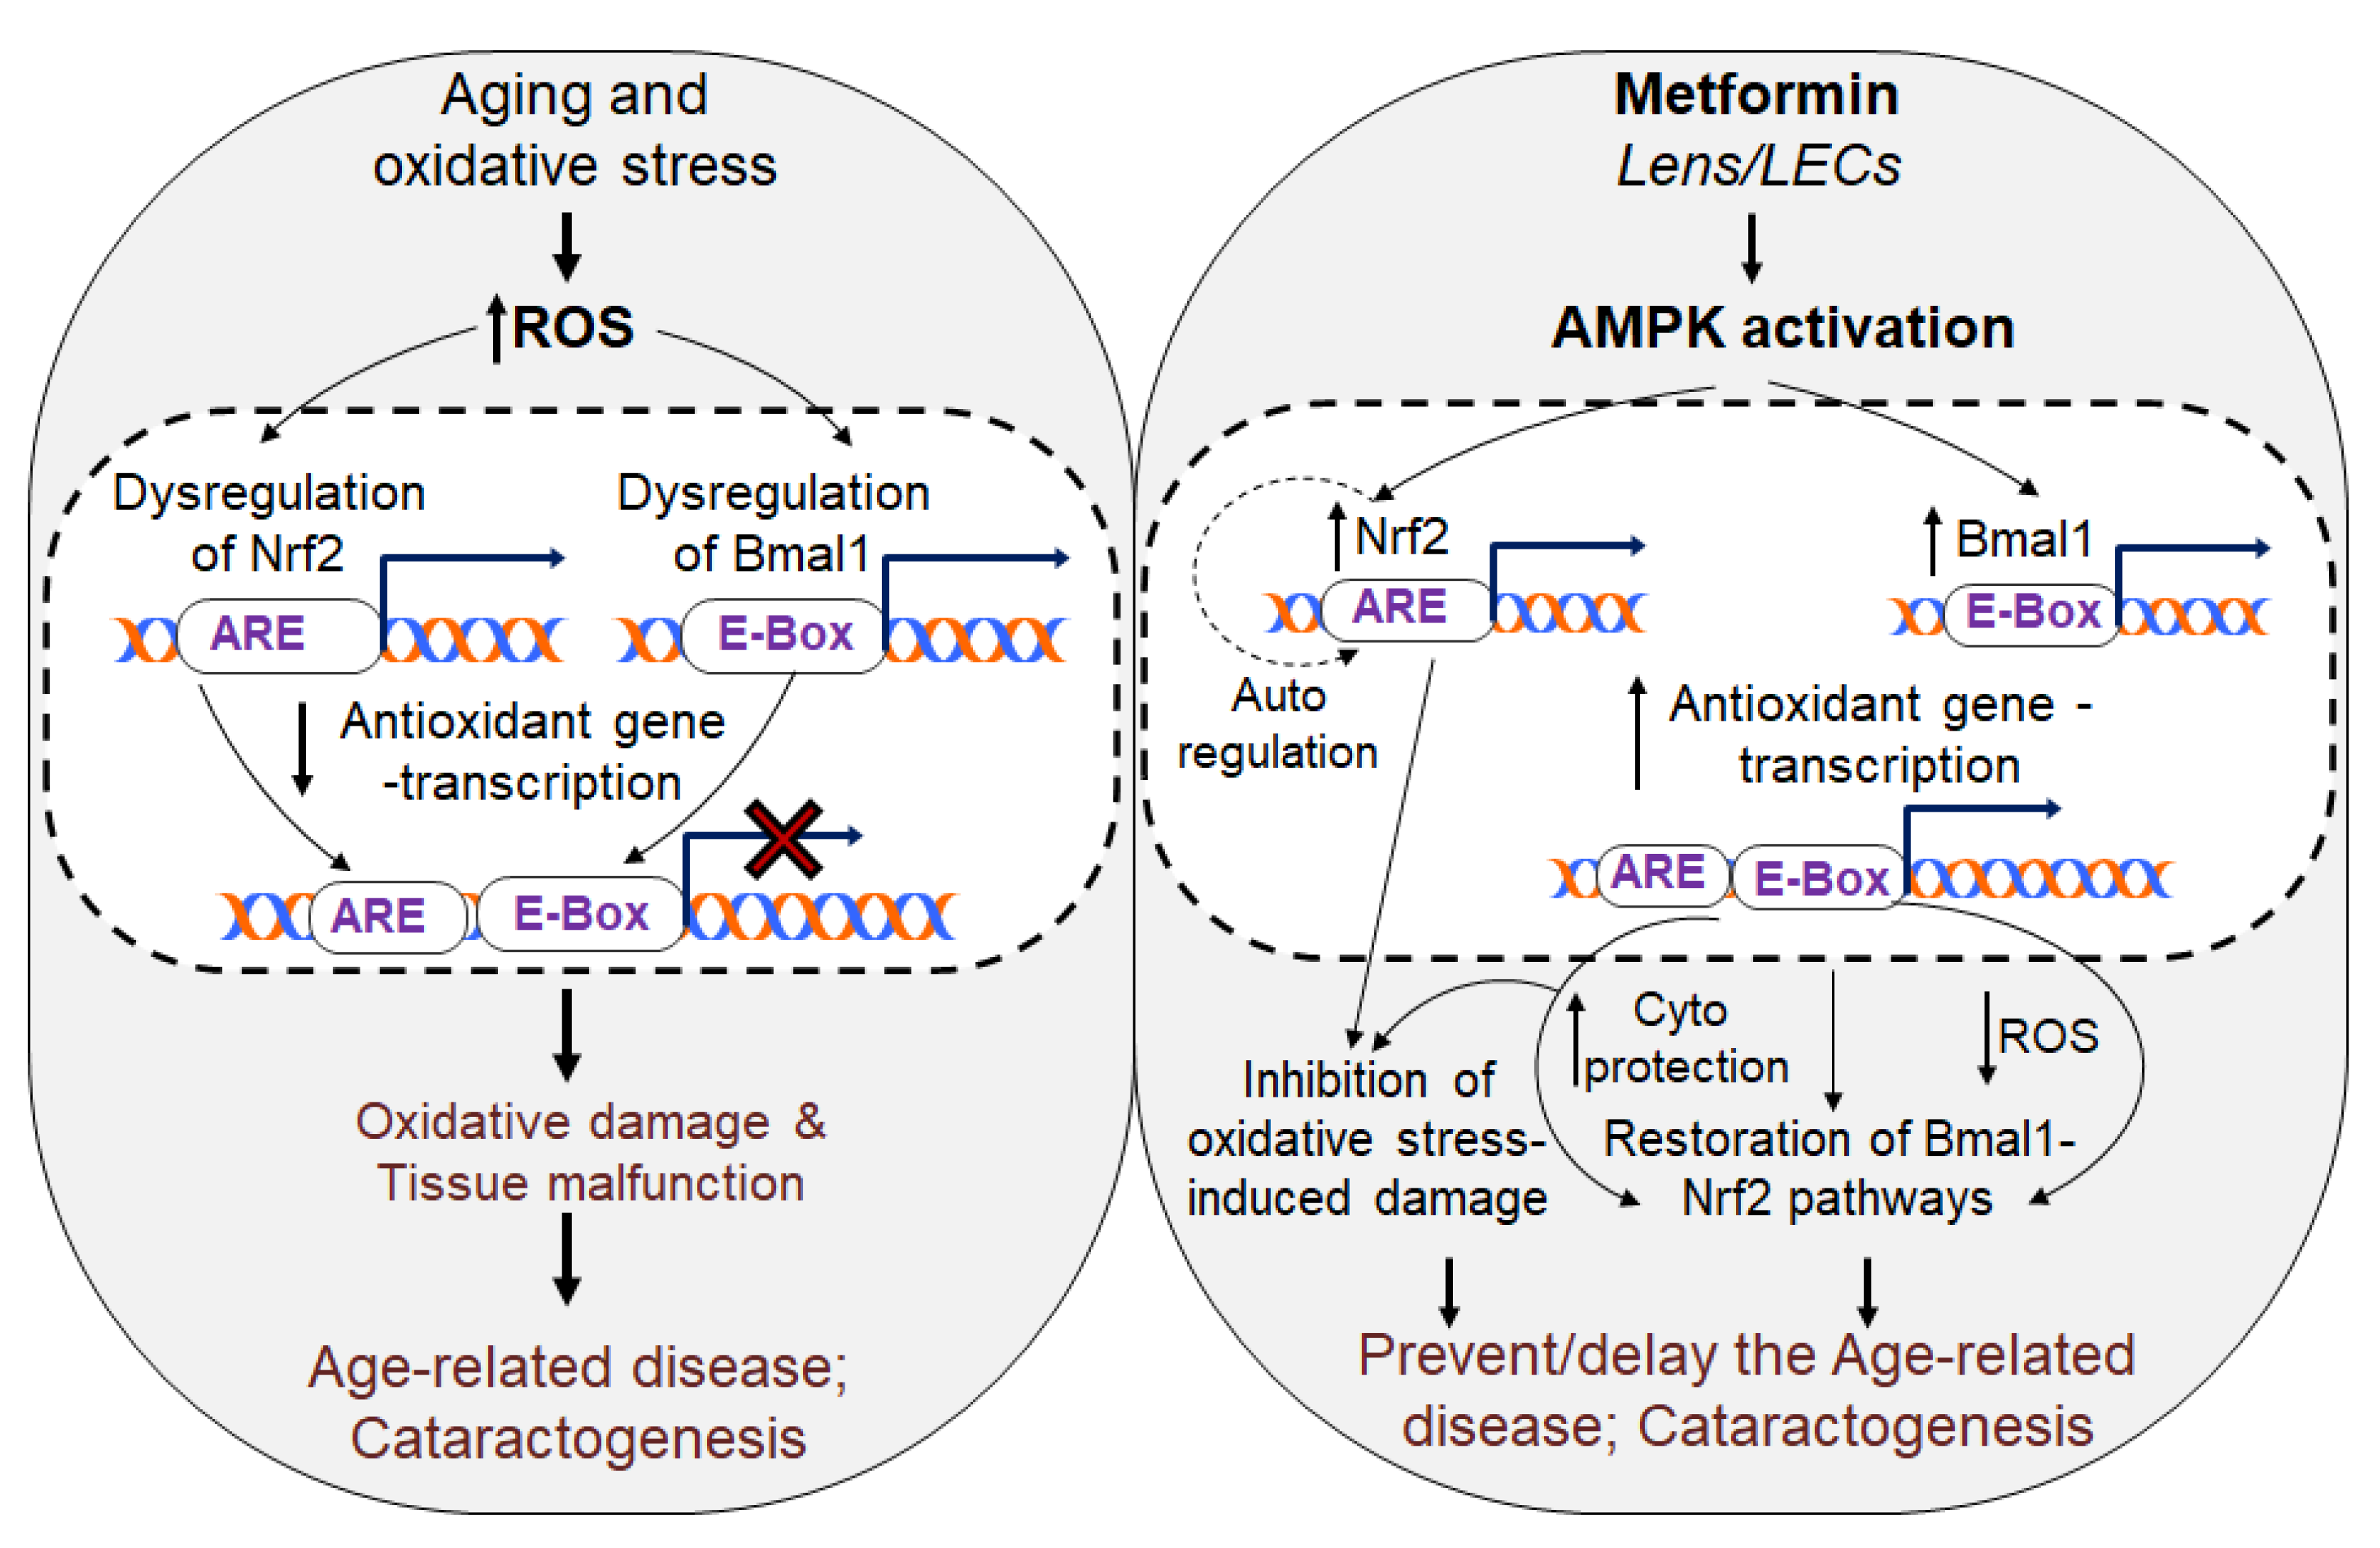
4. Discussion
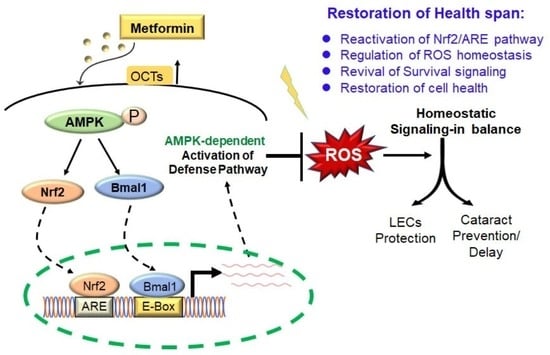
5. Conclusions
Author Contributions
Funding
Institutional Review Board Statement
Informed Consent Statement
Data Availability Statement
Acknowledgments
Conflicts of Interest
References
- Da Costa, J.P.; Vitorino, R.; Silva, G.M.; Vogel, C.; Duarte, A.C.; Rocha-Santos, T. A synopsis on aging-Theories, mechanisms and future prospects. Ageing Res. Rev. 2016, 29, 90–112. [Google Scholar] [CrossRef] [PubMed]
- Chhunchha, B.; Kubo, E.; Singh, P.; Singh, D.P. Sumoylation-deficient Prdx6 repairs aberrant Sumoylation-mediated Sp1 dysregulation-dependent Prdx6 repression and cell injury in aging and oxidative stress. Aging 2018, 10, 2284–2315. [Google Scholar] [CrossRef]
- Chhunchha, B.; Singh, P.; Stamer, W.D.; Singh, D.P. Prdx6 retards senescence and restores trabecular meshwork cell health by regulating reactive oxygen species. Cell Death Discov. 2017, 3, 17060. [Google Scholar] [CrossRef] [PubMed]
- Finkel, T.; Holbrook, N.J. Oxidants, oxidative stress and the biology of ageing. Nature 2000, 408, 239–247. [Google Scholar] [CrossRef] [PubMed]
- Kubo, E.; Chhunchha, B.; Singh, P.; Sasaki, H.; Singh, D.P. Sulforaphane reactivates cellular antioxidant defense by inducing Nrf2/ARE/Prdx6 activity during aging and oxidative stress. Sci. Rep. 2017, 7, 14130. [Google Scholar] [CrossRef] [PubMed]
- Hohn, A.; Weber, D.; Jung, T.; Ott, C.; Hugo, M.; Kochlik, B.; Kehm, R.; Konig, J.; Grune, T.; Castro, J.P. Happily (n)ever after: Aging in the context of oxidative stress, proteostasis loss and cellular senescence. Redox Biol. 2017, 11, 482–501. [Google Scholar] [CrossRef] [PubMed]
- Lopez-Otin, C.; Blasco, M.A.; Partridge, L.; Serrano, M.; Kroemer, G. The hallmarks of aging. Cell 2013, 153, 1194–1217. [Google Scholar] [CrossRef]
- Hayes, J.D.; Dinkova-Kostova, A.T. The Nrf2 regulatory network provides an interface between redox and intermediary metabolism. Trends Biochem. Sci. 2014, 39, 199–218. [Google Scholar] [CrossRef]
- Itoh, K.; Wakabayashi, N.; Katoh, Y.; Ishii, T.; O’Connor, T.; Yamamoto, M. Keap1 regulates both cytoplasmic-nuclear shuttling and degradation of Nrf2 in response to electrophiles. Genes Cells 2003, 8, 379–391. [Google Scholar] [CrossRef]
- Tao, S.; Liu, P.; Luo, G.; Rojo de la Vega, M.; Chen, H.; Wu, T.; Tillotson, J.; Chapman, E.; Zhang, D.D. p97 Negatively Regulates NRF2 by Extracting Ubiquitylated NRF2 from the KEAP1-CUL3 E3 Complex. Mol. Cell. Biol. 2017, 37, e00660-16. [Google Scholar] [CrossRef]
- Zhang, H.; Davies, K.J.A.; Forman, H.J. Oxidative stress response and Nrf2 signaling in aging. Free Radic. Biol. Med. 2015, 88 Pt B, 314–336. [Google Scholar] [CrossRef]
- Zucker, S.N.; Fink, E.E.; Bagati, A.; Mannava, S.; Bianchi-Smiraglia, A.; Bogner, P.N.; Wawrzyniak, J.A.; Foley, C.; Leonova, K.I.; Grimm, M.J.; et al. Nrf2 amplifies oxidative stress via induction of Klf9. Mol. Cell 2014, 53, 916–928. [Google Scholar] [CrossRef]
- Kondratov, R.V.; Vykhovanets, O.; Kondratova, A.A.; Antoch, M.P. Antioxidant N-acetyl-L-cysteine ameliorates symptoms of premature aging associated with the deficiency of the circadian protein BMAL1. Aging 2009, 1, 979–987. [Google Scholar] [CrossRef]
- Kondratov, R.V.; Kondratova, A.A.; Gorbacheva, V.Y.; Vykhovanets, O.V.; Antoch, M.P. Early aging and age-related pathologies in mice deficient in BMAL1, the core componentof the circadian clock. Genes Dev. 2006, 20, 1868–1873. [Google Scholar] [CrossRef]
- Kondratova, A.A.; Kondratov, R.V. The circadian clock and pathology of the ageing brain. Nat. Rev. Neurosci. 2012, 13, 325–335. [Google Scholar] [CrossRef]
- Patel, S.A.; Velingkaar, N.S.; Kondratov, R.V. Transcriptional control of antioxidant defense by the circadian clock. Antioxid. Redox Signal. 2014, 20, 2997–3006. [Google Scholar] [CrossRef]
- Pekovic-Vaughan, V.; Gibbs, J.; Yoshitane, H.; Yang, N.; Pathiranage, D.; Guo, B.; Sagami, A.; Taguchi, K.; Bechtold, D.; Loudon, A.; et al. The circadian clock regulates rhythmic activation of the NRF2/glutathione-mediated antioxidant defense pathway to modulate pulmonary fibrosis. Genes Dev. 2014, 28, 548–560. [Google Scholar] [CrossRef]
- Early, J.O.; Menon, D.; Wyse, C.A.; Cervantes-Silva, M.P.; Zaslona, Z.; Carroll, R.G.; Palsson-McDermott, E.M.; Angiari, S.; Ryan, D.G.; Corcoran, S.E.; et al. Circadian clock protein BMAL1 regulates IL-1beta in macrophages via NRF2. Proc. Natl. Acad. Sci. USA 2018, 115, E8460–E8468. [Google Scholar] [CrossRef]
- Dubrovsky, Y.V.; Samsa, W.E.; Kondratov, R.V. Deficiency of circadian protein CLOCK reduces lifespan and increases age-related cataract development in mice. Aging 2010, 2, 936–944. [Google Scholar] [CrossRef]
- Krishnan, N.; Kretzschmar, D.; Rakshit, K.; Chow, E.; Giebultowicz, J.M. The circadian clock gene period extends healthspan in aging Drosophila melanogaster. Aging 2009, 1, 937–948. [Google Scholar] [CrossRef]
- Chhunchha, B.; Kubo, E.; Singh, D.P. Clock Protein Bmal1 and Nrf2 Cooperatively Control Aging or Oxidative Response and Redox Homeostasis by Regulating Rhythmic Expression of Prdx6. Cells 2020, 9, 1861. [Google Scholar] [CrossRef]
- Yang, G.; Chen, L.; Grant, G.R.; Paschos, G.; Song, W.L.; Musiek, E.S.; Lee, V.; McLoughlin, S.C.; Grosser, T.; Cotsarelis, G.; et al. Timing of expression of the core clock gene Bmal1 influences its effects on aging and survival. Sci. Transl. Med. 2016, 8, 324ra316. [Google Scholar] [CrossRef] [PubMed]
- Musiek, E.S.; Lim, M.M.; Yang, G.; Bauer, A.Q.; Qi, L.; Lee, Y.; Roh, J.H.; Ortiz-Gonzalez, X.; Dearborn, J.T.; Culver, J.P.; et al. Circadian clock proteins regulate neuronal redox homeostasis and neurodegeneration. J. Clin. Investig. 2013, 123, 5389–5400. [Google Scholar] [CrossRef] [PubMed]
- Salminen, A.; Kaarniranta, K.; Kauppinen, A. AMPK and HIF signaling pathways regulate both longevity and cancer growth: The good news and the bad news about survival mechanisms. Biogerontology 2016, 17, 655–680. [Google Scholar] [CrossRef]
- Salminen, A.; Kaarniranta, K.; Kauppinen, A. Age-related changes in AMPK activation: Role for AMPK phosphatases and inhibitory phosphorylation by upstream signaling pathways. Ageing Res. Rev. 2016, 28, 15–26. [Google Scholar] [CrossRef]
- Salminen, A.; Kauppinen, A.; Kaarniranta, K. AMPK/Snf1 signaling regulates histone acetylation: Impact on gene expression and epigenetic functions. Cell Signal. 2016, 28, 887–895. [Google Scholar] [CrossRef]
- Jordan, S.D.; Lamia, K.A. AMPK at the crossroads of circadian clocks and metabolism. Mol. Cell. Endocrinol. 2013, 366, 163–169. [Google Scholar] [CrossRef]
- Alex, A.; Luo, Q.; Mathew, D.; Di, R.; Bhatwadekar, A.D. Metformin Corrects Abnormal Circadian Rhythm and Kir4.1 Channels in Diabetes. Investig. Ophthalmol. Vis. Sci. 2020, 61, 46. [Google Scholar] [CrossRef]
- Mihaylova, M.M.; Shaw, R.J. The AMPK signalling pathway coordinates cell growth, autophagy and metabolism. Nat. Cell Biol. 2011, 13, 1016–1023. [Google Scholar] [CrossRef]
- Um, J.H.; Pendergast, J.S.; Springer, D.A.; Foretz, M.; Viollet, B.; Brown, A.; Kim, M.K.; Yamazaki, S.; Chung, J.H. AMPK regulates circadian rhythms in a tissue- and isoform-specific manner. PLoS ONE 2011, 6, e18450. [Google Scholar] [CrossRef]
- Lamia, K.A.; Sachdeva, U.M.; DiTacchio, L.; Williams, E.C.; Alvarez, J.G.; Egan, D.F.; Vasquez, D.S.; Juguilon, H.; Panda, S.; Shaw, R.J.; et al. AMPK regulates the circadian clock by cryptochrome phosphorylation and degradation. Science 2009, 326, 437–440. [Google Scholar] [CrossRef]
- Garcia, D.; Shaw, R.J. AMPK: Mechanisms of Cellular Energy Sensing and Restoration of Metabolic Balance. Mol. Cell 2017, 66, 789–800. [Google Scholar] [CrossRef]
- Carling, D.; Thornton, C.; Woods, A.; Sanders, M.J. AMP-activated protein kinase: New regulation, new roles? Biochem. J. 2012, 445, 11–27. [Google Scholar] [CrossRef]
- Ross, F.A.; Jensen, T.E.; Hardie, D.G. Differential regulation by AMP and ADP of AMPK complexes containing different gamma subunit isoforms. Biochem. J. 2016, 473, 189–199. [Google Scholar] [CrossRef]
- Yang, Q.; Liang, X.; Sun, X.; Zhang, L.; Fu, X.; Rogers, C.J.; Berim, A.; Zhang, S.; Wang, S.; Wang, B.; et al. AMPK/alpha-Ketoglutarate Axis Dynamically Mediates DNA Demethylation in the Prdm16 Promoter and Brown Adipogenesis. Cell Metab. 2016, 24, 542–554. [Google Scholar] [CrossRef]
- Kwak, M.K.; Itoh, K.; Yamamoto, M.; Kensler, T.W. Enhanced expression of the transcription factor Nrf2 by cancer chemopreventive agents: Role of antioxidant response element-like sequences in the nrf2 promoter. Mol. Cell. Biol. 2002, 22, 2883–2892. [Google Scholar] [CrossRef]
- Bungard, D.; Fuerth, B.J.; Zeng, P.Y.; Faubert, B.; Maas, N.L.; Viollet, B.; Carling, D.; Thompson, C.B.; Jones, R.G.; Berger, S.L. Signaling kinase AMPK activates stress-promoted transcription via histone H2B phosphorylation. Science 2010, 329, 1201–1205. [Google Scholar] [CrossRef]
- Matzinger, M.; Fischhuber, K.; Poloske, D.; Mechtler, K.; Heiss, E.H. AMPK leads to phosphorylation of the transcription factor Nrf2, tuning transactivation of selected target genes. Redox Biol. 2020, 29, 101393. [Google Scholar] [CrossRef]
- Fischhuber, K.; Matzinger, M.; Heiss, E.H. AMPK Enhances Transcription of Selected Nrf2 Target Genes via Negative Regulation of Bach1. Front. Cell Dev. Biol. 2020, 8, 628. [Google Scholar] [CrossRef]
- Lv, H.; Liu, Q.; Wen, Z.; Feng, H.; Deng, X.; Ci, X. Xanthohumol ameliorates lipopolysaccharide (LPS)-induced acute lung injury via induction of AMPK/GSK3beta-Nrf2 signal axis. Redox Biol. 2017, 12, 311–324. [Google Scholar] [CrossRef]
- Joo, M.S.; Kim, W.D.; Lee, K.Y.; Kim, J.H.; Koo, J.H.; Kim, S.G. AMPK Facilitates Nuclear Accumulation of Nrf2 by Phosphorylating at Serine 550. Mol. Cell. Biol. 2016, 36, 1931–1942. [Google Scholar] [CrossRef] [PubMed]
- Geyfman, M.; Kumar, V.; Liu, Q.; Ruiz, R.; Gordon, W.; Espitia, F.; Cam, E.; Millar, S.E.; Smyth, P.; Ihler, A.; et al. Brain and muscle Arnt-like protein-1 (BMAL1) controls circadian cell proliferation and susceptibility to UVB-induced DNA damage in the epidermis. Proc. Natl. Acad. Sci. USA 2012, 109, 11758–11763. [Google Scholar] [CrossRef] [PubMed]
- Duca, F.A.; Cote, C.D.; Rasmussen, B.A.; Zadeh-Tahmasebi, M.; Rutter, G.A.; Filippi, B.M.; Lam, T.K. Metformin activates a duodenal Ampk-dependent pathway to lower hepatic glucose production in rats. Nat. Med. 2015, 21, 506–511. [Google Scholar] [CrossRef] [PubMed]
- He, L.; Wondisford, F.E. Metformin action: Concentrations matter. Cell Metab. 2015, 21, 159–162. [Google Scholar] [CrossRef] [PubMed]
- Choi, K.M.; Lee, Y.S.; Kim, W.; Kim, S.J.; Shin, K.O.; Yu, J.Y.; Lee, M.K.; Lee, Y.M.; Hong, J.T.; Yun, Y.P.; et al. Sulforaphane attenuates obesity by inhibiting adipogenesis and activating the AMPK pathway in obese mice. J. Nutr. Biochem. 2014, 25, 201–207. [Google Scholar] [CrossRef]
- Hadad, S.M.; Hardie, D.G.; Appleyard, V.; Thompson, A.M. Effects of metformin on breast cancer cell proliferation, the AMPK pathway and the cell cycle. Clin. Transl. Oncol. 2014, 16, 746–752. [Google Scholar] [CrossRef]
- Hardie, D.G. AMPK: A target for drugs and natural products with effects on both diabetes and cancer. Diabetes 2013, 62, 2164–2172. [Google Scholar] [CrossRef]
- Fang, Y.; Li, F.; Qi, C.; Mao, X.; Wang, F.; Zhao, Z.; Chen, J.K.; Zhang, Z.; Wu, H. Metformin effectively treats Tsc1 deletion-caused kidney pathology by upregulating AMPK phosphorylation. Cell Death Discov. 2020, 6, 52. [Google Scholar] [CrossRef]
- He, T.; Xiong, J.; Nie, L.; Yu, Y.; Guan, X.; Xu, X.; Xiao, T.; Yang, K.; Liu, L.; Zhang, D.; et al. Resveratrol inhibits renal interstitial fibrosis in diabetic nephropathy by regulating AMPK/NOX4/ROS pathway. J. Mol. Med. 2016, 94, 1359–1371. [Google Scholar] [CrossRef]
- Kulkarni, A.S.; Brutsaert, E.F.; Anghel, V.; Zhang, K.; Bloomgarden, N.; Pollak, M.; Mar, J.C.; Hawkins, M.; Crandall, J.P.; Barzilai, N. Metformin regulates metabolic and nonmetabolic pathways in skeletal muscle and subcutaneous adipose tissues of older adults. Aging Cell 2018, 17, e12723. [Google Scholar] [CrossRef]
- Kulkarni, A.S.; Gubbi, S.; Barzilai, N. Benefits of Metformin in Attenuating the Hallmarks of Aging. Cell Metab. 2020, 32, 15–30. [Google Scholar] [CrossRef]
- Kulkarni, A.S.; Peck, B.D.; Walton, R.G.; Kern, P.A.; Mar, J.C.; Windham, S.T.; Bamman, M.M.; Barzilai, N.; Peterson, C.A. Metformin alters skeletal muscle transcriptome adaptations to resistance training in older adults. Aging 2020, 12, 19852–19866. [Google Scholar] [CrossRef]
- Barzilai, N.; Crandall, J.P.; Kritchevsky, S.B.; Espeland, M.A. Metformin as a Tool to Target Aging. Cell Metab. 2016, 23, 1060–1065. [Google Scholar] [CrossRef]
- Noren Hooten, N.; Martin-Montalvo, A.; Dluzen, D.F.; Zhang, Y.; Bernier, M.; Zonderman, A.B.; Becker, K.G.; Gorospe, M.; de Cabo, R.; Evans, M.K. Metformin-mediated increase in DICER1 regulates microRNA expression and cellular senescence. Aging Cell 2016, 15, 572–581. [Google Scholar] [CrossRef]
- Martin-Montalvo, A.; Mercken, E.M.; Mitchell, S.J.; Palacios, H.H.; Mote, P.L.; Scheibye-Knudsen, M.; Gomes, A.P.; Ward, T.M.; Minor, R.K.; Blouin, M.J.; et al. Metformin improves healthspan and lifespan in mice. Nat. Commun. 2013, 4, 2192. [Google Scholar] [CrossRef]
- Mercken, E.M.; Capri, M.; Carboneau, B.A.; Conte, M.; Heidler, J.; Santoro, A.; Martin-Montalvo, A.; Gonzalez-Freire, M.; Khraiwesh, H.; Gonzalez-Reyes, J.A.; et al. Conserved and species-specific molecular denominators in mammalian skeletal muscle aging. NPJ Aging Mech. Dis. 2017, 3, 8. [Google Scholar] [CrossRef]
- Franceschi, C.; Capri, M.; Monti, D.; Giunta, S.; Olivieri, F.; Sevini, F.; Panourgia, M.P.; Invidia, L.; Celani, L.; Scurti, M.; et al. Inflammaging and anti-inflammaging: A systemic perspective on aging and longevity emerged from studies in humans. Mech. Ageing Dev. 2007, 128, 92–105. [Google Scholar] [CrossRef]
- Franceschi, C.; Garagnani, P.; Morsiani, C.; Conte, M.; Santoro, A.; Grignolio, A.; Monti, D.; Capri, M.; Salvioli, S. The Continuum of Aging and Age-Related Diseases: Common Mechanisms but Different Rates. Front. Med. 2018, 5, 61. [Google Scholar] [CrossRef]
- Franceschi, C.; Garagnani, P.; Parini, P.; Giuliani, C.; Santoro, A. Inflammaging: A new immune-metabolic viewpoint for age-related diseases. Nat. Rev. Endocrinol. 2018, 14, 576–590. [Google Scholar] [CrossRef]
- Beckman, K.B.; Ames, B.N. The free radical theory of aging matures. Physiol. Rev. 1998, 78, 547–581. [Google Scholar] [CrossRef]
- Beckman, K.B.; Ames, B.N. Mitochondrial aging: Open questions. Ann. N. Y. Acad. Sci. 1998, 854, 118–127. [Google Scholar] [CrossRef]
- Lin, J.B.; Tsubota, K.; Apte, R.S. A glimpse at the aging eye. NPJ Aging Mech. Dis. 2016, 2, 16003. [Google Scholar] [CrossRef]
- Quinlan, R.A.; Giblin, F. The eye lens as an aging paradigm par excellence. Exp. Eye Res. 2022, 218, 109003. [Google Scholar] [CrossRef]
- Ibaraki, N.; Chen, S.C.; Lin, L.R.; Okamoto, H.; Pipas, J.M.; Reddy, V.N. Human lens epithelial cell line. Exp. Eye Res. 1998, 67, 577–585. [Google Scholar] [CrossRef]
- Chhunchha, B.; Fatma, N.; Kubo, E.; Singh, D.P. Aberrant sumoylation signaling evoked by reactive oxygen species impairs protective function of Prdx6 by destabilization and repression of its transcription. FEBS J. 2014, 281, 3357–3381. [Google Scholar] [CrossRef]
- Singh, D.P.; Kubo, E.; Takamura, Y.; Shinohara, T.; Kumar, A.; Chylack, L.T.; Fatma, N. DNA binding domains and nuclear localization signal of LEDGF: Contribution of two helix-turn-helix (HTH)-like domains and a stretch of 58 amino acids of the N-terminal to the trans-activation potential of LEDGF. J. Mol. Biol. 2006, 355, 379–394. [Google Scholar] [CrossRef] [PubMed]
- Kubo, E.; Fatma, N.; Akagi, Y.; Beier, D.R.; Singh, S.P.; Singh, D.P. TAT-mediated PRDX6 protein transduction protects against eye lens epithelial cell death and delays lens opacity. Am. J. Physiol. Cell Physiol. 2008, 294, C842–C855. [Google Scholar] [CrossRef] [PubMed]
- Fatma, N.; Kubo, E.; Sharma, P.; Beier, D.R.; Singh, D.P. Impaired homeostasis and phenotypic abnormalities in Prdx6-/-mice lens epithelial cells by reactive oxygen species: Increased expression and activation of TGFbeta. Cell Death Differ 2005, 12, 734–750. [Google Scholar] [CrossRef]
- McAvoy, J.W.; Chamberlain, C.G.; de Iongh, R.U.; Hales, A.M.; Lovicu, F.J. Lens development. Eye 1999, 13 Pt 3b, 425–437. [Google Scholar] [CrossRef]
- Piatigorsky, J.; Rothschild, S.S. Loss during development of the ability of chick embryonic lens cells to elongate in culture: Inverse relationship between cell division and elongation. Dev. Biol. 1972, 28, 382–389. [Google Scholar] [CrossRef]
- Singh, D.P.; Bhargavan, B.; Chhunchha, B.; Kubo, E.; Kumar, A.; Fatma, N. Transcriptional protein Sp1 regulates LEDGF transcription by directly interacting with its cis-elements in GC-rich region of TATA-less gene promoter. PLoS ONE 2012, 7, e37012. [Google Scholar]
- Singh, D.P.; Ohguro, N.; Kikuchi, T.; Sueno, T.; Reddy, V.N.; Yuge, K.; Chylack, L.T., Jr.; Shinohara, T. Lens epithelium-derived growth factor: Effects on growth and survival of lens epithelial cells, keratinocytes, and fibroblasts. Biochem. Biophys. Res. Commun. 2000, 267, 373–381. [Google Scholar] [CrossRef]
- Cong, L.; Pakala, S.B.; Ohshiro, K.; Li, D.Q.; Kumar, R. SUMOylation and SUMO-interacting motif (SIM) of metastasis tumor antigen 1 (MTA1) synergistically regulate its transcriptional repressor function. J. Biol. Chem. 2011, 286, 43793–43808. [Google Scholar] [CrossRef]
- Chhunchha, B.; Kubo, E.; Singh, D.P. Switching of Redox Signaling by Prdx6 Expression Decides Cellular Fate by Hormetic Phenomena Involving Nrf2 and Reactive Oxygen Species. Cells 2022, 11, 1266. [Google Scholar] [CrossRef]
- Chhunchha, B.; Kubo, E.; Fatma, N.; Singh, D.P. Sumoylation-deficient Prdx6 gains protective function by amplifying enzymatic activity and stability and escapes oxidative stress-induced aberrant Sumoylation. Cell Death Dis. 2017, 8, e2525. [Google Scholar] [CrossRef]
- Fatma, N.; Singh, P.; Chhunchha, B.; Kubo, E.; Shinohara, T.; Bhargavan, B.; Singh, D.P. Deficiency of Prdx6 in lens epithelial cells induces ER stress response-mediated impaired homeostasis and apoptosis. Am. J. Physiol. Cell. Physiol. 2011, 301, C954–C967. [Google Scholar] [CrossRef]
- Chhunchha, B.; Fatma, N.; Bhargavan, B.; Kubo, E.; Kumar, A.; Singh, D.P. Specificity protein, Sp1-mediated increased expression of Prdx6 as a curcumin-induced antioxidant defense in lens epithelial cells against oxidative stress. Cell Death Dis. 2011, 2, e234. [Google Scholar] [CrossRef]
- Chhunchha, B.; Kubo, E.; Kompella, U.B.; Singh, D.P. Engineered Sumoylation-Deficient Prdx6 Mutant Protein-Loaded Nanoparticles Provide Increased Cellular Defense and Prevent Lens Opacity. Antioxidants 2021, 10, 1245. [Google Scholar] [CrossRef]
- Alam, M.M.; Okazaki, K.; Nguyen, L.T.T.; Ota, N.; Kitamura, H.; Murakami, S.; Shima, H.; Igarashi, K.; Sekine, H.; Motohashi, H. Glucocorticoid receptor signaling represses the antioxidant response by inhibiting histone acetylation mediated by the transcriptional activator NRF2. J. Biol. Chem. 2017, 292, 7519–7530. [Google Scholar] [CrossRef]
- Fatma, N.; Singh, D.P.; Shinohara, T.; Chylack, L.T., Jr. Transcriptional regulation of the antioxidant protein 2 gene, a thiol-specific antioxidant, by lens epithelium-derived growth factor to protect cells from oxidative stress. J. Biol. Chem. 2001, 276, 48899–48907. [Google Scholar] [CrossRef]
- Chhunchha, B.; Kubo, E.; Singh, D.P. Sulforaphane-Induced Klf9/Prdx6 Axis Acts as a Molecular Switch to Control Redox Signaling and Determines Fate of Cells. Cells 2019, 8, 1159. [Google Scholar] [CrossRef]
- Gautam, N.; Roy, U.; Balkundi, S.; Puligujja, P.; Guo, D.; Smith, N.; Liu, X.M.; Lamberty, B.; Morsey, B.; Fox, H.S.; et al. Preclinical pharmacokinetics and tissue distribution of long-acting nanoformulated antiretroviral therapy. Antimicrob. Agents Chemother. 2013, 57, 3110–3120. [Google Scholar] [CrossRef]
- Huang, J.; Gautam, N.; Bathena, S.P.; Roy, U.; McMillan, J.; Gendelman, H.E.; Alnouti, Y. UPLC-MS/MS quantification of nanoformulated ritonavir, indinavir, atazanavir, and efavirenz in mouse serum and tissues. J. Chromatogr. B Analyt. Technol. Biomed. Life Sci. 2011, 879, 2332–2338. [Google Scholar] [CrossRef][Green Version]
- Soliman, G.A.; Shukla, S.K.; Etekpo, A.; Gunda, V.; Steenson, S.M.; Gautam, N.; Alnouti, Y.; Singh, P.K. The Synergistic Effect of an ATP-Competitive Inhibitor of mTOR and Metformin on Pancreatic Tumor Growth. Curr. Dev. Nutr. 2020, 4, nzaa131. [Google Scholar] [CrossRef]
- Kubo, E.; Miyazawa, T.; Fatma, N.; Akagi, Y.; Singh, D.P. Development- and age-associated expression pattern of peroxiredoxin 6, and its regulation in murine ocular lens. Mech. Ageing Dev. 2006, 127, 249–256. [Google Scholar] [CrossRef]
- Tatone, C.; Carbone, M.C.; Falone, S.; Aimola, P.; Giardinelli, A.; Caserta, D.; Marci, R.; Pandolfi, A.; Ragnelli, A.M.; Amicarelli, F. Age-dependent changes in the expression of superoxide dismutases and catalase are associated with ultrastructural modifications in human granulosa cells. Mol. Hum. Reprod. 2006, 12, 655–660. [Google Scholar] [CrossRef]
- Wu, C.; Qiu, S.; Zhu, X.; Lin, H.; Li, L. OCT1-Mediated Metformin Uptake Regulates Pancreatic Stellate Cell Activity. Cell Physiol. Biochem. 2018, 47, 1711–1720. [Google Scholar] [CrossRef]
- Kawoosa, F.; Shah, Z.A.; Masoodi, S.R.; Amin, A.; Rasool, R.; Fazili, K.M.; Dar, A.H.; Lone, A.; Ul Bashir, S. Role of human organic cation transporter-1 (OCT-1/SLC22A1) in modulating the response to metformin in patients with type 2 diabetes. BMC Endocr. Disord. 2022, 22, 140. [Google Scholar] [CrossRef] [PubMed]
- Shikata, E.; Yamamoto, R.; Takane, H.; Shigemasa, C.; Ikeda, T.; Otsubo, K.; Ieiri, I. Human organic cation transporter (OCT1 and OCT2) gene polymorphisms and therapeutic effects of metformin. J. Hum. Genet. 2007, 52, 117–122. [Google Scholar] [CrossRef] [PubMed]
- Higgins, J.W.; Bedwell, D.W.; Zamek-Gliszczynski, M.J. Ablation of both organic cation transporter (OCT)1 and OCT2 alters metformin pharmacokinetics but has no effect on tissue drug exposure and pharmacodynamics. Drug Metab. Dispos. 2012, 40, 1170–1177. [Google Scholar] [CrossRef] [PubMed]
- Kwon, E.Y.; Chung, J.Y.; Park, H.J.; Kim, B.M.; Kim, M.; Choi, J.H. OCT3 promoter haplotype is associated with metformin pharmacokinetics in Koreans. Sci. Rep. 2018, 8, 16965. [Google Scholar] [CrossRef]
- Zhou, G.; Myers, R.; Li, Y.; Chen, Y.; Shen, X.; Fenyk-Melody, J.; Wu, M.; Ventre, J.; Doebber, T.; Fujii, N.; et al. Role of AMP-activated protein kinase in mechanism of metformin action. J. Clin. Investig. 2001, 108, 1167–1174. [Google Scholar] [CrossRef]
- Yang, L.; Li, X.; Jiang, A.; Li, X.; Chang, W.; Chen, J.; Ye, F. Metformin alleviates lead-induced mitochondrial fragmentation via AMPK/Nrf2 activation in SH-SY5Y cells. Redox Biol. 2020, 36, 101626. [Google Scholar] [CrossRef]
- Fang, J.; Yang, J.; Wu, X.; Zhang, G.; Li, T.; Wang, X.; Zhang, H.; Wang, C.C.; Liu, G.H.; Wang, L. Metformin alleviates human cellular aging by upregulating the endoplasmic reticulum glutathione peroxidase 7. Aging Cell 2018, 17, e12765. [Google Scholar] [CrossRef]
- Chen, S.; Gan, D.; Lin, S.; Zhong, Y.; Chen, M.; Zou, X.; Shao, Z.; Xiao, G. Metformin in aging and aging-related diseases: Clinical applications and relevant mechanisms. Theranostics 2022, 12, 2722–2740. [Google Scholar] [CrossRef]
- Rena, G.; Hardie, D.G.; Pearson, E.R. The mechanisms of action of metformin. Diabetologia 2017, 60, 1577–1585. [Google Scholar] [CrossRef]
- Stein, B.D.; Calzolari, D.; Hellberg, K.; Hu, Y.S.; He, L.; Hung, C.M.; Toyama, E.Q.; Ross, D.S.; Lillemeier, B.F.; Cantley, L.C.; et al. Quantitative In Vivo Proteomics of Metformin Response in Liver Reveals AMPK-Dependent and -Independent Signaling Networks. Cell Rep. 2019, 29, 3331–3348.e3337. [Google Scholar] [CrossRef]
- Kaneto, H.; Kimura, T.; Obata, A.; Shimoda, M.; Kaku, K. Multifaceted Mechanisms of Action of Metformin Which Have Been Unraveled One after Another in the Long History. Int. J. Mol. Sci. 2021, 22, 2596. [Google Scholar] [CrossRef]
- Barnea, M.; Haviv, L.; Gutman, R.; Chapnik, N.; Madar, Z.; Froy, O. Metformin affects the circadian clock and metabolic rhythms in a tissue-specific manner. Biochim. Biophys. Acta 2012, 1822, 1796–1806. [Google Scholar] [CrossRef]
- Marycz, K.; Tomaszewski, K.A.; Kornicka, K.; Henry, B.M.; Wronski, S.; Tarasiuk, J.; Maredziak, M. Metformin Decreases Reactive Oxygen Species, Enhances Osteogenic Properties of Adipose-Derived Multipotent Mesenchymal Stem Cells In Vitro, and Increases Bone Density In Vivo. Oxid. Med. Cell Longev. 2016, 2016, 9785890. [Google Scholar] [CrossRef]
- Smieszek, A.; Strek, Z.; Kornicka, K.; Grzesiak, J.; Weiss, C.; Marycz, K. Antioxidant and Anti-Senescence Effect of Metformin on Mouse Olfactory Ensheathing Cells (mOECs) May Be Associated with Increased Brain-Derived Neurotrophic Factor Levels-An Ex Vivo Study. Int. J. Mol. Sci. 2017, 18, 872. [Google Scholar] [CrossRef] [PubMed]
- Hu, D.; Xie, F.; Xiao, Y.; Lu, C.; Zhong, J.; Huang, D.; Chen, J.; Wei, J.; Jiang, Y.; Zhong, T. Metformin: A Potential Candidate for Targeting Aging Mechanisms. Aging Dis. 2021, 12, 480–493. [Google Scholar] [CrossRef]
- Chen, M.; Zhang, C.; Zhou, N.; Wang, X.; Su, D.; Qi, Y. Metformin alleviates oxidative stress-induced senescence of human lens epithelial cells via AMPK activation and autophagic flux restoration. J. Cell. Mol. Med. 2021, 25, 8376–8389. [Google Scholar] [CrossRef] [PubMed]
- Chen, Q.; Thompson, J.; Hu, Y.; Das, A.; Lesnefsky, E.J. Metformin attenuates ER stress-induced mitochondrial dysfunction. Transl. Res. 2017, 190, 40–50. [Google Scholar] [CrossRef] [PubMed]
- Shibata, S.; Shibata, N.; Shibata, T.; Sasaki, H.; Singh, D.P.; Kubo, E. The role of Prdx6 in the protection of cells of the crystalline lens from oxidative stress induced by UV exposure. Jpn. J. Ophthalmol. 2016, 60, 408–418. [Google Scholar] [CrossRef] [PubMed]
- Schieber, M.; Chandel, N.S. ROS function in redox signaling and oxidative stress. Curr. Biol. 2014, 24, R453–R462. [Google Scholar] [CrossRef]
- Sykiotis, G.P.; Bohmann, D. Stress-activated cap’n’collar transcription factors in aging and human disease. Sci. Signal. 2010, 3, re3. [Google Scholar] [CrossRef]
- Dai, D.F.; Chiao, Y.A.; Marcinek, D.J.; Szeto, H.H.; Rabinovitch, P.S. Mitochondrial oxidative stress in aging and healthspan. Longev. Healthspan 2014, 3, 6. [Google Scholar] [CrossRef]
- Poprac, P.; Jomova, K.; Simunkova, M.; Kollar, V.; Rhodes, C.J.; Valko, M. Targeting Free Radicals in Oxidative Stress-Related Human Diseases. Trends Pharmacol. Sci. 2017, 38, 592–607. [Google Scholar] [CrossRef]
- Laurent, G.; Solari, F.; Mateescu, B.; Karaca, M.; Castel, J.; Bourachot, B.; Magnan, C.; Billaud, M.; Mechta-Grigoriou, F. Oxidative stress contributes to aging by enhancing pancreatic angiogenesis and insulin signaling. Cell Metab. 2008, 7, 113–124. [Google Scholar] [CrossRef][Green Version]
- Motohashi, H.; Yamamoto, M. Nrf2-Keap1 defines a physiologically important stress response mechanism. Trends Mol. Med. 2004, 10, 549–557. [Google Scholar] [CrossRef]
- Suzuki, T.; Yamamoto, M. Molecular basis of the Keap1-Nrf2 system. Free Radic. Biol. Med. 2015, 88 Pt B, 93–100. [Google Scholar] [CrossRef]
- O’Connell, M.A.; Hayes, J.D. The Keap1/Nrf2 pathway in health and disease: From the bench to the clinic. Biochem. Soc. Trans. 2015, 43, 687–689. [Google Scholar] [CrossRef]
- Schmidlin, C.J.; Dodson, M.B.; Madhavan, L.; Zhang, D.D. Redox regulation by NRF2 in aging and disease. Free Radic. Biol. Med. 2019, 134, 702–707. [Google Scholar] [CrossRef]
- McCormick, M.A.; Promislow, D.E.L. Recent Advances in the Systems Biology of Aging. Antioxid. Redox Signal. 2018, 29, 973–984. [Google Scholar] [CrossRef]
- Stangherlin, A.; Reddy, A.B. Regulation of circadian clocks by redox homeostasis. J. Biol. Chem. 2013, 288, 26505–26511. [Google Scholar] [CrossRef]
- Zhang, H.; Liu, H.; Davies, K.J.; Sioutas, C.; Finch, C.E.; Morgan, T.E.; Forman, H.J. Nrf2-regulated phase II enzymes are induced by chronic ambient nanoparticle exposure in young mice with age-related impairments. Free Radic. Biol. Med. 2012, 52, 2038–2046. [Google Scholar] [CrossRef]
- Moiseeva, O.; Deschenes-Simard, X.; St-Germain, E.; Igelmann, S.; Huot, G.; Cadar, A.E.; Bourdeau, V.; Pollak, M.N.; Ferbeyre, G. Metformin inhibits the senescence-associated secretory phenotype by interfering with IKK/NF-kappaB activation. Aging Cell 2013, 12, 489–498. [Google Scholar] [CrossRef]
- Kubben, N.; Zhang, W.; Wang, L.; Voss, T.C.; Yang, J.; Qu, J.; Liu, G.H.; Misteli, T. Repression of the Antioxidant NRF2 Pathway in Premature Aging. Cell 2016, 165, 1361–1374. [Google Scholar] [CrossRef]
- Fulop, G.A.; Kiss, T.; Tarantini, S.; Balasubramanian, P.; Yabluchanskiy, A.; Farkas, E.; Bari, F.; Ungvari, Z.; Csiszar, A. Nrf2 deficiency in aged mice exacerbates cellular senescence promoting cerebrovascular inflammation. Geroscience 2018, 40, 513–521. [Google Scholar] [CrossRef]
- Ungvari, Z.; Bailey-Downs, L.; Gautam, T.; Sosnowska, D.; Wang, M.; Monticone, R.E.; Telljohann, R.; Pinto, J.T.; de Cabo, R.; Sonntag, W.E.; et al. Age-associated vascular oxidative stress, Nrf2 dysfunction, and NF-{kappa}B activation in the nonhuman primate Macaca mulatta. J. Gerontol. A Biol. Sci. Med. Sci. 2011, 66, 866–875. [Google Scholar] [CrossRef] [PubMed]
- Shenvi, S.V.; Smith, E.; Hagen, T.M. Identification of age-specific Nrf2 binding to a novel antioxidant response element locus in the Gclc promoter: A compensatory means for the loss of glutathione synthetic capacity in the aging rat liver? Aging Cell 2012, 11, 297–304. [Google Scholar] [CrossRef] [PubMed]
- Suh, J.H.; Shenvi, S.V.; Dixon, B.M.; Liu, H.; Jaiswal, A.K.; Liu, R.M.; Hagen, T.M. Decline in transcriptional activity of Nrf2 causes age-related loss of glutathione synthesis, which is reversible with lipoic acid. Proc. Natl. Acad. Sci. USA 2004, 101, 3381–3386. [Google Scholar] [CrossRef] [PubMed]
- Soukas, A.A.; Hao, H.; Wu, L. Metformin as Anti-Aging Therapy: Is It for Everyone? Trends Endocrinol. Metab. 2019, 30, 745–755. [Google Scholar] [CrossRef]
- Wu, L.; Cen, Y.; Feng, M.; Zhou, Y.; Tang, H.; Liao, X.; Wang, Y.; Wang, M.; Zhou, M. Metformin Activates the Protective Effects of the AMPK Pathway in Acute Lung Injury Caused by Paraquat Poisoning. Oxid. Med. Cell. Longev. 2019, 2019, 1709718. [Google Scholar] [CrossRef]
- Anisimov, V.N.; Berstein, L.M.; Egormin, P.A.; Piskunova, T.S.; Popovich, I.G.; Zabezhinski, M.A.; Tyndyk, M.L.; Yurova, M.V.; Kovalenko, I.G.; Poroshina, T.E.; et al. Metformin slows down aging and extends life span of female SHR mice. Cell Cycle 2008, 7, 2769–2773. [Google Scholar] [CrossRef]
- Chen, D.; Xia, D.; Pan, Z.; Xu, D.; Zhou, Y.; Wu, Y.; Cai, N.; Tang, Q.; Wang, C.; Yan, M.; et al. Metformin protects against apoptosis and senescence in nucleus pulposus cells and ameliorates disc degeneration in vivo. Cell Death Dis. 2016, 7, e2441. [Google Scholar] [CrossRef]
- Nirmal, J.; Singh, S.B.; Biswas, N.R.; Thavaraj, V.; Azad, R.V.; Velpandian, T. Potential pharmacokinetic role of organic cation transporters in modulating the transcorneal penetration of its substrates administered topically. Eye 2013, 27, 1196–1203. [Google Scholar] [CrossRef]
- Viollet, B.; Guigas, B.; Sanz Garcia, N.; Leclerc, J.; Foretz, M.; Andreelli, F. Cellular and molecular mechanisms of metformin: An overview. Clin. Sci. 2012, 122, 253–270. [Google Scholar] [CrossRef]
- Checkley, L.A.; Rudolph, M.C.; Wellberg, E.A.; Giles, E.D.; Wahdan-Alaswad, R.S.; Houck, J.A.; Edgerton, S.M.; Thor, A.D.; Schedin, P.; Anderson, S.M.; et al. Metformin Accumulation Correlates with Organic Cation Transporter 2 Protein Expression and Predicts Mammary Tumor Regression In Vivo. Cancer Prev. Res. 2017, 10, 198–207. [Google Scholar] [CrossRef]
- Aoki, M.; Terada, T.; Kajiwara, M.; Ogasawara, K.; Ikai, I.; Ogawa, O.; Katsura, T.; Inui, K. Kidney-specific expression of human organic cation transporter 2 (OCT2/SLC22A2) is regulated by DNA methylation. Am. J. Physiol. Renal Physiol. 2008, 295, F165–F170. [Google Scholar] [CrossRef]
- Chen, L.; Hong, C.; Chen, E.C.; Yee, S.W.; Xu, L.; Almof, E.U.; Wen, C.; Fujii, K.; Johns, S.J.; Stryke, D.; et al. Genetic and epigenetic regulation of the organic cation transporter 3, SLC22A3. Pharmacogenomics J. 2013, 13, 110–120. [Google Scholar] [CrossRef]
- Kajiwara, M.; Terada, T.; Asaka, J.; Aoki, M.; Katsura, T.; Ikai, I.; Inui, K. Regulation of basal core promoter activity of human organic cation transporter 1 (OCT1/SLC22A1). Am. J. Physiol. Gastrointest. Liver Physiol. 2008, 295, G1211–G1216. [Google Scholar] [CrossRef]
- Konig, J.; Muller, F.; Fromm, M.F. Transporters and drug-drug interactions: Important determinants of drug disposition and effects. Pharmacol. Rev. 2013, 65, 944–966. [Google Scholar] [CrossRef]
- Kimura, N.; Masuda, S.; Tanihara, Y.; Ueo, H.; Okuda, M.; Katsura, T.; Inui, K. Metformin is a superior substrate for renal organic cation transporter OCT2 rather than hepatic OCT1. Drug Metab. Pharmacokinet. 2005, 20, 379–386. [Google Scholar] [CrossRef]
- Kimura, N.; Okuda, M.; Inui, K. Metformin transport by renal basolateral organic cation transporter hOCT2. Pharm. Res. 2005, 22, 255–259. [Google Scholar] [CrossRef]
- Ashabi, G.; Khalaj, L.; Khodagholi, F.; Goudarzvand, M.; Sarkaki, A. Pre-treatment with metformin activates Nrf2 antioxidant pathways and inhibits inflammatory responses through induction of AMPK after transient global cerebral ischemia. Metab. Brain Dis. 2015, 30, 747–754. [Google Scholar] [CrossRef]
- Sarkaki, A.; Farbood, Y.; Badavi, M.; Khalaj, L.; Khodagholi, F.; Ashabi, G. Metformin improves anxiety-like behaviors through AMPK-dependent regulation of autophagy following transient forebrain ischemia. Metab. Brain Dis. 2015, 30, 1139–1150. [Google Scholar] [CrossRef]
- Barnea, M.; Cohen-Yogev, T.; Chapnik, N.; Madar, Z.; Froy, O. Effect of metformin and lipid emulsion on the circadian gene expression in muscle cells. Int. J. Biochem. Cell Biol. 2014, 53, 151–161. [Google Scholar] [CrossRef]
- Foretz, M.; Guigas, B.; Bertrand, L.; Pollak, M.; Viollet, B. Metformin: From mechanisms of action to therapies. Cell Metab. 2014, 20, 953–966. [Google Scholar] [CrossRef]
- Hawley, S.A.; Ross, F.A.; Chevtzoff, C.; Green, K.A.; Evans, A.; Fogarty, S.; Towler, M.C.; Brown, L.J.; Ogunbayo, O.A.; Evans, A.M.; et al. Use of cells expressing gamma subunit variants to identify diverse mechanisms of AMPK activation. Cell Metab. 2010, 11, 554–565. [Google Scholar] [CrossRef]
- Caton, P.W.; Kieswich, J.; Yaqoob, M.M.; Holness, M.J.; Sugden, M.C. Metformin opposes impaired AMPK and SIRT1 function and deleterious changes in core clock protein expression in white adipose tissue of genetically-obese db/db mice. Diabetes Obes. Metab. 2011, 13, 1097–1104. [Google Scholar] [CrossRef]
- Lewis, A.J.; Miller, J.J.; McCallum, C.; Rider, O.J.; Neubauer, S.; Heather, L.C.; Tyler, D.J. Assessment of Metformin-Induced Changes in Cardiac and Hepatic Redox State Using Hyperpolarized[1-13C]Pyruvate. Diabetes 2016, 65, 3544–3551. [Google Scholar] [CrossRef]
- Madiraju, A.K.; Erion, D.M.; Rahimi, Y.; Zhang, X.M.; Braddock, D.T.; Albright, R.A.; Prigaro, B.J.; Wood, J.L.; Bhanot, S.; MacDonald, M.J.; et al. Metformin suppresses gluconeogenesis by inhibiting mitochondrial glycerophosphate dehydrogenase. Nature 2014, 510, 542–546. [Google Scholar] [CrossRef]
- Madiraju, A.K.; Qiu, Y.; Perry, R.J.; Rahimi, Y.; Zhang, X.M.; Zhang, D.; Camporez, J.G.; Cline, G.W.; Butrico, G.M.; Kemp, B.E.; et al. Metformin inhibits gluconeogenesis via a redox-dependent mechanism in vivo. Nat. Med. 2018, 24, 1384–1394. [Google Scholar] [CrossRef]
- Xiao, H.; Zhang, J.; Xu, Z.; Feng, Y.; Zhang, M.; Liu, J.; Chen, R.; Shen, J.; Wu, J.; Lu, Z.; et al. Metformin is a novel suppressor for transforming growth factor (TGF)-beta1. Sci. Rep. 2016, 6, 28597. [Google Scholar] [CrossRef]
- Moiseeva, O.; Deschenes-Simard, X.; Pollak, M.; Ferbeyre, G. Metformin, aging and cancer. Aging 2013, 5, 330–331. [Google Scholar] [CrossRef]
- De Haes, W.; Frooninckx, L.; Van Assche, R.; Smolders, A.; Depuydt, G.; Billen, J.; Braeckman, B.P.; Schoofs, L.; Temmerman, L. Metformin promotes lifespan through mitohormesis via the peroxiredoxin PRDX-2. Proc. Natl. Acad. Sci. USA 2014, 111, E2501–E2509. [Google Scholar] [CrossRef]
- Neven, E.; Vervaet, B.; Brand, K.; Gottwald-Hostalek, U.; Opdebeeck, B.; De Mare, A.; Verhulst, A.; Lalau, J.D.; Kamel, S.; De Broe, M.E.; et al. Metformin prevents the development of severe chronic kidney disease and its associated mineral and bone disorder. Kidney Int. 2018, 94, 102–113. [Google Scholar] [CrossRef] [PubMed]
- Bharath, L.P.; Agrawal, M.; McCambridge, G.; Nicholas, D.A.; Hasturk, H.; Liu, J.; Jiang, K.; Liu, R.; Guo, Z.; Deeney, J.; et al. Metformin Enhances Autophagy and Normalizes Mitochondrial Function to Alleviate Aging-Associated Inflammation. Cell Metab. 2020, 32, 44–55.e46. [Google Scholar] [CrossRef] [PubMed]


| Gene | Forward Primer (5′ to 3′) | Reverse Primer (5′ to 3′) |
|---|---|---|
| mBmal1 | TTTGGGCTAGCTGTGGATAG | AAATATCCACATGGGGGACT |
| mNrf2 | TCTCCTCGCTGGAAAAAGAA | AATGTGCTGGCTGTGCTTTA |
| mPrdx6 | TTCAATAGACAGTGTTGAGGATCA | CGTGGGTGTTTCACCATTG |
| mGPx1 | GTTCTCGGCTTCCCTTGC | GCTGTTCAGGATCTCCTCGT |
| mSOD1 | CAGGACCTCATTTTAATCCTCAC | TGCCCAGGTCTCCAACAT |
| mGSTπ | TGTCACCCTCATCTACACCAAC | GGACAGCAGGGTCTCAAAAG |
| mCatalase | CCTTCAAGTTGGTTAATGCAGA | CAAGTTTTTGATGCCCTGGT |
| mHO1 | AGGCTAAGACCGCCTTCCT | TGTGTTCCTCTGTCAGCATCA |
| mNQO1 | AGCGTTCGGTATTACGATCC | AGTACAATCAGGGCTCTTCTCG |
| mGCLC | AGATGATAGAACACGGGAGGAG | TGATCCTAAAGCGATTGTTCTTC |
| mGCLM | TGACTCACAATGACCCGAAA | TCAATGTCAGGGATGCTTTCT |
| mOCT1 | TAGCGGCATCAAATCTGGTGGC | CATCTGCAACACAATGGTGGCTC |
| mOCT2 | CGGAGTCTCCAAGATGGTTGATC | CCAGTATCCTCATCTGCCGTCA |
| mOCT3 | CAGCAATGCCTGGATGTTGGAC | TCCTGTGATGCCAACGCCGAAA |
| mβ-actin | CTAAGGCCAACCGTGAAAAG | ACCAGAGGCATACAGGGACA |
| hOCT1 | CACCCCCTTCATAGTCTTCAG | GCCCAACACCGCAAACAAAAT |
| hOCT2 | GAGATAGTCTGCCTGGTCAATGC | GTAGACCAGGAATGGCGTGATG |
| hOCT3 | CCTTGTCTGTGTCAATGCGTGG | CCAACACCAAGGCAGGATAGCA |
| hBmal1 | GGAAAAATAGGCCGAATGAT | TGAGCCTGGCCTGATAGTAG |
| hNrf2 | TGCTTTATAGCGTGCAAACCTCGC | ATCCATGTCCCTTGACAGCACAGA |
| hPrdx6 | GCATCCGTTTCCACGACT | TGCACACTGGGGTAAAGTCC |
| hCatalase | CCATCGCAGTTCGGTTCT | GGGTCCCGAACTGTGTCA |
| hSOD1 | TCATCAATTTCGAGCAGAAGG | CAGGCCTTCAGTCAGTCCTTT |
| hβ-actin | CCAACCGCGAGAAGATGA | CCAGAGGCGTACAGGGATAG |
Publisher’s Note: MDPI stays neutral with regard to jurisdictional claims in published maps and institutional affiliations. |
© 2022 by the authors. Licensee MDPI, Basel, Switzerland. This article is an open access article distributed under the terms and conditions of the Creative Commons Attribution (CC BY) license (https://creativecommons.org/licenses/by/4.0/).
Share and Cite
Chhunchha, B.; Kubo, E.; Singh, D.P. Obligatory Role of AMPK Activation and Antioxidant Defense Pathway in the Regulatory Effects of Metformin on Cellular Protection and Prevention of Lens Opacity. Cells 2022, 11, 3021. https://doi.org/10.3390/cells11193021
Chhunchha B, Kubo E, Singh DP. Obligatory Role of AMPK Activation and Antioxidant Defense Pathway in the Regulatory Effects of Metformin on Cellular Protection and Prevention of Lens Opacity. Cells. 2022; 11(19):3021. https://doi.org/10.3390/cells11193021
Chicago/Turabian StyleChhunchha, Bhavana, Eri Kubo, and Dhirendra P. Singh. 2022. "Obligatory Role of AMPK Activation and Antioxidant Defense Pathway in the Regulatory Effects of Metformin on Cellular Protection and Prevention of Lens Opacity" Cells 11, no. 19: 3021. https://doi.org/10.3390/cells11193021
APA StyleChhunchha, B., Kubo, E., & Singh, D. P. (2022). Obligatory Role of AMPK Activation and Antioxidant Defense Pathway in the Regulatory Effects of Metformin on Cellular Protection and Prevention of Lens Opacity. Cells, 11(19), 3021. https://doi.org/10.3390/cells11193021