

Tracing Translational Footprint by Ribo-Seq: Principle, Workflow, and Applications to Understand the Mechanism of Human Diseases
Abstract
1. Introduction
2. Principles of Ribosome Profiling and Technical Workflow
- (1)
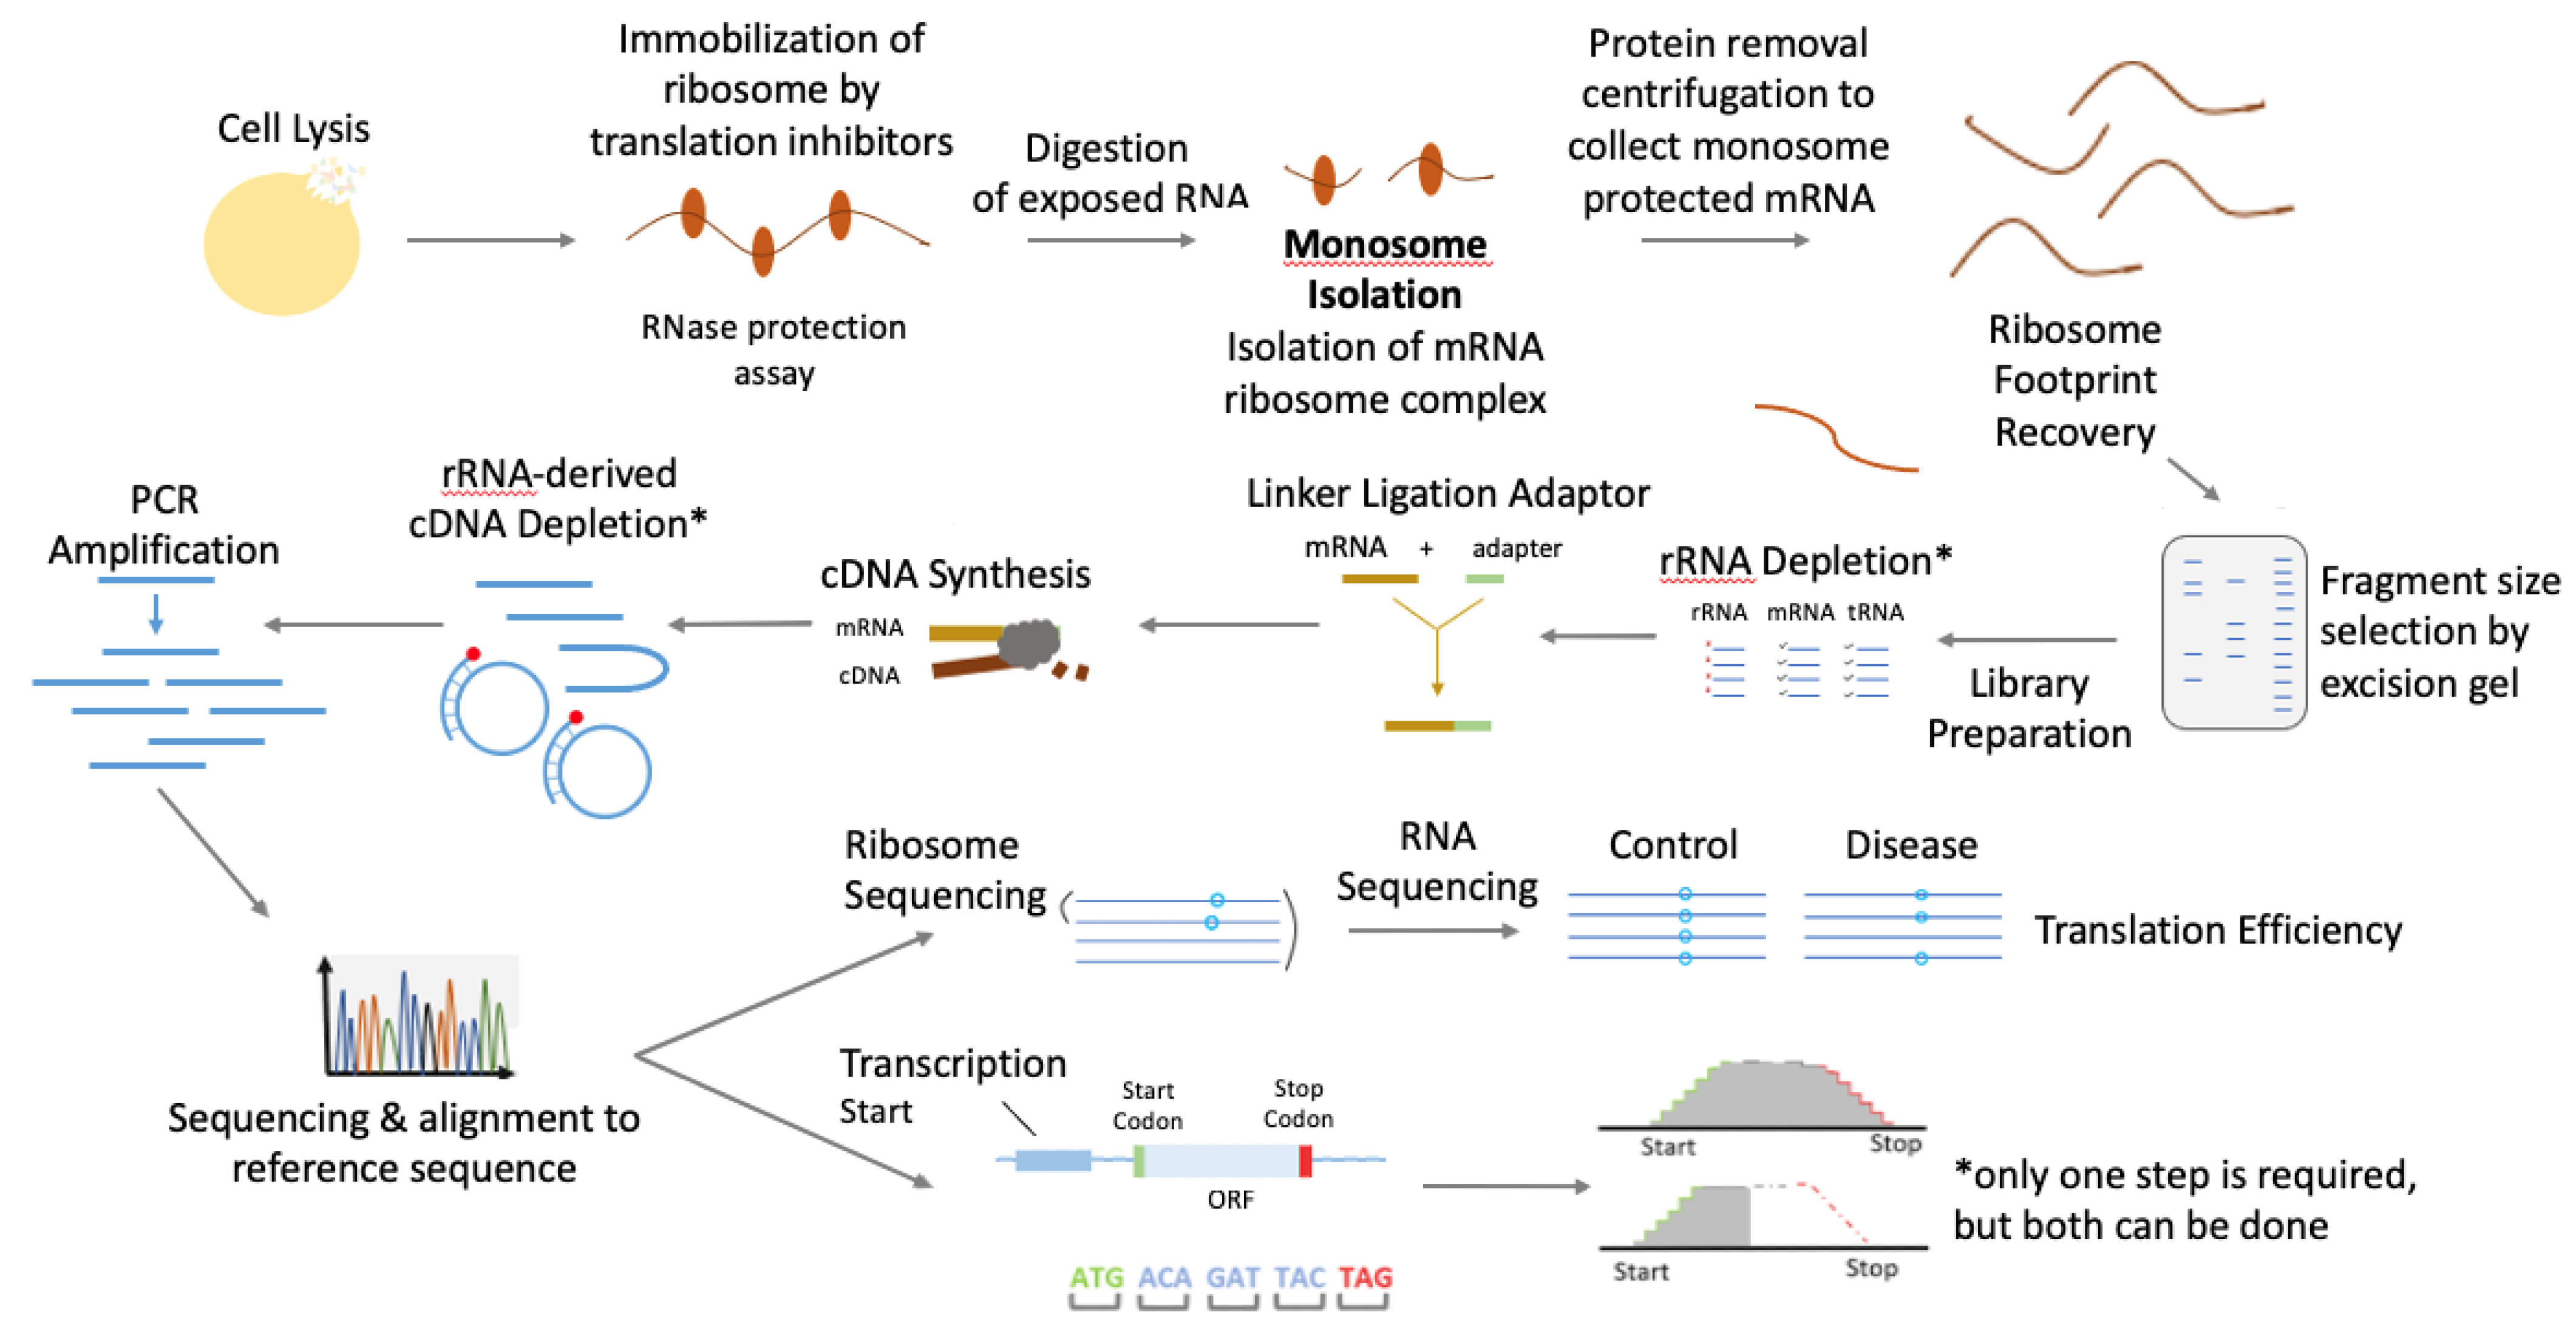
- Freezing ribosomes on mRNAs to avoid ribosome run-off: After culturing the cells, they are treated with translation inhibitors [6]. Even though there are a wide variety of translation inhibitors (such as ribosome-targeting initiation, elongation, and termination inhibitors; inhibitors of initiation and elongation factors; and the inhibitors of cell signaling pathways involved in translational control), arguably the most commonly used for ribosomal footprinting are the classical elongation inhibitors, such as cycloheximide, anisomycin, emetine [7]. These inhibitors, however, have to be used with caution, considering their potential artifact effects in ribosomal distribution, which are specific to cell/organism type, cell growth conditions, and the contents of lysis buffer [8]. For instance, treatment with cycloheximide results in a larger ribosomal distribution at the 5′ coding end of the transcript. The effect is more pronounced in S. Cerevisiae and in shorter transcripts [6,7,8]. Alternatively, if the goal is to specifically inhibit ribosomes at their initiation sites, inhibitors specific to de novo initiation ribosomes are used: harringtonine and lactimidomycin are examples of inhibitors with such activity [6,7]. In light of potential challenges associated with the use of translation inhibitors, in situ detergent lysis of cells is advised where applicable [6]. Flash-freezing and cryogenic pulverization may be suitable for specific cell and tissue types (mainly animal cells and tissues) [2,6,8].
- (2)
- Ribonuclease digestion breaks down unprotected regions of mRNA: Ribonucleases are responsible for the breaking down and degradation of exposed mRNA, except for ribosome-protected fragments (RPFs). The precision of this step is dependent on buffer conditions, where a lower concentration of sodium (150–200 mM) and magnesium (5mM-10mM) is preferred for optimally uniform digestion by the nuclease [6].
- (3)
- mRNA–ribosome complex recovery and RNA purification: After ribonuclease digestion, the mRNA–ribosome footprint complexes are recovered using sucrose density fractionation or sedimentation through a sucrose cushion [6]. Alternatively, mRNA–ribosome complexes can be retrieved by gel filtration [9] or affinity purification with the use of an epitope tag added to the ribosomes, which is essential in profiling specific cell types [10,11]. The resultant ribosomal pellet is resuspended in Trizol/Qiazol reagent, and the protected RNA fragments are then purified using a spin column, such as miRNeasy kit [6]. Subsequently, the isolated RNA is separated by polyacrylamide gel electrophoresis to isolate the RNA fragments of 26–34 nt length corresponding to the RPFs.
- (4)
- Library generation and deep sequencing: Following RPF purification, it is essential to deplete the sample of rRNA. Ribosomal RNA is the most predominant RNA, making up about 80% of cellular RNA in the cell, and its removal is essential because the abundance of rRNA leads to fewer RPFs being sequenced and fewer mapping reads. This, as a result, reduces the useful size of the library. rRNA can be depleted using kits, such as Ribo-zero Plus or Legacy Ribo-zero (Illumina, San-Diego, C), which use anti-rRNA DNA probes with subsequent removal of rRNA by enzymatic digestion (RNase H) or by streptavidin affinity pull-down assay. When RPFs are depleted of rRNA, the fragments need to be ligated or fused to adapters [6]. RPFs can be tailed with a poly-A polymerase, or else a single-stranded RNA linker of a known sequence can be ligated to the 3′-end of the RPF [12]. The RNA fragments are then converted into complementary DNA by the enzyme reverse transcriptase. The cDNA later serves as a template for exponential amplification using PCR. This library can then be sequenced to generate a bioinformatics library containing RPF sequenced reads [2,13]. As an alternative strategy, rRNA depletion can be carried out after the reverse-transcription-step cDNA is circularized. The rRNA subtraction oligos (biotinylated sense-strand oligonucleotides against rRNA-derived cDNA) are added. rRNA-derived cDNA fragments are removed using a streptavidin affinity assay. The remaining cDNA fragments represent the non-rRNA RPFs, which are further PCR-amplified and sequenced [6]. Mapping these sequenced RPFs to the transcriptome provides a snapshot of translation that reveals transcriptome wide the positions and densities of ribosomes on individual mRNAs.
- (5)
- Data analysis: The upstream steps of Ribo-seq analysis are similar to the standard RNA-seq data analysis workflow [14], including read mapping to transcripts. The downstream Ribo-seq data analysis includes calculating transcript translational efficiency when the data are paired with RNA-seq, identifying differentially translated transcripts, de novo identifying transcript open reading frame (ORF), and detecting potential translational pausing events [6].
3. Ribo-Seq Provides a More Accurate and Closer View of Protein Expression than RNA-Seq
4. Using Ribo-Seq to Estimate Protein Abundance
5. Computational Methods and Tools to Analyze Ribo-Seq Data
- (a)
- Identifying ribosomal A and P sites on ribosome-protected mRNA fragments: Ribosomes have three sites (A, P, and E) where tRNAs can bind to an mRNA. The A site accepts an incoming tRNA, and the P site holds a tRNA that carries a growing polypeptide. The E site is where a tRNA goes after it is empty. The A, P, and E sites are three nucleotides apart. For a ribosome-protected fragment, the information about where the A, P, and E sites are located is removed during the digestion step. Hence, identifying these sites within the ribosome footprint is fundamentally important for understanding translation at the codon scale. Multiple computational methods have been proposed to address such problems. The fundamental basis of these methods is based on the fact that only the P site is permitted to occupy the start codon during translation initiation, and only the A site is permitted to occupy the stop codon during termination. Therefore, the relative position of A and P sites in ribosome-protected fragments can be determined by Ribo-seq reads mapped at the start and stop codons [2,17]. One problem with these approaches is that RNase digestion is highly stochastic, and, thus, the ribosome-protected fragment length varies within the same Ribo-seq experiment. Hence, it is technically hard to determine A or P sites for a fragment library with a spectrum of fragment length. To solve this problem, a study utilized the fundamental biological fact that the A site on ribosome-protected fragments must reside within the CDS region to create a function that maximizes the number of fragments with the A site falling into the CDS region.
- (b)
- Data normalization to local ribosome profiling read density: The Ribo-seq read distribution on a mapped transcript reference is typically characterized as alignment gaps, sporadic high-density peaks due to technical artifacts, and ribosome pauses [18]. These fluctuations substantially generate challenges for downstream data analysis, limiting the ability to characterize factors influencing global ribosome read density accurately. Hence, data normalization for local ribosome read density is necessary before performing downstream analysis. The most intuitive approach is normalizing the local Ribo-seq signal by the average signal across the coding region [19]. These approaches are based on the assumption that the ribosome footprint is smoothly distributed to different codons. However, such approaches are very sensitive to high-density peaks (rare in RNA-seq but high frequency in Ribo-seq due to ribosome pausing) and performed poorly for transcripts of low ribosome read coverage. A simple but robust computational method (“RUST”) was proposed to reduce this local Ribo-seq read density bias to solve these problems. The RUST method converts ribosome footprint densities into a binary unit function (Heaviside step function). Each codon is given a score of 1 or 0 depending on whether the footprint density at this codon exceeds the average for the corresponding ORF.
6. Footprints and Translation Efficiency
7. Ribo-Seq Provides a Unique High-Throughput Method to Understand Disease Mechanisms at the Translational Level
8. Ribosome Collisions
9. Limitations and Potential Solutions
- (a)
- Estimation of global changes in translation: The standard Ribo-seq protocol only estimates the relative abundance of ribosome-bounded mRNAs but cannot quantify absolute global changes in translation. This is because, for a particular translated transcript, the sequencing reads from Ribo-seq depend on sequencing depth, open reading frame (ORF) length, and competition with other translated transcripts. After data normalization to control factors, such as read depth and ORF length, the number of mapped reads of a particular transcript will be primarily determined by the relative abundance. Hence, the information about the absolute abundance of transcripts is lost. A possible solution is to add spike-in before the sequencing sample preparation step. Spike-in mRNAs are synthetic nucleic-acid sequences added to the sequencing library. Since we know the spike-in concentration, the absolute abundance of each translated mRNA can be inferred by comparing transcript read counts with spike-in read counts. A study using this strategy can successfully quantify the absolute global change in translation [55].
- (b)
- Measuring translation in individual cells: The standard Ribo-seq protocol is designed for measuring translation at the bulk mRNA level (an ensemble of different cell types). Emerging single-cell RNA-seq (scRNA-seq) technology allows the investigation of the heterogeneity of individual cells. However, due to the amplification of a low amount of RNAs, scRNA-seq suffers a high dropout effect (certain RNAs are missed during amplification) due to technical problems. Moreover, a mixture of technical artifacts with actual biological variant cells makes this even more complicated [56]. Ribo-seq at the single-cell level is more technically challenging than RNA-seq. This is because (a) not all mRNAs are bounded by ribosomes, and (b) the extra pulling out ribosome-bounded RNAs may lose a certain number of mRNAs. Hence, the expected start material of single-cell Ribo-seq is lower than scRNA-seq. To solve this problem, a modified Ribo-seq protocol is needed. A recent study modified the existing Ribo-seq protocol to increase the sensitivity of the protocol, allowing for the profiling of Ribo-seq at the single-cell level [57].
Author Contributions
Funding
Informed Consent Statement
Data Availability Statement
Acknowledgments
Conflicts of Interest
References
- Vaklavas, C.; Blume, S.W.; Grizzle, W.E. Hallmarks and Determinants of Oncogenic Translation Revealed by Ribosome Profiling in Models of Breast Cancer. Transl. Oncol. 2020, 13, 452–470. [Google Scholar] [CrossRef]
- Ingolia, N.T.; Ghaemmaghami, S.; Newman, J.R.S.; Weissman, J.S. Genome-Wide Analysis In Vivo of Translation with Nucleotide Resolution Using Ribosome Profiling. Science 2009, 324, 218. [Google Scholar] [CrossRef]
- Diament, A.; Tuller, T. Estimation of Ribosome Profiling Performance and Reproducibility at Various Levels of Resolution. Biol. Direct 2016, 11, 24. [Google Scholar] [CrossRef]
- Zhu, Y.; Li, F.; Yang, X.; Xiao, Z.; Xiao, Z. De Novo Identification of Actively Translated Open Reading Frames with Ribosome Profiling Data. J. Vis. Exp. 2022, 2022, e63366. [Google Scholar] [CrossRef]
- Erhard, F.; Halenius, A.; Zimmermann, C.; L’Hernault, A.; Kowalewski, D.J.; Weekes, M.P.; Stevanovic, S.; Zimmer, R.; Dölken, L. Improved Ribo-Seq Enables Identification of Cryptic Translation Events. Nat. Methods 2018, 15, 363. [Google Scholar] [CrossRef]
- Ingolia, N.T.; Brar, G.A.; Rouskin, S.; McGeachy, A.M.; Weissman, J.S. The Ribosome Profiling Strategy for Monitoring Translation In Vivo by Deep Sequencing of Ribosome-Protected MRNA Fragments. Nat. Protoc. 2012, 7, 1534. [Google Scholar] [CrossRef]
- Dmitriev, S.E.; Vladimirov, D.O.; Lashkevich, K.A. A Quick Guide to Small-Molecule Inhibitors of Eukaryotic Protein Synthesis. Biochemistry 2020, 85, 1389–1421. [Google Scholar] [CrossRef]
- Duncan, C.D.S.; Mata, J. Effects of Cycloheximide on the Interpretation of Ribosome Profiling Experiments in Schizosaccharomyces Pombe. Sci. Rep. 2017, 7, 10331. [Google Scholar] [CrossRef]
- Jelenc, P.C. Rapid Purification of Highly Active Ribosomes from Escherichia coli. Anal. Biochem. 1980, 105, 369–374. [Google Scholar] [CrossRef]
- Heiman, M.; Schaefer, A.; Gong, S.; Peterson, J.D.; Day, M.; Ramsey, K.E.; Suárez-Fariñas, M.; Schwarz, C.; Stephan, D.A.; Surmeier, D.J.; et al. A Translational Profiling Approach for the Molecular Characterization of CNS Cell Types. Cell 2008, 135, 738–748. [Google Scholar] [CrossRef]
- Sanz, E.; Yang, L.; Su, T.; Morris, D.R.; McKnight, G.S.; Amieux, P.S. Cell-Type-Specific Isolation of Ribosome-Associated MRNA from Complex Tissues. Proc. Natl. Acad. Sci. USA 2009, 106, 13939–13944. [Google Scholar] [CrossRef] [PubMed]
- Guo, H.; Ingolia, N.T.; Weissman, J.S.; Bartel, D.P. Mammalian MicroRNAs Predominantly Act to Decrease Target MRNA Levels. Nature 2010, 466, 835. [Google Scholar] [CrossRef] [PubMed]
- Langmead, B.; Trapnell, C.; Pop, M.; Salzberg, S.L. Ultrafast and Memory-Efficient Alignment of Short DNA Sequences to the Human Genome. Genome Biol. 2009, 10, R25. [Google Scholar] [CrossRef] [PubMed]
- Kukurba, K.R.; Montgomery, S.B. RNA Sequencing and Analysis. Cold Spring Harb. Protoc. 2015, 2015, 951. [Google Scholar] [CrossRef]
- Blevins, W.R.; Tavella, T.; Moro, S.G.; Blasco-Moreno, B.; Closa-Mosquera, A.; Díez, J.; Carey, L.B.; Albà, M.M. Using Ribosome Profiling to Quantify Differences in Protein Expression: A Case Study in Saccharomyces Cerevisiae Oxidative Stress Conditions. bioRxiv 2018. [Google Scholar] [CrossRef]
- Koch, A.; Gawron, D.; Steyaert, S.; Ndah, E.; Crappé, J.; de Keulenaer, S.; de Meester, E.; Ma, M.; Shen, B.; Gevaert, K.; et al. A Proteogenomics Approach Integrating Proteomics and Ribosome Profiling Increases the Efficiency of Protein Identification and Enables the Discovery of Alternative Translation Start Sites. Proteomics 2014, 14, 2688. [Google Scholar] [CrossRef]
- Lareau, L.F.; Hite, D.H.; Hogan, G.J.; Brown, P.O. Distinct Stages of the Translation Elongation Cycle Revealed by Sequencing Ribosome-Protected MRNA Fragments. eLife 2014, 3, e01257. [Google Scholar] [CrossRef]
- Dana, A.; Tuller, T. The Effect of TRNA Levels on Decoding Times of MRNA Codons. Nucleic Acids Res. 2014, 42, 9171. [Google Scholar] [CrossRef]
- Michel, A.M.; Choudhury, K.R.; Firth, A.E.; Ingolia, N.T.; Atkins, J.F.; Baranov, P.V. Observation of Dually Decoded Regions of the Human Genome Using Ribosome Profiling Data. Genome Res. 2012, 22, 2219. [Google Scholar] [CrossRef]
- Chung, B.Y.; Hardcastle, T.J.; Jones, J.D.; Irigoyen, N.; Firth, A.E.; Baulcombe, D.C.; Brierley, I. The Use of Duplex-Specific Nuclease in Ribosome Profiling and a User-Friendly Software Package for Ribo-Seq Data Analysis. RNA 2015, 21, 1731. [Google Scholar] [CrossRef]
- Dunn, J.G.; Weissman, J.S. Plastid: Nucleotide-Resolution Analysis of Next-Generation Sequencing and Genomics Data. BMC Genom. 2016, 17, 958. [Google Scholar] [CrossRef]
- O’Connor, P.B.F.; Andreev, D.E.; Baranov, P.V. Comparative Survey of the Relative Impact of MRNA Features on Local Ribosome Profiling Read Density. Nat. Commun. 2016, 7, 12915. [Google Scholar] [CrossRef] [PubMed]
- Verbruggen, S.; Menschaert, G. MQC: A Post-Mapping Data Exploration Tool for Ribosome Profiling. Comput. Methods Prog. Biomed. 2019, 181, 104806. [Google Scholar] [CrossRef]
- Michel, A.M.; Fox, G.; Kiran, A.M.; de Bo, C.; O’Connor, P.B.F.; Heaphy, S.M.; Mullan, J.P.A.; Donohue, C.A.; Higgins, D.G.; Baranov, P.V. GWIPS-Viz: Development of a Ribo-Seq Genome Browser. Nucleic Acids Res. 2014, 42, D859. [Google Scholar] [CrossRef]
- Legrand, C.; Tuorto, F. RiboVIEW: A Computational Framework for Visualization, Quality Control and Statistical Analysis of Ribosome Profiling Data. Nucleic Acids Res. 2020, 48, e7. [Google Scholar] [CrossRef]
- Kiniry, S.J.; O’Connor, P.B.F.; Michel, A.M.; Baranov, P.V. Trips-Viz: A Transcriptome Browser for Exploring Ribo-Seq Data. Nucleic Acids Res. 2019, 47, D847. [Google Scholar] [CrossRef]
- Ji, Z.; Song, R.; Regev, A.; Struhl, K. Many LncRNAs, 5′UTRs, and Pseudogenes Are Translated and Some Are Likely to Express Functional Proteins. eLife 2015, 4, e08890. [Google Scholar] [CrossRef] [PubMed]
- Calviello, L.; Mukherjee, N.; Wyler, E.; Zauber, H.; Hirsekorn, A.; Selbach, M.; Landthaler, M.; Obermayer, B.; Ohler, U. Detecting Actively Translated Open Reading Frames in Ribosome Profiling Data. Nat. Methods 2015, 13, 165–170. [Google Scholar] [CrossRef]
- Fields, A.P.; Rodriguez, E.H.; Jovanovic, M.; Stern-Ginossar, N.; Haas, B.J.; Mertins, P.; Raychowdhury, R.; Hacohen, N.; Carr, S.A.; Ingolia, N.T.; et al. A Regression-Based Analysis of Ribosome-Profiling Data Reveals a Conserved Complexity to Mammalian Translation. Mol. Cell 2015, 60, 816. [Google Scholar] [CrossRef]
- Chun, S.Y.; Rodriguez, C.M.; Todd, P.K.; Mills, R.E. SPECtre: A Spectral Coherence-based Classifier of Actively Translated Transcripts from Ribosome Profiling Sequence Data. BMC Bioinform. 2016, 17, 482. [Google Scholar] [CrossRef]
- Raj, A.; Wang, S.H.; Shim, H.; Harpak, A.; Li, Y.I.; Engelmann, B.; Stephens, M.; Gilad, Y.; Pritchard, J.K. Thousands of Novel Translated Open Reading Frames in Humans Inferred by Ribosome Footprint Profiling. eLife 2016, 5, e13328. [Google Scholar] [CrossRef]
- Malone, B.; Atanassov, I.; Aeschimann, F.; Li, X.; Großhans, H.; Dieterich, C. Bayesian Prediction of RNA Translation from Ribosome Profiling. Nucleic Acids Res. 2017, 45, 2960. [Google Scholar] [CrossRef]
- Xu, Z.; Hu, L.; Shi, B.; Geng, S.; Xu, L.; Wang, D.; Lu, Z.J. Ribosome Elongating Footprints Denoised by Wavelet Transform Comprehensively Characterize Dynamic Cellular Translation Events. Nucleic Acids Res. 2018, 46, e109. [Google Scholar] [CrossRef]
- Xiao, Z.; Huang, R.; Xing, X.; Chen, Y.; Deng, H.; Yang, X. De Novo Annotation and Characterization of the Translatome with Ribosome Profiling Data. Nucleic Acids Res. 2018, 46, e61. [Google Scholar] [CrossRef]
- Li, W.; Wang, W.; Uren, P.J.; Penalva, L.O.F.; Smith, A.D. Riborex: Fast and Flexible Identification of Differential Translation from Ribo-Seq Data. Bioinformatics 2017, 33, 1735. [Google Scholar] [CrossRef]
- Larsson, O.; Sonenberg, N.; Nadon, R. Anota: Analysis of Differential Translation in Genome-Wide Studies. Bioinformatics 2011, 27, 1440–1441. [Google Scholar] [CrossRef]
- Olshen, A.B.; Hsieh, A.C.; Stumpf, C.R.; Olshen, R.A.; Ruggero, D.; Taylor, B.S. Assessing Gene-Level Translational Control from Ribosome Profiling. Bioinformatics 2013, 29, 2995. [Google Scholar] [CrossRef][Green Version]
- Zhong, Y.; Karaletsos, T.; Drewe, P.; Sreedharan, V.T.; Kuo, D.; Singh, K.; Wendel, H.G.; Rätsch, G. RiboDiff: Detecting Changes of MRNA Translation Efficiency from Ribosome Footprints. Bioinformatics 2017, 33, 139. [Google Scholar] [CrossRef]
- Xiao, Z.; Zou, Q.; Liu, Y.; Yang, X. Genome-Wide Assessment of Differential Translations with Ribosome Profiling Data. Nat. Commun. 2016, 7, 11194. [Google Scholar] [CrossRef]
- Popa, A.; Lebrigand, K.; Paquet, A.; Nottet, N.; Robbe-Sermesant, K.; Waldmann, R.; Barbry, P. RiboProfiling: A Bioconductor Package for Standard Ribo-Seq Pipeline Processing. F1000Research 2016, 5, 1309. [Google Scholar] [CrossRef]
- Shao, D.; Ahmed, N.; Soni, N.; O’Brien, E.P. RiboA: A Web Application to Identify Ribosome A-Site Locations in Ribosome Profiling Data. BMC Bioinform. 2021, 22, 156. [Google Scholar] [CrossRef] [PubMed]
- Lauria, F.; Tebaldi, T.; Bernabò, P.; Groen, E.J.N.; Gillingwater, T.H.; Viero, G. RiboWaltz: Optimization of Ribosome P-Site Positioning in Ribosome Profiling Data. PLoS Comput. Biol. 2018, 14, e1006169. [Google Scholar] [CrossRef] [PubMed]
- Liu, Q.; Shvarts, T.; Sliz, P.; Gregory, R.I. RiboToolkit: An Integrated Platform for Analysis and Annotation of Ribosome Profiling Data to Decode MRNA Translation at Codon Resolution. Nucleic Acids Res. 2020, 48, W218–W229. [Google Scholar] [CrossRef]
- Legendre, R.; Baudin-Baillieu, A.; Hatin, I.; Namy, O. RiboTools: A Galaxy Toolbox for Qualitative Ribosome Profiling Analysis. Bioinformatics 2015, 31, 2586–2588. [Google Scholar] [CrossRef]
- Brar, G.A.; Weissman, J.S. Ribosome Profiling Reveals the What, When, Where, and How of Protein Synthesis. Nat. Rev. Mol. Cell Biol. 2015, 16, 651. [Google Scholar] [CrossRef]
- Chothani, S.; Adami, E.; Ouyang, J.F.; Viswanathan, S.; Hubner, N.; Cook, S.A.; Schafer, S.; Rackham, O.J.L. DeltaTE: Detection of Translationally Regulated Genes by Integrative Analysis of Ribo-Seq and RNA-Seq Data. Curr. Protoc. Mol. Biol. 2019, 129, e108. [Google Scholar] [CrossRef]
- Hsieh, A.C.; Liu, Y.; Edlind, M.P.; Ingolia, N.T.; Janes, M.R.; Sher, A.; Shi, E.Y.; Stumpf, C.R.; Christensen, C.; Bonham, M.J.; et al. The Translational Landscape of MTOR Signalling Steers Cancer Initiation and Metastasis. Nature 2012, 485, 55. [Google Scholar] [CrossRef]
- Gonzalez, C.; Sims, J.S.; Hornstein, N.; Mela, A.; Garcia, F.; Lei, L.; Gass, D.A.; Amendolara, B.; Bruce, J.N.; Canoll, P.; et al. Ribosome Profiling Reveals a Cell-Type-Specific Translational Landscape in Brain Tumors. J. Neurosci. 2014, 34, 10924. [Google Scholar] [CrossRef]
- Chong, C.; Müller, M.; Pak, H.S.; Harnett, D.; Huber, F.; Grun, D.; Leleu, M.; Auger, A.; Arnaud, M.; Stevenson, B.J.; et al. Integrated Proteogenomic Deep Sequencing and Analytics Accurately Identify Non-Canonical Peptides in Tumor Immunopeptidomes. Nat. Commun. 2020, 11, 1293. [Google Scholar] [CrossRef]
- Khajuria, R.K.; Munschauer, M.; Ulirsch, J.C.; Fiorini, C.; Ludwig, L.S.; McFarland, S.K.; Abdulhay, N.J.; Specht, H.; Keshishian, H.; Mani, D.R.; et al. Ribosome Levels Selectively Regulate Translation and Lineage Commitment in Human Hematopoiesis. Cell 2018, 173, 90–103.e19. [Google Scholar] [CrossRef]
- Shah, S.; Molinaro, G.; Liu, B.; Wang, R.; Huber, K.M.; Richter, J.D. FMRP Control of Ribosome Translocation Promotes Chromatin Modifications, and Alternative Splicing of Neuronal Genes Linked to Autism. Cell Rep. 2020, 30, 4459. [Google Scholar] [CrossRef] [PubMed]
- Neelagandan, N.; Gonnella, G.; Dang, S.; Janiesch, P.C.; Miller, K.K.; Küchler, K.; Marques, R.F.; Indenbirken, D.; Alawi, M.; Grundhoff, A.; et al. TDP-43 Enhances Translation of Specific MRNAs Linked to Neurodegenerative Disease. Nucleic Acids Res. 2019, 47, 341. [Google Scholar] [CrossRef] [PubMed]
- Zhao, T.; Chen, Y.M.; Li, Y.; Wang, J.; Chen, S.; Gao, N.; Qian, W. Disome-Seq Reveals Widespread Ribosome Collisions That Promote Cotranslational Protein Folding. Genome Biol. 2021, 22, 16. [Google Scholar] [CrossRef] [PubMed]
- Meydan, S.; Guydosh, N.R. Disome and Trisome Profiling Reveal Genome-Wide Targets of Ribosome Quality Control. Mol. Cell 2020, 79, 588. [Google Scholar] [CrossRef]
- Hoerth, K.; Reitter, S.; Schott, J. Normalized Ribo-Seq for Quantifying Absolute Global and Specific Changes in Translation. Bio-Protoc. 2022, 12, e4323. [Google Scholar] [CrossRef]
- Jiang, P.; Thomson, J.A.; Stewart, R. Quality Control of Single-Cell RNA-Seq by SinQC. Bioinformatics 2016, 32, 2514–2516. [Google Scholar] [CrossRef]
- VanInsberghe, M.; van den Berg, J.; Andersson-Rolf, A.; Clevers, H.; van Oudenaarden, A. Single-Cell Ribo-Seq Reveals Cell Cycle-Dependent Translational Pausing. Nature 2021, 597, 561–565. [Google Scholar] [CrossRef]


| Methods and Website | Features | |
|---|---|---|
| Quantification of Ribosome-bounded transcripts | riboSeqR: An R/Bioconductor package that provides a set of programs for processing and visualization of Ribo-seq data. https://ribogalaxy.genomicsdatascience.ie/ [20] | Provides visualization of data at sub-codon resolution in the context of single transcripts. |
| Plastid: A user-friendly, generalized analytical pipeline tool that enables users to manipulate data nucleotide by nucleotide robustly and easily and that is not limited to specific experimental regimes or analytical workflows. https://plastid.readthedocs.io [21]. | Extensibility and flexibility across assays while remaining user friendly. | |
| RUST: A smoothing transformation-based approach for Ribo-seq normalization in the presence of heterogeneous noise. https://lapti.ucc.ie/rust/ [22]. | Performs better in presence of sporadic heterogeneous noise than the previous methods. | |
| mQC: A tool for visualizing quality and data exploration after mapping. https://github.com/Biobix/mQC [23]. | Applies the P site offsets before plotting to inspect ribosomal framing and triplet periodicity more elaborately than other existing tools. | |
| GWIPS-viz: An online genome browser for checking quality measures or discovering authentic new information from ribosome profiling data. https://gwips.ucc.ie/ [24]. | A Ribo-seq genome browser for data visualization | |
| RiboVIEW: A computational pipeline for visualization, quality control, and statistical analysis of ribosome profiling data. https://github.com/carinelegrand/RiboVIEW [25]. | Focuses on checking quality measures. | |
| Trips-Viz: A graphical tools for exploring properties of collection of ORFs. https://trips.ucc.ie/ [26]. | Provides visualization of data at sub codon resolution in the context of single transcripts. | |
| Translated ORF identification | RibORF: A support-vector-machine-based classifier to determine which RNAs are translated based on read distribution features. https://github.com/zhejilab/RibORF [27]. | Helps to discern between the RNAs that are genuinely translated and those that are not associated with ribosomes. |
| RiboTaper: A multitaper spectral-based approach for comprehensive de novo identification of actively used ORFs from Ribo-seq data. https://ohlerlab.mdc-berlin.de/software/RiboTaper_126/ [28]. | General applicability and excellent performance in reconstructing full set of ORFs (coding and non-coding). | |
| ORF-RATER: An experimental and analytical framework based on linear regression for identification and quantification of translation. https://github.com/alexfields/ORF-RATER [29]. | Helps in comprehensive interpretation of ribosome profiling data due to flexibility of the linear regression model. | |
| SPECtre: A memory-efficient analytical tool (spectral coherence-based classifier) with more accuracy for detecting active translation. https://github.com/mills-lab/spectre [30]. | Optimization runtime and memory for accurate investigation of translation. | |
| riboHMM: A mixed hidden Markov model-based approach to accurately infer translated sequence. https://github.com/rajanil/riboHMM [31]. | Infers novel translated sequences with a focus on short CDSs (<100 amino acids). | |
| RpBp: An unsupervised Bayesian approach for predicting translated ORFs. https://github.com/dieterich-lab/rp-bp [32]. | Improves predictions while maintaining distributions through the entire process. | |
| PRICE: A software pipeline including all steps necessary to identify and score codons and ORFs starting. https://github.com/erhard-lab/gedi/wiki/Price [5]. | Modeling the experimental noise to accurately resolve overlapping sORFs. | |
| RiboWave: A computational method using wavelet transform to remove noise for detecting actively translated (ORFs) and dynamic cellular translation. https://github.com/lulab/Ribowave [33]. | Indicates low-quality reads to improve the performance of ORF prediction. | |
| RiboCode: A method for evaluating the active translation mainly based on the 3 nt periodicity. https://pypi.org/project/RiboCode/ https://github.com/xryanglab/RiboCode [34]. | Higher efficiency and accuracy for de novo annotation and characterization of the translatome with ribosome profiling data. | |
| Differential translation analysis Identification of A and P site location | Riborex: A linear model-based tool for identification of differential translation from Ribo-seq data. https://github.com/smithlabcode/riborex [35]. | Faster than all existing methods and employs robust software implementations for the underlying statistical calculations. |
| Anota: An R/Bioconductor package that implements analysis of partial variance (APV) to identify differential translation. https://github.com/ChrOertlin/anota2seq/ [36]. | Using APV instead of log ratio approach for detecting translation changes. | |
| Babel: An errors-in-variables regression model-based framework to compare ribosome associations within and between conditions based on an errors-in-variables regression model. https://github.com/olshena/babel [37]. | Model is more flexible and combines P-values across independent tests. | |
| RiboDiff: A linear model-based framework for detecting changes of mRNA translation efficiency across experimental conditions. http://bioweb.me/ribodiff http://github.com/ratschlab/ribodiff [38]. | Facilitating comparisons of RF abundance by taking mRNA abundance variability as a confounding factor. | |
| Xtail: An analysis pipeline to detect differentially translated genes. https://github.com/xryanglab/xtail [39]. | A more sophisticated method for domination on limitations, such as high-false discoveries and low sensitivities. | |
| RiboProfiling: An R/Bioconductor package that provides a full pipeline to cover all key steps for facilitating the analysis of Ribo-seq experiments and ribosome footprints. https://github.com/alenzhao/RiboProfiling [40]. | Utilizes multiple R packages to handle datasets easily. | |
| RiboA: A user-friendly web application that identifies A site locations and generates read density profiles. Website: https://a-site.vmhost.psu.edu/ https://github.com/obrien-lab/aip_web_docker [41]. | The most accurate identifier compared to other tools. | |
| riboWaltz: An R package for the identification of the ribosome P site, analysis, and visual inspection of ribosome profiling data. https://github.com/LabTranslationalArchitectomics/RiboWaltz [42]. | Addresses issue of time limitation and data preprocessing. | |
| RiboToolkit: A freely available, web-based service to centralize Ribo-seq data analyses, codon occupancy, and translation efficiency analysis. http://rnainformatics.org.cn/RiboToolkit/ [43]. | Addresses the lacking integrated tool and easy-to-use integrated tool to analyze Ribo-seq data. | |
| RiboTools: An open-source Galaxy tool used to evaluate codon occupancy at a specific ribosome site and for translation readthrough events. https://testtoolshed.g2.bx.psu.edu/view/rlegendre/ribo_tools [44]. | Facilitates complete qualitative analysis. |
| Diseases | Major Findings via Ribo-Seq |
|---|---|
| Breast Cancer | The translational efficiencies tend to have higher variations in malignant cells than controls under perturbations, such as condition changes or stress. [1] |
| Prostate Cancer | Uncovering major translations by mTOR kinase and revealing the collection of genes involved in a different step of the cell cycle allows improvement in understanding of how cancerous translation operates cancer-specific cell behavior [47]. |
| Brain Tumor | Genes specific to transformed cells are highly translated, but their translation efficiencies are low compared with the normal brain. Furthermore, the upregulated pathways found in tumor-associated cells are most closely associated with the mesenchymal subtype [48]. |
| Human Leukocyte Antigen (HLA) | Significantly higher positive correlation between HLAIp sampling searched against Ribo-Seq and the translation rate than the overall RNA abundance. Identification of additional upstream ORFs or other unannotated ORFs that are not included in canonical annotation but still show periodic footprint of translation [49]. |
| Diamond–Blackfan Anemia (DBA) | Molecular lesions underlying DBA reduce ribosome levels in hematopoietic cells and this reduction causes impaired translation of a subset of mRNAs. Furthermore, translational perturbations in DBA impair lineage commitment in HSPCs [50]. |
| Fragile X Syndrome (FXS) | Reveals diverse changes in gene expression in Fmr1 KO hippocampus [51]. |
| Amyotrophic Lateral Sclerosis (ALS) and Frontotemporal Dementia (FTD) | Identification of a novel function of TDP-43 (has a central role in neurodegenerative diseases) as an mRNA-specific translational enhancer, which enhances translation of Camta1 and Mig12 mRNAs via their 5′UTRs and specific 3′UTR region for Dennd4a [52]. |
Publisher’s Note: MDPI stays neutral with regard to jurisdictional claims in published maps and institutional affiliations. |
© 2022 by the authors. Licensee MDPI, Basel, Switzerland. This article is an open access article distributed under the terms and conditions of the Creative Commons Attribution (CC BY) license (https://creativecommons.org/licenses/by/4.0/).
Share and Cite
Bagheri, A.; Astafev, A.; Al-Hashimy, T.; Jiang, P. Tracing Translational Footprint by Ribo-Seq: Principle, Workflow, and Applications to Understand the Mechanism of Human Diseases. Cells 2022, 11, 2966. https://doi.org/10.3390/cells11192966
Bagheri A, Astafev A, Al-Hashimy T, Jiang P. Tracing Translational Footprint by Ribo-Seq: Principle, Workflow, and Applications to Understand the Mechanism of Human Diseases. Cells. 2022; 11(19):2966. https://doi.org/10.3390/cells11192966
Chicago/Turabian StyleBagheri, Atefeh, Artem Astafev, Tara Al-Hashimy, and Peng Jiang. 2022. "Tracing Translational Footprint by Ribo-Seq: Principle, Workflow, and Applications to Understand the Mechanism of Human Diseases" Cells 11, no. 19: 2966. https://doi.org/10.3390/cells11192966
APA StyleBagheri, A., Astafev, A., Al-Hashimy, T., & Jiang, P. (2022). Tracing Translational Footprint by Ribo-Seq: Principle, Workflow, and Applications to Understand the Mechanism of Human Diseases. Cells, 11(19), 2966. https://doi.org/10.3390/cells11192966