


The Degradation of TMEM166 by Autophagy Promotes AMPK Activation to Protect SH-SY5Y Cells Exposed to MPP+
 and
and 
Abstract
:1. Introduction
2. Materials and Methods
2.1. Materials
2.2. Cell Culture and Transfection
2.3. TMEM166 Knock Down
2.4. RNA Isolation and Real-Time Polymerase Chain Reaction (RT-PCR)
2.5. Mitochondrial Fraction Isolation
2.6. Western Blotting Analysis
2.7. Cell Viability Assay
2.8. Annexin V/PI Apoptosis Analysis and PI Cell Cycle Analysis
2.9. Mitochondrial Membrane Potential Analysis
2.10. Reactive Oxygen Species (ROS) Analysis
2.11. Measurement of ATP Levels
2.12. Immunocytochemical Staining and Confocal Microscopy
2.13. Statistical Analysis
3. Results
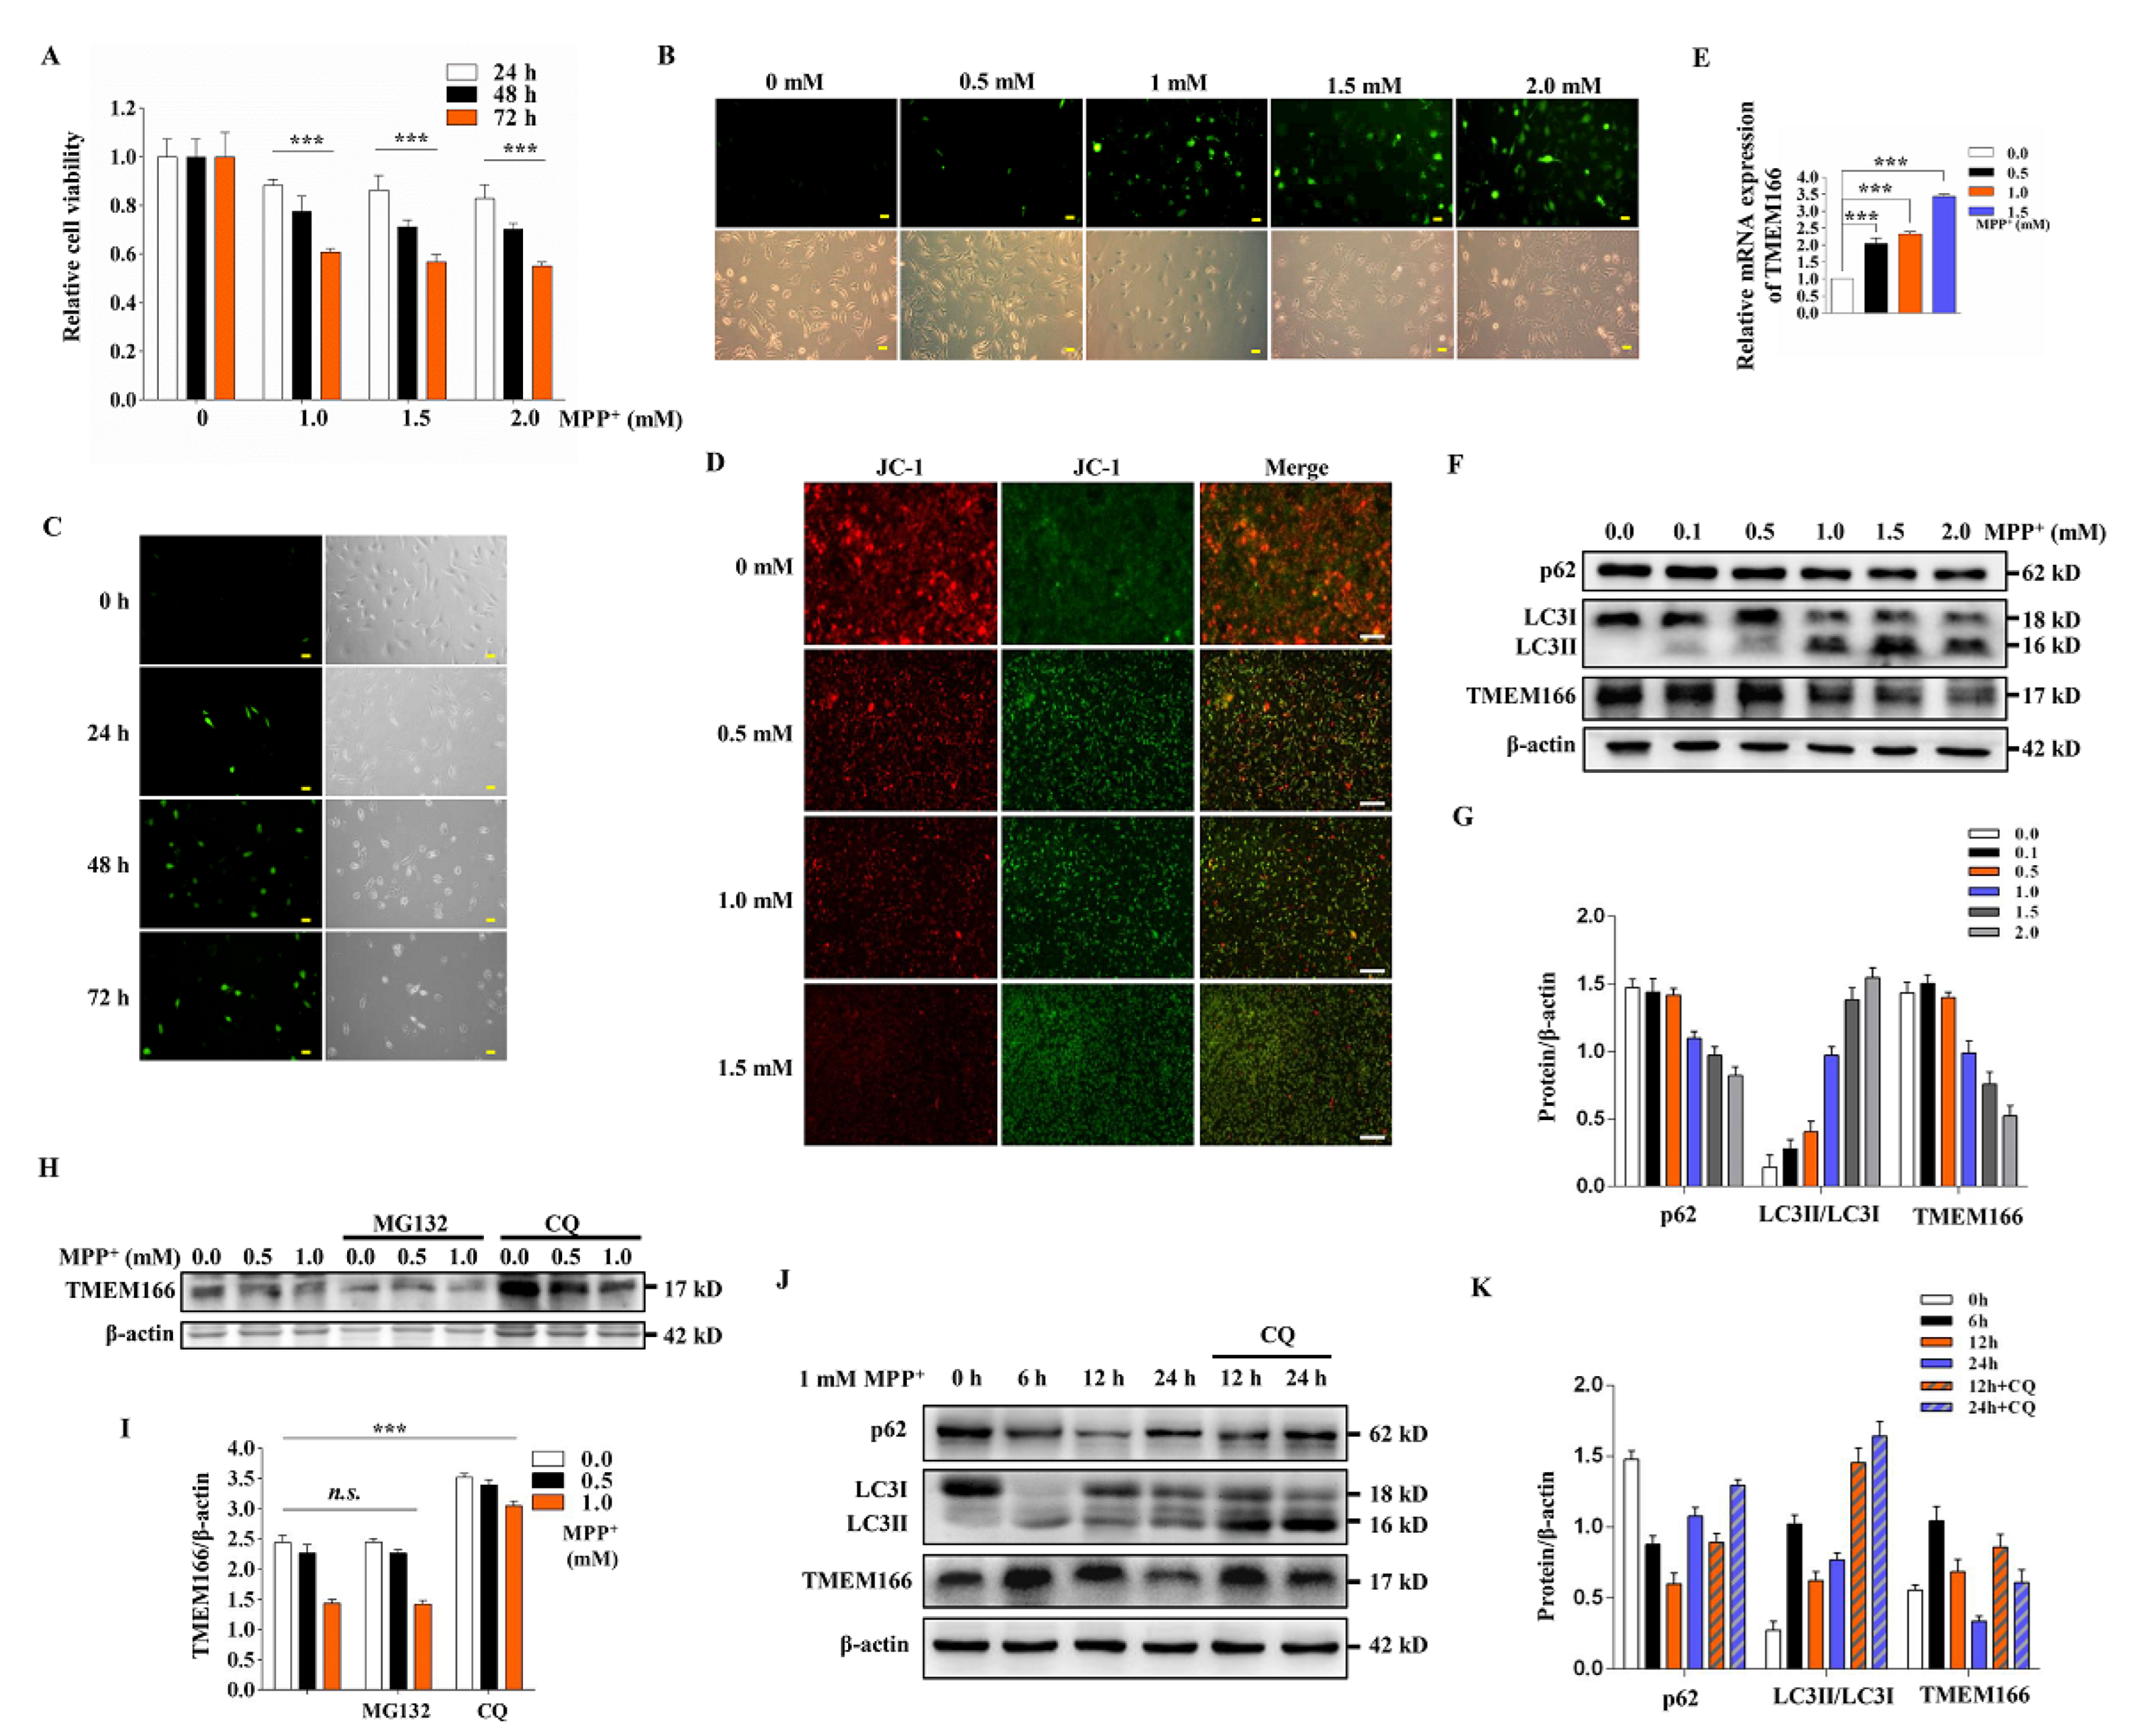
3.1. TMEM166 Is First Up-Regulated and Then Down-Regulated by Autophagic Degradation in MPP+-Treated SH-SY5Y Cells
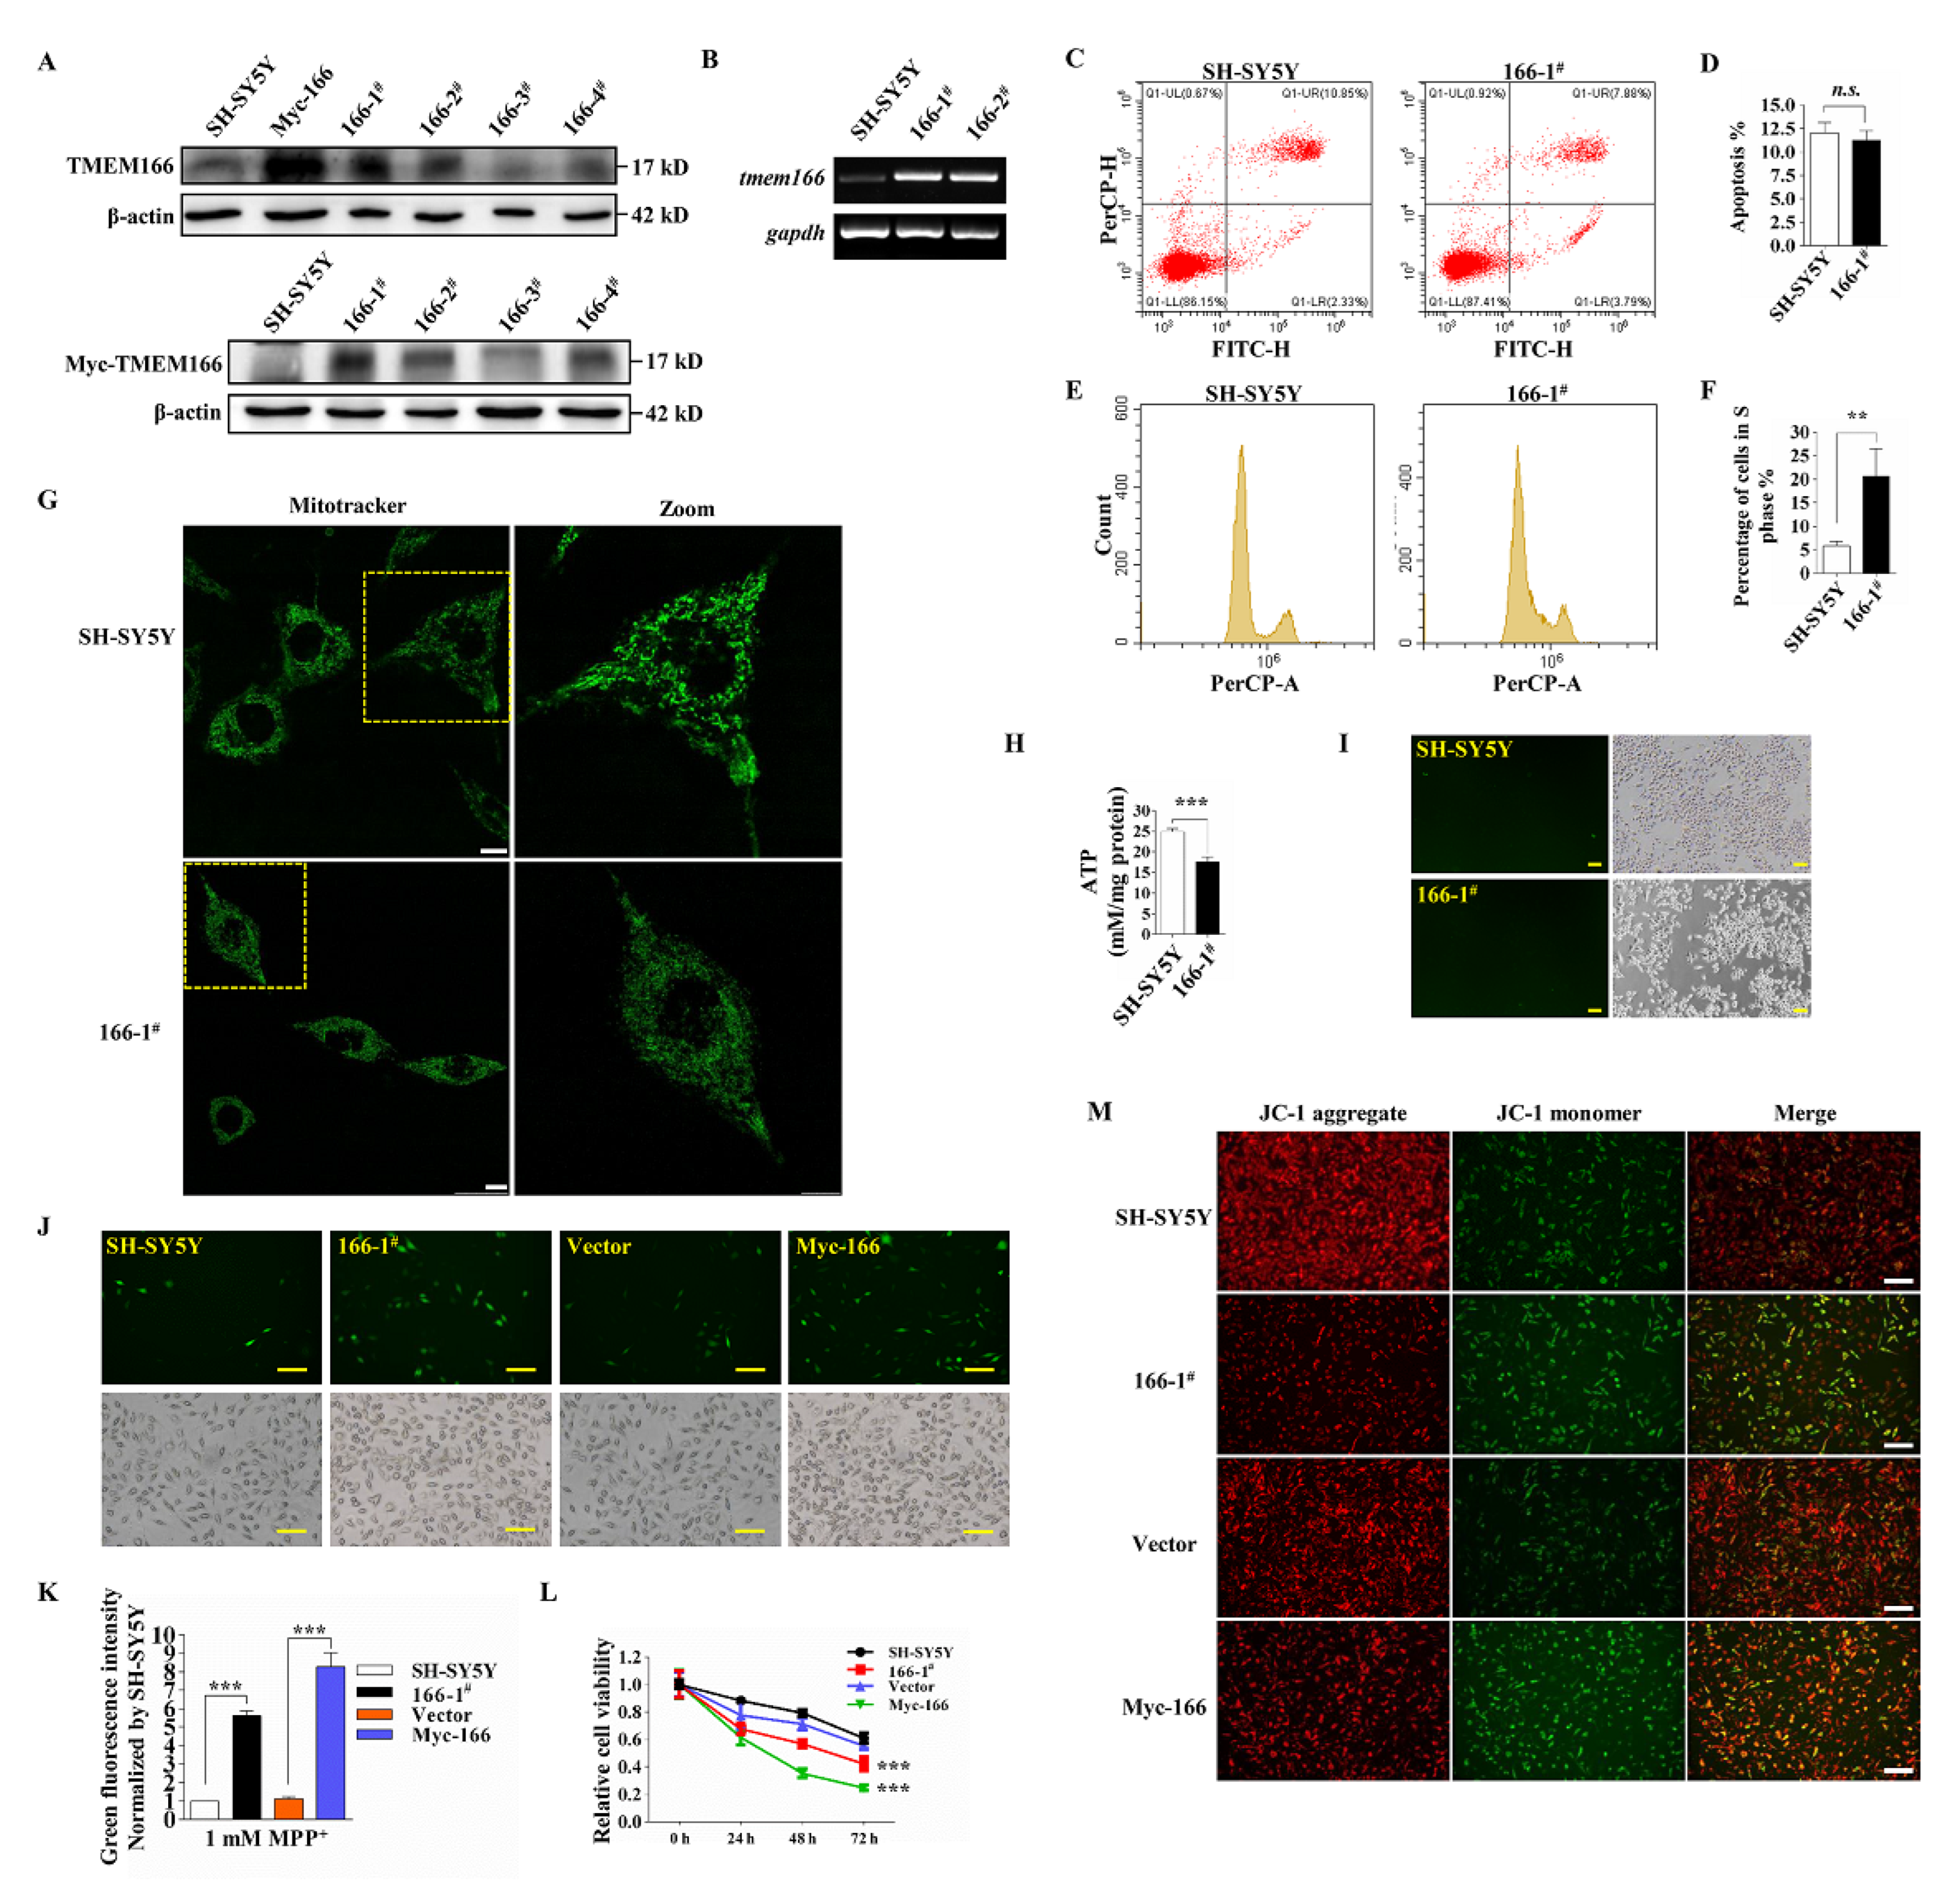
3.2. Overexpressed TMEM166 Exacerbates MPP+-Induced Oxidative Stress in SH-SY5Y Cells
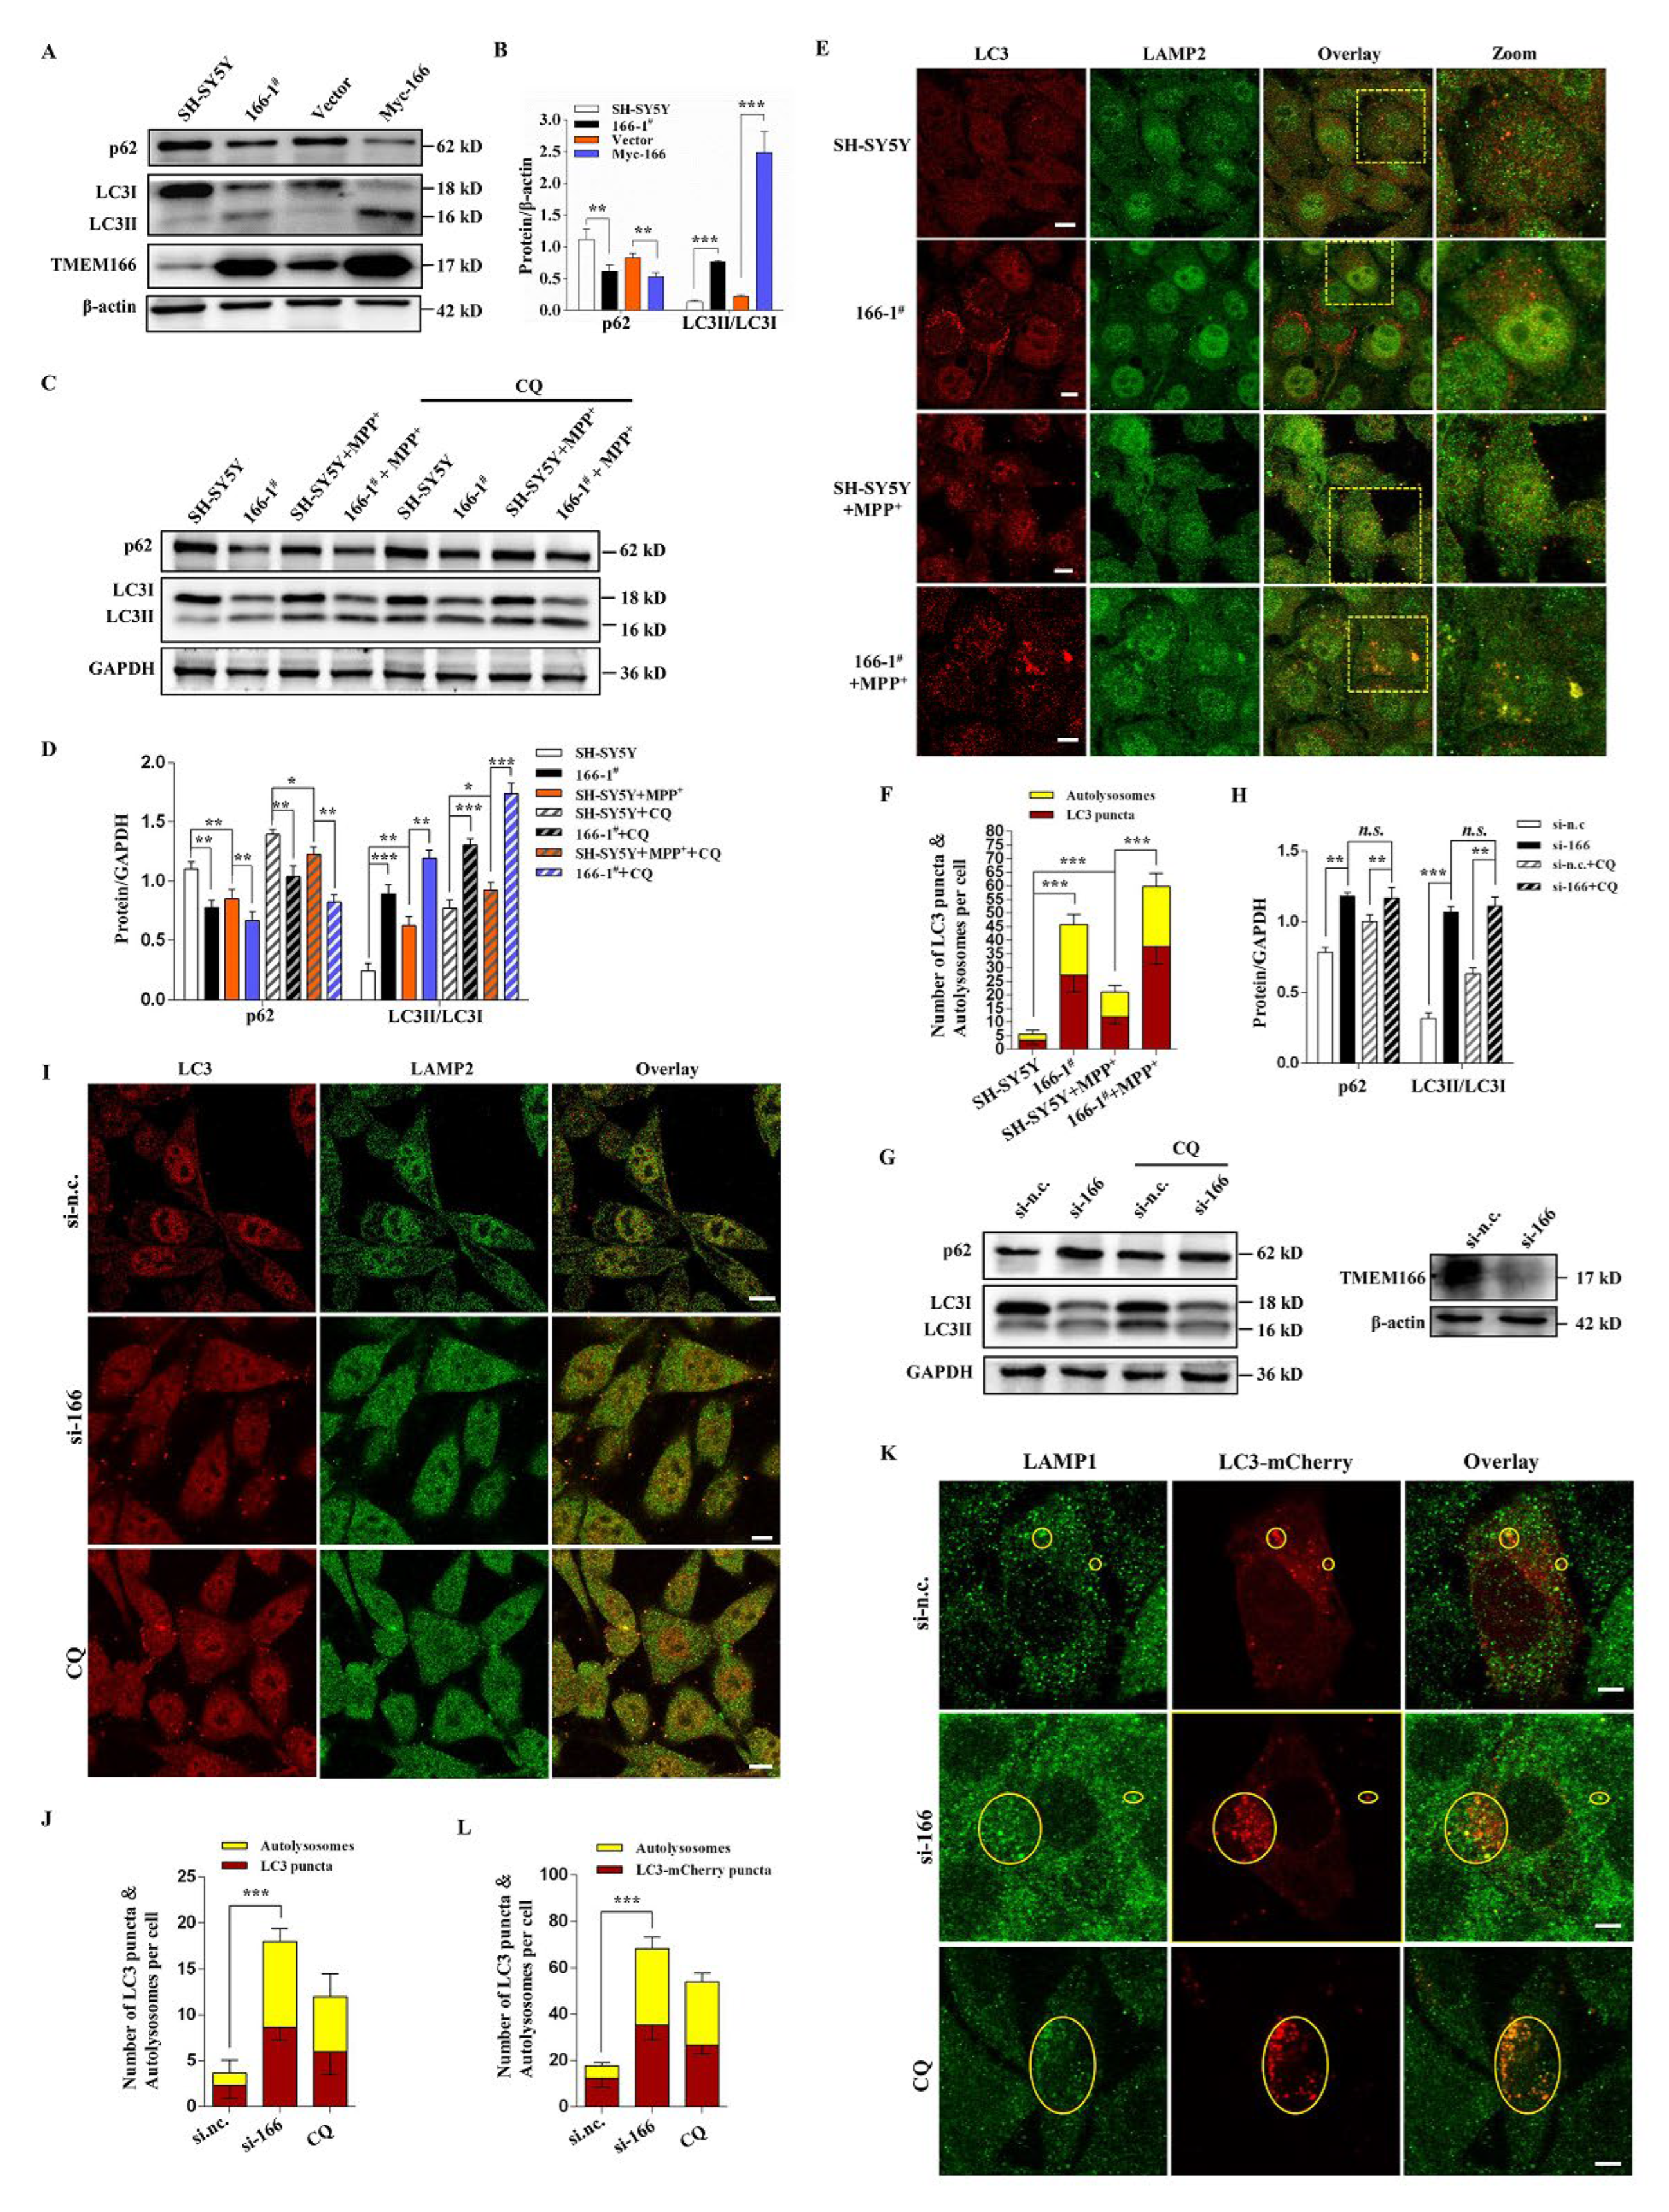
3.3. TMEM166 Promotes Autophagy in SH-SY5Y Cells
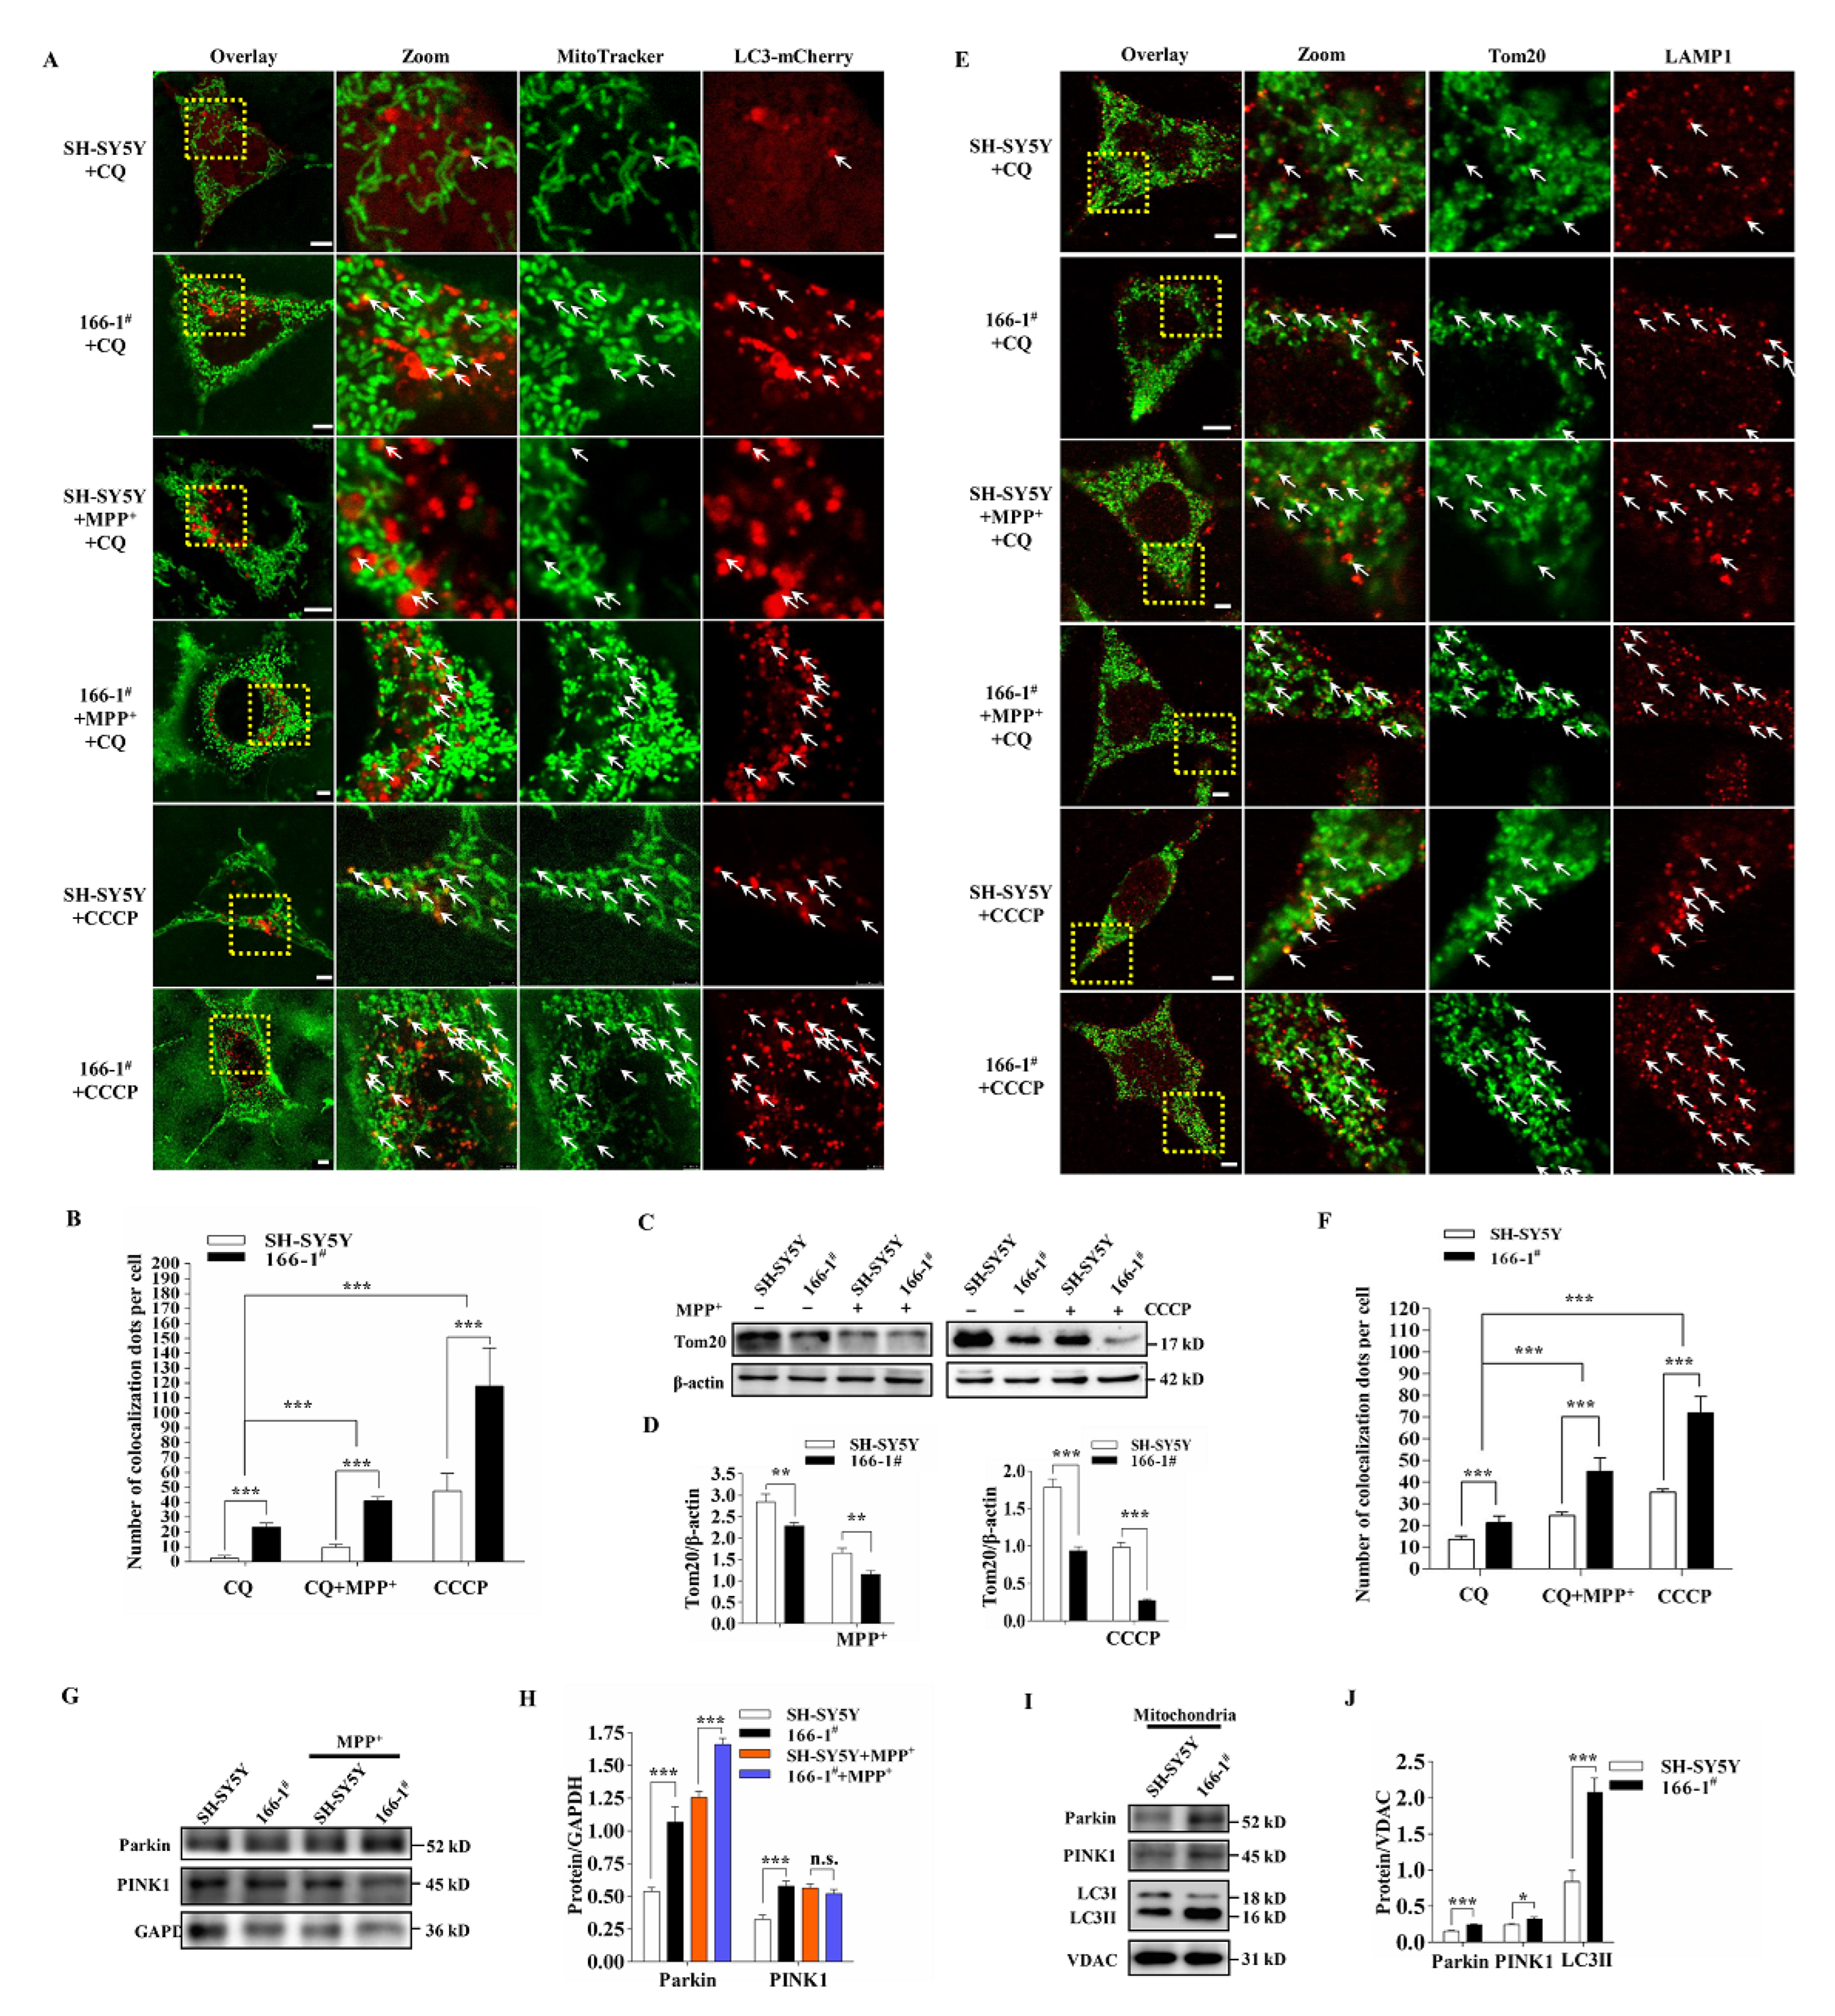
3.4. TMEM166 Promotes Mitophagy in SH-SY5Y Cells
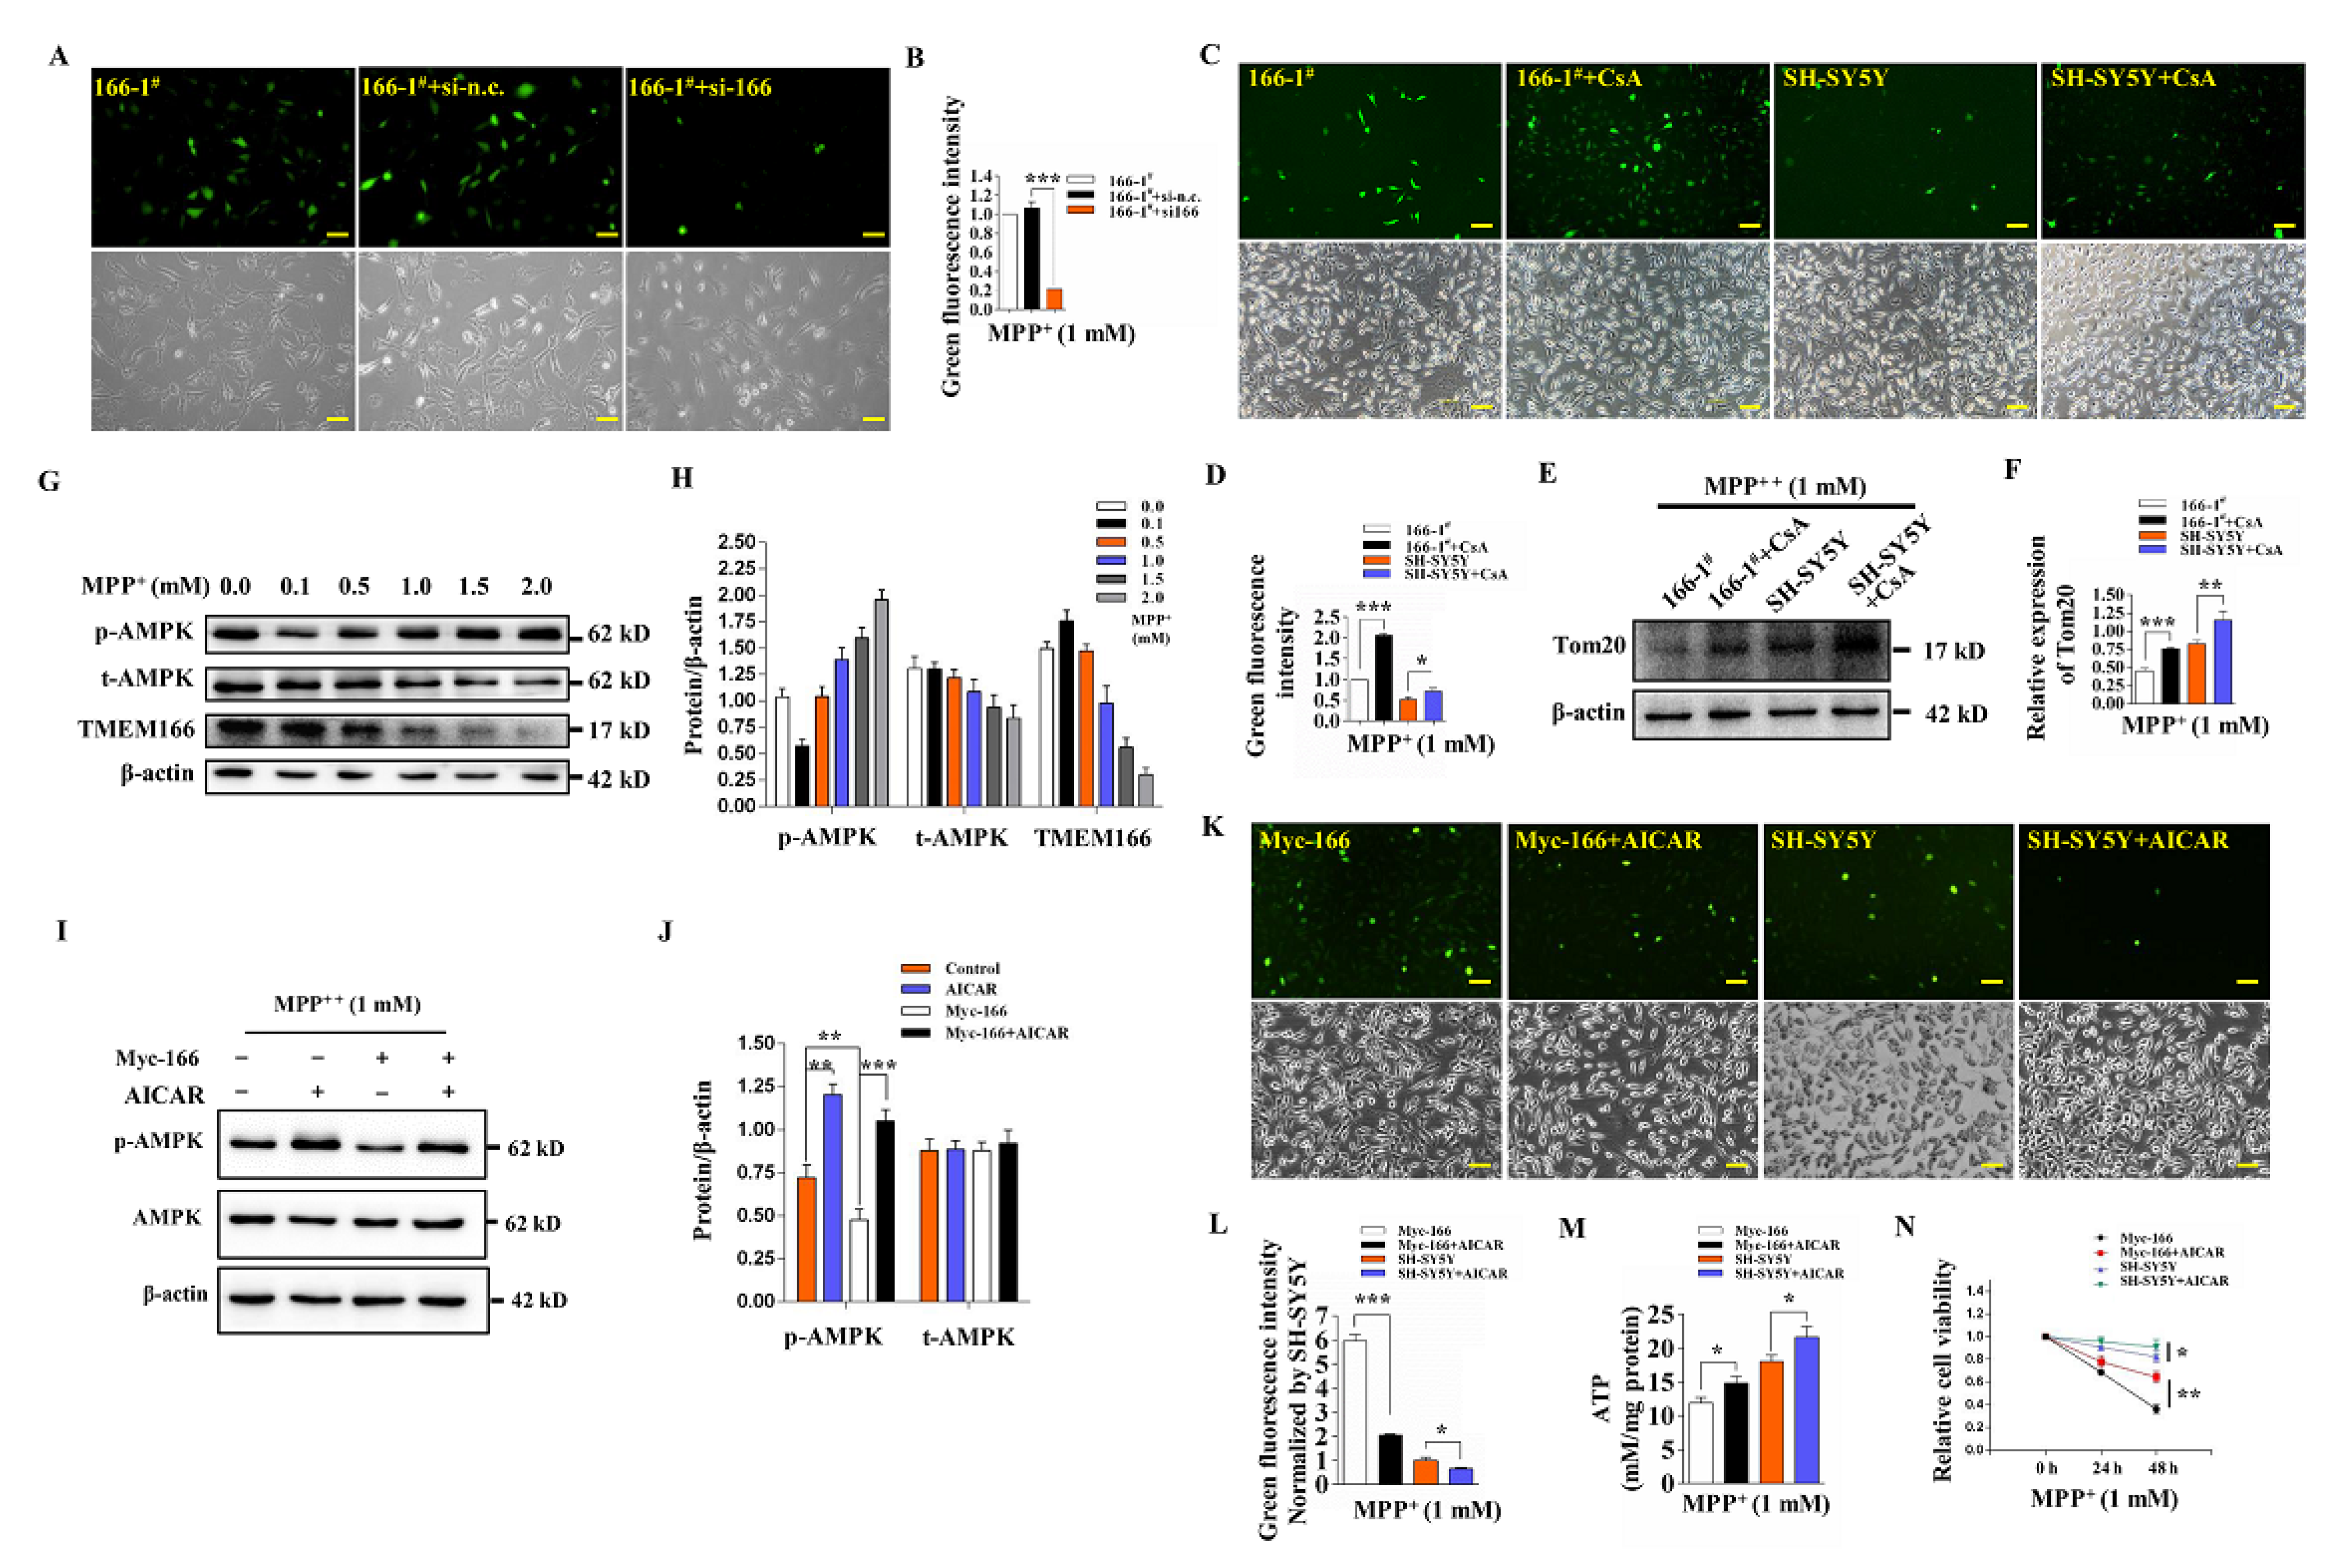
3.5. Not Mitophagy but Inactivation of AMPK Induced by Up-Regulated TMEM166 Aggravates MPP+-Induced Oxidative Stress
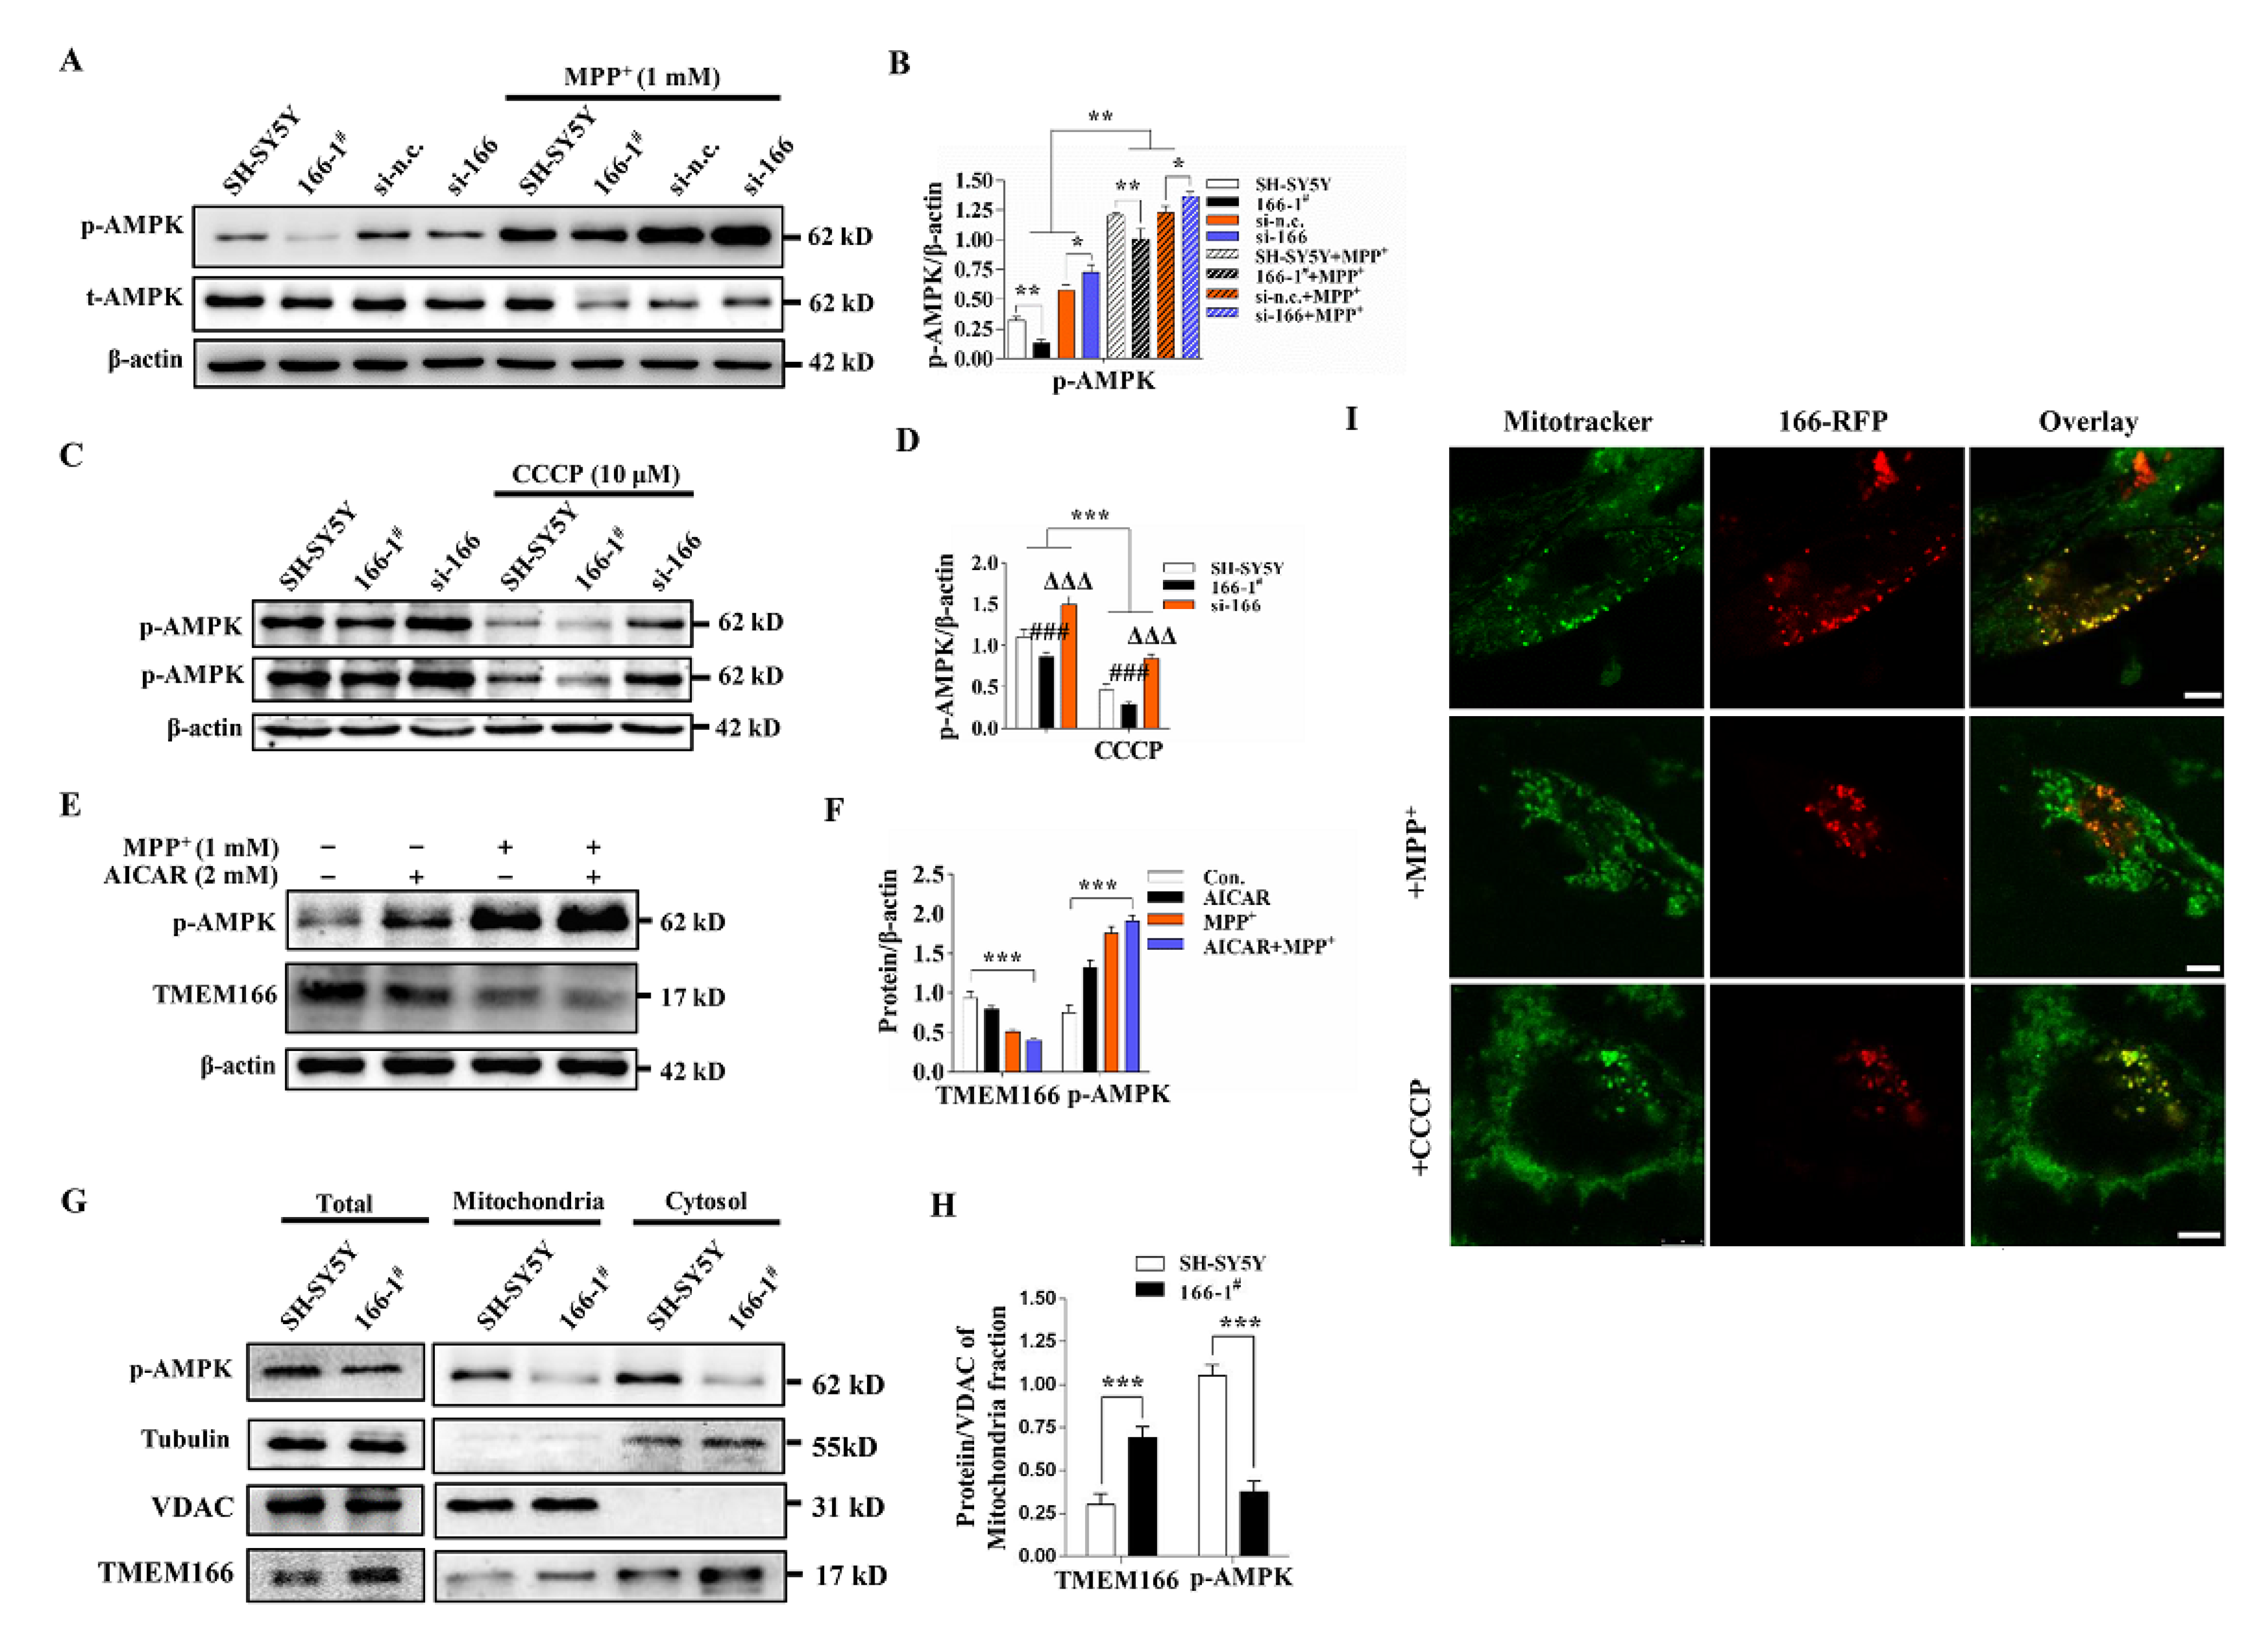
3.6. TMEM166 Inhibits AMPK Activation in Mitochondria
4. Discussion
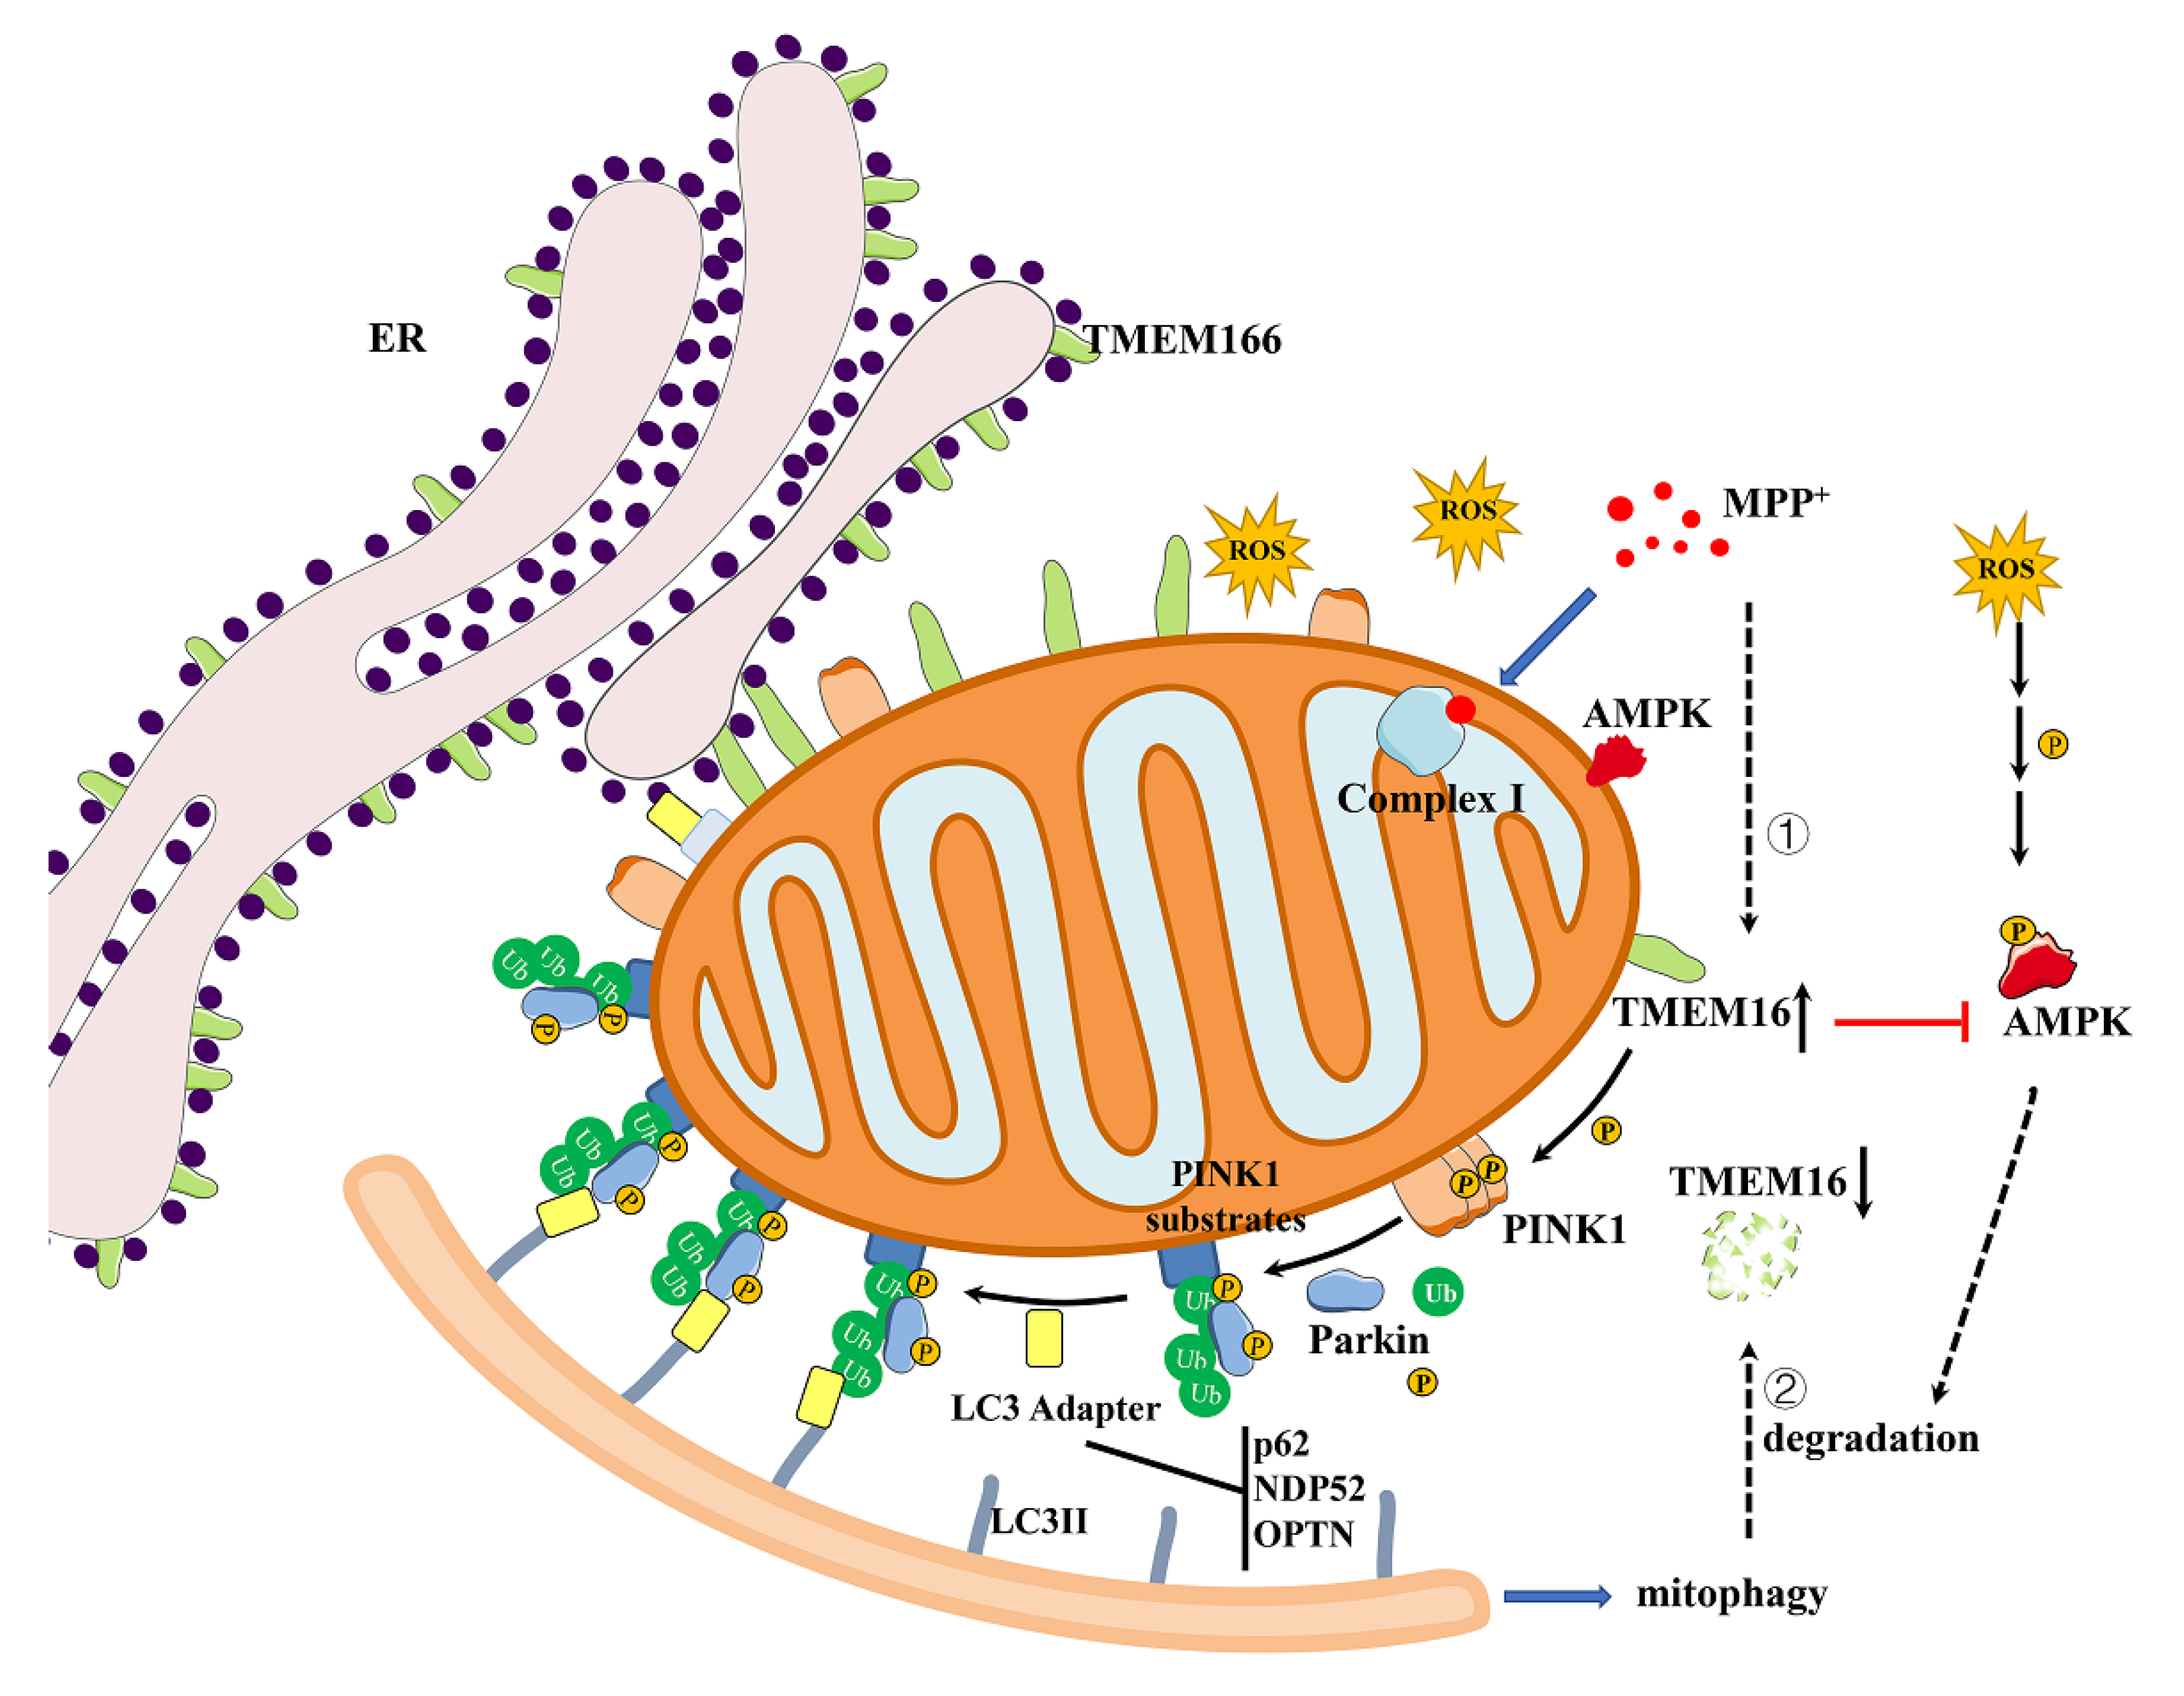
5. Conclusions
Supplementary Materials
Author Contributions
Funding
Institutional Review Board Statement
Informed Consent Statement
Data Availability Statement
Acknowledgments
Conflicts of Interest
References
- Bloem, B.R.; Okun, M.S.; Klein, C. Parkinson’s disease. Lancet 2021, 397, 2284–2303. [Google Scholar] [CrossRef]
- Dionísio, P.A.; Amaral, J.D.; Rodrigues, C.M.P. Oxidative stress and regulated cell death in Parkinson’s disease. Ageing Res. Rev. 2021, 67, 101263. [Google Scholar] [CrossRef] [PubMed]
- Malpartida, A.B.; Williamson, M.; Narendra, D.P.; Wade-Martins, R.; Ryan, B.J. Mitochondrial Dysfunction and Mitophagy in Parkinson’s Disease: From Mechanism to Therapy. Trends Biochem. Sci. 2021, 46, 329–343. [Google Scholar] [CrossRef] [PubMed]
- Bento-Pereira, C.; Dinkova-Kostova, A.T. Activation of transcription factor Nrf2 to counteract mitochondrial dysfunction in Parkinson’s disease. Med. Res. Rev. 2021, 41, 785–802. [Google Scholar] [CrossRef]
- Bose, A.; Beal, M.F. Mitochondrial dysfunction in Parkinson’s disease. J. Neurochem. 2016, 139 (Suppl. 1), 216–231. [Google Scholar] [CrossRef]
- Kung, H.C.; Lin, K.J.; Kung, C.T.; Lin, T.K. Oxidative Stress, Mitochondrial Dysfunction, and Neuroprotection of Polyphenols with Respect to Resveratrol in Parkinson’s Disease. Biomedicines 2021, 9, 918. [Google Scholar] [CrossRef]
- Robea, M.A.; Balmus, I.M.; Ciobica, A.; Strungaru, S.; Plavan, G.; Gorgan, L.D.; Savuca, A.; Nicoara, M. Parkinson’s Disease-Induced Zebrafish Models: Focussing on Oxidative Stress Implications and Sleep Processes. Oxid Med. Cell Longev. 2020, 2020, 1370837. [Google Scholar] [CrossRef]
- Trist, B.G.; Hare, D.J.; Double, K.L. Oxidative stress in the aging substantia nigra and the etiology of Parkinson’s disease. Aging Cell 2019, 18, e13031. [Google Scholar] [CrossRef]
- Palmieri, M.; Pal, R.; Nelvagal, H.R.; Lotfi, P.; Stinnett, G.R.; Seymour, M.L.; Chaudhury, A.; Bajaj, L.; Bondar, V.V.; Bremner, L.; et al. mTORC1-independent TFEB activation via A.Akt inhibition promotes cellular clearance in neurodegenerative storage diseases. Nat. Commun. 2017, 8, 14338. [Google Scholar] [CrossRef]
- Ou, K.; Li, Y.; Liu, L.; Li, H.; Cox, K.; Wu, J.; Liu, J.; Dick, A.D. Recent developments of neuroprotective agents for degenerative retinal disorders. Neural Regen. Res. 2022, 17, 1919–1928. [Google Scholar] [CrossRef]
- Wang, L.; Yu, C.; Lu, Y.; He, P.; Guo, J.; Zhang, C.; Song, Q.; Ma, D.; Shi, T.; Chen, Y. TMEM166, a novel transmembrane protein, regulates cell autophagy and apoptosis. Apoptosis 2007, 12, 1489–1502. [Google Scholar] [CrossRef] [PubMed]
- Hu, J.; Li, G.; Qu, L.; Li, N.; Liu, W.; Xia, D.; Hongdu, B.; Lin, X.; Xu, C.; Lou, Y.; et al. TMEM166/EVA1A interacts with ATG16L1 and induces autophagosome formation and cell death. Cell Death Dis. 2016, 7, e2323. [Google Scholar] [CrossRef] [PubMed]
- Zhen, Y.; Zhao, R.; Wang, M.; Jiang, X.; Gao, F.; Fu, L.; Zhang, L.; Zhou, X.L. Flubendazole elicits anti-cancer effects via targeting EVA1A-modulated autophagy and apoptosis in Triple-negative Breast Cancer. Theranostics 2020, 10, 8080–8097. [Google Scholar] [CrossRef]
- Yang, J.; Wang, B.; Xu, Q.; Yang, Y.; Hou, L.; Yin, K.; Guo, Q.; Hua, Y.; Zhang, L.; Li, Y.; et al. TMEM166 inhibits cell proliferation, migration and invasion in hepatocellular carcinoma via upregulating TP53. Mol. Cell Biochem. 2021, 476, 1151–1163. [Google Scholar] [CrossRef]
- Ren, W.W.; Li, D.D.; Chen, X.; Li, X.L.; He, Y.P.; Guo, L.H.; Liu, L.N.; Sun, L.P.; Zhang, X.P. MicroRNA-125b reverses oxaliplatin resistance in hepatocellular carcinoma by negatively regulating EVA1A mediated autophagy. Cell Death Dis. 2018, 9, 547. [Google Scholar] [CrossRef]
- Chang, Y.; Li, Y.; Hu, J.; Guo, J.; Xu, D.; Xie, H.; Lv, X.; Shi, T.; Chen, Y. Adenovirus vector-mediated expression of TMEM166 inhibits human cancer cell growth by autophagy and apoptosis in vitro and in vivo. Cancer Lett. 2013, 328, 126–134. [Google Scholar] [CrossRef] [PubMed]
- Zhao, S.; Wang, H. EVA1A Plays an Important Role by Regulating Autophagy in Physiological and Pathological Processes. Int. J. Mol. Sci. 2021, 22, 6181. [Google Scholar] [CrossRef] [PubMed]
- Zhong, L.; Zhou, J.; Chen, X.; Liu, J.; Liu, Z.; Chen, Y.; Bai, Y. Quantitative proteomics reveals EVA1A-related proteins involved in neuronal differentiation. Proteomics 2017, 17, 294. [Google Scholar] [CrossRef]
- Lin, X.; Cui, M.; Xu, D.; Hong, D.; Xia, Y.; Xu, C.; Li, R.; Zhang, X.; Lou, Y.; He, Q.; et al. Liver-specific deletion of Eva1a/Tmem166 aggravates acute liver injury by impairing autophagy. Cell Death Dis. 2018, 9, 768. [Google Scholar] [CrossRef]
- Zhang, S.; Lin, X.; Li, G.; Shen, X.; Niu, D.; Lu, G.; Fu, X.; Chen, Y.; Cui, M.; Bai, Y. Knockout of Eva1a leads to rapid development of heart failure by impairing autophagy. Cell Death Dis. 2017, 8, e2586. [Google Scholar] [CrossRef] [Green Version]
- Xicoy, H.; Wieringa, B.; Martens, G.J. The SH-SY5Y cell line in Parkinson’s disease research: A systematic review. Mol. Neurodegener 2017, 12, 10. [Google Scholar] [CrossRef]
- Herzig, S.; Shaw, R.J. AMPK: Guardian of metabolism and mitochondrial homeostasis. Nat. Rev. Mol. Cell Biol. 2018, 19, 121–135. [Google Scholar] [CrossRef] [PubMed]
- Enogieru, A.B.; Haylett, W.; Hiss, D.C.; Ekpo, O.E. Regulation of AKT/AMPK signaling, autophagy and mitigation of apoptosis in Rutin-pretreated SH-SY5Y cells exposed to MPP. Metab. Brain Dis. 2021, 36, 315–326. [Google Scholar] [CrossRef] [PubMed]
- Jhuo, C.F.; Hsieh, S.K.; Chen, C.J.; Chen, W.Y.; Tzen, J.T.C. Teaghrelin Protects SH-SY5Y Cells against MPP+-Induced Neurotoxicity through Activation of AMPK/SIRT1/PGC-1α and ERK1/2 Pathways. Nutrients 2020, 12, 3665. [Google Scholar] [CrossRef]
- Zhong, J.; Xie, J.; Xiao, J.; Li, D.; Xu, B.; Wang, X.; Wen, H.; Zhou, Z.; Cheng, Y.; Xu, J.; et al. Inhibition of PDE4 by FCPR16 induces AMPK-dependent autophagy and confers neuroprotection in SH-SY5Y cells and neurons exposed to MPP+-induced oxidative insult. Free Radic. Biol. Med. 2019, 135, 87–101. [Google Scholar] [CrossRef]
- Jovanovic-Tucovic, M.; Harhaji-Trajkovic, L.; Dulovic, M.; Tovilovic-Kovacevic, G.; Zogovic, N.; Jeremic, M.; Mandic, M.; Kostic, V.; Trajkovic, V.; Markovic, I. AMP-activated protein kinase inhibits MPP+-induced oxidative stress and apoptotic death of SH-SY5Y cells through sequential stimulation of Akt and autophagy. Eur. J. Pharmacol 2019, 863, 172677. [Google Scholar] [CrossRef]
- Wieckowski, M.R.; Giorgi, C.; Lebiedzinska, M.; Duszynski, J.; Pinton, P. Isolation of mitochondria-associated membranes and mitochondria from animal tissues and cells. Nat. Protoc. 2009, 4, 1582–1590. [Google Scholar] [CrossRef]
- Zhou, J.; Xue, Z.; He, H.N.; Liu, X.; Yin, S.Y.; Wu, D.Y.; Zhang, X.; Schatten, H.; Miao, Y.L. Resveratrol delays postovulatory aging of mouse oocytes through activating mitophagy. Aging 2019, 11, 11504–11519. [Google Scholar] [CrossRef]
- Cai, Z.; Li, C.F.; Han, F.; Liu, C.; Zhang, A.; Hsu, C.C.; Peng, D.; Zhang, X.; Jin, G.; Rezaeian, A.H.; et al. Phosphorylation of PDHA by AMPK Drives TCA Cycle to Promote Cancer Metastasis. Mol. Cell 2020, 80, 263–278.e267. [Google Scholar] [CrossRef]
- Subramaniam, S.R.; Chesselet, M.F. Mitochondrial dysfunction and oxidative stress in Parkinson’s disease. Prog. Neurobiol. 2013, 106, 17–32. [Google Scholar] [CrossRef] [Green Version]
- Qi, H.; Shen, D.; Jiang, C.; Wang, H.; Chang, M. Ursodeoxycholic acid protects dopaminergic neurons from oxidative stress via regulating mitochondrial function, autophagy, and apoptosis in MPTP/MPP+-induced Parkinson’s disease. Neurosci. Lett. 2021, 741, 135493. [Google Scholar] [CrossRef] [PubMed]
- Zhuang, X.X.; Wang, S.F.; Tan, Y.; Song, J.X.; Zhu, Z.; Wang, Z.Y.; Wu, M.Y.; Cai, C.Z.; Huang, Z.J.; Tan, J.Q.; et al. Pharmacological enhancement of TFEB-mediated autophagy alleviated neuronal death in oxidative stress-induced Parkinson’s disease models. Cell Death Dis. 2020, 11, 128. [Google Scholar] [CrossRef] [PubMed]
- Pan, T.; Kondo, S.; Zhu, W.; Xie, W.; Jankovic, J.; Le, W. Neuroprotection of rapamycin in lactacystin-induced neurodegeneration via autophagy enhancement. Neurobiol. Dis. 2008, 32, 16–25. [Google Scholar] [CrossRef] [PubMed]
- Lizama, B.N.; Chu, C.T. Neuronal autophagy and mitophagy in Parkinson’s disease. Mol. Aspects Med. 2021, 82, 100972. [Google Scholar] [CrossRef]
- Anantharam, V.; Kaul, S.; Song, C.; Kanthasamy, A.; Kanthasamy, A.G. Pharmacological inhibition of neuronal NADPH oxidase protects against 1-methyl-4-phenylpyridinium (MPP+)-induced oxidative stress and apoptosis in mesencephalic dopaminergic neuronal cells. Neurotoxicology 2007, 28, 988–997. [Google Scholar] [CrossRef]
- Chu, A.C.; Ho, P.W.; Kwok, K.H.; Ho, J.W.; Chan, K.H.; Liu, H.F.; Kung, M.H.; Ramsden, D.B.; Ho, S.L. Mitochondrial UCP4 attenuates MPP+—and dopamine-induced oxidative stress, mitochondrial depolarization, and ATP deficiency in neurons and is interlinked with UCP2 expression. Free Radic. Biol. Med. 2009, 46, 810–820. [Google Scholar] [CrossRef]
- Kalivendi, S.V.; Kotamraju, S.; Cunningham, S.; Shang, T.; Hillard, C.J.; Kalyanaraman, B. 1-Methyl-4-phenylpyridinium (MPP+)-induced apoptosis and mitochondrial oxidant generation: Role of transferrin-receptor-dependent iron and hydrogen peroxide. Biochem. J. 2003, 371, 151–164. [Google Scholar] [CrossRef]
- Lee, C.S.; Han, E.S.; Lee, W.B. Antioxidant effect of phenelzine on MPP+-induced cell viability loss in differentiated PC12 cells. Neurochem. Res. 2003, 28, 1833–1841. [Google Scholar] [CrossRef]
- Miwa, H.; Kubo, T.; Morita, S.; Nakanishi, I.; Kondo, T. Oxidative stress and microglial activation in substantia nigra following striatal MPP+. Neuroreport 2004, 15, 1039–1044. [Google Scholar] [CrossRef]
- Zhao, H.; Li, T.; Wang, K.; Zhao, F.; Chen, J.; Xu, G.; Zhao, J.; Li, T.; Chen, L.; Li, L.; et al. AMPK-mediated activation of MCU stimulates mitochondrial Ca2+ entry to promote mitotic progression. Nat. Cell Biol. 2019, 21, 476–486. [Google Scholar] [CrossRef]
- Kumsta, C.; Chang, J.T.; Lee, R.; Tan, E.P.; Yang, Y.; Loureiro, R.; Choy, E.H.; Lim, S.H.Y.; Saez, I.; Springhorn, A.; et al. The autophagy receptor p62/SQST-1 promotes proteostasis and longevity in C. elegans by inducing autophagy. Nat. Commun. 2019, 10, 5648. [Google Scholar] [CrossRef]
- Aparicio, R.; Rana, A.; Walker, D.W. Upregulation of the Autophagy Adaptor p62/SQSTM1 Prolongs Health and Lifespan in Middle-Aged Drosophila. Cell Rep. 2019, 28, 1029–1040.e5. [Google Scholar] [CrossRef] [PubMed]
- Gómez-Suaga, P.; Bravo-San Pedro, J.M.; González-Polo, R.A.; Fuentes, J.M.; Niso-Santano, M. ER-mitochondria signaling in Parkinson’s disease. Cell Death Dis. 2018, 9, 337. [Google Scholar] [CrossRef] [PubMed]
- Perez-Leanos, C.A.; Romero-Campos, H.E.; Dupont, G.; Gonzalez-Velez, V. Reduction of ER-Mitochondria Distance: A Key Feature in Alzheimer’s and Parkinson’s Disease, and During Cancer Treatment. Annu. Int. Conf. IEEE Eng. Med. Biol. Soc. 2021, 2021, 4412–4415. [Google Scholar] [CrossRef] [PubMed]
- Sunanda, T.; Ray, B.; Mahalakshmi, A.M.; Bhat, A.; Rashan, L.; Rungratanawanich, W.; Song, B.J.; Essa, M.M.; Sakharkar, M.K.; Chidambaram, S.B. Mitochondria-Endoplasmic Reticulum Crosstalk in Parkinson’s Disease: The Role of Brain Renin Angiotensin System Components. Biomolecules 2021, 11, 1772. [Google Scholar] [CrossRef]
- Barazzuol, L.; Giamogante, F.; Brini, M.; Calì, T. PINK1/Parkin Mediated Mitophagy, Ca2+ Signalling, and ER-Mitochondria Contacts in Parkinson’s Disease. Int. J. Mol. Sci 2020, 21, 1772. [Google Scholar] [CrossRef]
- Mao, L.; Li, N.; Guo, Y.; Xu, X.; Gao, L.; Xu, Y.; Zhou, L.; Liu, W. AMPK phosphorylates GBF1 for mitotic Golgi disassembly. J. Cell Sci. 2013, 126, 1498–1505. [Google Scholar] [CrossRef]
- Wrighton, K.H. AMPK moonlights in mitosis. Nat. Rev. Mol. Cell Biol. 2012, 13, 64. [Google Scholar] [CrossRef]
- Cheung, Z.H.; Ip, N.Y. Autophagy deregulation in neurodegenerative diseases—Recent advances and future perspectives. J. Neurochem. 2011, 118, 317–325. [Google Scholar] [CrossRef]
- Curry, D.W.; Stutz, B.; Andrews, Z.B.; Elsworth, J.D. Targeting AMPK Signaling as a Neuroprotective Strategy in Parkinson’s Disease. J. Parkinsons Dis. 2018, 8, 161–181. [Google Scholar] [CrossRef] [Green Version]


Publisher’s Note: MDPI stays neutral with regard to jurisdictional claims in published maps and institutional affiliations. |
© 2022 by the authors. Licensee MDPI, Basel, Switzerland. This article is an open access article distributed under the terms and conditions of the Creative Commons Attribution (CC BY) license (https://creativecommons.org/licenses/by/4.0/).
Share and Cite
Liao, Z.; Gong, Z.; Wang, Z.; Yang, W.; Liu, W.; Hou, L.; Liu, X.; Hua, J.; Wang, B.; Li, N. The Degradation of TMEM166 by Autophagy Promotes AMPK Activation to Protect SH-SY5Y Cells Exposed to MPP+. Cells 2022, 11, 2706. https://doi.org/10.3390/cells11172706
Liao Z, Gong Z, Wang Z, Yang W, Liu W, Hou L, Liu X, Hua J, Wang B, Li N. The Degradation of TMEM166 by Autophagy Promotes AMPK Activation to Protect SH-SY5Y Cells Exposed to MPP+. Cells. 2022; 11(17):2706. https://doi.org/10.3390/cells11172706
Chicago/Turabian StyleLiao, Zhaozhong, Zunshuang Gong, Zhe Wang, Weiyan Yang, Wenjing Liu, Lin Hou, Xiaokun Liu, Junnan Hua, Bin Wang, and Ning Li. 2022. "The Degradation of TMEM166 by Autophagy Promotes AMPK Activation to Protect SH-SY5Y Cells Exposed to MPP+" Cells 11, no. 17: 2706. https://doi.org/10.3390/cells11172706
APA StyleLiao, Z., Gong, Z., Wang, Z., Yang, W., Liu, W., Hou, L., Liu, X., Hua, J., Wang, B., & Li, N. (2022). The Degradation of TMEM166 by Autophagy Promotes AMPK Activation to Protect SH-SY5Y Cells Exposed to MPP+. Cells, 11(17), 2706. https://doi.org/10.3390/cells11172706