Article

The Properties of Proinflammatory Ly6Chi Monocytes Are Differentially Shaped by Parasitic and Bacterial Liver Infections

1
Department of Molecular Parasitology and Immunology, Bernhard Nocht Institute for Tropical Medicine, 20359 Hamburg, Germany
2
Institute for Immunology, University Medical Center Hamburg-Eppendorf, 20246 Hamburg, Germany
3
Bioinformatic Facility, University Medical Center Hamburg-Eppendorf, 20246 Hamburg, Germany
*
Author to whom correspondence should be addressed.
These authors contributed equally to this work.
Cells 2022, 11(16), 2539; https://doi.org/10.3390/cells11162539
Submission received: 27 July 2022 / Revised: 11 August 2022 / Accepted: 12 August 2022 / Published: 16 August 2022
(This article belongs to the Section Cellular Immunology)

Abstract

:
In the past, proinflammatory CD11b+Ly6Chi monocytes were predominantly considered as a uniform population. However, recent investigations suggests that this population is far more diverse than previously thought. For example, in mouse models of Entamoeba (E.) histolytica and Listeria (L.) monocytogenes liver infections, it was shown that their absence had opposite effects. In the former model, it ameliorated parasite-dependent liver injury, whereas in the listeria model it exacerbated liver pathology. Here, we analyzed Ly6Chi monocytes from the liver of both infection models at transcriptome, protein, and functional levels. Paralleled by E. histolytica- and L. monocytogenes-specific differences in recruitment-relevant chemokines, both infections induced accumulation of Ly6C+ monocytes at infection sites. Transcriptomic analysis revealed a high similarity between monocytes from naïve and parasite-infected mice and a clear proinflammatory phenotype of listeria-induced monocytes. This was further reflected by the upregulation of M2-related transcription factors (e.g., Mafb, Nr4a1, Fos) and higher CD14 expression by Ly6Chi monocytes in the E. histolytica infection model. In contrast, monocytes from the listeria infection model expressed M1-related transcription factors (e.g., Irf2, Mndal, Ifi204) and showed higher expression of CD38, CD74, and CD86, as well as higher ROS production. Taken together, proinflammatory Ly6Chi monocytes vary considerably depending on the causative pathogen. By using markers identified in the study, Ly6Chi monocytes can be further subdivided into different populations.

1. Introduction

Monocytes are a type of mononuclear phagocyte that, as cells of the innate immune system, are part of the initial immune response to invading pathogens [1]. Under homeostatic conditions, monocytes patrol the blood stream, replenish macrophage pools in tissues, and are recruited rapidly to sites of infection and inflammation [2,3]. Egress from the bone marrow is mediated mainly by C-C chemokine receptor 2 (CCR2), which binds to CCL2 secreted by cells in injured or infected tissue [4,5].
Once in the tissues, these cells shape the inflammatory milieu via expression of pro- or anti-inflammatory cytokines, phagocytic activity, and antigen presentation; they can also differentiate into macrophages [3,6]. However, monocytes can trigger immunopathology when inadequately controlled [7,8]. Murine monocytes are mostly identified as CD11b+ Ly6C+ Ly6G cells and are commonly divided into two major subsets: proinflammatory CD11b+Ly6Chi and anti-inflammatory CD11b+Ly6Clo monocytes [9,10]. They can be further subdivided according to the expression of CCR2 and CX3CR1: Ly6Chi CCR2hi CX3CR1int (proinflammatory) and Ly6Clo CX3CR1hi CCR2- (anti-inflammatory), although the usage of CX3CR1 is presently questioned [11]. Fate mapping and single cell approaches revealed the priming of Ly6Chi monocytes towards a neutrophil-like monocyte (nMO) or dendritic cell-like monocyte (dcMO) phenotype under steady state conditions, and to Cxcl10+ and Saa3+ monocytes in pathogenic conditions [12,13,14]. In two murine models of liver infection, the absence of Ly6Chi monocytes results in opposite disease outcomes. In the murine model of hepatic amebiasis, intrahepatic infection with the protozoan parasite E. histolytica results (as in humans) in focal liver destruction (18). This type of liver damage, also termed amebic liver abscess (ALA), is almost abolished in mice with a Ccr2 knockout (Ccr2-/-) or in mice in which monocyte were immunodepleted, suggesting an immunopathologic role for inflammatory monocytes (14). This liver damage also depends on inflammatory factors and can be inhibited by a specific blockade of TNF-α or by general immunosuppression [15,16]. By contrast, in the murine model of L. monocytogenes infection, monocytes play a protective role, as indicated by the higher bacterial load and increased granuloma formation in the liver of Ccr2-/- mice (18).
The aim of this study was to characterize liver Ly6Chi monocyte subsets from both infection models with regard to their histological localization within infected liver areas, their transcriptome and surface marker expression, and their production of reactive oxygen species (ROS). This study revealed functionally distinct inflammatory Ly6Chi monocytes in these two infection models and identified a novel combination of a transcription factor and surface markers that allow to distinguish proinflammatory monocyte subsets during inflammatory states.

2. Materials and Methods

2.1. Mice

All murine studies complied with relevant ethical regulations for animal testing and research. Animal experiments were performed in accordance with the German animal protection laws and were reviewed by the federal health authorities of the State of Hamburg in accordance with the ARRIVE guidelines (N082/2018). C57BL/6J (WT) and Ccr2-/- [17] were bred and kept in individually ventilated cages under specific pathogen-free conditions at the animal facility at the Bernhard Nocht Institute for Tropical Medicine, Cd38-/- [18] mice were kept in the facility of the University Medical Center Hamburg-Eppendorf. The mice were kept with a day/night cycle of 12 h, humidity of 50–60%, and a temperature of 21 °C. Mice were euthanized with CO2 with a replacement rate of 20–30% of the cage volume per minute, followed by cervical dislocation and cardiac puncture.

2.2. Infection of Mice with E. histolytica and L. monocytogenes

Male C57BL/6 mice (aged 8–12 weeks) were used for infections. Briefly, 2 × 10⁵ trophozoites of the highly pathogenic clone B2, generated from cell line B (HM-1:IMSS), were suspended in 20 µL of incomplete TYI-S-33 medium and injected into the left liver lobe, as described previously [19]. Abscess size was calculated as % abscessed left liver lobe. Mice were infected with 2 × 10⁴ L. monocytogenes strain EGD or 1 × 10⁷ L. monocytogenesactA in 200 µL PBS via the lateral tail vein. Bacterial inoculi were controlled by plating serial dilutions on tryptic soy broth agar plates at 37 °C.

2.3. Immunohistochemistry

Liver tissue from E. histolytica- or L. monocytogenes-infected mice were fixed in formalin (4%) and embedded in paraffin. Sections (0.2 µm) were stained with H&E or immunostained with antibodies specific for CD11b (EPR1344; 1:1000) and Ly6C (ER-MP20; 1:400) using standard procedures. Antibodies were detected using DCS SuperVision Single Species horseradish peroxidase (HRP)-Polymer (Innovative Diagnostic-Systems) and sections were then counterstained with hemalaun.

2.4. Cytokine Measurement

Liver tissue from naïve and infected mice was homogenized using a 70 µm cell strainer and 1mL of lysis buffer (0.05% Tween 20; one tablet Protease inhibitor (Roche) per 50 mL) and centrifuged (10.000× g, 10 min, 4 °C). The supernatant was used for cytokine analysis using a customized LegendPLEX kit (CCL2, CCL3, TNF-α, IL-1β, IFN-γ, IL-10, IL-13; BioLegend, San Diego, CA, USA).

2.5. Detection of Reactive Oxygen Species

CM-H2DCFDA staining reagent (Thermo Fisher, Waltham, MA, USA, C6827) was used for staining ROS. A stock solution (50 µg/100 µL Ethanol) was prepared, diluted 1:100 in DPBS (PAN Biotech, Aidenbach, Germany, P04-361000) and added to 1.5–2.0 × 10⁶ pelleted immune cells. After 30 min at 37 °C, the cells were washed twice, diluted in antibody staining solution, and measured by flow cytometry.

2.6. RNA Sequencing and Data Analysis

Hepatic monocytes of E. histolytica- or L. monocytogenes-infected C57BL/6 mice were sorted on the indicated days p.i., with a purity of 80–85% and surface staining was performed using CD11b (APC-Cy7; Ly6C (FITC) and Ly6G (APC). Cells were then sorted into collection tubes containing 2 mL of RNAprotect cell reagent (Qiagen). RNA was isolated using the RNeasy Plus Micro Kit (Qiagen) and RNA integrity was analyzed using an Agilent 6000 Pico Kit and an Agilent 2100 Bioanalyzer (Agilent). Samples used for transcriptome sequencing fulfilled the following criteria: total RNA ≥ 200 ng (≥20 ng/µL); RNA integrity number (RIN) ≥7.0, 28S/18S ≥ 1.0. RNA library preparation and sequencing were performed by BGI Genomics, China. The data comprised paired-end short reads. All raw data were aligned to the mouse reference genome GRCm38 Ensembl 85 and the corresponding Gencode annotation using STAR [20] (version 2.5.2a). Differential expression analysis was performed in R (version 3.3.3; R Foundation for Statistical Computing, Austria) using DESeq2 (version 1.13.8) [21]. Reads from different lanes per replicate were combined after checking for the absence of batch effects on a PCA plot. We performed differential gene expression analysis between both infection models within the Ly6Chi and Ly6Clo monocytes respectively using the day after infection as additional co-variate in the DESeq design. To test for differential expression across all three time points (naive, d3 p.i, d5 p.i.), we used a likelihood ratio test for each monocyte group using time point, infection model, and an interaction term for both variables as full design and compared it against the reduced model with the interaction term removed. A threshold of 0.05 for Benjamini–Hochberg corrected p values was used to determine significance by the “statistical overrepresentation test”. Gene set analysis was performed using PANTHER GO-slim (Version 16) [22], with p adj < 0.05. Heatmaps were created using http://heatmapper.ca (accessed on 1 July 2019) combining time points 3 and 5. Volcano plots were made using GraphPad Prism V8.4.3.

2.7. Isolation of Immune Cells and Flow Cytometry

Organs were collected immediately after euthanasia. Mouse blood was collected by cardiac puncture immediately after the mice were euthanized and collected in EDTA-coated tubes. Immune cells were obtained after performing two erythrocyte lysis steps. Hepatic immune cells were isolated using a Percoll gradient. Homogenized liver was suspended in 80% Percoll (GE Healthcare) and overlaid with 40% Percoll diluted in complete RPMI 1640 (Gibco) containing 10% fetal calf serum, L glutamine, and penicillin/streptavidin (cRPMI). After a centrifugation step without brake (800× g; 25 min; 21 °C), cells localized in the interphase of the two Percoll layers were transferred to a new collection tube for further washing steps with PBS and erythrocyte cell lysis. The obtained single cell suspension was washed twice with cRPMI. Spleen cells were separated with a cell strainer (70 µm), centrifuged (300× g) and washed with PBS before two erythrocyte lysis steps. Bone marrow-derived immune cells were collected by flushing out the bone marrow from isolated thighs with a cannula and 2 mL PBS, followed by separation of cells with a cell strainer. Monocytes from spleen and bone marrow were purified using the EasySeptTM Monocyte Isolation Kit (StemCell Technologies) according to the manufacturer’s instructions.
Flow cytometry analysis was performed on immune cells (2 × 10⁶) from liver (Supplementary: blood, bone marrow, spleen). Staining was performed using murine Fc-Blocking solution, followed by fixation of cells in 1% paraformaldehyde. The following antibodies were used:
CD45.1 BUV395 (A20) (Becton Dickinson); CD11b BV510 (M1/70), CD14 BV421 (1Sa14-2), CD38 PeCy7 (90), CD45.2 PeCy5 (30-F11), CD74 AF647 (In1/CD74), CD86 AF700 (GL-1), Ly6C FITC/PE (HK1-4), Ly6G BV785 (1A8) (BioLegend); IRF2 AF488 (sc-374327) and mafb PerCP (OTI1E9) (Novus Biologicals). Analysis was performed on a BD LSR Fortessa and a Cytek Aurora, and data were analyzed using FlowJo software V10.7.1.

2.8. Quantitative RT-PCR

RNA was isolated from liver tissue using TRIzol reagent (Life Technologies, Carlsbad, CA, USA) after chloroform extraction, isopropanol precipitation, and ethanol washing steps. RNA was transcribed into cDNA using Maxima First Strand cDNA Kit (Thermo Fisher Scientific, Waltham, MA, USA). Gene expression levels were calculated using the 2-ddct method and the following primers were used: Ncf1: fwd 5-AAGCTCCTGGATGGCTGGTG-3, rev 5-CCTGGCGCTCACCCTTTGT-3; Rps9: fwd 5-GCTAGACGAGAAGGATCCCC-3, rev 5-TTGCGGACCCTAATGTGACG-3. The annealing temperature was set at 60 °C. The qPCR was performed (in 384 well plates) with Maxima SYBR Green qPCR Master Mix (Thermo Scientific, Waltham, MA, USA) and a Roche LightCycler 480.

2.9. Uniform Manifold Approximation and Projection for Dimension Reduction (UMAP)

Overall, 270,000 cells (90,000 (naïve); 89,999 (L. monocytogenes-infected); 90,000 (E. histolytica-infected) Ly6Chi cells, expressing CD11b, CD14, CD38, CD74, CD86, and IRF2, were used for concatenation according to McInnes et al. (McInnes, L., Healy, J. & Melville, J. UMAP: Stat. Mach. Learn. arXiv Uniform manifold approximation and projection for dimension reduction. preprint arXiv:1802.03426 (2018)).

2.10. Statistical Analysis

Statistical analysis was carried out using either a parametric paired or unpaired two-tailed Student’s t-test (normal distribution) or a nonparametric two-tailed Mann–Whitney test (non-normal distribution). Testing for normal distribution was performed with Shapiro-Wilk and Kolmogorov-Smirnow tests (GraphPad Prism V8.4.3. p values are presented as * p ≤ 0.05, ** p ≤ 0.01, *** p ≤ 0.001, and **** p ≤ 0.0001.

3. Results

3.1. Different Recruitment and Localization of Ly6ChiCD11b+ Monocytes in the Liver following Infection with E. histolytica or L. monocytogenes

Proinflammatory Ly6Chi monocytes exhibit opposite functions in murine models for E. histolytica and L. monocytogenes liver infection. In the former, their absence resulted in the amelioration of parasite-dependent liver damage, whereas in the listeria model it exacerbated liver pathology [16,23]. To better understand the dynamics of monocyte recruitment, we examined hepatic protein concentrations of chemokines involved in these processes such as CCL2 and CCL3. We found a significant increase in CCL2 levels at d3, and an increase in CCL3 levels at d3 and d5 following parasitic infection (Figure 1A). During L. monocytogenes infection, CCL2 levels were higher and increased already at d1 post infection (p.i.), while CCL3 levels were lower than during parasitic infection or in naïve mice (Figure 1A). Additional cytokine analysis revealed significantly elevated expression of IL-1β, IL-10, and IL-13 during E. histolytica infection, as well as increased expression of TNF-α and IFN-γ during L. monocytogenes infection (Figure S1A).
To determine monocyte recruitment, we isolated leukocytes from infected livers and measured the percentage of CD11b+Ly6Chi and CD11b+Ly6Clo monocytes by flow cytometry. At d3 p.i., the CD11b+Ly6Chi monocyte populations increased in both infection models, whereas the CD11b+Ly6Clo monocyte population increased only following E. histolytica infection (Figure 1B; absolute numbers see Figure S1B,C). Staining of paraffin-embedded liver sections from both models (d3p.i.) with hematoxylin and eosin (H&E), anti-CD11b, and anti-Ly6C revealed accumulation of CD11b+ and Ly6C+ cells in a dense margin around the central amebic abscess (Figure 1C) while CD11b+ and Ly6C+ cells accumulated in the center of typical L. monocytogenes-induced granulomas (Figure 1C; controls see Figure S1D).
In both infection models, the increase in CCL2 expression led to an increase in the proportion of Ly6Chi monocytes in the liver, but with different localization in the affected tissue. The protective effect of monocytes from the listeria model already suggests heterogeneity of Ly6Chi monocytes between the two infections.

3.2. Monocytes from Both Infection Models Show Significant Differences in Gene Expression

To gain a deeper understanding of the phenotype of the Ly6Chi monocyte subset during hepatic amebiasis and listeriosis, 3 and 5 days p.i., CD11b+Ly6G-Ly6Chi as well as Ly6Clo monocytes were sorted from infected livers by flow cytometry. The RNA from both populations was extracted and subjected to RNA sequencing (Figure 2A).
Genes showing a significant difference in expression (adjusted p value < 0.05) in monocytes obtained from the two infection models at d3 p.i. were included in the analysis. 5486 genes were differentially expressed in Ly6Chi monocytes from E. histolytica- and L. monocytogenes-infected mice, 54 genes were differentially expressed in Ly6Clo cells from both models, and 194 genes were differentially expressed in both Ly6Chi and Ly6Clo monocytes in both infection models (Figure 2B). PANTHER GO analysis of genes differentially expressed in Ly6Chi monocytes revealed that a small percentage of genes was included in the GO terms “immune systems process” (GO:0002376) and “response to stimulus” (GO:0050896) (Figure 2B). By contrast, we also observed the differential expression of genes associated with GO terms related to immune responses in anti-inflammatory Ly6Clo monocytes (see Figure S2A–D for a detailed list of highly regulated genes and GO terms).
Principal component analysis of Ly6Chi and Ly6Clo monocytes revealed clustering into different groups (Figure 2C). The day post infection did not affect the grouping, however there was a clear difference between Ly6Chi monocytes from L. monocytogenes-infected mice (cluster A) and Ly6Chi monocytes from E. histolytica–infected mice (cluster B): the latter clustered together with Ly6Chi monocytes from naïve mice. Additional differences between Ly6Chi and Ly6Clo from the E. histolytica and the listeria model are also depicted by a volcano-plot and a heat map (see Figure S2E,F). For example, differences include genes involved in proinflammatory IFN-γ related signaling (i.e., Iigp1, Gbp2, and Gbp8) in Ly6Chi monocytes from L. monocytogenes-infected mice, but the upregulation of genes involved in anti-inflammatory, phagocytic, or metabolic processes (Cx3cr1, Mfge8, Hpgd) in Ly6Chi monocytes from E. histolytica-infected mice. Overall, proinflammatory Ly6Chi monocyte in both infection models differed significantly at the transcriptional level. Ly6Chi monocytes from L. monocytogenes infected mice presented an upregulated expression of a large number of genes, including genes with a potential function in their antibacterial response. In contrast, changes in the gene expression of Ly6Chi monocytes from E. histolytica infected mice were less pronounced and a large part of their expression profile was shared with Ly6Chi monocytes from naïve mice.

3.3. Ly6Chi Monocytes from L. monocytogenes-Infected Mice Have an Activated Phenotype and Lower M2 Polarization at the Transcriptional Level Than Ly6Chi Monocytes from E. histolytica-Infected Mice

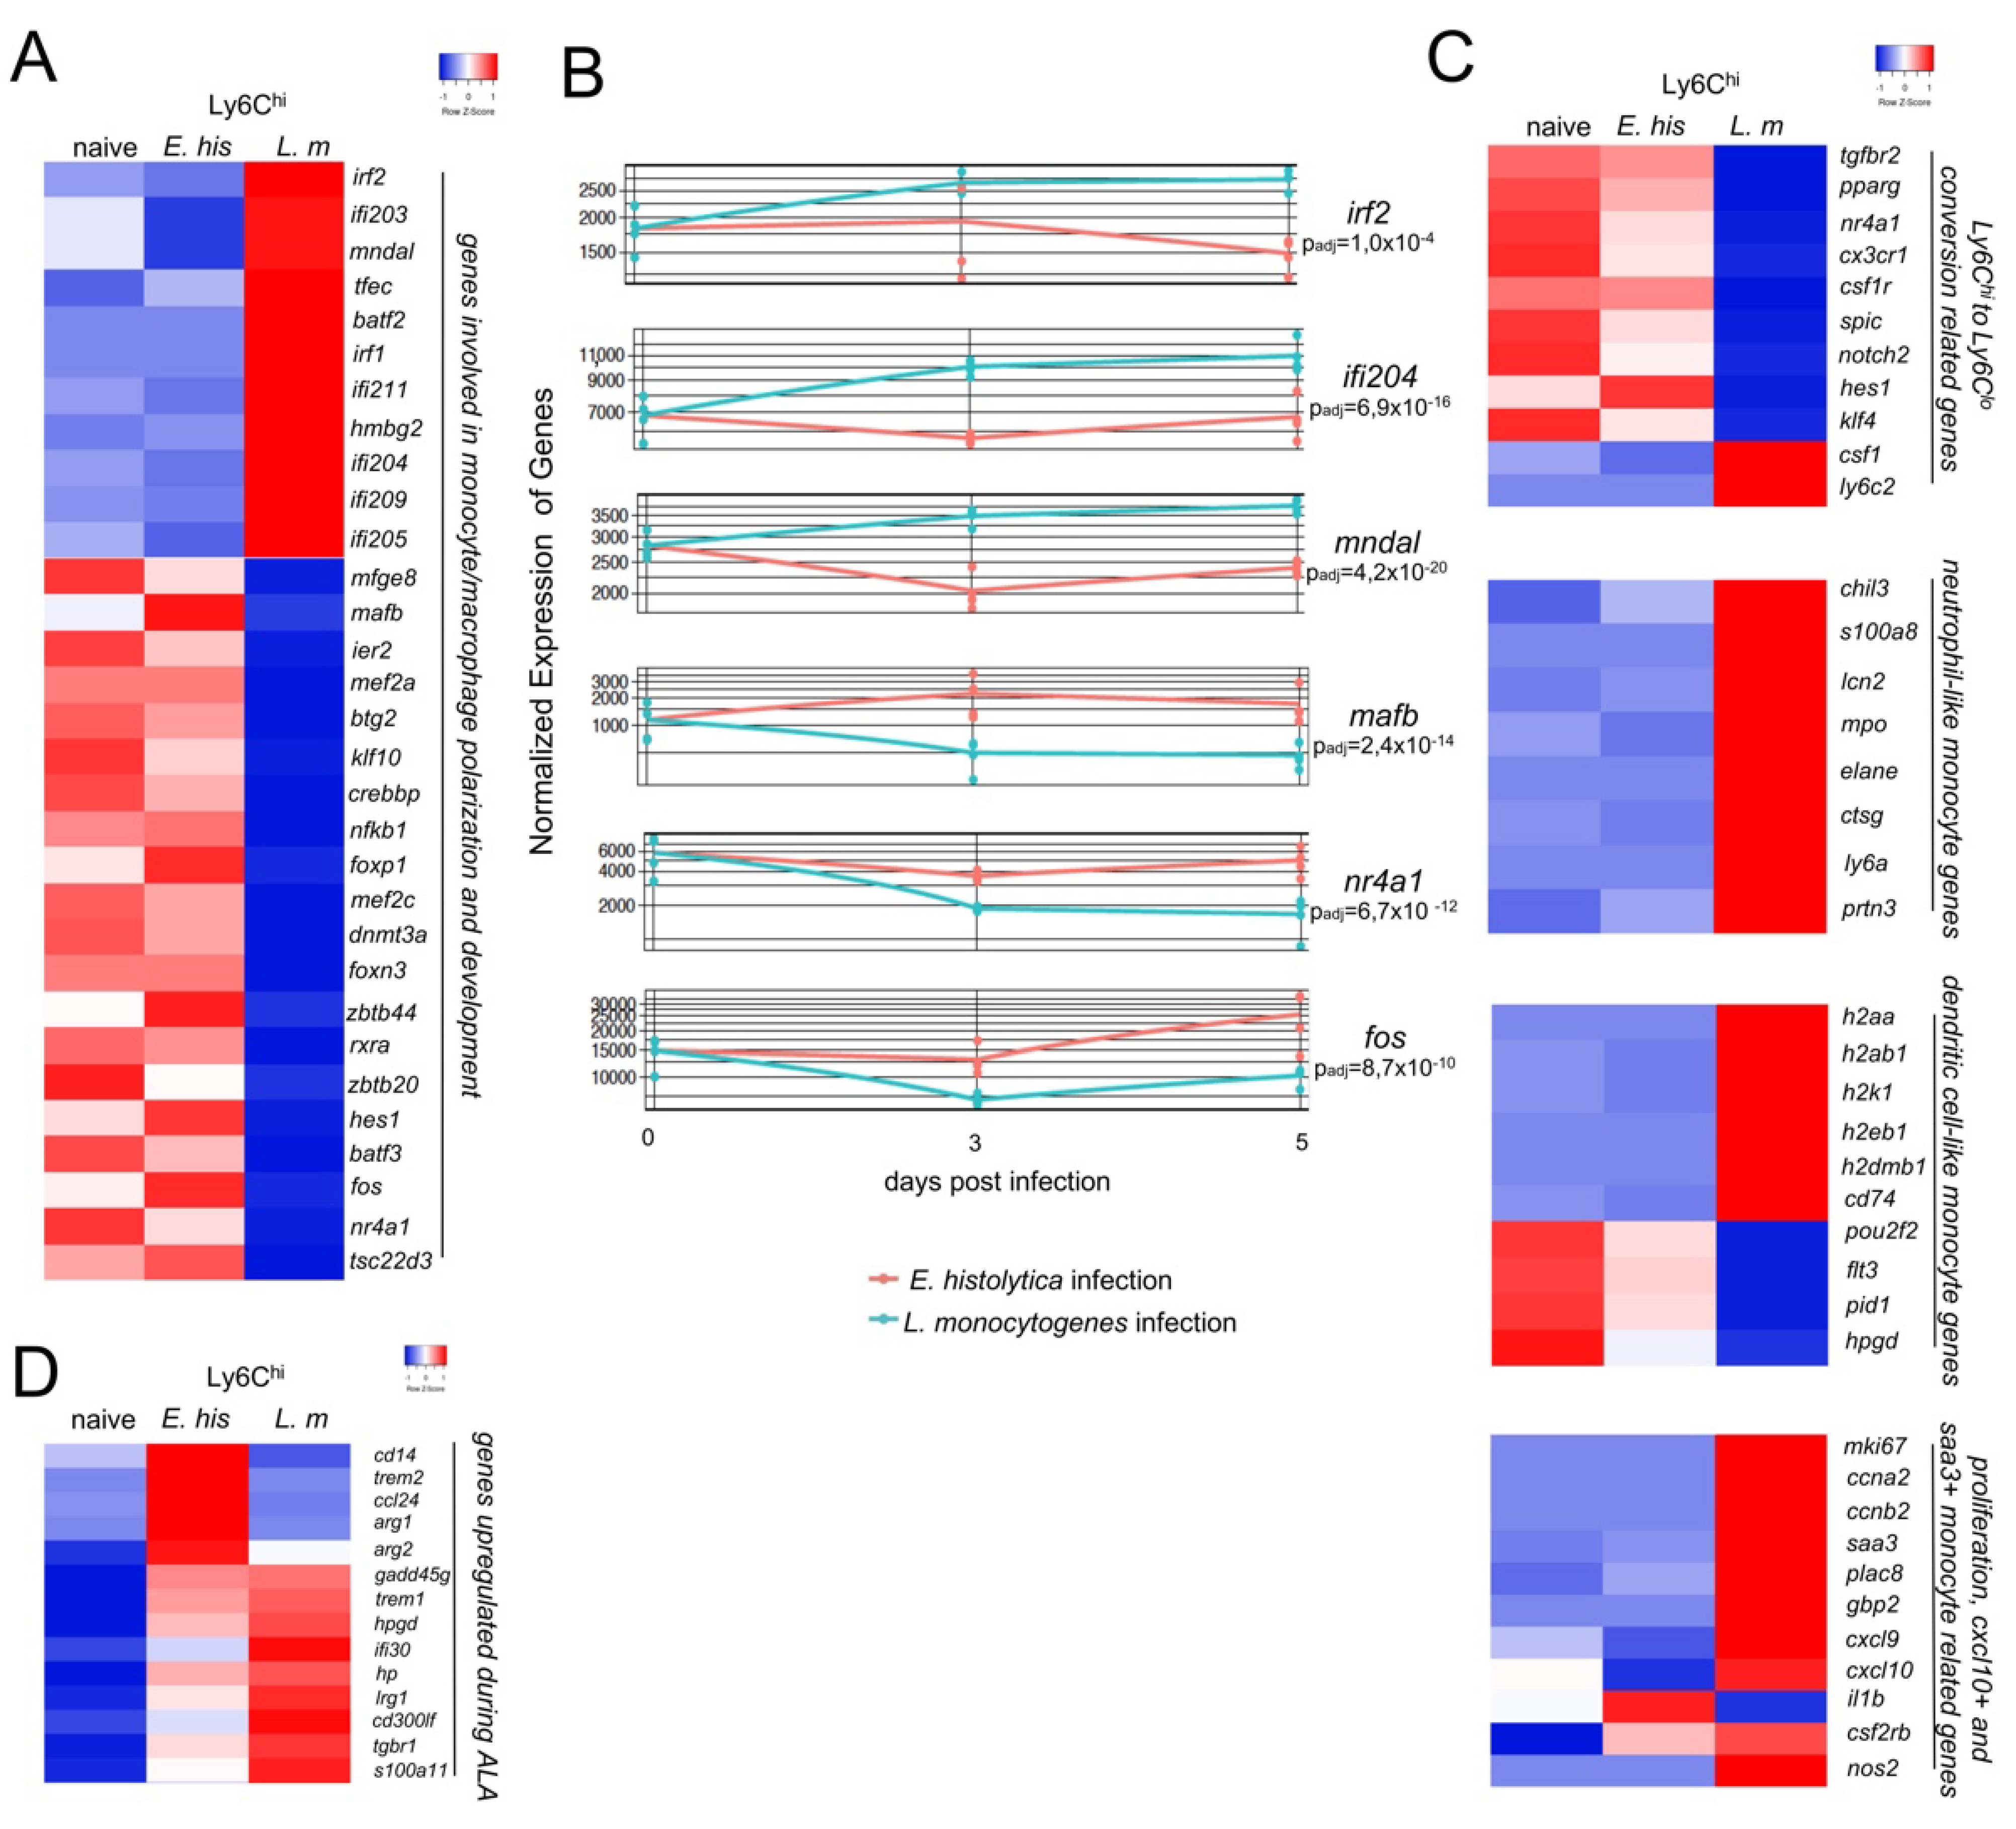
By focusing on transcription factors with putative relevance to the polarization of monocytes towards classically activated M1 or alternatively activated M2 macrophages, we found that during infection with L. monocytogenes, the activation and development of proinflammatory monocytes is characterized by factors, such as Irf1, Irf2, Ifi204, Batf2, Mndal, and Irf7 [24,25,26,27,28] (Figure 3A). By contrast, during E. histolytica infection, Ly6Chi monocytes are characterized by the upregulation of transcription factors Mafb, Hes1, Fos, and Tsc22d3 (Figure 3A), which contribute to an anti-inflammatory and regenerative phenotype [29,30,31,32,33]. Time-course analysis of the expression data shows that, in addition to other genes, a selection of the above factors exhibits significantly different expression patterns between the two infection models, starting as early as d3 p.i. and remaining different until d5 p.i. (Figure 3B).
Fate mapping and transfer approaches have revealed the marked plasticity of proinflammatory monocytes and identified distinct routes of monocyte polarization. Such studies suggest the existence of novel monocyte subsets, such as “Ly6Chi to Ly6Clo”-converting monocytes, nMO, dcMO, and Cxcl10+ and Saa3+ monocytes [12,13,14]. According to this classification, the Ly6Chi monocytes triggered by E. histolytica infection would appear to belong to the Ly6Chi to Ly6Clo-converting monocyte subset. By contrast, with the exception of Csf1 and Ly6c2 (Ly6C), the respective genes were downregulated in monocytes from the L. monocytogenes infection model (Figure 3C) [35]. Relevant genes related to nMO development were upregulated in monocytes from L. monocytogenes-infected mice (Figure 3C). When we considered the genes that define dcMO, we found an intermediate picture. MHC-II related genes were upregulated in monocytes from L. monocytogenes-infected mice. However, some other hallmark genes of dcMO (i.e., Flt3, Pid1, and Hpgd) were strongly downregulated. Moreover, with the exception of il1b, signature genes of Cxcl10+ and Saa3+ monocytes were also upregulated in Ly6Chi monocytes from L. monocytogenes-infected mice, indicating a broad repertoire of putative new Ly6Chi monocyte subsets during this type of infection (Figure 3C). However, several other relevant genes involved in proinflammatory or anti-inflammatory immune processes are additionally upregulated in monocytes following E. histolytica infection. Among these are Cd14, Trem2, a negative immune regulator and marker for M2 polarization [36], as well as Arg1 and Arg2, further indicating the transition from pro-to anti-inflammatory monocytes (Figure 3D).
In summary, we were able to assign monocytes from both infection models to recently suggested subgroups with a more proinflammatory and activated phenotype in the L. monocytogenes model (nMO; dcMO; Cxcl10+ and Saa3+ monocytes) and a scarcely activated phenotype in the parasite model characterizing Ly6Chi to Ly6Clo converting monocytes.

3.4. Surface Marker Expression Implies Pathogen-Dependent Subsets of Proinflammatory Monocytes

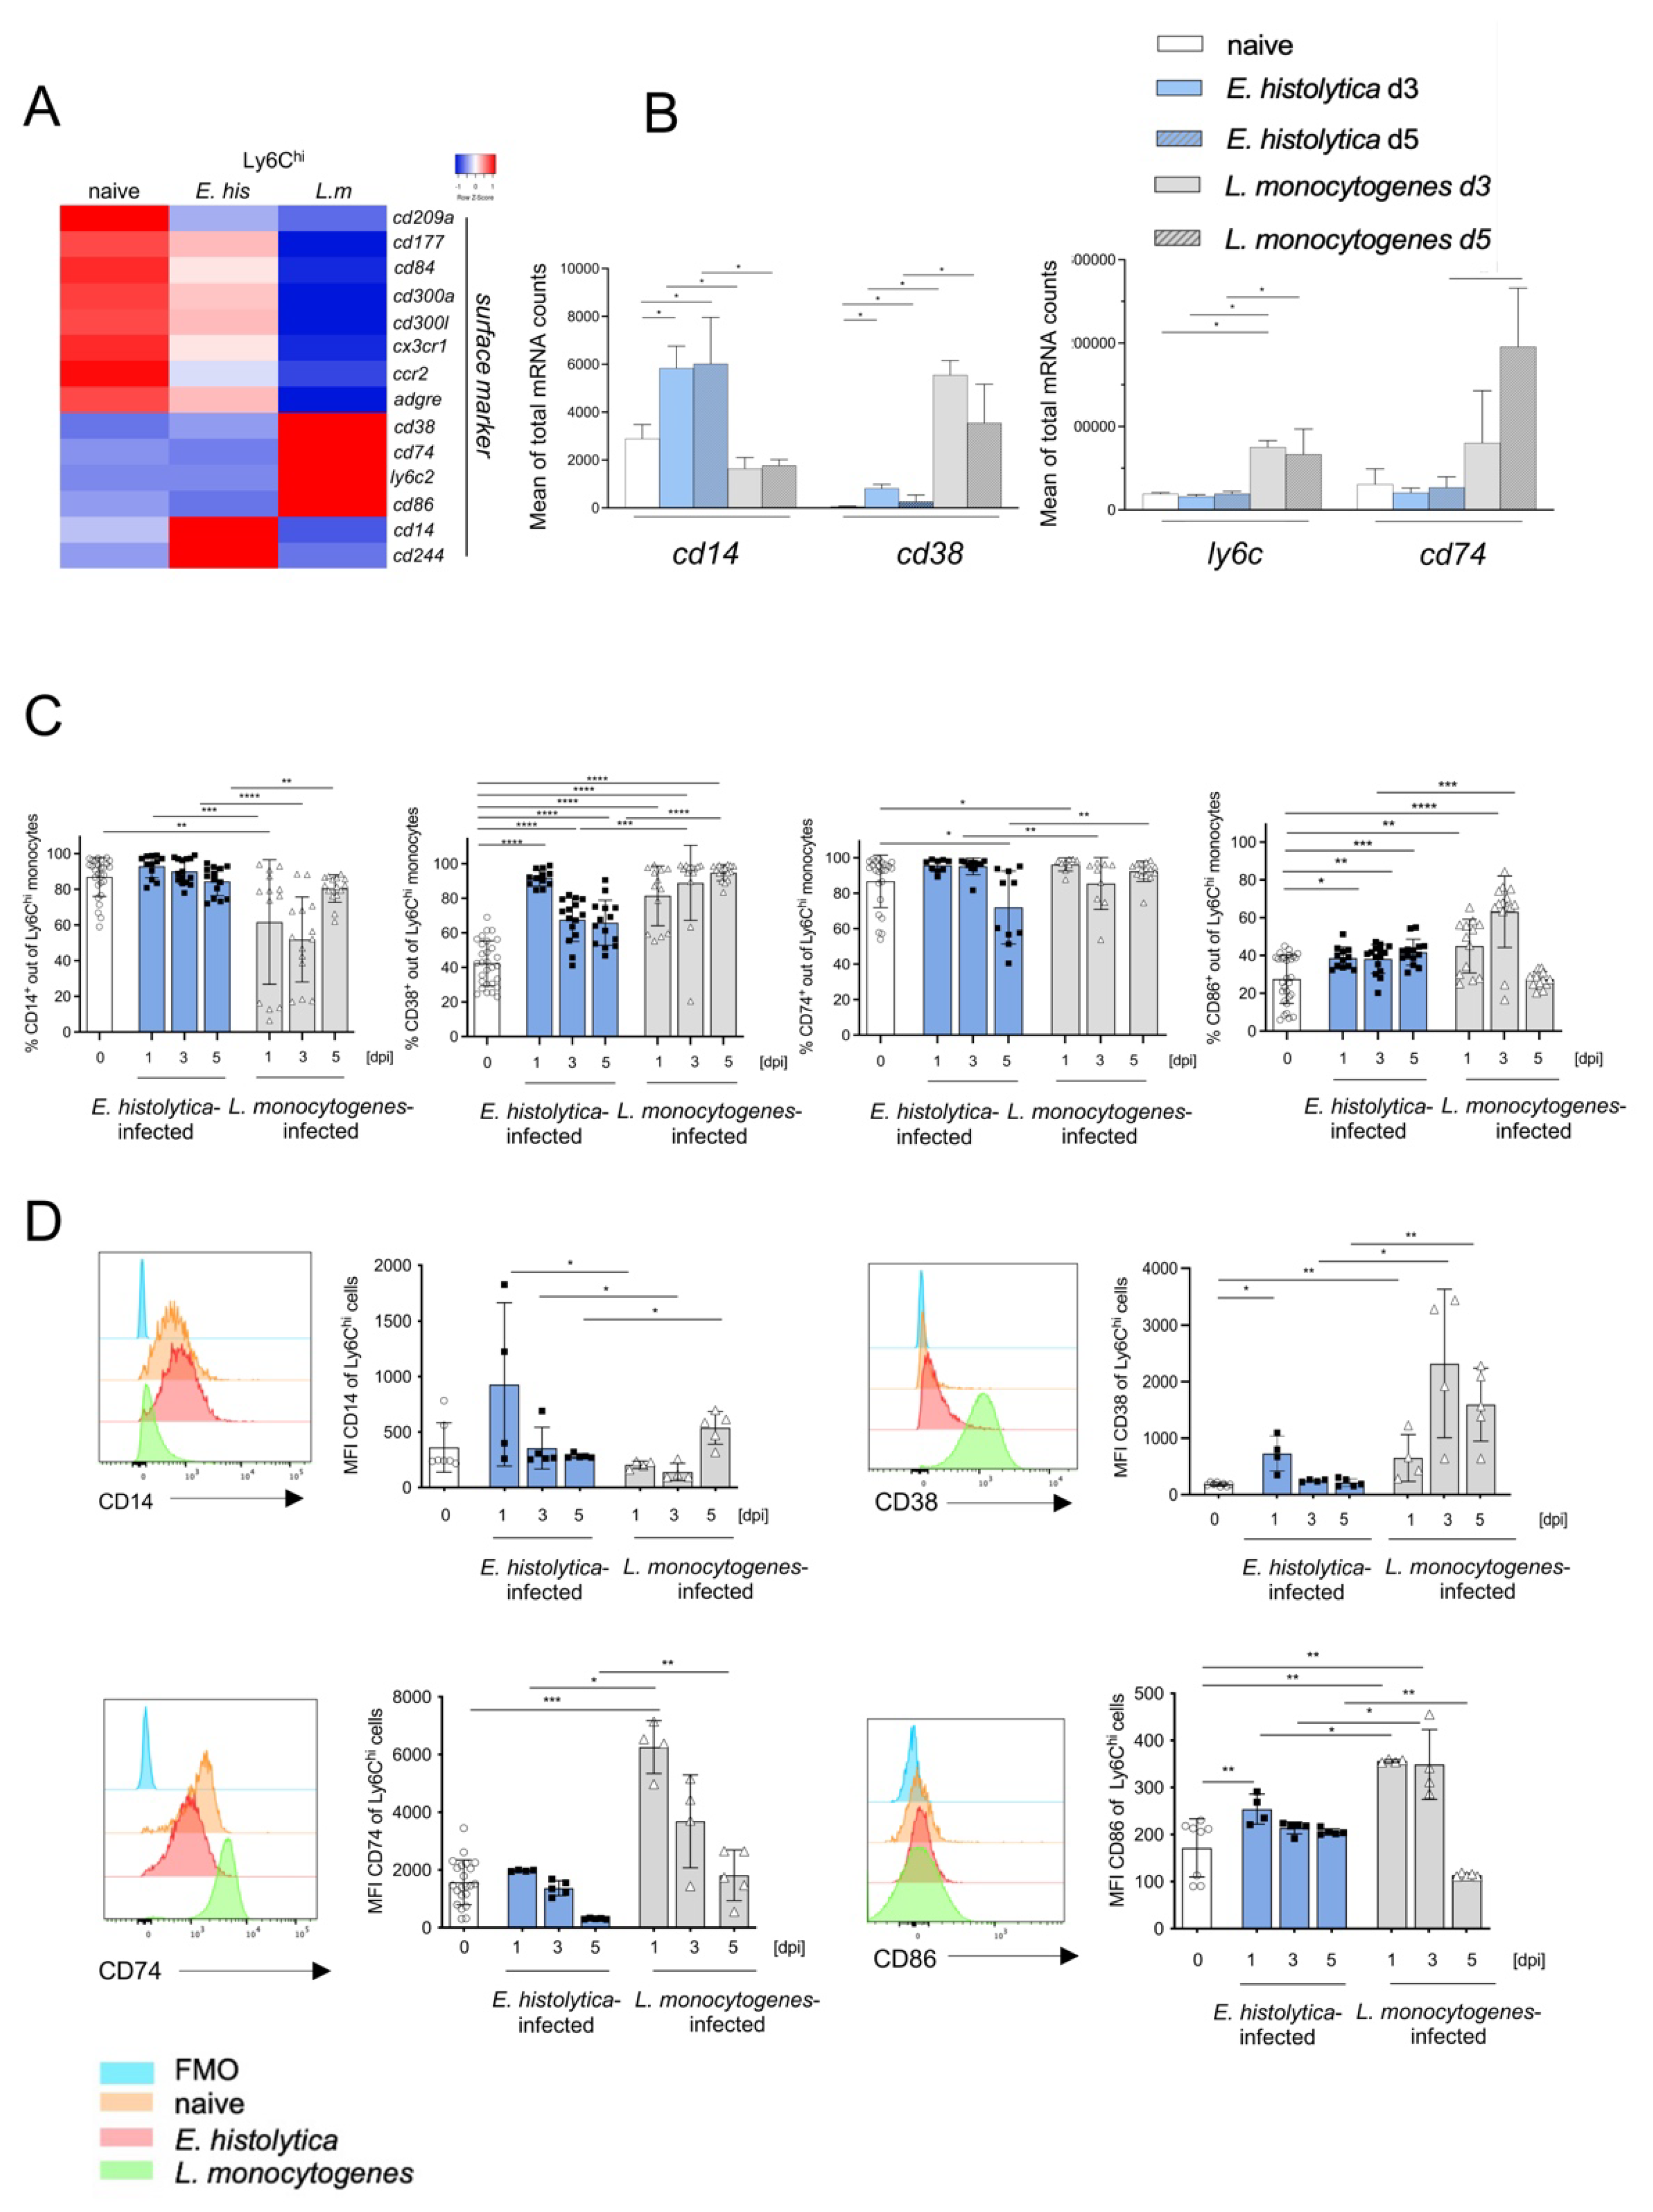
Next, we analyzed the differential expression of genes encoding surface markers that may be useful for further subdivision of Ly6Chi monocytes. We found significant upregulation of genes encoding Ly6c2, Cd38, and Cd74 in Ly6Chi monocytes from L. monocytogenes-infected mice, whereas higher expression of Cd14 was characteristic for Ly6Chi monocytes from E. histolytica-infected mice (Figure 4A,B). The expression of these genes at the protein level on Ly6Chi monocytes from both infection models was validated by flow cytometry. Although not significantly regulated at the transcriptional level, we included the analysis of the co-stimulatory receptor CD86 in the panel to further describe M1 polarization of inflammatory monocyte [37]. As in monocytes from naïve mice and in agreement with the transcriptomic data, we found that the percentage of CD14-expressing Ly6Chi monocytes was higher and remained higher from d1 p.i. on following E. histolytica infection than in Ly6Chi monocytes from L. monocytogenes-infected mice, the latter initially decreased but increased from d5 of infection (Figure 4C). This picture was mirrored by lower MFIs for CD14 on Ly6Chi monocytes derived from the L. monocytogenes model than on monocytes from the E. histolytica model (Figure 4D). When compared with that in uninfected animals, expression of CD38 increased significantly in both models shortly after infection. However, expression was significantly stronger on monocytes from the L. monocytogenes infection model (Figure 4D). Initially, the percentage of CD74-expressing monocytes remained the same as that in naïve mice following E. histolytica infection, but decreased on d5 p.i. (Figure 4C). During L. monocytogenes infection, expression and MFI of CD74 increased on d1 p.i., but then decreased to the level observed in uninfected animals as infection progressed (Figure 4C,D). The expression and MFI level of CD86 also decreased significantly over time during infection with L. monocytogenes, and to a lesser extent this was also true for monocytes in the E. histolytica model (Figure 4C) (expression on monocytes from spleen, blood, bone marrow see Figure S3A–C).
Overall, the results of the transcriptome analysis of surface marker expression, with the exception of CD74, are reflected at the protein level in vivo. Furthermore, they suggest that CD14 in combination with CD38 may be additional putative markers for a Ly6Chi monocyte subset that is very different from the conventional proinflammatory Ly6Chi monocyte subset.
To further differentiate Ly6Chi monocytes, we selected molecules that were shown by transcriptome analysis to be highly expressed by Ly6Chi monocytes after E. histolytica infection (Mafb) or L. monocytogenes infection (Irf2) (Figure 3B). However, MAFB1 protein was excluded from further analysis since less than 1% of Ly6Chi monocytes expressed the protein (data not shown). As seen for mRNA, protein expression of IRF2 was significantly stronger in Ly6Chi monocytes after L. monocytogenes infection than in monocytes from naïve or E. histolytica-infected mice (Figure 5A). On day 3 after infection, when the most severe symptoms in both models appear, the combination of antibodies against IRF2 and CD14 resulted in the detection of a significantly increased monocyte population after E. histolytica infection. When IRF2 detection was combined with the detection of CD38 and CD86, Ly6Chi monocytes after infection with L. monocytogenes were significantly different from those of naive or E. histolytica-infected animals, whereas the combination of IRF2 detection with CD74 did not reveal significantly different monocyte subpopulations between the two infection models (Figure 5B).
After analysis of the distribution of Ly6Chi monocyte subpopulations by UMAP, initially considering only surface markers, clear demarcation of populations by L. monocytogenes and E. histolytica infection and by naïve animals was seen, with overlapping populations of the latter (Figure 5C). When Irf2 was included, 6 distinct clusters were identified (Figure 5D). A distinct IRF2-positive monocyte population and a greater heterogeneity in the area of monocytes from the listeria model and a clear delineation of monocyte populations from naive and E. histolytica-infected animals could be visualized in the UMAP analysis after clustering with FlowSOM and Cluster Explorer analysis (Figure 5D).
In summary, we found that the combination of antibodies against IRF2 with antibodies against CD14, CD38, or CD86 helped to distinguish proinflammatory Ly6Chi monocytes from both infection models, supporting the results of the transcriptome study (Figure 3C) in that these monocytes are already in a transitional stage to anti-inflammatory monocytes.

3.5. CD38+Ly6Chi Monocytes Produce ROS and Contribute to Monocyte-Dependent Immunopathology during Hepatic Amebiasis

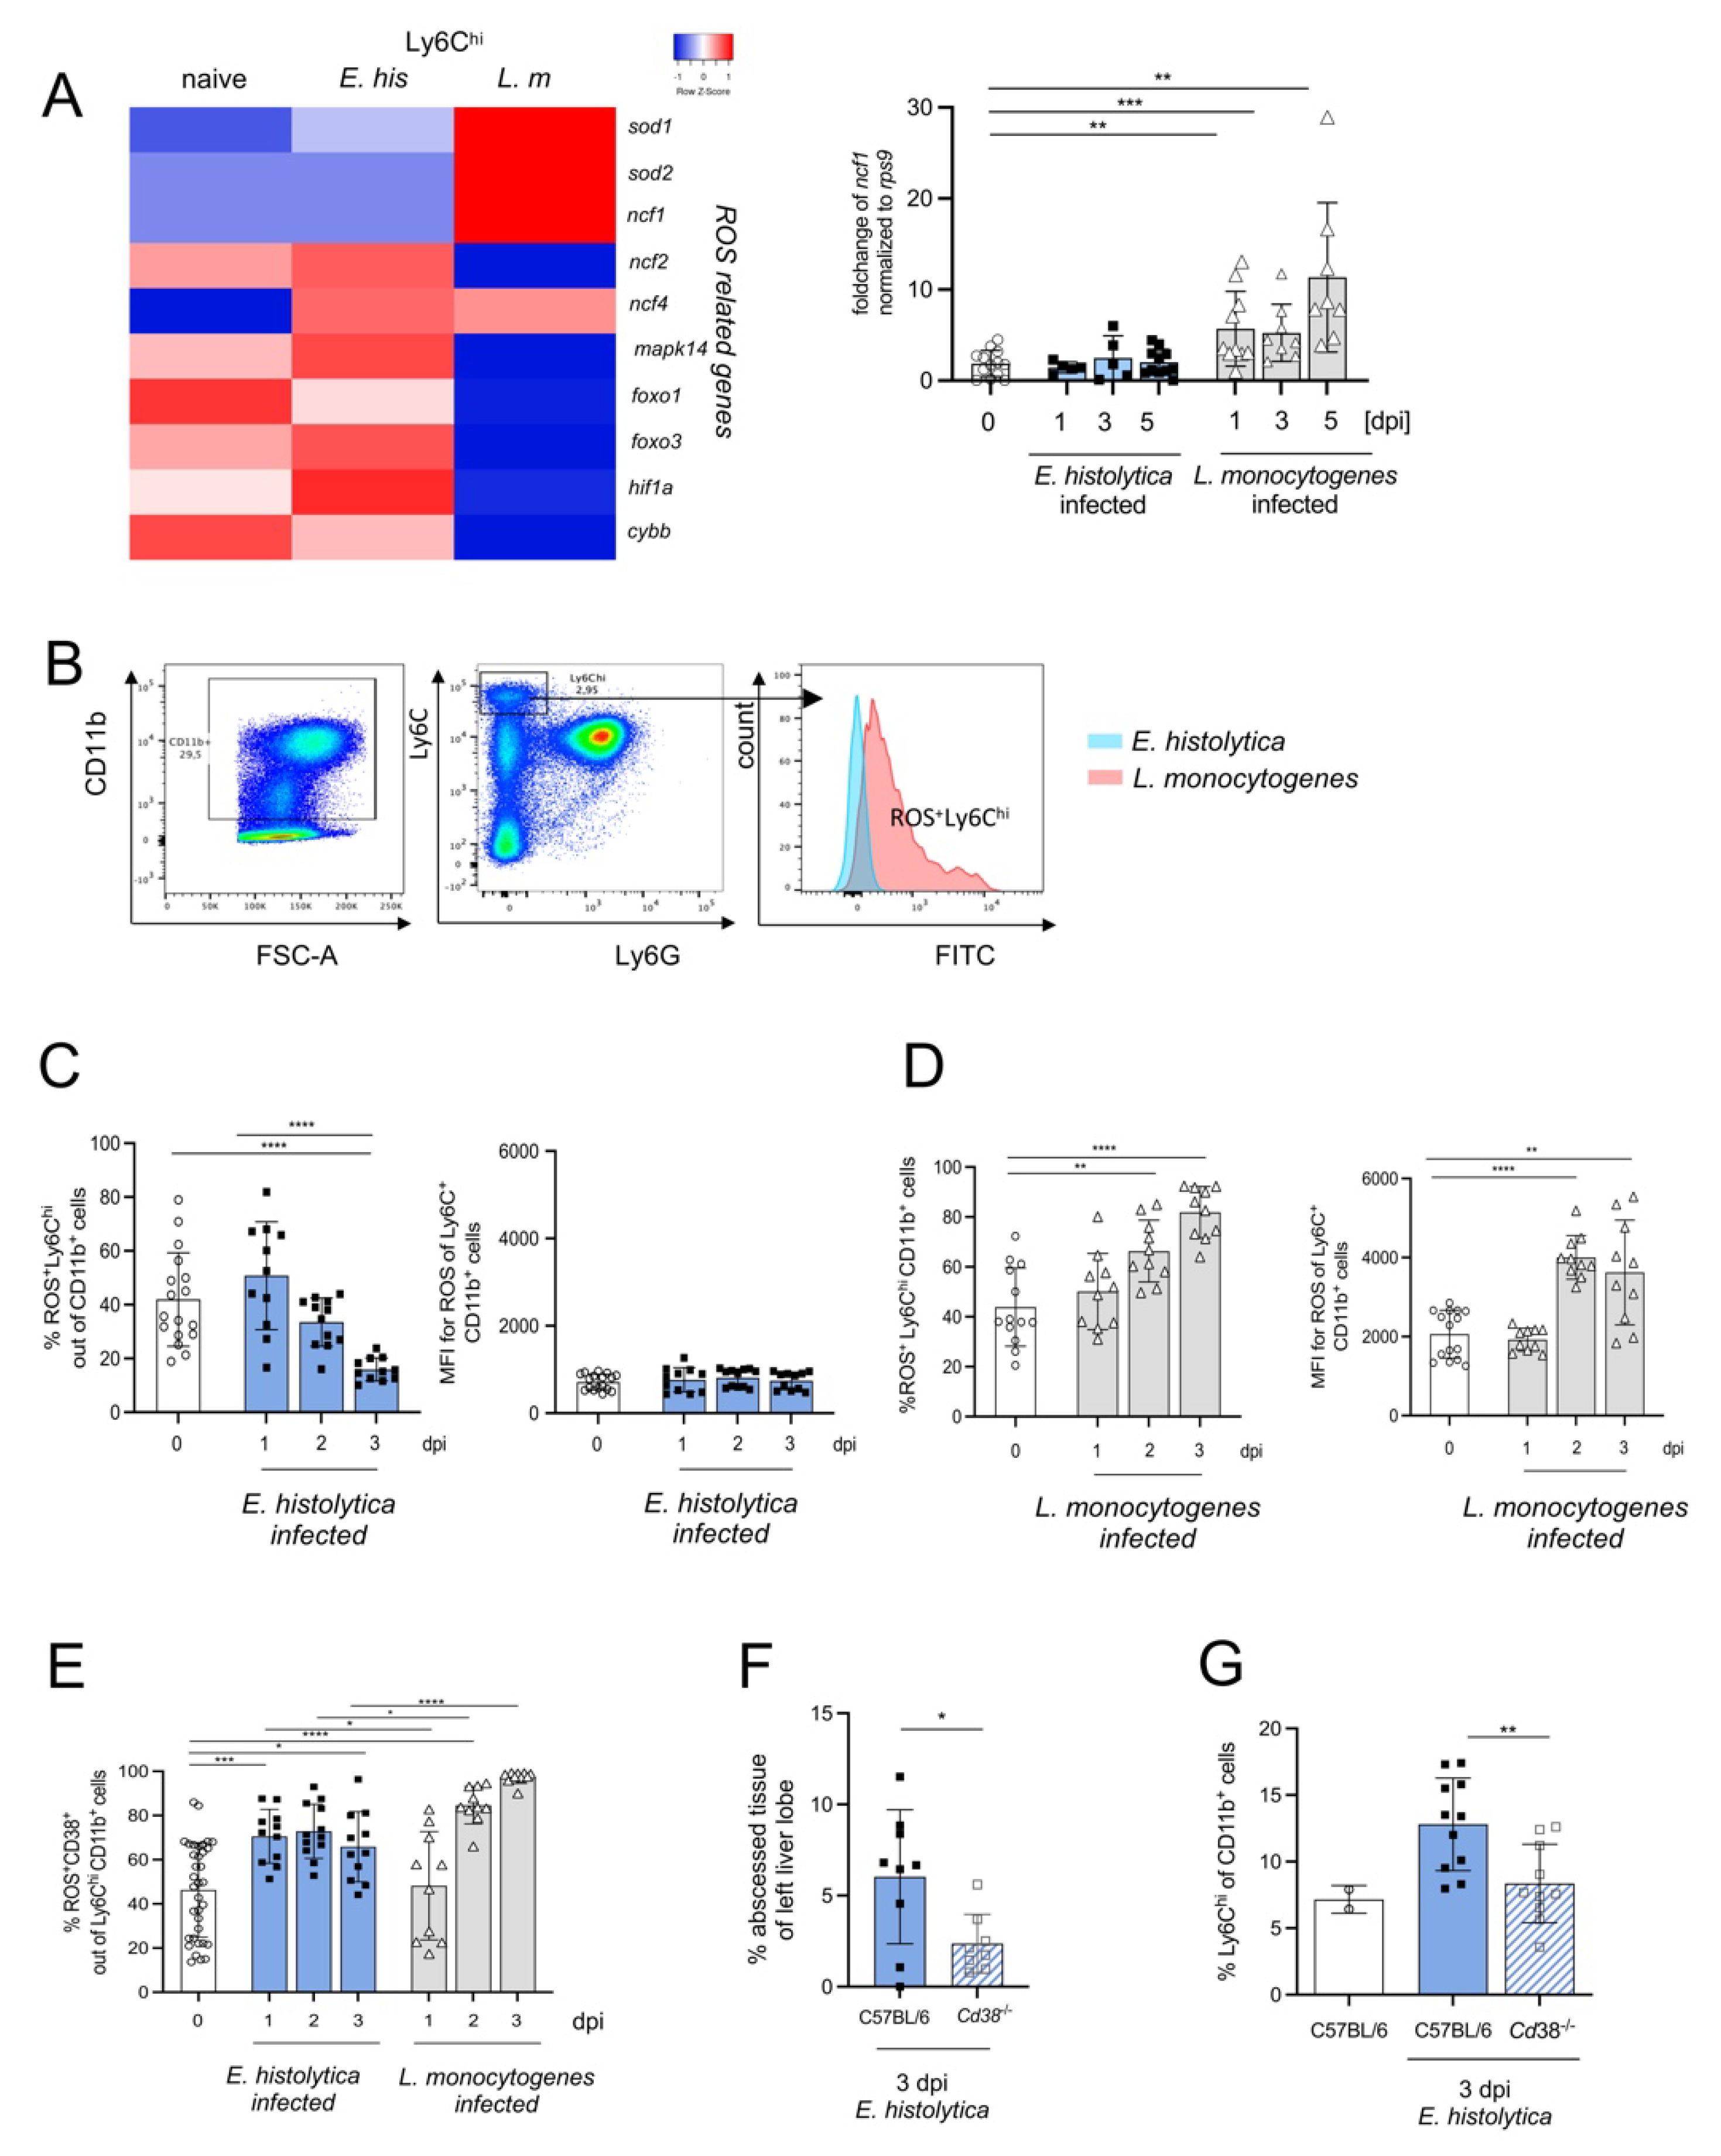
In addition to the production of proinflammatory cytokines and chemical mediators, activated Ly6Chi monocytes also express ROS [38]. Based on the higher mRNA expression of genes involved in ROS production and NADPH oxidase (i.e., Sod1, Sod2, Ncf1, Ncf4 as well as Nox2 and Noxred 1) by Ly6Chi monocytes from L. monocytogenes-infected compared with E. histolytica-infected mice (Figure 6A), we analyzed ROS production by Ly6Chi monocytes in both models (Figure 6B). Consistent with the transcriptomic results, and consistent with a low MFI, the percentage of ROS+Ly6Chi monocytes decreased during E. histolytica infection (Figure 6C) but increased during L. monocytogenes infection (Figure 6D).
To further characterize ROS+ Ly6Chi monocytes, we examined the expression of surface marker CD38, which exhibits various functions during cell activation [39]. Interestingly, although the number of ROS-producing Ly6Chi monocytes decreased during infection with E. histolytica, the percentage of ROS+ CD38+ out of Ly6Chi monocytes increased rapidly, and remained elevated, during infection (Figure 6E).
As expected, the proportion of these cells also increased during infection with L. monocytogenes, but with a delay compared with parasitic infection, and the final proportion was higher (Figure 6E). Next, we used knockout mice lacking CD38 [40,41] to investigate whether CD38+Ly6Chi monocytes contributes to abscess formation during E. histolytica liver infection. Cd38-/- mice had significantly smaller abscesses on d3 p.i. (Figure 6F) and a significantly lower level of proinflammatory monocytes (similar to naïve mice) (Figure 6G).
In summary, ROS-production as well as the expression of CD38 characterizes the true proinflammatory phenotype of Ly6Chi monocytes in both infection models.

4. Discussion

Monocytes are critical for the defense against microbial infections, but also for promoting resolution of inflammation. However, an improper balance of these tasks can lead to the collateral damage of host tissues and delay of tissue regeneration [42].
The rationale for the present study arose from the striking differences in the function of classical proinflammatory Ly6Chi monocytes revealed by Ccr2-/-. Whereas the lack in the egress from the bone marrow and hence the recruitment of Ly6Chi monocyte prevented liver destruction after E. histolytica infection [16], their absence in L. monocytogenes infection exacerbated disease progression [23], pointing to functional differences in this monocyte subset which was originally regarded as homogeneous. Recent studies based on single-cell sequencing actually suggest an even greater diversity. Under conditions of homeostasis three more proinflammatory monocyte subsets: nMO, dcMO [12,13,43,44], and Cxcl10+ and Saa3+ monocytes were identified [14]. Interestingly, all analyzed genes involved in development of nMO were strongly upregulated in proinflammatory monocytes during L. monocytogenes infection, but they were unaffected in monocytes from the amebic model. Enhanced development of Ly6Chi monocytes into nMO has been demonstrated previously, but only under LPS stimulation [45] and the present study is the first to demonstrate its presence in vivo by bacterial infection. Likewise, genes related to MHC-II-mediated antigen presentation and dcMO development were upregulated in listeria infection. However, some factors thought to be important for dcMO development (i.e., Flt3, Pou2f2, Pid1, and Hpgd) were strongly downregulated while their expression by monocytes from the amebiasis model was comparably higher. In addition, genes characteristic for the subset of Cxcl10+ and Saa3+ monocytes that arise under sterile inflammatory conditions (e.g., autoimmune encephalitis) [14] were only upregulated in the listeria model. Taken together, the data suggest that proinflammatory monocytes from L. monocytogenes-infected animals display a distinct proinflammatory phenotype, characterized by the upregulation of genes associated with nMO, dcMO and Cxcl10+ and Saa3+ cells.
Additional relevant transcriptional differences between Ly6Chi monocytes from both models became apparent by examining the expression of selected transcription factors and genes involved in polarization of monocytes. Ly6Chi monocytes from the parasite model exhibited a more anti-inflammatory phenotype and the expression of genes involved in conversion of Ly6Chi monocytes to Ly6Clo monocytes. Altered genes include Nr4a1, a major transcription factor responsible for transition of Ly6Chi to Ly6Clo and survival of Ly6Clo cells [30,46], while Csf1 and Ly6c2, promoting survival and activation of Ly6Chi monocytes, were downregulated [35,47]. Their further polarization towards anti-inflammatory M2 macrophages [9] is supported by the upregulation of MafB, Nr4a1, or Fos [29,30,33]. As already evident from the cluster analysis, Ly6Chi monocytes from the parasite model were overall quite similar to those from naïve animals. However, some genes were differentially regulated, e.g., Arg1/Arg 2, further suggesting an ongoing polarization into an anti-inflammatory M2 phenotype. In contrast, monocytes from the L. monocytogenes infection model were characterized by a classical proinflammatory, interferon-driven transcription factor-like profile (i.e., Mndal, Ifi204 and Irf2) [25,28], pointing towards an M1 phenotype [9].
A suitable antibody panel to distinguish bona fide inflammatory Ly6Chi monocytes from non-inflammatory Ly6Chi monocytes and to study their dynamics of Ly6Chi monocytes in both infection models, was developed by selecting several surface markers that had emerged from transcriptome analysis. These included activation markers such as CD38 [39,40,41], CD74, a receptor for proinflammatory macrophage migration inhibitory factor involved in cell proliferation and antigen presentation [48,49] as well as CD14, co-receptor for several Toll-like receptors involved in proinflammatory processes [50]. While CD38 and CD74 were more highly expressed in Ly6Chi monocytes from the L. monocytogenes infection model, CD14 was the only surface marker with higher expression in Ly6Chi monocytes from the parasite model. Although not differentially expressed on the mRNA level, we included CD86 as an additional proinflammatory M1 marker [41].
The expression of CD14 and CD74 on Ly6Chi monocytes from the parasite model was very similar to those from naïve mice, whereas CD14 in the L. monocytogenes model initially decreased and only increased toward the end of the disease course. CD38 was more highly expressed on monocytes from the parasitic model during the early phase of infection, thus describing inflammatory Ly6Chi before transitioning to Ly6Clo cells. As expected, CD38, CD74, and to a lesser extent CD86 remain highly expressed in Ly6Chi monocytes from the L. monocytogenes model over time, suggesting that these markers are useful for further distinguishing proinflammatory Ly6Chi monocytes. Next, we included the transcription factor IRF2 within the panel. IRF2 in combination with CD14 best distinguishes the Ly6Chi population in the ameba and listeria model from the population in naïve mice at least on day 3 post infection, the peak of liver pathology in these models (Figure 5B). Subsequent UMAP analysis based on the designated surface markers confirmed clear delineation of Ly6Chi monocyte populations between naïve, E. histolytica- and L. monocytogenes-infected mice, as well as the highest diversity of proinflammatory monocyte subpopulations from the L. monocytogenes model. Finally, we used ROS production as a hallmark of proinflammatory monocyte activation [38]. In contrast to the E. histolytica model, where it remained stable, we observed a continuous increase in ROS-producing Ly6Chi monocytes expressing CD38 in the listeria model. Up-regulation of CD38 on monocytes during infection with listeria has been described previously [39]. Interestingly, genetic deletion of CD38 resulted in increased accumulation of inflammatory monocytes in the liver but not in the spleen and was associated with higher susceptibility to listeria infection, as observed during genetic deletion of Ccr2 [23,39]. Assuming that CD38+ROS+ monocytes are responsible for immunopathological mechanisms during the early phase of hepatic amebiasis, genetic deletion of CD38 should lead to smaller abscesses. Indeed, we were able to detect this phenotype, and it was associated with a marked reduction in the proportion of recruited Ly6Chi monocytes.
In summary, analysis of Ly6Chi monocyte populations from two different infection models shows that proinflammatory Ly6Chi monocytes differ depending on the infectious agent. Based on the present results, we propose that the addition of IRF2, CD14, and CD38 or CD86 to the classical markers (CD11b, Ly6C, Ly6G) can help distinguish true proinflammatory Ly6Chi monocytes from non-inflammatory Ly6Chi monocytes.

Supplementary Materials

The following supporting information can be downloaded at: https://www.mdpi.com/article/10.3390/cells11162539/s1, Figure S1: Cytokine milieu during hepatic amebiasis and listeriosis; Figure S2: Comparative analysis of transcriptome and FACS data of liver-specific Ly6Chi/lo monocytes from E. histolytica and L. monocytogenes infected C57BL/6 mice; Figure S3: Expression pattern of CD14, CD38, CD74 and CD86 on Ly6C hi monocytes derived from different organs during the course of infection with E. histolytica and L. monocytogenes. Log in data for Array Express https://www.ebi.ac.uk/arrayexpress/experiments/E-MTAB-11816 (accessed on 13 July 2022). Username: Reviewer_E-MTAB-11816 Password: UUafxwmk.

Author Contributions

Conceptualization, H.-W.M. and H.L.; methodology, and investigation, S.H., M.G., M.V., K.Y., N.C.L., J.S., J.N., C.H., V.W., and H.F., software, S.H., J.S., N.C.L., and C.C.; data curation, H.L. and H.-W.M.; writing—original draft preparation, S.H. and H.L.; writing—review and editing, all authors; visualization, S.H., H.-W.M., and H.L.; supervision, H.-W.M. and H.L.; project administration, H.-W.M. and H.L.; funding acquisition, H.-W.M. and H.L. All authors have read and agreed to the published version of the manuscript.

Funding

This study was supported by grants of the German Research Foundation, Bonn, Germany, within the Collaborative Research Center (CRC) 841: Liver inflammation: infection, immune regulation and consequences.

Institutional Review Board Statement

The animal study was approved by the authorities for justice and consumer protection of the State of Hamburg in accordance with the ARRIVE guidelines (approval number: N082/2018, 26. September 2018).

Informed Consent Statement

Not applicable.

Data Availability Statement

Not applicable.

Acknowledgments

The authors thank Claudia Marggraff for her excellent technical support. The graphical abstract was created with a licensed version of BioRender.com (accessed on 1 July 2022), immune cells were created by Detlev Riller, sensidentity AB/making strategies visible.

Conflicts of Interest

The authors declare no conflict of interest.

References

  1. Geissmann, F.; Jung, S.; Littman, D.R. Blood Monocytes Consist of Two Principal Subsets with Distinct Migratory Properties. Immunity 2003, 19, 71–82. [Google Scholar] [CrossRef]
  2. Shi, C.; Pamer, E.G. Monocyte recruitment during infection and inflammation. Nat. Rev. Immunol. 2011, 11, 762–774. [Google Scholar] [CrossRef]
  3. Ginhoux, F.; Jung, S. Monocytes and macrophages: Developmental pathways and tissue homeostasis. Nat. Rev. Immunol. 2014, 14, 392–404. [Google Scholar] [CrossRef]
  4. Serbina, N.V.; Pamer, E.G. Monocyte emigration from bone marrow during bacterial infection requires signals mediated by chemokine receptor CCR2. Nat. Immunol. 2006, 7, 311–317. [Google Scholar] [CrossRef] [PubMed]
  5. Tsou, C.-L.; Peters, W.; Si, Y.; Slaymaker, S.; Aslanian, A.M.; Weisberg, S.P.; Mack, M.; Charo, I.F. Critical roles for CCR2 and MCP-3 in monocyte mobilization from bone marrow and recruitment to inflammatory sites. J. Clin. Investig. 2007, 117, 902–909. [Google Scholar] [CrossRef] [PubMed]
  6. Bonnardel, J.; T’Jonck, W.; Gaublomme, D.; Browaeys, R.; Scott, C.L.; Martens, L.; Vanneste, B.; Prijck, S.D.; Nedospasov, S.A.; Kremer, A.; et al. Stellate Cells, Hepatocytes, and Endothelial Cells Imprint the Kupffer Cell Identity on Monocytes Colonizing the Liver Macrophage Niche. Immunity 2019, 51, 638–654.e639. [Google Scholar] [CrossRef] [PubMed]
  7. Mildner, A.; Mack, M.; Schmidt, H.; Brück, W.; Djukic, M.; Zabel, M.D.; Hille, A.; Priller, J.; Prinz, M. CCR2+Ly-6Chi monocytes are crucial for the effector phase of autoimmunity in the central nervous system. Brain A J. Neurol. 2009, 132, 2487–2500. [Google Scholar] [CrossRef]
  8. Woollard, K.J.; Geissmann, F. Monocytes in atherosclerosis: Subsets and functions. Nat. Rev. Cardiol. 2010, 7, 77–86. [Google Scholar] [CrossRef]
  9. Geissmann, F.; Manz, M.G.; Jung, S.; Sieweke, M.H.; Merad, M.; Ley, K. Development of monocytes, macrophages, and dendritic cells. Science 2010, 327, 656–661. [Google Scholar] [CrossRef]
  10. Zimmermann, H.W.; Trautwein, C.; Tacke, F. Functional role of monocytes and macrophages for the inflammatory response in acute liver injury. Front. Physiol. 2012, 3, 56. [Google Scholar] [CrossRef]
  11. Meghraoui-Kheddar, A.; Barthelemy, S.; Boissonnas, A.; Combadiere, C. Revising CX3CR1 Expression on Murine Classical and Non-classical Monocytes. Front. Immunol. 2020, 11, 1117. [Google Scholar] [CrossRef] [PubMed]
  12. Weinreb, C.; Rodriguez-Fraticelli, A.; Camargo, F.D.; Klein, A.M. Lineage tracing on transcriptional landscapes links state to fate during differentiation. Science 2020, 367, eaaw3381. [Google Scholar] [CrossRef] [PubMed]
  13. Yáñez, A.; Coetzee, S.G.; Olsson, A.; Muench, D.E.; Berman, B.P.; Hazelett, D.J.; Salomonis, N.; Grimes, H.L.; Goodridge, H.S. Granulocyte-Monocyte Progenitors and Monocyte-Dendritic Cell Progenitors Independently Produce Functionally Distinct Monocytes. Immunity 2017, 47, 890–902.e894. [Google Scholar] [CrossRef] [PubMed]
  14. Giladi, A.; Wagner, L.K.; Li, H.; Dörr, D.; Medaglia, C.; Paul, F.; Shemer, A.; Jung, S.; Yona, S.; Mack, M.; et al. Cxcl10+ monocytes define a pathogenic subset in the central nervous system during autoimmune neuroinflammation. Nat. Immunol. 2020, 21, 525–534. [Google Scholar] [CrossRef] [PubMed]
  15. Olivos-García, A.; Carrero, J.C.; Ramos, E.; Nequiz, M.; Tello, E.; Montfort, I.; Pérez-Tamayo, R. Late experimental amebic liver abscess in hamster is inhibited by cyclosporine and N-acetylcysteine. Exp. Mol. Pathol. 2007, 82, 310–315. [Google Scholar] [CrossRef]
  16. Helk, E.; Bernin, H.; Ernst, T.; Ittrich, H.; Jacobs, T.; Heeren, J.; Tacke, F.; Tannich, E.; Lotter, H. TNFα-mediated liver destruction by Kupffer cells and Ly6Chi monocytes during Entamoeba histolytica infection. PLoS Pathog. 2013, 9, e1003096. [Google Scholar] [CrossRef]
  17. Kuziel, W.A.; Morgan, S.J.; Dawson, T.C.; Griffin, S.; Smithies, O.; Ley, K.; Maeda, N. Severe reduction in leukocyte adhesion and monocyte extravasation in mice deficient in CC chemokine receptor 2. Proc. Natl. Acad. Sci. USA 1997, 94, 12053–12058. [Google Scholar] [CrossRef]
  18. Cockayne, D.A.; Muchamuel, T.; Grimaldi, J.C.; Muller-Steffner, H.; Randall, T.D.; Lund, F.E.; Murray, R.; Schuber, F.; Howard, M.C. Mice deficient for the ecto-nicotinamide adenine dinucleotide glycohydrolase CD38 exhibit altered humoral immune responses. Blood 1998, 92, 1324–1333. [Google Scholar] [CrossRef]
  19. Sellau, J.; Groneberg, M.; Fehling, H.; Thye, T.; Hoenow, S.; Marggraff, C.; Weskamm, M.; Hansen, C.; Stanelle-Bertram, S.; Kuehl, S.; et al. Androgens predispose males to monocyte-mediated immunopathology by inducing the expression of leukocyte recruitment factor CXCL1. Nat. Commun. 2020, 11, 3459. [Google Scholar] [CrossRef]
  20. Dobin, A.; Davis, C.A.; Schlesinger, F.; Drenkow, J.; Zaleski, C.; Jha, S.; Batut, P.; Chaisson, M.; Gingeras, T.R. STAR: Ultrafast universal RNA-seq aligner. Bioinformatics 2013, 29, 15–21. [Google Scholar] [CrossRef]
  21. Love, M.I.; Huber, W.; Anders, S. Moderated estimation of fold change and dispersion for RNA-seq data with DESeq2. Genome Biol. 2014, 15, 550. [Google Scholar] [CrossRef] [PubMed]
  22. Mi, H.; Muruganujan, A.; Ebert, D.; Huang, X.; Thomas, P.D. PANTHER version 14: More genomes, a new PANTHER GO-slim and improvements in enrichment analysis tools. Nucleic Acids Res. 2019, 47, D419–D426. [Google Scholar] [CrossRef] [PubMed]
  23. Hoge, J.; Yan, I.; Jänner, N.; Schumacher, V.; Chalaris, A.; Steinmetz, O.M.; Engel, D.R.; Scheller, J.; Rose-John, S.; Mittrücker, H.-W. IL-6 controls the innate immune response against Listeria monocytogenes via classical IL-6 signaling. J. Immunol. 2013, 190, 703–711. [Google Scholar] [CrossRef] [PubMed]
  24. Manzella, L.; Conte, E.; Cocchiaro, G.; Guarniera, E.; Sciacca, B.; Bonaiuto, C.; Stagno, F.; Messina, A. Role of interferon regulatory factor 1 in monocyte/macrophage differentiation. Eur. J. Immunol. 1999, 29, 3009–3016. [Google Scholar] [CrossRef]
  25. Gariglio, M.; Andrea, M.D.; Lembo, M.; Ravotto, M.; Zappador, C.; Valente, G.; Landolfo, S. The murine homolog of the HIN 200 family, Ifi 204, is constitutively expressed in myeloid cells and selectively induced in the monocyte/macrophage lineage. J. Leukoc. Biol. 1998, 64, 608–614. [Google Scholar] [CrossRef]
  26. Gonzalez-Cotto, M.; Guo, L.; Karwan, M.; Sen, S.K.; Barb, J.; Collado, C.J.; Elloumi, F.; Palmieri, E.M.; Boelte, K.; Kolodgie, F.D.; et al. TREML4 Promotes Inflammatory Programs in Human and Murine Macrophages and Alters Atherosclerosis Lesion Composition in the Apolipoprotein E Deficient Mouse. Front. Immunol. 2020, 11, 397. [Google Scholar] [CrossRef]
  27. Guler, R.; Roy, S.; Suzuki, H.; Brombacher, F. Targeting Batf2 for infectious diseases and cancer. Oncotarget 2015, 6, 26575–26582. [Google Scholar] [CrossRef]
  28. Liu, X.; Jiao, Y.; Cao, Y.; Deng, N.; Ma, Y.; Hasty, K.A.; Kang, A.; Chen, H.; Stuart, J.M.; Gu, W. Decreased expression levels of Ifi genes is associated to the increased resistance to spontaneous arthritis disease in mice deficiency of IL-1RA. BMC Immunol. 2016, 17, 25. [Google Scholar] [CrossRef]
  29. Howell, K.; Posluszny, J.; He, L.K.; Szilagyi, A.; Halerz, J.; Gamelli, R.L.; Shankar, R.; Muthu, K. High MafB expression following burn augments monocyte commitment and inhibits DC differentiation in hemopoietic progenitors. J. Leukoc. Biol. 2012, 91, 69–81. [Google Scholar] [CrossRef]
  30. Hilgendorf, I.; Gerhardt, L.M.S.; Tan, T.C.; Winter, C.; Holderried, T.A.W.; Chousterman, B.G.; Iwamoto, Y.; Liao, R.; Zirlik, A.; Scherer-Crosbie, M.; et al. Ly-6Chigh monocytes depend on Nr4a1 to balance both inflammatory and reparative phases in the infarcted myocardium. Circ. Res. 2014, 114, 1611–1622. [Google Scholar] [CrossRef]
  31. Vétillard, M.; Schlecht-Louf, G. Glucocorticoid-Induced Leucine Zipper: Fine-Tuning of Dendritic Cells Function. Front. Immunol. 2018, 9, 1232. [Google Scholar] [CrossRef] [PubMed]
  32. Shang, Y.; Coppo, M.; He, T.; Ning, F.; Yu, L.; Kang, L.; Zhang, B.; Ju, C.; Qiao, Y.; Zhao, B.; et al. The transcriptional repressor Hes1 attenuates inflammation by regulating transcription elongation. Nat. Immunol. 2016, 17, 930–937. [Google Scholar] [CrossRef] [PubMed]
  33. Ray, N.; Kuwahara, M.; Takada, Y.; Maruyama, K.; Kawaguchi, T.; Tsubone, H.; Ishikawa, H.; Matsuo, K. c-Fos suppresses systemic inflammatory response to endotoxin. Int. Immunol. 2006, 18, 671–677. [Google Scholar] [CrossRef] [PubMed]
  34. Babicki, S.; Arndt, D.; Marcu, A.; Liang, Y.; Grant, J.R.; Maciejewski, A.; Wishart, D.S. Heatmapper: Web-enabled heat mapping for all. Nucleic Acids Res. 2016, 44, W147–W153. [Google Scholar] [CrossRef] [PubMed]
  35. Mouchemore, K.A.; Pixley, F.J. CSF-1 signaling in macrophages: Pleiotrophy through phosphotyrosine-based signaling pathways. Crit. Rev. Clin. Lab. Sci. 2012, 49, 49–61. [Google Scholar] [CrossRef]
  36. Raggi, F.; Pelassa, S.; Pierobon, D.; Penco, F.; Gattorno, M.; Novelli, F.; Eva, A.; Varesio, L.; Giovarelli, M.; Bosco, M.C. Regulation of Human Macrophage M1-M2 Polarization Balance by Hypoxia and the Triggering Receptor Expressed on Myeloid Cells-1. Front. Immunol. 2017, 8, 1097. [Google Scholar] [CrossRef]
  37. Mantovani, A.; Biswas, S.K.; Galdiero, M.R.; Sica, A.; Locati, M. Macrophage plasticity and polarization in tissue repair and remodelling. J. Pathol. 2013, 229, 176–185. [Google Scholar] [CrossRef]
  38. Jacinto, T.A.; Meireles, G.S.; Dias, A.T.; Aires, R.; Porto, M.L.; Gava, A.L.; Vasquez, E.C.; Pereira, T.M.C.; Campagnaro, B.P.; Meyrelles, S.S. Increased ROS production and DNA damage in monocytes are biomarkers of aging and atherosclerosis. Biol. Res. 2018, 51, 33. [Google Scholar] [CrossRef]
  39. Lischke, T.; Heesch, K.; Schumacher, V.; Schneider, M.; Haag, F.; Koch-Nolte, F.; Mittrücker, H.-W. CD38 controls the innate immune response against Listeria monocytogenes. Infect. Immun. 2013, 81, 4091–4099. [Google Scholar] [CrossRef]
  40. Amici, S.A.; Young, N.A.; Narvaez-Miranda, J.; Jablonski, K.A.; Arcos, J.; Rosas, L.; Papenfuss, T.L.; Torrelles, J.B.; Jarjour, W.N.; Guerau-de-Arellano, M. CD38 Is Robustly Induced in Human Macrophages and Monocytes in Inflammatory Conditions. Front. Immunol. 2018, 9, 1593. [Google Scholar] [CrossRef]
  41. Jablonski, K.A.; Amici, S.A.; Webb, L.M.; Ruiz-Rosado, J.d.D.; Popovich, P.G.; Partida-Sanchez, S.; Guerau-de-Arellano, M. Novel Markers to Delineate Murine M1 and M2 Macrophages. PLoS ONE 2015, 10, e0145342. [Google Scholar] [CrossRef]
  42. Brempelis, K.J.; Crispe, I.N. Infiltrating monocytes in liver injury and repair. Clin. Transl. Immunol. 2016, 5, e113. [Google Scholar] [CrossRef] [PubMed]
  43. Trzebanski, S.; Jung, S. Plasticity of monocyte development and monocyte fates. Immunol. Lett. 2020, 227, 66–78. [Google Scholar] [CrossRef] [PubMed]
  44. Yona, S.; Kim, K.-W.; Wolf, Y.; Mildner, A.; Varol, D.; Breker, M.; Strauss-Ayali, D.; Viukov, S.; Guilliams, M.; Misharin, A.; et al. Fate mapping reveals origins and dynamics of monocytes and tissue macrophages under homeostasis. Immunity 2013, 38, 79–91. [Google Scholar] [CrossRef] [PubMed]
  45. Mildner, A.; Schmidt, H.; Nitsche, M.; Merkler, D.; Hanisch, U.-K.; Mack, M.; Heikenwalder, M.; Brück, W.; Priller, J.; Prinz, M. Microglia in the adult brain arise from Ly-6ChiCCR2+ monocytes only under defined host conditions. Nat. Neurosci. 2007, 10, 1544–1553. [Google Scholar] [CrossRef] [PubMed]
  46. Hanna, R.N.; Carlin, L.M.; Hubbeling, H.G.; Nackiewicz, D.; Green, A.M.; Punt, J.A.; Geissmann, F.; Hedrick, C.C. The transcription factor NR4A1 (Nur77) controls bone marrow differentiation and the survival of Ly6C- monocytes. Nat. Immunol. 2011, 12, 778–785. [Google Scholar] [CrossRef]
  47. Wang, Y.; Mo, X.; Piper, M.G.; Wang, H.; Parinandi, N.L.; Guttridge, D.; Marsh, C.B. M-CSF induces monocyte survival by activating NF-κB p65 phosphorylation at Ser276 via protein kinase C. PLoS ONE 2011, 6, e28081. [Google Scholar] [CrossRef]
  48. Leng, L.; Metz, C.N.; Fang, Y.; Xu, J.; Donnelly, S.; Baugh, J.; Delohery, T.; Chen, Y.; Mitchell, R.A.; Bucala, R. MIF signal transduction initiated by binding to CD74. J. Exp. Med. 2003, 197, 1467–1476. [Google Scholar] [CrossRef]
  49. Farr, L.; Ghosh, S.; Jiang, N.; Watanabe, K.; Parlak, M.; Bucala, R.; Moonah, S. CD74 Signaling Links Inflammation to Intestinal Epithelial Cell Regeneration and Promotes Mucosal Healing. Cell. Mol. Gastroenterol. Hepatol. 2020, 10, 101–112. [Google Scholar] [CrossRef]
  50. Zanoni, I.; Granucci, F. Role of CD14 in host protection against infections and in metabolism regulation. Front. Cell. Infect. Microbiol. 2013, 3, 32. [Google Scholar] [CrossRef]
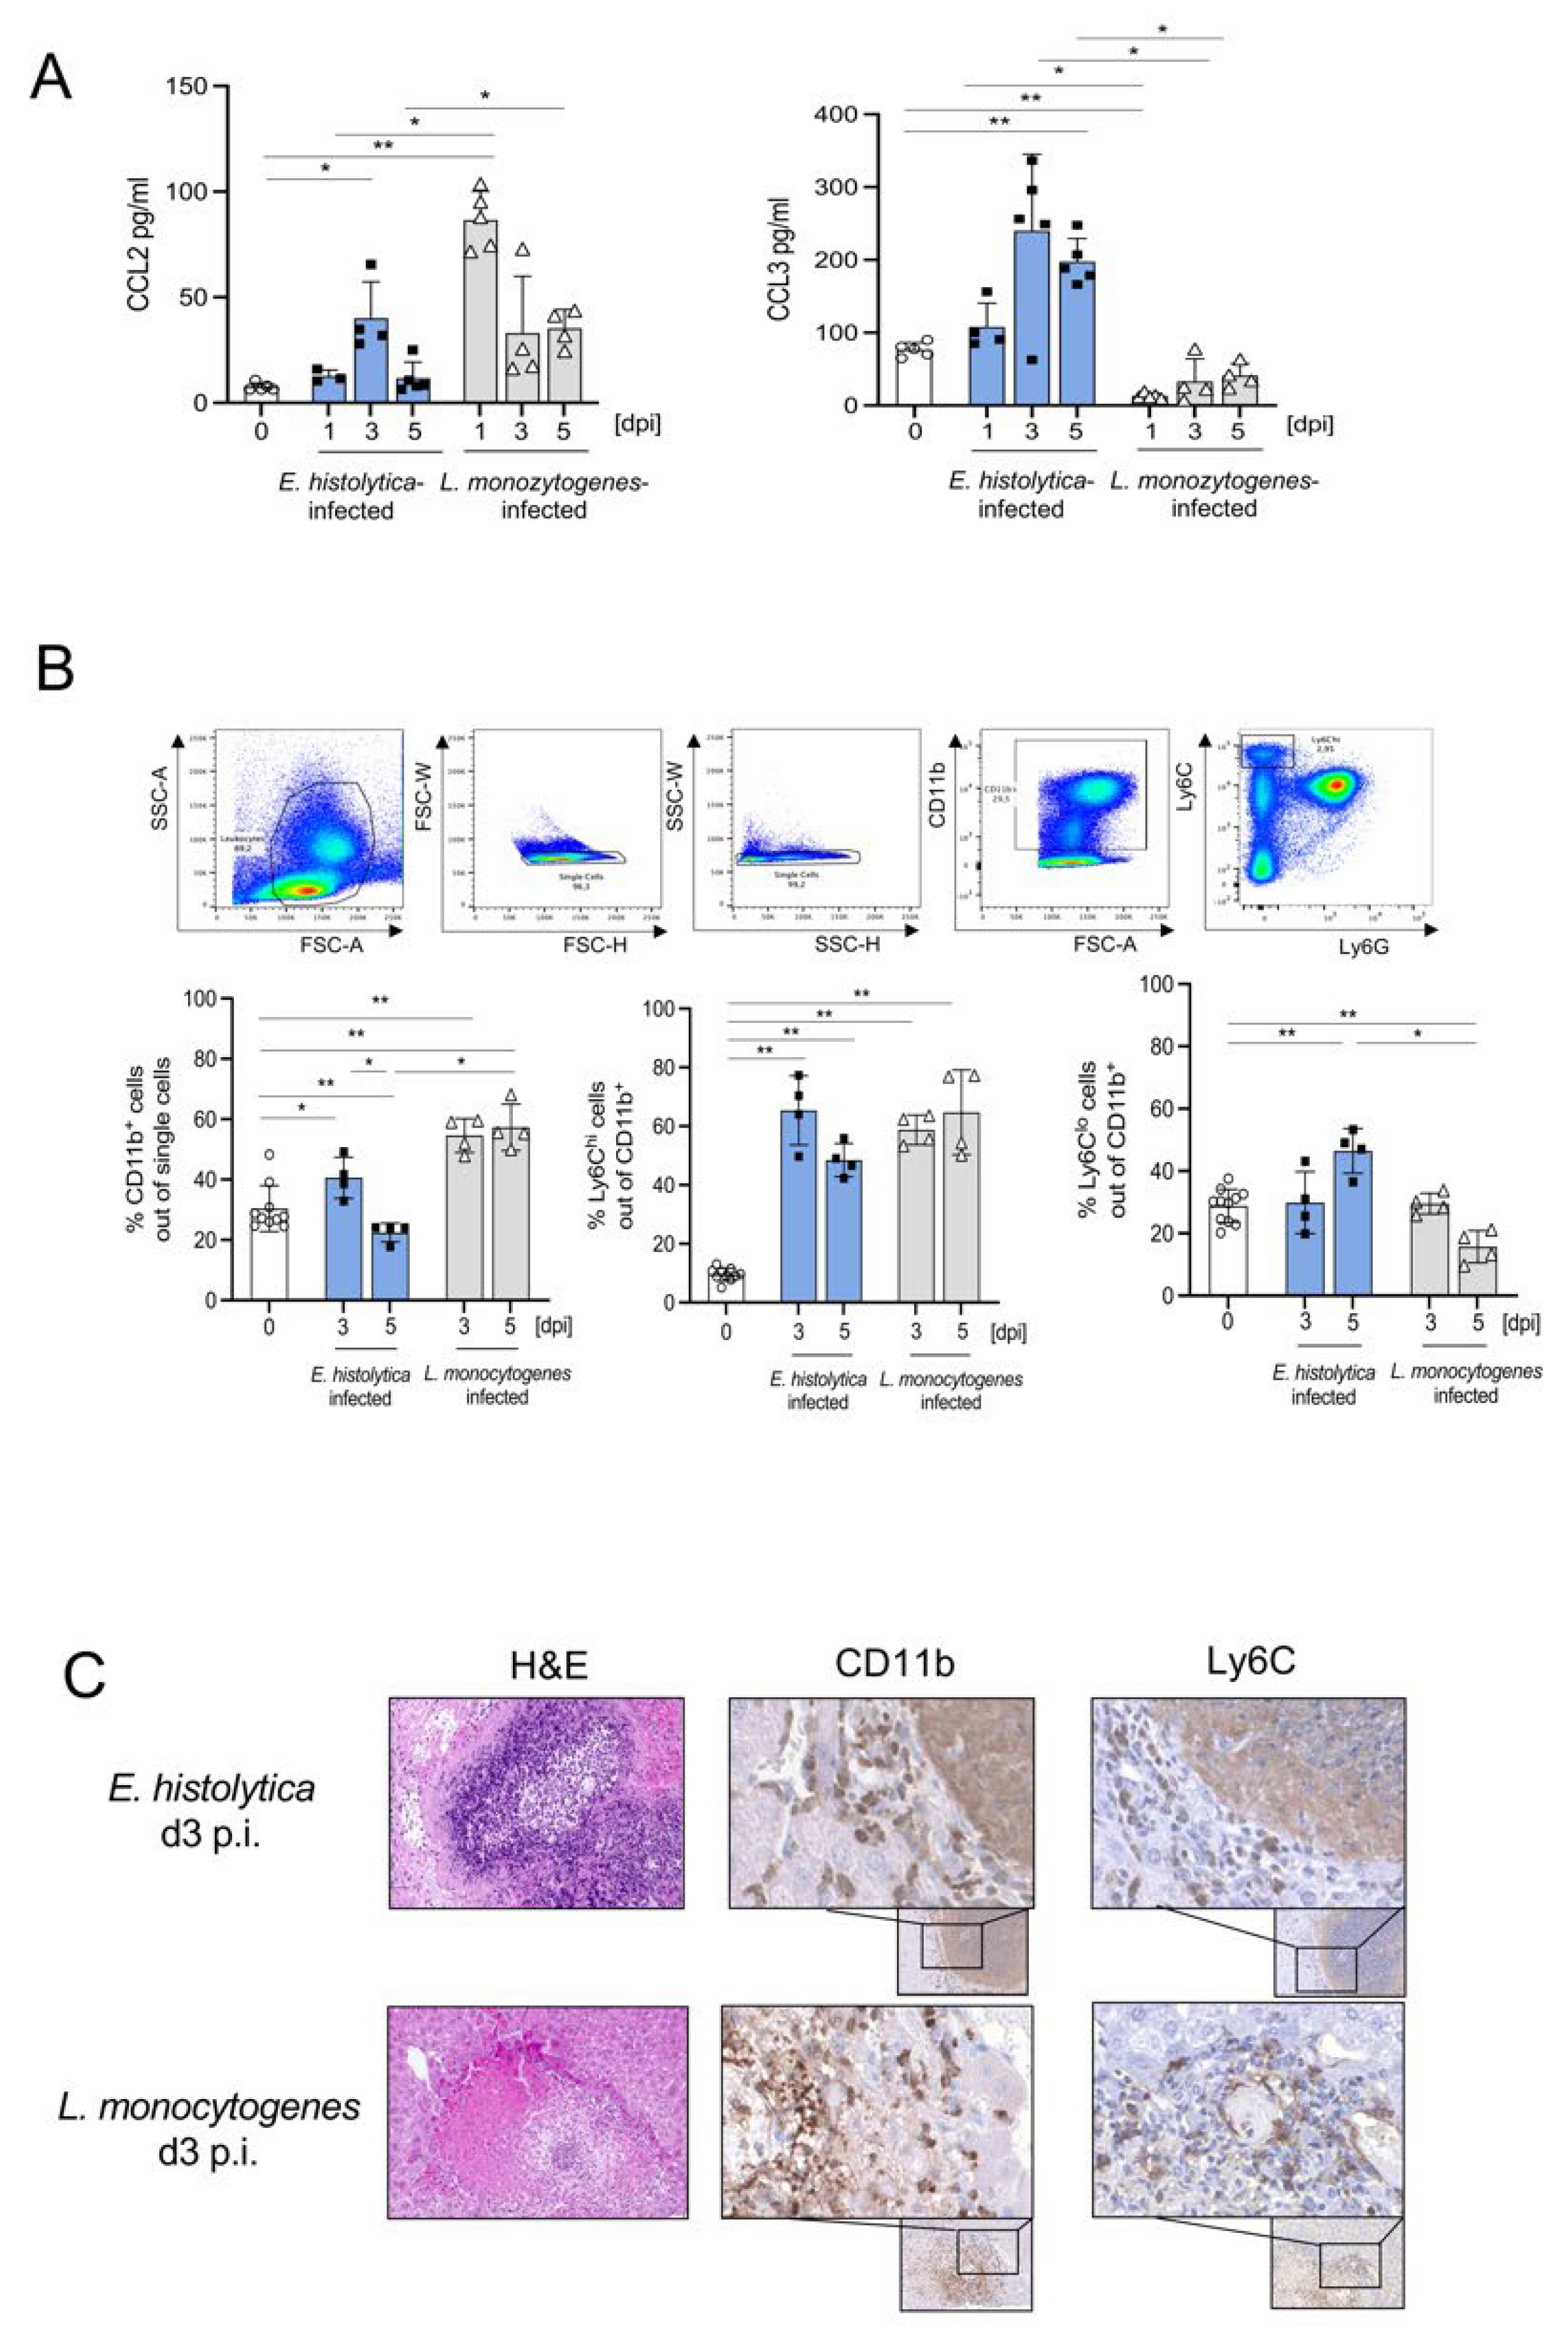
Figure 1. Recruitment of CD11b+Ly6Chi and Ly6Clo monocytes to the liver during infection with E. histolytica and L. monocytogenes, and protective properties of Ly6Chi monocytes against E. histolytica infection. (A) Expression of CCL2 and CCL3 in liver lysates after intrahepatic E. histolytica (2 × 10⁵) and systemic L. monocytogenes (2 × 10⁴) infection, measured in a multiplex cytokine assay. (B) Gating scheme and percentages of CD11b+, CD11b+ Ly6Chi, and Ly6Clo monocytes in the liver following E. histolytica or L. monocytogenes infection. (C) Liver sections from E. histolytica- and L. monocytogenes-infected mice were stained with H&E, anti-CD11b (EPR1344), and anti-Ly6C (ER-MP20) on day 3 p.i. (AC) One representative experiment of three is shown. (* p < 0.05; ** p < 0.01; Mann-Whitney U test).
Cells 11 02539 g001
Figure 2. Transcriptome analysis of monocytes from the livers of mice infected with E. histolytica or L. monocytogenes. (A) Gating and mRNA purification strategy for liver-specific Ly6Chi and Ly6Clo monocytes from E. histolytica- and L. monocytogenes-infected mice. (B) VENN diagram of transcriptome analysis of Ly6Chi and Ly6Clo monocytes shows significantly regulated genes of Ly6Chi and Ly6Clo monocytes from both infection models. PANTHER GO-slim analysis was performed to identify biological pathways involving significantly regulated genes in both monocyte populations. (C) Principal component analysis of transcriptomic data from Ly6Chi and Ly6Clo monocytes from naïve and E. histolytica- and L. monocytogenes-infected mice.
Cells 11 02539 g002
Figure 3. Early M2 polarization and a less activated mRNA expression profile in Ly6Chi monocytes from E. histolytica-infected compared to L. monocytogenes-infected mice. (A) Heat map showing selected regulated genes (padj < 0.05; foldchange > 2) involved in monocyte/macrophage polarization and activation of Ly6Chi monocytes derived from the livers of E. histolytica (E. his)- and L. monocytogenes (L. m)-infected. (B) Time-course analysis of mRNA encoding M2 transcription factors and interferon-regulated/activated factors. (C) Heatmap showing classification of Ly6Chi monocytes derived from the livers of both infection models according to expression of genes involved in conversion from Ly6Chi to Ly6Clo, neutrophil-like, dendritic cell-like, or Cxcl10+ and Saa3+-like monocytes. (D) Heat map of selected genes upregulated during ALA. All heatmaps were designed using the online tool “heatmapper” [34].
Cells 11 02539 g003
Figure 4. Marked differences in expression of surface markers by Ly6Chi monocytes after infection with E. histolytica or L. monocytogenes (A) Heatmap depicting differential expression of mRNA encoding selected markers on the surface of liver Ly6Chi monocytes after infection with E. histolytica (E. his) or L. monocytogenes (L. m). (B) Normalized mRNA counts of selected surface marker genes (from transcriptome analysis). (C) Percentage of CD14+, CD38+, CD74+, and CD86+ Ly6Chi monocytes during the course of infection at the indicated time points post-infection (measured by flow cytometry). (D) Histogram and MFI of CD14+, CD38+, CD74+, and CD86+ Ly6Chi monocytes during the course of infection. Data in C were pooled from three independent experiments. Data in D are representative of one of these three experiments and all data are presented as the mean ± SEM (* p < 0.05; ** p < 0.01; *** p < 0.001, **** p < 0.0001; Mann-Whitney U test).
Cells 11 02539 g004
Figure 5. New Ly6Chi monocyte subsets identified according to expression of selected surface markers and IRF2. (A) Gating strategy, histogram, and percentage of IRF2+ Ly6Chi monocytes from livers of naïve mice and from E. histolytica- and L. monocytogenes-infected mice on day 3 post infecion. (B) Gating strategy (exemplary for CD14+ gated cells) based on the FMO control to determine CD14+, CD38+, CD74+, and CD86+ monocytes within the IRF2+ Ly6Chi monocyte population from naïve mice and from both infection models on day 3 post infection. (C) UMAP plots of Ly6Chi monocytes (including CD14+, CD86+, CD74+, CD38+) from naïve mice and from E. histolytica- and L. monocytogenes-infected mice (down sampled to 90,000 cells per sample). Six samples per source material were included in the analysis. (D) Cluster heatmap table showing surface marker and IRF2 expression by Ly6Chi monocytes, cluster events, and integration of cluster events in the UMAP plot (* p < 0.05; ** p < 0.01; *** p < 0.001; **** p < 0.0001; Mann-Whitney U test).
Cells 11 02539 g005
Figure 6. CD38+Ly6Chi monocytes represent the major monocytic source of ROS production and contribute to liver damage following E. histolytica infection. (A) Heat map of differentially regulated genes involved in ROS production and a graph showing fold changes in expression of Ncf1 mRNA in the liver during infection with E. histolytica or L. monocytogenes. (B) Gating scheme and histogram for ROS+ liver Ly6Chi monocytes. Percentage and mean fluorescent intensity (MFI) of ROS+Ly6Chi monocytes during (C) E. histolytica and (D) L. monocytogenes infection. (E) Percentage of ROS+CD38+ out of Ly6ChiCD11b+ monocytes in both infection models. (F) Percentage of amebic liver abscess weight in relation to the left liver lobe in WT (C57BL/6) and Cd38-/- mice. (G) Percentage of Ly6Chi CD11b+ cells in the liver in naive, infected WT and Cd38-/- mice. (* p < 0.05; ** p < 0.01; *** p < 0.001, **** p < 0.0001; Mann-Whitney U test).
Cells 11 02539 g006
Publisher’s Note: MDPI stays neutral with regard to jurisdictional claims in published maps and institutional affiliations.