Abstract
Ataxia telangiectasia and Rad-3 related kinase (ATR) signals DNA lesions and replication stress (RS) to the S and G2/M checkpoints and DNA repair pathways making it a promising target to exploit the dysregulated DNA damage response in cancer. ATR inhibitors (ATRi) are under clinical investigation as monotherapy and in combination with other anticancer agents. Molecular determinants of sensitivity to ATRi are common in ovarian cancer, suggesting the therapeutic potential of ATRi. We investigated the cytotoxicity of the ATRi, VE-821, in a panel of human ovarian cancer cell lines. High grade serous (HGS) cell lines were significantly more sensitive to VE-821 than non-HGS (p ≤ 0.0001) but previously identified determinants of sensitivity (TP53, ATM and BRCA1) were not predictive. Only low RAD51 (p = 0.041), TopBP1 (p = 0.026) and APOBEC3B (p = 0.015) protein expression were associated with increased VE-821 sensitivity. HGS cells had increased levels of RS (pRPASer4/8 and γH2AX nuclear immunofluorescence), and elevated RS predicted sensitivity to VE-821 independently of the cell line subtype. These data suggest that functional assessment of RS biomarkers may be a better predictive biomarker of ATRi response than any single aberrant gene in ovarian cancer and potentially other cancers.
1. Introduction
Ovarian cancer is the seventh most common cancer among women accounting for ~300,000 cancer cases globally in 2018 and is the leading cause of death from gynecological malignancy [1]. The majority of ovarian cancers are of epithelial origin and there are five histopathological subtypes: high-grade serous (HGS), low-grade serous (LGS), clear cell, endometrioid and mucinous [2]. The most common subtype, HGS, is characterized by high genomic instability and defects in DNA damage response (DDR) pathways, which drive the development and progression of the disease [3,4]. There is a high frequency (>50%) of homologous recombination repair (HRR) defects (HRD) in HGS ovarian cancer (HGSOC) [5].
The exploitation of DDR defects is a promising approach to cancer therapy, exemplified by the success of the synthetic lethality of poly-ADP ribose polymerase (PARP) inhibitors (PARPi) in cancers with HRD. The introduction of PARPi in the treatment of platinum sensitive HRD HGSOC has resulted in significant clinical benefits with prolongation of progression-free survival (PFS) [6,7,8,9]. However, patients whose cancers are ‘biomarker negative’ for HRD (around half of all HGSOC), gain minimal, short-lived responses or no response to maintenance single agent PARPi therapy. Even in patients who do respond, the development of PARPi resistance is common (Reviewed in [10]). Therefore, there is a need to identify new targets and new combinations of targeted therapies in this area.
Ataxia telangiectasia and Rad-3 related kinase (ATR) is a key DDR kinase, responsible for signaling single stranded DNA (ssDNA), principally due to replication stress (RS), to the S and G2/M checkpoints and DNA repair [11]. In cancer cells, G1 checkpoint control is commonly lost, which, coupled with frequent activation of oncogenes that drive replication, results in increased RS and hence an increased reliance on the S and G2/M checkpoints [12,13,14]. p53 plays a key role in G1 checkpoint control and TP53 mutations (present in almost 100% of HGSOC [5]) could render cancers more sensitive to ATR inhibition than p53-proficient cells, however the data has been inconsistent [15,16,17,18]. Numerous other determinants of sensitivity to ATR inhibition have been identified such as; ATM [17,19,20,21,22], XRCC1 [23,24,25], TopBP1 [26], and CHK1 [27]. Of note to HGSOC, where >50% have HRD [5], the HRR pathway proteins RAD51 [25,28], and BRCA2 [25], have been implicated as determinants of sensitivity to ATR inhibition. Additionally, CCNE1 (cyclin E) amplification, which drives S-phase entry is present in ~20% of HGSOC [5] has been identified as a determinant of sensitivity to ATR inhibition [15,29]. Defects in NHEJ have also been implicated in ovarian cancer [30], and linked to ATR inhibitor response [25]. Furthermore, ARID1A [31] and APOBEC3A/B [32,33] overexpression, both of which are linked to clear cell ovarian cancer [29,34,35], have been found to selectively sensitize to ATR inhibition. Therefore, ATRi monotherapy is likely to be a successful treatment strategy in ovarian cancer.
Putative biomarkers of response need to be sensitive and easy to measure for successful translation into clinical practice. However, unless a single gene/protein loss accounts for the response, clinical utility often fails due to the complexity of molecular characteristics of human cancer. This study aimed to investigate whether previously identified determinants of sensitivity to ATR inhibition in non-ovarian cancers would act as predictive biomarkers in in vitro models of ovarian cancer, and to investigate novel determinants of sensitivity. Sensitivity to the predecessor of the clinical ATRi berzosertib (M6620, VX-970, VE-822), VE-821 [36], was investigated in a panel of human ovarian cancer cell lines. Through functional assessment of RS, we sought to determine whether increased RS could be a predictive biomarker for sensitivity to VE-821 ATR inhibition.
2. Materials and Methods
2.1. Cell Lines and Culture Conditions
Human cancer cell lines were obtained from ATCC or ECACC, excluding the NUCOLL43 cell line which was derived de novo from a sample of malignant ascites that spontaneously immortalized [37], and the A2780, CP70 A2 and CP70 B1 cell lines; a kind gift from Dr Jane Plum and Prof. Robert Brown (Imperial College London, London, UK). Cells were cultured up to a maximum of 30 passages from purchase or authentication, in either RPMI (IGROV1, OAW42, ES-2, A2780, CP70 A2, CP70 B1 and NUCOLL43) or DMEM (COV318, CAOV3 and COV362) media supplemented with 10% FBS and incubated at 37 °C with 5% CO2. Cell lines were tested for mycoplasma every 2 months. Derivatives of the MMR deficient A2780-CP70 cell line, CP70 A2 and CP70 B1 were established by transfection with chromosome 3 containing; wild-type hMLH1 (CP70 B1), or mutant hMLH1 and were grown in media supplemented with 200 μg/mL Hygromycin B. The BRCA1 mutant cell line, UWB1.289, and its BRCA1 corrected derivative, UWB1.289 + Br1, were grown in 50% RPMI, 50% MEBM media supplemented with 20% FBS and 200 μg/mL G418S for UWB1.289 + Br1 cells.
Classification of the panel of cell lines into “HGS” or “non-HGS” was made according to the characterization by Domcke et al. [38], which assessed HGS features including: TP53 mutation, high CNA frequency, and a low frequency of mutations overall (occurring in only TP53, BRCA1, BRCA2 or RB1 most commonly). As well as features of non-HGS subtypes (i.e., low-grade serous, mucinous, endometrioid or clear cell) including wild-type TP53, closer to normal gene copy numbers, mutations in PIK3CA, PTEN, KRAS, BRAF, CTNNB1 and ARID1A, and CNAs in ERBB2. Cell lines not included in the assessment by Domcke et al. [38], UWB1.289 and NUCOLL43, were classified using the same parameters.
2.2. Cytotoxicity Determination by Colony Formation Assay
Low densities of cells (50–4000 cells/well, depending on cell line plating efficiency) were seeded into 6-well plates and allowed to adhere for 24 h before being treated with 0–30 μM VE-821 for 48 h. The DMSO concentration was kept consistent at 0.5% in treated and untreated control cells. After 48 h, drug was removed and replaced with fresh media before cells were left to form colonies. After 9–21 days, cells were fixed in methanol: acetic acid (3:1 V/V) and stained in 0.4% crystal violet (W/V). Colonies were counted and percentage survival was calculated relative to the plating efficiency of treated vs. untreated DMSO controls. Interpolation of the survival curves was used to calculate the LC50, the concentration causing a 50% decrease in cell survival, of VE-821.
2.3. Measurement of Cellular Proteins by Western Blot
Lysates were collected from untreated cells at 70% confluence with RIPA buffer containing 1% protease inhibitor cocktail (Thermo Fisher, Waltham, MA, USA), following manufacturer instructions. Protein content was estimated by Pierce BCA assay (Thermo Fisher) following manufacturers guidelines, then samples were diluted to equal concentrations between 0.8–1 mg/mL in XT sample buffer and XT reducing agent (BioRad, Hercules, CA, USA), and boiled at 95 °C for 10 min. Lysates were separated by SDS-PAGE using 3–8% Tris-Acetate gels (BioRad), transferred to nitrocellulose HybondTM C membrane (Amersham, Buckinghamshire, UK), and blocked in 5% nonfat milk in TBS-T. Primary antibodies were incubated overnight at 4 °C in either 5% nonfat milk or 5% BSA in TBS-T. The following primary antibodies were used: ATM (Cell Signaling, Danvers, MA, USA, 2873; 1:500), ATR (Santa Cruz, Dallas, TX, USA, Sc515173; 1:200), ARID1A (Cell Signaling, 12354; 1:1000), CHK1 (Santa Cruz, Sc8408; 1:500), Cyclin E (Santa Cruz, Sc247; 1:500), DNA-PKcs (Santa Cruz, Sc390849; 1:500), Ku70 (Abcam, Cambridge, UK, Ab3114; 1:500), Ku80 (Abcam, Ab80592; 1:500), RAD51 (Santa Cruz, Sc8349; 1:1000), PARP1 (Biovision, Milpitas, CA, USA, 3001-100; 1:500), TopBP1 (Abcam, Ab2402; 1:1000) and XRCC1 (Santa Cruz, Sc56254; 1:500). HRP conjugated secondary antibodies (Agilent Dako, Santa Clara, CA, UKA, P0447 and P0448; 1:2000) were incubated in 5% nonfat milk for 1 h at room temperature. For detection, Clarity Western enhanced chemiluminescence substrate (BioRad) was added and bands were visualized using the G-box gel documentation system (Syngene, Cambridge, UK), quantified using ImageJ software Version 2.3.0/1.53q (NIH, Bethesda, MD, USA), and normalized to Ponceau S staining (Supplementary Figure S1). Ponceau-S was used in place of a housekeeping gene in the Western blots, as although the expression of housekeeping proteins is unlikely to vary between samples of the same cell line prepared at the same time, they are more likely to vary between cell lines [39,40].
2.4. Measurement of Replication Stress by Immunofluorescence Microscopy
Cells were seeded onto coverslips and allowed to establish exponential growth in drug-free medium for 24 h before the coverslips were washed once in ice cold PBS, permeabilized in 0.2% triton-X/PBS for one minute, and then fixed in 2% paraformaldehyde. After fixing cells were washed once in PBS before being washed 3 times in 0.2% BSA 0.3% triton-X/PBS. Cells were then blocked in 5% BSA + 1:25 goat serum/PBS for one hour at room temperature. After blocking, primary antibodies were incubated overnight at 4 °C in 0.2% BSA 0.3% triton-X/PBS. The following primary antibodies were used: pRPASer4/8 (Bethyl Laboratories, Montgomery, TX, USA, A300-245A; 1:4000) and γH2AXSer139 (MilliporeSigma, Burlington, MA, USA #05-636; 1:1000). After primary antibody incubation Cells were washed once in 0.2% BSA 0.3% Triton-X/PBS before being washed three times in 0.2% BSA/PBS, then incubated with Alexa Fluor conjugated secondary antibodies (Thermo Fisher, A-11003 and A-11008; 1:1000) for 1 h at room temperature. Cells were washed once in 0.2% BSA/PBS before being incubated with DAPI diluted 1:1000 for 30 min at room temperature. After DAPI, cells were washed 3 times in 0.2% BSA/PBS then mounted onto slides with Prolong Glass Antifade mountant (Thermo Fisher) and imaged using a DM6 widefield microscope. Multiple images per cell line were captured in each independent experiment and analyzed using ImageJ software, Version 2.3.0/1.53q (NIH)).
3. Results
3.1. HGS Ovarian Cancer Cell Lines Are More Sensitive to Single Agent Ve-821 Than Non-Hgs Ovarian Cancer Cell Lines
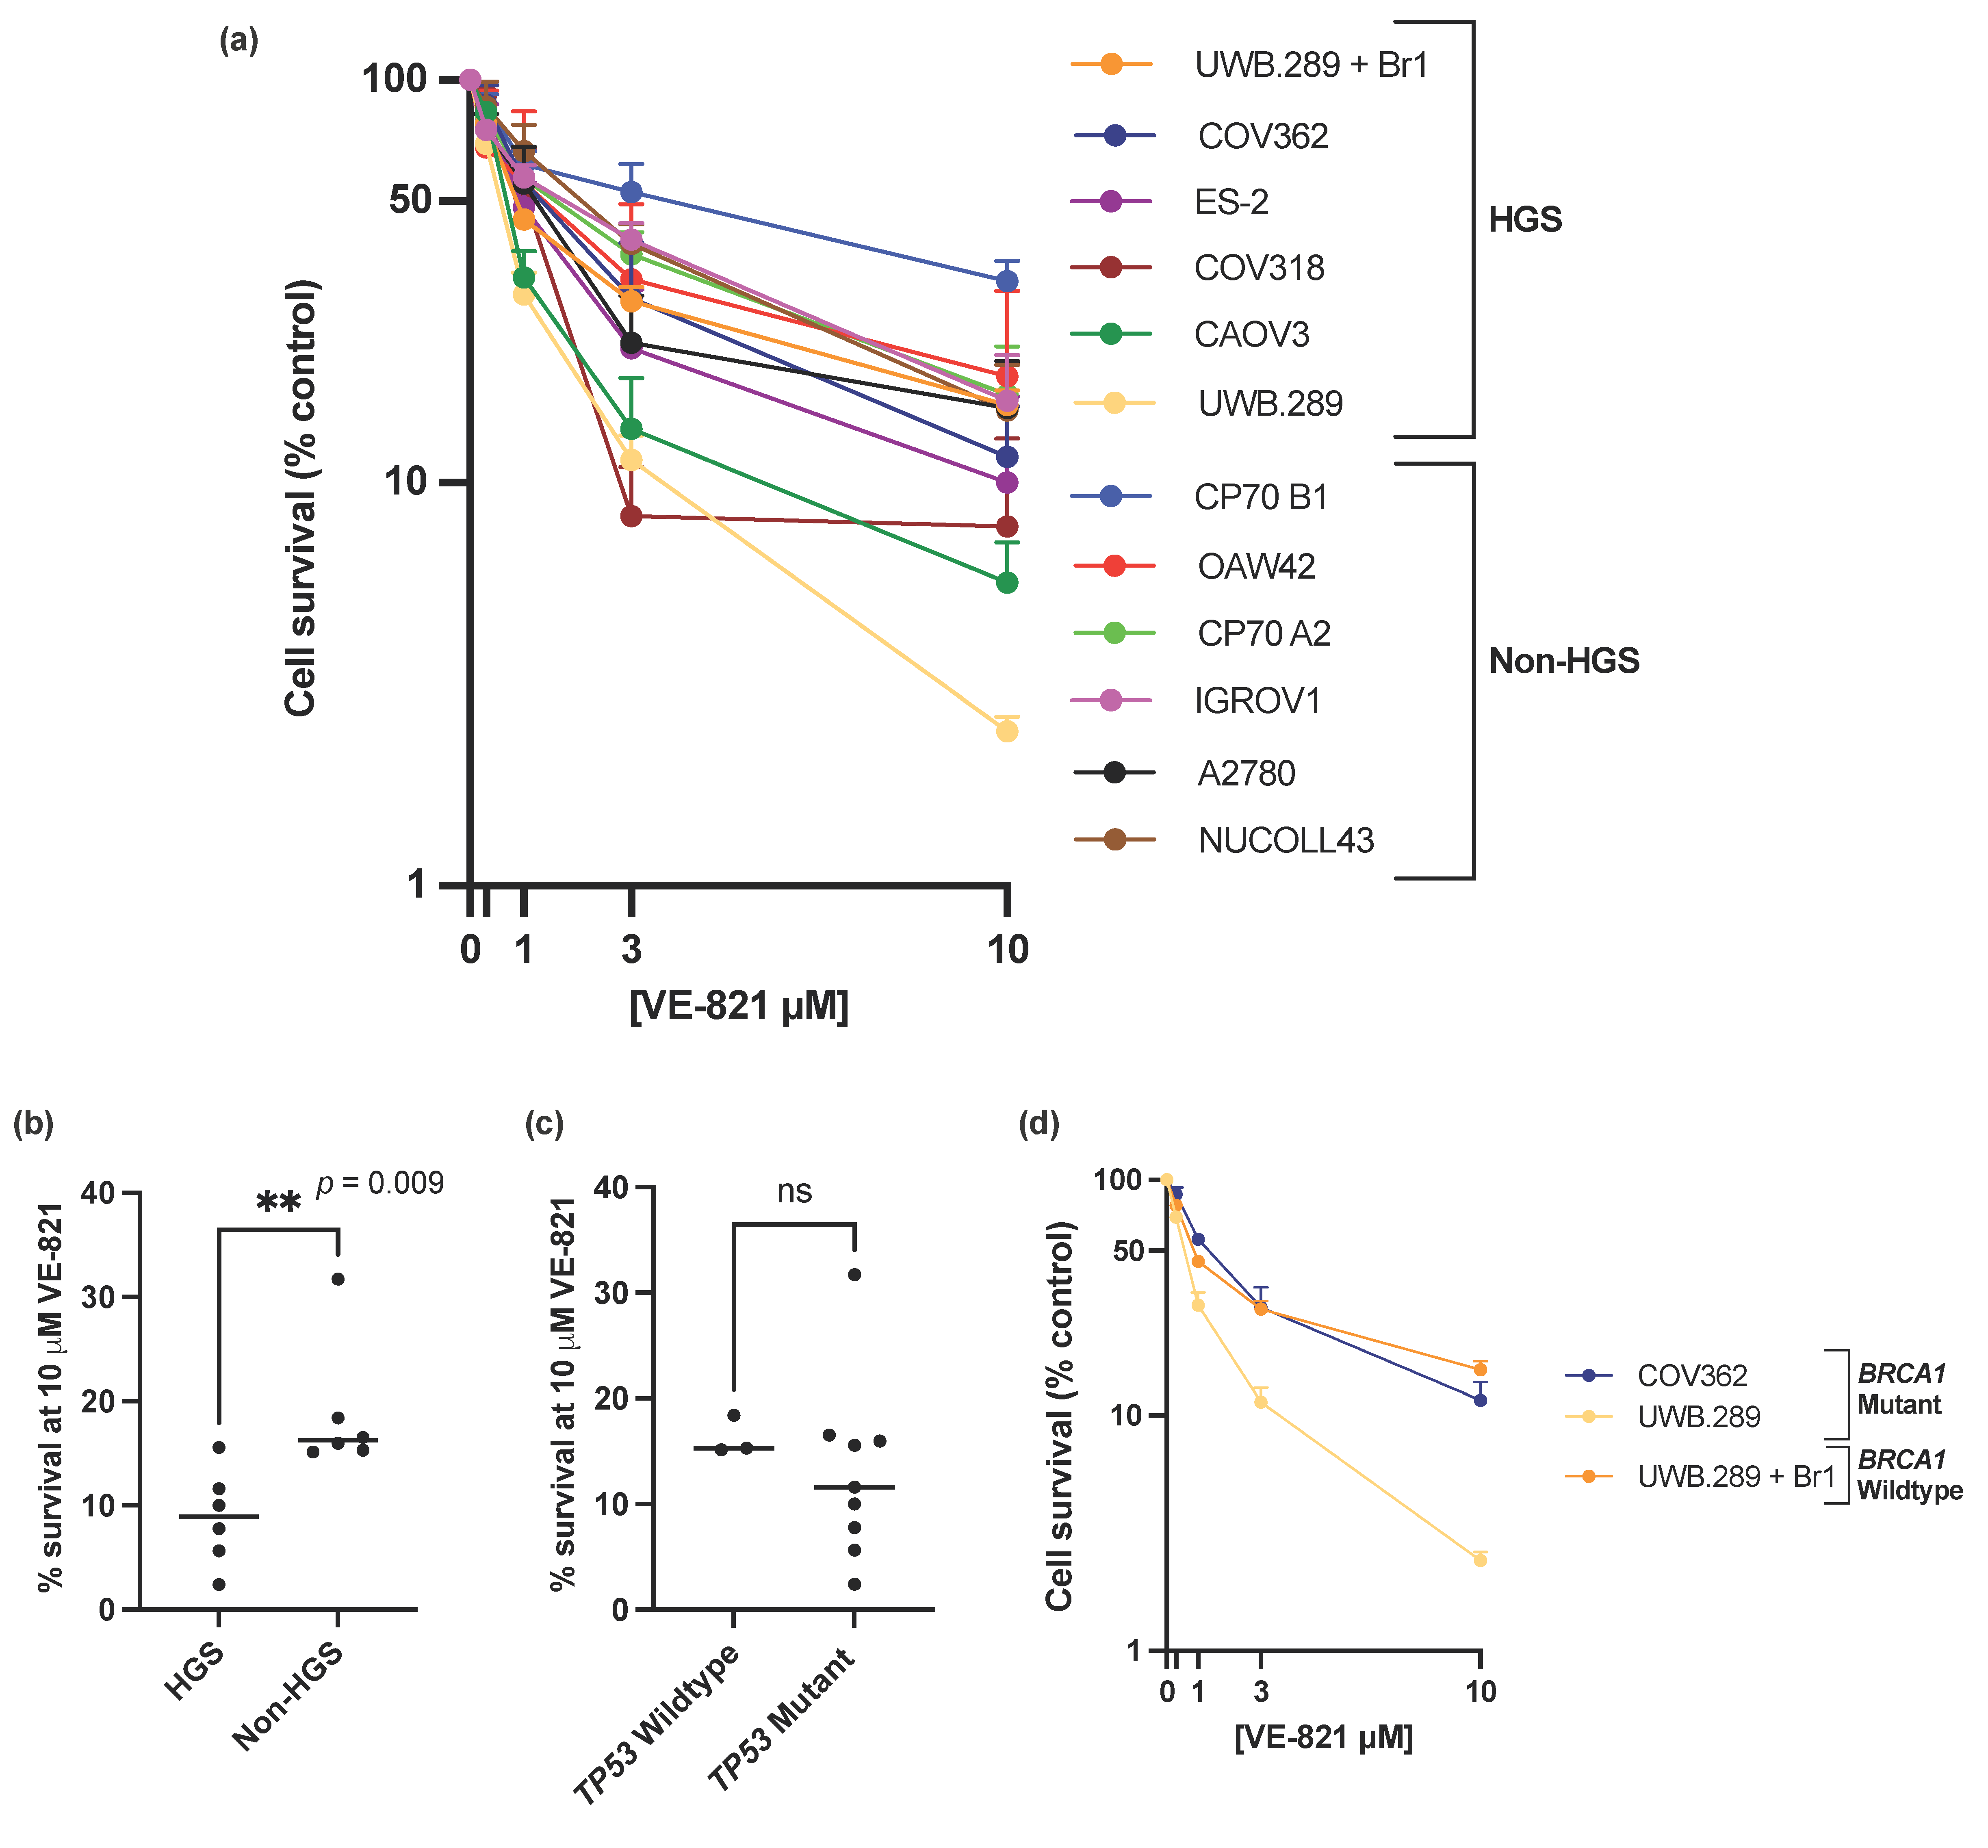
ATRi VE-821 showed a broad spectrum of single agent activity across the panel of ovarian cancer cell lines (Figure 1a), with a 13-fold difference of percentage cell survival at 10 µM VE-821 between the least sensitive CP70 B1 (31.7% survival) and the most sensitive UWB1.289 (2.4% survival) (Figure 1a and Supplementary Table S1) and a 6-fold difference in the LC50 values between the CP70 B1 cell line (LC50 = 4.13 µM) and the UWB1.289 cell line (LC50 = 0.64 µM) (Supplementary Table S1). To demonstrate that the difference in sensitivity to VE-821 across the panel of cell lines was an ATRi class effect rather than VE-821 specific, sensitivity to the clinical ATRi candidate berzosertib was also investigated in the IRGOV1 and CAOV3 cells (Supplementary Table S2). The CAOV3 cells were 2–3x more sensitive to berzosertib than the IGROV1 cells, comparable to the difference in sensitivity to VE-821 between the two cell lines.
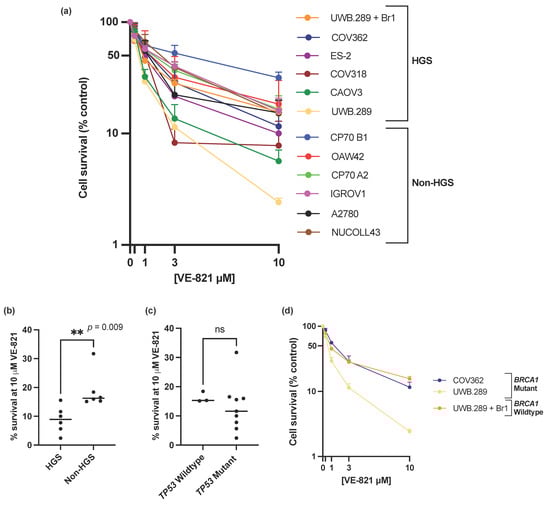
Figure 1.
(a) Mean single agent cytotoxicity of VE-821 by colony survival assay. All data points are mean ± SEM (at least 3 independent experiments). (b) Median percentage cell survival at 10 μM VE-821 of HGS and non-HGS cell line is indicated with horizontal black line. ** p < 0.01 (Mann–Whitney test). (c) Median percentage cell survival at 10 μM VE-821 of TP53 WT or mutant cell lines is indicated by horizontal black line. ns, p > 0.05 (Mann–Whitney test). TP53 Wildtype cell lines; OAW42, NUCOLL43, A2780, TP53 mutant cell lines; IGROV1, COV318, COV362, CAOV3, ES-2, UWB1.289, UWB1.289 + Br1, CP70 A2, CP70 B1. (d) Single agent cytotoxicity of VE-821 in BRCA1 mutant cell lines COV362 and UWB1.289, and BRCA1 corrected cell line UWB1.289 + Br1. All data points are mean ± SEM (at least 3 independent experiments).
The data clearly shows that that HGS cell lines were significantly more sensitive to single-agent VE-821 than non-HGS cell lines (p-value = 0.009) (Figure 1b, Supplementary Figure S1a). However, single molecular aberrations in the cell line panel were not able to consistently predict sensitivity to VE-821. Mutations in TP53, previously proposed as a determinant of ATRi cytotoxicity [15,17], and almost ubiquitous in HGSOC [5], was not associated with increased VE-821 cytotoxicity (Figure 1c, Supplementary Figure S1b). The BRCA1 mutant UWB1.289 cell line was significantly more sensitive to VE-821 than the BRCA1 corrected counterpart UWB1.289 + Br1 (un-paired t-test of percentage cell survival at 10 µM VE-821, p-value ≤ 0.0001). However, VE-821 was not particularly cytotoxic in the homozygous BRCA1 mutant COV362 cell line (Figure 1d) despite the cell line previously being shown to be HRD, and sensitive to PARPi (rucaparib) and carboplatin [41].
3.2. Reduced APOBEC3B, RAD51 and TopBP1 Protein Expression Was Associated with Increased Sensitivity to VE-821
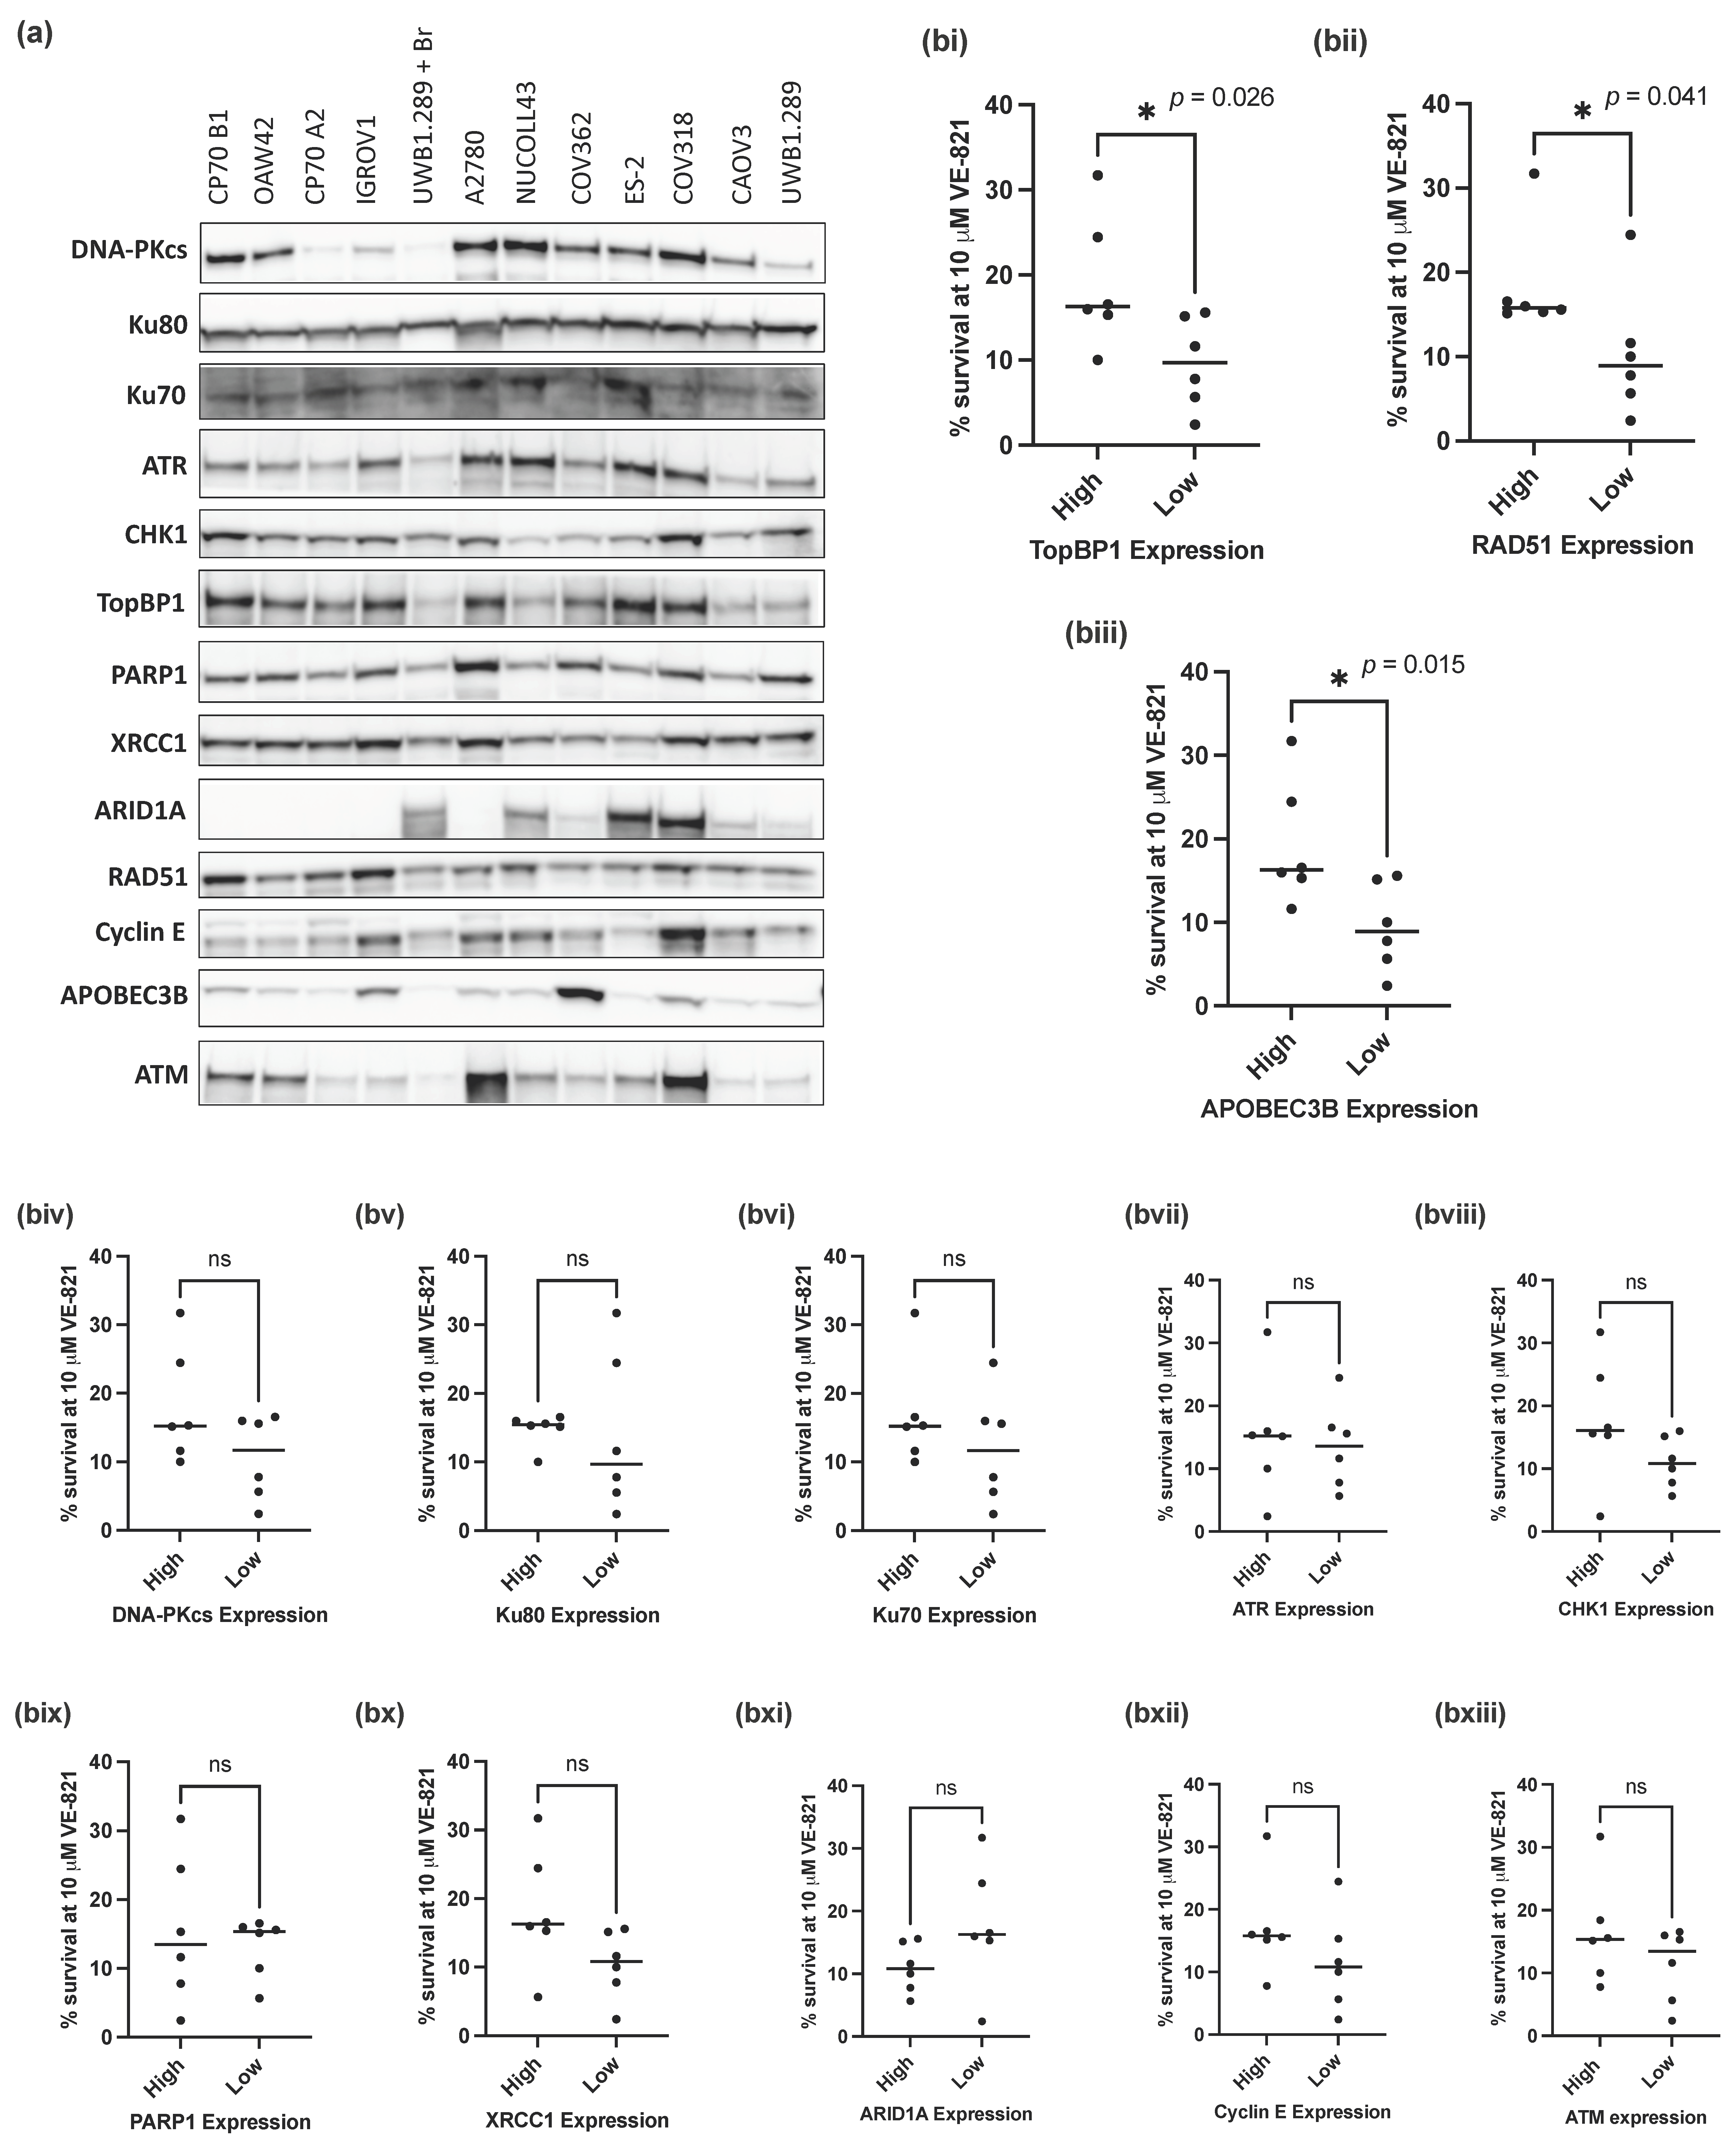
Since mutations in TP53 and BRCA1 were not predictive of sensitivity to VE-821, we investigated whether expression of 13 key proteins (DNA-PKcs, Ku80, Ku70, ATR, CHK1, PARP1, XRCC1, ARID1A, RAD51, TopBP1, Cyclin E, APOBEC3B and ATM) (Figure 2a), previously identified as determinants of sensitivity to ATRi, would associate with the sensitivity of the panel of ovarian cancer cell lines to VE-821.
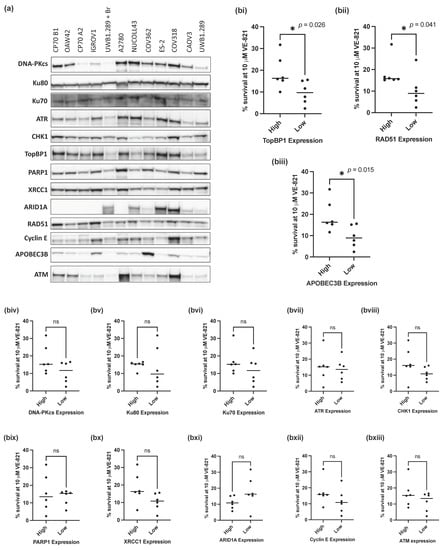
Figure 2.
Measurement of previously identified determinants of sensitivity to ATRi. (a) Representative Western blot of 3 independent experiments. (b) Mean survival at 10 μM VE-821 of cell lines split into high (above the median) or low (below the median) normalized protein expression for each of the following proteins: (i) TopBP1, (ii) RAD51, (iii) APOEB3B, (iv) DNA-PKcs, (v) Ku80, (vi) Ku70, (vii) ATR, (viii) CHK1, (ix) PARP1, (x) XRCC1, (xi) ARID1A, (xii) Cyclin E, (xiii) ATM. Data points are individual cell lines. The horizontal black bar indicates median survival of each group of cell lines. * p < 0.05; ns, not significant (Mann–Whitney test).
To assess the impact of different levels of protein expression on the sensitivity of the cell lines to VE-821, cell lines were classified as having high (above the cell line panel median) or low (below the median) protein expression for each of the 13 proteins analyzed. The percentage cell survival at 10 µM VE-821 of the cell lines with high or low protein expression was then assessed and compared for each individual protein. Of the 13 proteins analyzed, cells with low RAD51 (p-value = 0.041), TopBP1 (p-value = 0.026) and APOBEC3B (p-value = 0.015) protein expression (Figure 2(bi–biii)) had a significantly lower percentage cell survival at 10 µM VE-821 than those with high expression of either protein (Figure 2(biii–bxiii)). Contrary to expectation, there was no difference in survival associated with ATM levels (Figure 2(bxiii)).
Whilst statistical significance was not reached in the additional 10 proteins analyzed, cell lines with lower NHEJ protein expression (DNA-PKcs, Ku80 and Ku70) tended to have a lower percentage cell survival at 10 µM VE-821 (Figure 2(biv–bvi)).
ATRi and PARPi combinations have been shown to have synergistic cytotoxic activity in a variety of preclinical models [42,43,44] and are being evaluated in combination clinically [45]. We measured the expression of BER proteins PARP1 and XRCC1 in relation to VE-821 sensitivity (Figure 2(bix,x)); however, there was no difference in sensitivity to VE-821 between cells with high or low PARP1 expression. However, PARP enzymatic activity, which does not correlate well with protein expression [46], may be a better predictor of sensitivity to VE-821. Cells with low expression of XRCC1 (a PARP1 partner in DNA repair) tended to be more sensitive to VE-821 but this was not statistically significant (p = 0.065), and it may be worth investigating in a larger panel of cell lines.
3.3. Increased Replication Stress Confers Sensitivity to Single Agent VE-821
Previous studies have shown that ATRi are more cytotoxic in cancer cell lines with increased RS [15,44,47,48,49]. Our data show that HGSOC cells were more sensitive to VE-821. HGSOC is characterized by genomic instability and DDR defects, which we hypothesized would increase the level of intrinsic RS. Therefore, we decided to assess the level of intrinsic RS across the panel of cell lines to establish if increased RS was associated with increased VE-821 sensitivity and hence responsible for the greater cytotoxicity in the HGSOC cells.
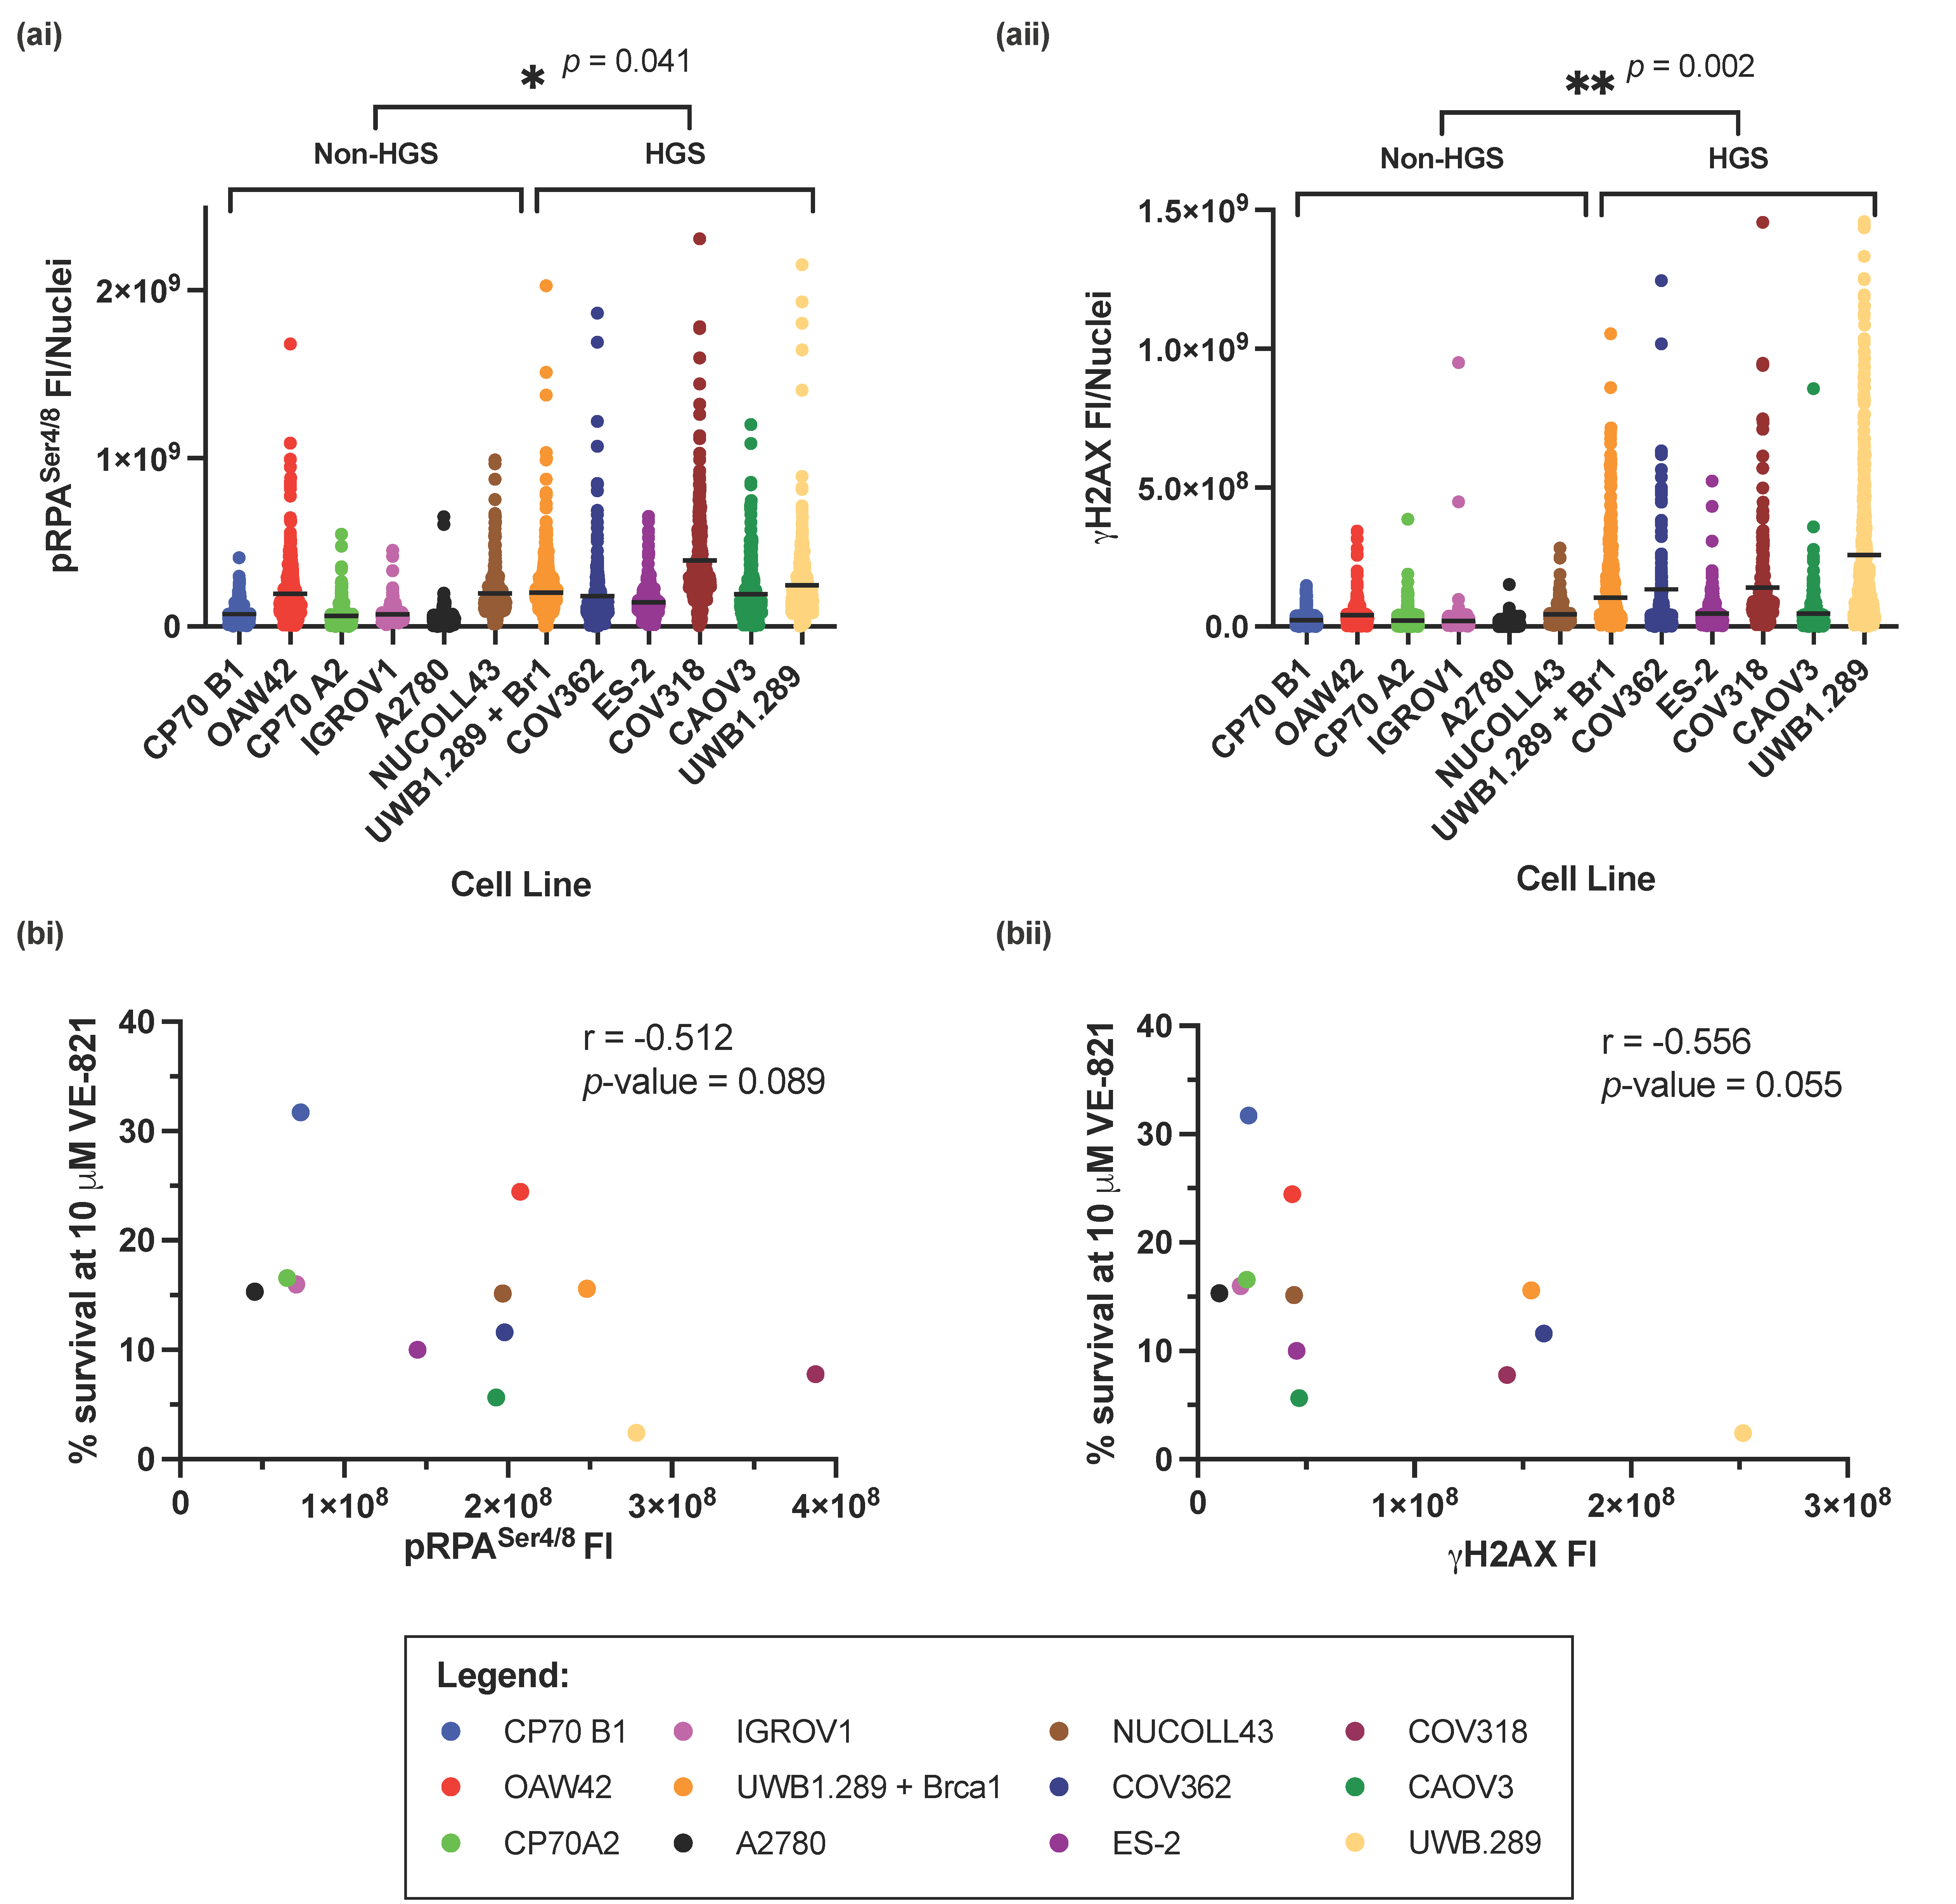
The RS markers pRPASer4/8 and γH2AX were measured across the panel of cell lines by immunofluorescence (IF) microscopy (Supplementary Figure S3), and fluorescence intensity (FI) was calculated. HGSOC cell lines had significantly higher levels of RS, by measurement of pRPASer4/8 (p-value = 0.041) (Figure 3(ai)) or γH2AX (p-value = 0.002) (Figure 3(aii)) suggesting that RS intrinsic to cell lines representative of HGSOC results in increased sensitivity to VE-821. However, overall, there was a negative correlation between cell survival at 10 µM VE-821 and pRPASer4/8 (Pearson’s correlation coefficient; r = −0.512, p-value = 0.089) (Figure 3(bi)), and γH2AX (Pearson’s correlation coefficient; r = −0.565, p-value = 0.055) (Figure 3(bii)) suggesting that independent of cell subtype, increased RS is a predictor of sensitivity to VE-821. Furthermore, 1 μM VE-821 potentiates the cytotoxicity of cells to cisplatin after induction of RS in IGROV1 and CAOV3 cells (Supplementary Figure S4).
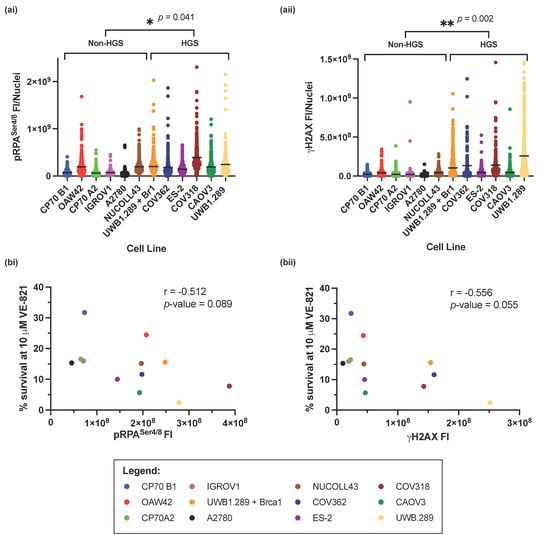
Figure 3.
Measurement of intrinsic replication stress in the panel of ovarian cancer cell lines. (a) The fluorescence intensity of (i) pRPASer4/8 and (ii) γH2AXSer139 from 3 independent experiments. Horizontal black line indicates the mean FI of either (i) pRPA or (ii) γH2AXSer139 in each cell line. At least 80 nuclei were analyzed in each cell line in each experiment. Statistical significance between HGS and non-HGS cell lines * p < 0.05; ** p < 0.01 (Mann–Whitney test) is indicated on the graph. (b) Pearson’s rank correlation between; mean percentage cell survival at 10 μM VE-821 and mean (i) pRPASer4/8 and (ii) γH2AXSer139 FI.
pRPASer4/8 and γH2AX measure slightly different aspects of RS. Whilst pRPASer4/8 measures the accumulation of ssDNA, an early event in RS onset, γH2AX measures the development of DSBs, a probable consequence of persistent RS. Despite this, levels of pRPASer4/8 and γH2AX correlated well with each other across the panel of cell lines (Supplementary Figure S2, Pearson’s correlation coefficient; r = −0.744, p-value = 0.004).
4. Discussion
Multiple ATRi are currently in clinical trial as monotherapy and in combination with chemotherapeutics, radiotherapy, PARPi or immune checkpoint inhibitors. The development of these molecularly targeted drugs has driven the search for predictive biomarkers for patient treatment stratification. Whilst preclinical data are essential to identify and develop potential predictive biomarkers, much of it is based on studies using genetic modification of a single gene, which does not reflect the clinical situation where multiple determinants of resistance and sensitivity may be expressed in the same tumor.
We discovered that HGSOC cell lines were more sensitive to single agent VE-821 and focused our efforts on establishing why. Almost all HGSOCs are TP53 mutant. p53 has been described as a determinant of sensitivity to ATR inhibition, although data has been conflicting with some studies reporting that p53 dysfunction is a determinant of sensitivity to ATRi [15,16,17] whilst others report that it is not [18,50]. Despite HGSOC cells being more sensitive to VE-821, in the cell lines studied here TP53 mutation did not correlate with sensitivity to VE-821. Therefore p53 status may be a better determinant of chemo- or radio-sensitization to ATR inhibition, than ATRi monotherapy [18].
The most powerful determinant of sensitivity to ATR inhibition described pre-clinically and clinically is ATM dysfunction [17,19,20,21,22,42,51]. Recent results from phase I clinical studies have demonstrated durable anti-tumor activity of ATR inhibitors in advanced cancers with either deleterious ATM mutations or loss of ATM protein expression [52,53]. However, it should be noted that whilst ATM mutations are common in hematological malignancies, it has been predicted only 1–5% ovarian cancers contain somatic ATM mutations [5,54]. In this panel of cell lines, only the IGROV1 cells previously characterized as a hypermutated cell line [38] contained a heterozygous mutation in ATM; therefore, ATM mutation was not investigated as a determinant of sensitivity to VE-821. Despite this, ATM protein expression varied considerably across the panel of cell lines with an 18-fold difference in expression between the cells with the lowest ATM expression (CAOV3) and the highest expression (A2780). However, there was not a significant association between ATM expression levels and sensitivity to VE-821 in the panel of cell lines. This is in keeping with a recent study which found no association between ATM mutations and sensitivity to ATRi AZD6738, whilst ATM function did predict sensitivity to the drug [55]. Furthermore, a recently published phase II study of gemcitabine alone or gemcitabine + berzosertib (M6620) which retrospectively assessed the level of ATM expression by IHC, revealed that the addition of berzosertib to gemcitabine was beneficial irrespective of ATM protein expression [56,57]. Therefore, the value of ATM as a predictive biomarker is more complex than the literature once suggested.
RAD51 inhibition by the small molecular inhibitor BO2 was previously shown to significantly sensitize cells to the ATR inhibitor VE-821 [28], and HRR defects have also been identified as determinants of sensitivity to ATR inhibition in other studies [25,47]. Low RAD51 protein expression was identified as a determinant of sensitivity to VE-821 in this panel of cell lines. However, homozygous loss of BRCA1 was also found to confer sensitivity to VE-821 but only in the context of an isogenic cell line pair, suggesting that whilst HRR defects may be predictive of sensitivity to ATRi, BRCA genetic testing alone may not be sufficient for patient stratification.
Additional proteins identified as potential determinants of sensitivity to VE-821 in this panel of cell lines were APOBEC3B and TopBP1. APOBEC3B, belonging to a subclass of cytidine deaminases responsible for converting cytosine to uracil during RNA editing and retrovirus or retrotransposon restriction, have previously been linked to increased levels of RS and mutagenesis [58], and overexpression of both APOBEC3A and 3B was found to increase RS and selectively sensitize to ATR inhibition [32,33]. However, in this panel of cell lines the reverse was seen; cells with low APOBEC3B tended to be more sensitive to VE-821 and have decreased levels of RS as measured by pRPASer4/8 and γH2AX (although not statistically significant). Preclinical data suggesting APOBEC as a determinant of sensitivity to ATR inhibition has led to investigation of APOBEC in clinical trials with a subset of patients with mutations in APOBEC genes being investigated in the OLAPCO clinical trial (NCT02576444) investigating olaparib in combination with ATRi AZD6738, the results of which may further elucidate the significance of APOBEC as a predictive biomarker.
Previous studies reporting RS as a determinant of sensitivity to ATRi have assessed oncogene-induced RS by MYC [48,49], or overexpression of cyclin E [15,59,60,61]. Here, we investigated the relationship between cyclin E protein expression (expected to be amplified in ~20% HGSOCs [5]) and sensitivity to VE-821. However, whilst the relationship between the two was not significant, there was an unexpected trend towards cells with decreased cyclin E being more sensitive to VE-821. We hypothesized that cells with increased cyclin E may have adapted to an increased level of RS and therefore may be better equipped to deal with the consequences of ATR inhibition and survive, however there was no statistically significant relationship between cyclin E expression and RS measured by pRPASer4/8 and γH2AX.
Given the difficulty in translating single previously identified determinants of sensitivity to VE-821, we decided to assess the level of intrinsic RS by IF microscopy. Previous functional assessment of replication fork stability in short-term patient derived HGSOC organoids, indicated that replication fork instability is associated with increased sensitivity to berzosertib [47]. Here, we showed that independently of ovarian cancer cell phenotype, cell lines with increased levels of RS (pRPASer4/8 or γH2AX) were significantly more sensitive to VE-821. Cells lines representative of HGSOC were found to have significantly higher levels of RS, which could underlie their increased sensitivity to VE-821. Whilst pRPASer4/8 and γH2AX independently predicted sensitivity to VE-821, there was a more significant association between γH2AX FI and sensitivity to VE-821. γH2AX is the primary response to DSBs and is phosphorylated by ATR in S-phase in response to RS and collapsed replication forks [62], as well as by ATM and DNA-PK in response to DSBs in other phases of the cell cycle [63], therefore γH2AX may be a reliable biomarker of ATRi response, coupled with ATR dependence. IHC has previously been employed to successfully measure γH2AX and pRPASer33 in triple negative breast cancer [61], and γH2AX in ovarian cancer [64]. Therefore, to translate this predictive biomarker to the clinic, IHC of pRPASer4/8 and γH2AX as well as high-throughput quantitative imaging analysis should be assessed and validated.
Whilst assessment of a single predictive biomarker, e.g., TP53, ATM, BRCA1 may be more easily translated to the clinic, this study demonstrates that this approach may not be reliable when faced with complex cancer phenotypes. In conclusion, we propose RS may be a better predictive biomarker of ATRi monotherapy response than any single gene or protein in ovarian cancers.
Supplementary Materials
The following supporting information can be downloaded at: https://www.mdpi.com/article/10.3390/cells11152361/s1. Table S1: LC50 of VE-821 and survival at 10 μM VE-821; Table S2: Comparison of LC50 of VE-821 and berzosertib; Figure S1: (a) Median VE-821 LC50 of HGS and non-HGS cell line is indicated with horizontal black line. ** p < 0.01 (Mann–Whitney test). (b) Median VE-821 LC50 of TP53 WT or mutant cell lines is indicated by horizontal black line. ns, p > 0.05 (Mann–Whitney test).; Figure S2: Quantified expression of previously identified determinants of sensitivity to VE-821; Figure S3: Representative images of DAPI, pRPASer4/8 and γH2AXSer139 IF staining in exponentially growing untreated IGROV1; Figure S4: Cisplatin cytotoxicity is potentiated by 1 μM VE-821 after induction of replication stress. (a) Western blot of IGROV1 and CAOV3 cells treated with 3 μM Cisplatin or 1 μM VE-821 for 24 h. (b) Potentiation of cisplatin cytotoxicity with 1 μM VE-821. Figure S5: Pearson’s correlation between mean pRPASer4/8 and γH2AX fluorescence intensity.
Author Contributions
Methodology, data curation, formal analysis, and writing—original draft preparation, A.B.; funding acquisition, resources, and supervision, N.J.C., Y.D. and F.T.Z.; conceptualization, visualization, and writing—reviewing and editing, A.B., F.T.Z., Y.D. and N.J.C. All authors have read and agreed to the published version of the manuscript.
Funding
AB was funded by Merck (CrossRef Funder ID: 10.13039/100009945) and MRC iCASE studentship grant ref: MR/N017838 awarded to NJC and YD.
Institutional Review Board Statement
Not applicable.
Informed Consent Statement
Not applicable.
Acknowledgments
The authors would like to thank Merck KGaA, Darmstadt, Germany for donation of VE-821 to perform studies, as well as the Newcastle University Bioimaging unit for their support and assistance in this work.
Conflicts of Interest
A.B. was funded by Merck KGaA and VE-821 was supplied by Merck KGaA for studies. F.T.Z. is an employee of Merck KGaA, Darmstadt, Germany. Y.D. and N.J.C have received institutional funding (Newcastle University) from Merck KGaA.
References
- Bray, F.; Ferlay, J.; Soerjomataram, I.; Siegel, R.L.; Torre, L.A.; Jemal, A. Global cancer statistics 2018: GLOBOCAN estimates of incidence and mortality worldwide for 36 cancers in 185 countries. CA Cancer J. Clin. 2018, 68, 394–424. [Google Scholar] [CrossRef] [PubMed] [Green Version]
- McCluggage, W.G. Morphological subtypes of ovarian carcinoma: A review with emphasis on new developments and pathogenesis. Pathology 2011, 43, 420–432. [Google Scholar] [CrossRef] [PubMed]
- Milanesio, M.C.; Giordano, S.; Valabrega, G. Clinical Implications of DNA Repair Defects in High-Grade Serous Ovarian Carcinomas. Cancers 2020, 12, 1315. [Google Scholar] [CrossRef]
- Wang, Z.C.; Birkbak, N.J.; Culhane, A.C.; Drapkin, R.; Fatima, A.; Tian, R.; Schwede, M.; Alsop, K.; Daniels, K.E.; Piao, H.; et al. Profiles of genomic instability in high-grade serous ovarian cancer predict treatment outcome. Clin. Cancer Res. Off. J. Am. Assoc. Cancer Res. 2012, 18, 5806–5815. [Google Scholar] [CrossRef] [Green Version]
- Integrated genomic analyses of ovarian carcinoma. Nature 2011, 474, 609–615. [CrossRef]
- Moore, K.; Colombo, N.; Scambia, G.; Kim, B.G.; Oaknin, A.; Friedlander, M.; Lisyanskaya, A.; Floquet, A.; Leary, A.; Sonke, G.S.; et al. Maintenance Olaparib in Patients with Newly Diagnosed Advanced Ovarian Cancer. N. Engl. J. Med. 2018, 379, 2495–2505. [Google Scholar] [CrossRef] [PubMed]
- González-Martín, A.; Pothuri, B.; Vergote, I.; DePont Christensen, R.; Graybill, W.; Mirza, M.R.; McCormick, C.; Lorusso, D.; Hoskins, P.; Freyer, G.; et al. Niraparib in Patients with Newly Diagnosed Advanced Ovarian Cancer. N. Engl. J. Med. 2019, 381, 2391–2402. [Google Scholar] [CrossRef] [Green Version]
- Ray-Coquard, I.; Pautier, P.; Pignata, S.; Pérol, D.; González-Martín, A.; Berger, R.; Fujiwara, K.; Vergote, I.; Colombo, N.; Mäenpää, J.; et al. Olaparib plus Bevacizumab as First-Line Maintenance in Ovarian Cancer. N. Engl. J. Med. 2019, 381, 2416–2428. [Google Scholar] [CrossRef] [PubMed]
- Hao, J.; Liu, Y.; Zhang, T.; He, J.; Zhao, H.; An, R.; Xue, Y. Efficacy and safety of PARP inhibitors in the treatment of advanced ovarian cancer: An updated systematic review and meta-analysis of randomized controlled trials. Crit. Rev. Oncol./Hematol. 2021, 157, 103145. [Google Scholar] [CrossRef]
- Prados-Carvajal, R.; Irving, E.; Lukashchuk, N.; Forment, J.V. Preventing and Overcoming Resistance to PARP Inhibitors: A Focus on the Clinical Landscape. Cancers 2022, 14, 44. [Google Scholar] [CrossRef] [PubMed]
- Saldivar, J.C.; Cortez, D.; Cimprich, K.A. The essential kinase ATR: Ensuring faithful duplication of a challenging genome. Nat. Rev. Mol. Cell Biol. 2017, 18, 622–636. [Google Scholar] [CrossRef] [PubMed] [Green Version]
- Massagué, J. G1 cell-cycle control and cancer. Nature 2004, 432, 298–306. [Google Scholar] [CrossRef]
- Croce, C.M. Oncogenes and Cancer. N. Engl. J. Med. 2008, 358, 502–511. [Google Scholar] [CrossRef] [PubMed] [Green Version]
- Halazonetis, T.D.; Gorgoulis, V.G.; Bartek, J. An Oncogene-Induced DNA Damage Model for Cancer Development. Science 2008, 319, 1352–1355. [Google Scholar] [CrossRef] [Green Version]
- Toledo, L.I.; Murga, M.; Zur, R.; Soria, R.; Rodriguez, A.; Martinez, S.; Oyarzabal, J.; Pastor, J.; Bischoff, J.R.; Fernandez-Capetillo, O. A cell-based screen identifies ATR inhibitors with synthetic lethal properties for cancer-associated mutations. Nat. Struct. Mol. Biol. 2011, 18, 721–727. [Google Scholar] [CrossRef] [Green Version]
- Toledo, L.I.; Murga, M.; Gutierrez-Martinez, P.; Soria, R.; Fernandez-Capetillo, O. ATR signaling can drive cells into senescence in the absence of DNA breaks. Genes Dev. 2008, 22, 297–302. [Google Scholar] [CrossRef] [Green Version]
- Kwok, M.; Davies, N.; Agathanggelou, A.; Smith, E.; Oldreive, C.; Petermann, E.; Stewart, G.; Brown, J.; Lau, A.; Pratt, G.; et al. ATR inhibition induces synthetic lethality and overcomes chemoresistance in TP53- or ATM-defective chronic lymphocytic leukemia cells. Blood 2016, 127, 582–595. [Google Scholar] [CrossRef] [PubMed] [Green Version]
- Middleton, F.K.; Pollard, J.R.; Curtin, N.J. The Impact of p53 Dysfunction in ATR Inhibitor Cytotoxicity and Chemo- and Radiosensitisation. Cancers 2018, 10, 275. [Google Scholar] [CrossRef] [PubMed] [Green Version]
- Vendetti, F.P.; Lau, A.; Schamus, S.; Conrads, T.P.; O’Connor, M.J.; Bakkenist, C.J. The orally active and bioavailable ATR kinase inhibitor AZD6738 potentiates the anti-tumor effects of cisplatin to resolve ATM-deficient non-small cell lung cancer in vivo. Oncotarget 2015, 6, 44289–44305. [Google Scholar] [CrossRef] [Green Version]
- Min, A.; Im, S.A.; Jang, H.; Kim, S.; Lee, M.; Kim, D.K.; Yang, Y.; Kim, H.J.; Lee, K.H.; Kim, J.W.; et al. AZD6738, A Novel Oral Inhibitor of ATR, Induces Synthetic Lethality with ATM Deficiency in Gastric Cancer Cells. Mol. Cancer Ther. 2017, 16, 566–577. [Google Scholar] [CrossRef] [Green Version]
- Perkhofer, L.; Schmitt, A.; Romero Carrasco, M.C.; Ihle, M.; Hampp, S.; Ruess, D.A.; Hessmann, E.; Russell, R.; Lechel, A.; Azoitei, N.; et al. ATM Deficiency Generating Genomic Instability Sensitizes Pancreatic Ductal Adenocarcinoma Cells to Therapy-Induced DNA Damage. Cancer Res. 2017, 77, 5576–5590. [Google Scholar] [CrossRef] [PubMed] [Green Version]
- Schmitt, A.; Knittel, G.; Welcker, D.; Yang, T.P.; George, J.; Nowak, M.; Leeser, U.; Büttner, R.; Perner, S.; Peifer, M.; et al. ATM Deficiency Is Associated with Sensitivity to PARP1- and ATR Inhibitors in Lung Adenocarcinoma. Cancer Res. 2017, 77, 3040–3056. [Google Scholar] [CrossRef] [PubMed] [Green Version]
- Peasland, A.; Wang, L.Z.; Rowling, E.; Kyle, S.; Chen, T.; Hopkins, A.; Cliby, W.A.; Sarkaria, J.; Beale, G.; Edmondson, R.J.; et al. Identification and evaluation of a potent novel ATR inhibitor, NU6027, in breast and ovarian cancer cell lines. Br. J. Cancer 2011, 105, 372–381. [Google Scholar] [CrossRef] [Green Version]
- Sultana, R.; Abdel-Fatah, T.; Perry, C.; Moseley, P.; Albarakti, N.; Mohan, V.; Seedhouse, C.; Chan, S.; Madhusudan, S. Ataxia Telangiectasia Mutated and Rad3 Related (ATR) Protein Kinase Inhibition Is Synthetically Lethal in XRCC1 Deficient Ovarian Cancer Cells. PLoS ONE 2013, 8, e57098. [Google Scholar] [CrossRef] [Green Version]
- Middleton, F.K.; Patterson, M.J.; Elstob, C.J.; Fordham, S.; Herriott, A.; Wade, M.A.; McCormick, A.; Edmondson, R.; May, F.E.; Allan, J.M.; et al. Common cancer-associated imbalances in the DNA damage response confer sensitivity to single agent ATR inhibition. Oncotarget 2015, 6, 32396–32409. [Google Scholar] [CrossRef] [Green Version]
- Hustedt, N.; Álvarez-Quilón, A.; McEwan, A.; Yuan, J.Y.; Cho, T.; Koob, L.; Hart, T.; Durocher, D. A consensus set of genetic vulnerabilities to ATR inhibition. Open Biol. 2019, 9, 190156. [Google Scholar] [CrossRef] [Green Version]
- Mohni, K.N.; Kavanaugh, G.M.; Cortez, D. ATR pathway inhibition is synthetically lethal in cancer cells with ERCC1 deficiency. Cancer Res. 2014, 74, 2835–2845. [Google Scholar] [CrossRef] [Green Version]
- Krajewska, M.; Fehrmann, R.S.; Schoonen, P.M.; Labib, S.; de Vries, E.G.; Franke, L.; van Vugt, M.A. ATR inhibition preferentially targets homologous recombination-deficient tumor cells. Oncogene 2015, 34, 3474–3481. [Google Scholar] [CrossRef]
- Wiegand, K.C.; Shah, S.P.; Al-Agha, O.M.; Zhao, Y.; Tse, K.; Zeng, T.; Senz, J.; McConechy, M.K.; Anglesio, M.S.; Kalloger, S.E.; et al. ARID1A mutations in endometriosis-associated ovarian carcinomas. N. Engl. J. Med. 2010, 363, 1532–1543. [Google Scholar] [CrossRef] [Green Version]
- McCormick, A.; Donoghue, P.; Dixon, M.; O’Sullivan, R.; O’Donnell, R.L.; Murray, J.; Kaufmann, A.; Curtin, N.J.; Edmondson, R.J. Ovarian Cancers Harbor Defects in Nonhomologous End Joining Resulting in Resistance to Rucaparib. Clin. Cancer Res. 2017, 23, 2050–2060. [Google Scholar] [CrossRef] [Green Version]
- Williamson, C.T.; Miller, R.; Pemberton, H.N.; Jones, S.E.; Campbell, J.; Konde, A.; Badham, N.; Rafiq, R.; Brough, R.; Gulati, A.; et al. ATR inhibitors as a synthetic lethal therapy for tumours deficient in ARID1A. Nat. Commun. 2016, 7, 13837. [Google Scholar] [CrossRef] [PubMed]
- Buisson, R.; Lawrence, M.S.; Benes, C.H.; Zou, L. APOBEC3A and APOBEC3B Activities Render Cancer Cells Susceptible to ATR Inhibition. Cancer Res. 2017, 77, 4567–4578. [Google Scholar] [CrossRef] [PubMed] [Green Version]
- Nikkilä, J.; Kumar, R.; Campbell, J.; Brandsma, I.; Pemberton, H.N.; Wallberg, F.; Nagy, K.; Scheer, I.; Vertessy, B.G.; Serebrenik, A.A.; et al. Elevated APOBEC3B expression drives a kataegic-like mutation signature and replication stress-related therapeutic vulnerabilities in p53-defective cells. Br. J. Cancer 2017, 117, 113–123. [Google Scholar] [CrossRef] [PubMed] [Green Version]
- Wang, Y.K.; Bashashati, A.; Anglesio, M.S.; Cochrane, D.R.; Grewal, D.S.; Ha, G.; McPherson, A.; Horlings, H.M.; Senz, J.; Prentice, L.M.; et al. Genomic consequences of aberrant DNA repair mechanisms stratify ovarian cancer histotypes. Nat. Genet. 2017, 49, 856–865. [Google Scholar] [CrossRef]
- Serebrenik, A.A.; Argyris, P.P.; Jarvis, M.C.; Brown, W.L.; Bazzaro, M.; Vogel, R.I.; Erickson, B.K.; Lee, S.H.; Goergen, K.M.; Maurer, M.J.; et al. The DNA Cytosine Deaminase APOBEC3B is a Molecular Determinant of Platinum Responsiveness in Clear Cell Ovarian Cancer. Clin. Cancer Res. 2020, 26, 3397–3407. [Google Scholar] [CrossRef] [Green Version]
- Charrier, J.D.; Durrant, S.J.; Golec, J.M.; Kay, D.P.; Knegtel, R.M.; MacCormick, S.; Mortimore, M.; O’Donnell, M.E.; Pinder, J.L.; Reaper, P.M.; et al. Discovery of potent and selective inhibitors of ataxia telangiectasia mutated and Rad3 related (ATR) protein kinase as potential anticancer agents. J. Med. Chem. 2011, 54, 2320–2330. [Google Scholar] [CrossRef]
- Franklin, M.; Gentles, L.; Matheson, E.; Bown, N.; Cross, P.; Ralte, A.; Gilkes-Immeson, C.; Bradbury, A.; Zanjirband, M.; Lunec, J.; et al. Characterization and drug sensitivity of a novel human ovarian clear cell carcinoma cell line genomically and phenotypically similar to the original tumor. Cancer Med. 2018, 7, 4744–4754. [Google Scholar] [CrossRef]
- Domcke, S.; Sinha, R.; Levine, D.A.; Sander, C.; Schultz, N. Evaluating cell lines as tumour models by comparison of genomic profiles. Nat. Commun. 2013, 4, 2126. [Google Scholar] [CrossRef]
- Romero-Calvo, I.; Ocón, B.; Martínez-Moya, P.; Suárez, M.D.; Zarzuelo, A.; Martínez-Augustin, O.; de Medina, F.S. Reversible Ponceau staining as a loading control alternative to actin in Western blots. Anal. Biochem. 2010, 401, 318–320. [Google Scholar] [CrossRef]
- Moritz, C.P. Tubulin or Not Tubulin: Heading Toward Total Protein Staining as Loading Control in Western Blots. Proteomics 2017, 17, 1600189. [Google Scholar] [CrossRef] [Green Version]
- Sharma Saha, S.; Gentles, L.; Bradbury, A.; Brecht, D.; Robinson, R.; O’Donnell, R.; Curtin, N.J.; Drew, Y. Genomic, Transcriptomic, and Functional Alterations in DNA Damage Response Pathways as Putative Biomarkers of Chemotherapy Response in Ovarian Cancer. Cancers 2021, 13, 1420. [Google Scholar] [CrossRef] [PubMed]
- Southgate, H.E.D.; Chen, L.; Tweddle, D.A.; Curtin, N.J. ATR Inhibition Potentiates PARP Inhibitor Cytotoxicity in High Risk Neuroblastoma Cell Lines by Multiple Mechanisms. Cancers 2020, 12, 1095. [Google Scholar] [CrossRef] [PubMed]
- Kim, H.; Xu, H.; George, E.; Hallberg, D.; Kumar, S.; Jagannathan, V.; Medvedev, S.; Kinose, Y.; Devins, K.; Verma, P.; et al. Combining PARP with ATR inhibition overcomes PARP inhibitor and platinum resistance in ovarian cancer models. Nat. Commun. 2020, 11, 3726. [Google Scholar] [CrossRef]
- Jo, U.; Senatorov, I.S.; Zimmermann, A.; Saha, L.K.; Murai, Y.; Kim, S.H.; Rajapakse, V.N.; Elloumi, F.; Takahashi, N.; Schultz, C.W.; et al. Novel and Highly Potent ATR Inhibitor M4344 Kills Cancer Cells with Replication Stress, and Enhances the Chemotherapeutic Activity of Widely Used DNA Damaging Agents. Mol. Cancer Ther. 2021, 20, 1431–1441. [Google Scholar] [CrossRef]
- Bradbury, A.; Hall, S.; Curtin, N.; Drew, Y. Targeting ATR as Cancer Therapy: A new era for synthetic lethality and synergistic combinations? Pharmacol. Ther. 2020, 207, 107450. [Google Scholar] [CrossRef]
- Zaremba, T.; Thomas, H.D.; Cole, M.; Coulthard, S.A.; Plummer, E.R.; Curtin, N.J. Poly(ADP-ribose) polymerase-1 (PARP-1) pharmacogenetics, activity and expression analysis in cancer patients and healthy volunteers. Biochem. J. 2011, 436, 671–679. [Google Scholar] [CrossRef] [PubMed] [Green Version]
- Hill, S.J.; Decker, B.; Roberts, E.A.; Horowitz, N.S.; Muto, M.G.; Worley, M.J., Jr.; Feltmate, C.M.; Nucci, M.R.; Swisher, E.M.; Nguyen, H.; et al. Prediction of DNA Repair Inhibitor Response in Short-Term Patient-Derived Ovarian Cancer Organoids. Cancer Discov. 2018, 8, 1404–1421. [Google Scholar] [CrossRef] [Green Version]
- Young, L.A.; O’Connor, L.O.; de Renty, C.; Veldman-Jones, M.H.; Dorval, T.; Wilson, Z.; Jones, D.R.; Lawson, D.; Odedra, R.; Maya-Mendoza, A.; et al. Differential Activity of ATR and WEE1 Inhibitors in a Highly Sensitive Subpopulation of DLBCL Linked to Replication Stress. Cancer Res. 2019, 79, 3762–3775. [Google Scholar] [CrossRef] [Green Version]
- King, D.; Southgate, H.E.D.; Roetschke, S.; Gravells, P.; Fields, L.; Watson, J.B.; Chen, L.; Chapman, D.; Harrison, D.; Yeomanson, D.; et al. Increased Replication Stress Determines ATR Inhibitor Sensitivity in Neuroblastoma Cells. Cancers 2021, 13, 6215. [Google Scholar] [CrossRef]
- Dillon, M.T.; Barker, H.E.; Pedersen, M.; Hafsi, H.; Bhide, S.A.; Newbold, K.L.; Nutting, C.M.; McLaughlin, M.; Harrington, K.J. Radiosensitization by the ATR Inhibitor AZD6738 through Generation of Acentric Micronuclei. Mol. Cancer Ther. 2017, 16, 25–34. [Google Scholar] [CrossRef] [Green Version]
- Menezes, D.L.; Holt, J.; Tang, Y.; Feng, J.; Barsanti, P.; Pan, Y.; Ghoddusi, M.; Zhang, W.; Thomas, G.; Holash, J.; et al. A synthetic lethal screen reveals enhanced sensitivity to ATR inhibitor treatment in mantle cell lymphoma with ATM loss-of-function. Mol. Cancer Res. 2015, 13, 120–129. [Google Scholar] [CrossRef] [PubMed] [Green Version]
- Yap, T.A.; O’Carrigan, B.; Penney, M.S.; Lim, J.S.; Brown, J.S.; de Miguel Luken, M.J.; Tunariu, N.; Perez-Lopez, R.; Rodrigues, D.N.; Riisnaes, R.; et al. Phase I Trial of First-in-Class ATR Inhibitor M6620 (VX-970) as Monotherapy or in Combination with Carboplatin in Patients with Advanced Solid Tumors. J. Clin. Oncol. 2020, 38, 3195–3204. [Google Scholar] [CrossRef]
- Yap, T.A.; Tan, D.S.P.; Terbuch, A.; Caldwell, R.; Guo, C.; Goh, B.C.; Heong, V.; Haris, N.R.M.; Bashir, S.; Drew, Y.; et al. First-in-Human Trial of the Oral Ataxia Telangiectasia and RAD3-Related (ATR) Inhibitor BAY 1895344 in Patients with Advanced Solid Tumors. Cancer Discov. 2021, 11, 80–91. [Google Scholar] [CrossRef] [PubMed]
- Choi, M.; Kipps, T.; Kurzrock, R. ATM Mutations in Cancer: Therapeutic Implications. Mol. Cancer Ther. 2016, 15, 1781–1791. [Google Scholar] [CrossRef] [PubMed] [Green Version]
- Wilson, Z.; Odedra, R.; Wallez, Y.; Wijnhoven, P.W.G.; Hughes, A.M.; Gerrard, J.; Jones, G.N.; Bargh-Dawson, H.; Brown, E.; Young, L.A.; et al. ATR Inhibitor AZD6738 (Ceralasertib) Exerts Antitumor Activity as a Monotherapy and in Combination with Chemotherapy and the PARP Inhibitor Olaparib. Cancer Res. 2022, 82, 1140–1152. [Google Scholar] [CrossRef] [PubMed]
- Konstantinopoulos, P.A.; da Costa, A.A.B.A.; Gulhan, D.; Lee, E.K.; Cheng, S.-C.; Hendrickson, A.E.W.; Kochupurakkal, B.; Kolin, D.L.; Kohn, E.C.; Liu, J.F.; et al. A Replication stress biomarker is associated with response to gemcitabine versus combined gemcitabine and ATR inhibitor therapy in ovarian cancer. Nat. Commun. 2021, 12, 5574. [Google Scholar] [CrossRef] [PubMed]
- Konstantinopoulos, P.A.; Cheng, S.-C.; Wahner Hendrickson, A.E.; Penson, R.T.; Schumer, S.T.; Doyle, L.A.; Lee, E.K.; Kohn, E.C.; Duska, L.R.; Crispens, M.A.; et al. Berzosertib plus gemcitabine versus gemcitabine alone in platinum-resistant high-grade serous ovarian cancer: A multicentre, open-label, randomised, phase 2 trial. Lancet Oncol. 2020, 21, 957–968. [Google Scholar] [CrossRef]
- Roberts, S.A.; Lawrence, M.S.; Klimczak, L.J.; Grimm, S.A.; Fargo, D.; Stojanov, P.; Kiezun, A.; Kryukov, G.V.; Carter, S.L.; Saksena, G.; et al. An APOBEC cytidine deaminase mutagenesis pattern is widespread in human cancers. Nat. Genet. 2013, 45, 970–976. [Google Scholar] [CrossRef]
- Ekholm-Reed, S.; Méndez, J.; Tedesco, D.; Zetterberg, A.; Stillman, B.; Reed, S.I. Deregulation of cyclin E in human cells interferes with prereplication complex assembly. J. Cell Biol. 2004, 165, 789–800. [Google Scholar] [CrossRef] [Green Version]
- Jones, R.M.; Mortusewicz, O.; Afzal, I.; Lorvellec, M.; García, P.; Helleday, T.; Petermann, E. Increased replication initiation and conflicts with transcription underlie Cyclin E-induced replication stress. Oncogene 2013, 32, 3744–3753. [Google Scholar] [CrossRef] [Green Version]
- Guerrero Llobet, S.; van der Vegt, B.; Jongeneel, E.; Bense, R.D.; Zwager, M.C.; Schröder, C.P.; Everts, M.; Fehrmann, R.S.N.; de Bock, G.H.; van Vugt, M.A.T.M. Cyclin E expression is associated with high levels of replication stress in triple-negative breast cancer. NPJ Breast Cancer 2020, 6, 40. [Google Scholar] [CrossRef] [PubMed]
- Rahmanian, N.; Shokrzadeh, M.; Eskandani, M. Recent advances in γH2AX biomarker-based genotoxicity assays: A marker of DNA damage and repair. DNA Repair 2021, 108, 103243. [Google Scholar] [CrossRef]
- Rothkamm, K.; Barnard, S.; Moquet, J.; Ellender, M.; Rana, Z.; Burdak-Rothkamm, S. DNA damage foci: Meaning and significance. Environ. Mol. Mutagenesis 2015, 56, 491–504. [Google Scholar] [CrossRef]
- Mei, L.; Hu, Q.; Peng, J.; Ruan, J.; Zou, J.; Huang, Q.; Liu, S.; Wang, H. Phospho-histone H2AX is a diagnostic and prognostic marker for epithelial ovarian cancer. Int. J. Clin. Exp. Pathol. 2015, 8, 5597–5602. [Google Scholar]
Publisher’s Note: MDPI stays neutral with regard to jurisdictional claims in published maps and institutional affiliations. |
© 2022 by the authors. Licensee MDPI, Basel, Switzerland. This article is an open access article distributed under the terms and conditions of the Creative Commons Attribution (CC BY) license (https://creativecommons.org/licenses/by/4.0/).