Article

HSP70 Gene Family in Brassica rapa: Genome-Wide Identification, Characterization, and Expression Patterns in Response to Heat and Cold Stress

State Key Laboratory of North China Crop Improvement and Regulation, Key Laboratory of Vegetable Germplasm Innovation and Utilization of Hebei, Collaborative Innovation Center of Vegetable Industry in Hebei, College of Horticulture, Hebei Agricultural University, Baoding 071000, China
*
Authors to whom correspondence should be addressed.
These authors contributed equally to this work.
Cells 2022, 11(15), 2316; https://doi.org/10.3390/cells11152316
Submission received: 23 May 2022 / Revised: 4 July 2022 / Accepted: 17 July 2022 / Published: 27 July 2022
(This article belongs to the Special Issue Epigenetic Mechanisms Regulating Plant Development)

Abstract

:
Heat shock proteins protect plants from abiotic stress, such as salt, drought, heat, and cold stress. HSP70 is one of the major members of the heat shock protein family. To explore the mechanism of HSP70 in Brassica rapa, we identified 28 putative HSP70 gene family members using state-of-the-art bioinformatics-based tools and methods. Based on chromosomal mapping, HSP70 genes were the most differentially distributed on chromosome A03 and the least distributed on chromosome A05. Ka/Ks analysis revealed that B. rapa evolution was subjected to intense purifying selection of the HSP70 gene family. RNA-sequencing data and expression profiling showed that heat and cold stress induced HSP70 genes. The qRT-PCR results verified that the HSP70 genes in Chinese cabbage (Brassica rapa ssp. pekinensis) are stress-inducible under both cold and heat stress. The upregulated expression pattern of these genes indicated the potential of HSP70 to mitigate environmental stress. These findings further explain the molecular mechanism underlying the responses of HSP70 to heat and cold stress.

1. Introduction

The heat shock transcription factor family strengthens plants under biotic and abiotic stress conditions; as a result, plants proceed with normal growth and development [1]. Temperature significantly affects plant growth; all plants require an optimum temperature for survival. Thus, many studies have been conducted on plants to explore the response to temperature stress [2,3]. (Heat shock treatment has been shown to stimulate a genetic network of proteins as a defense system in plants, and these proteins are named heat shock proteins (HSPs) [4]. HSPs are divided into subgroups on the basis of their molecular weight (60, 70, 90, and 100 KDa), named HSP60, HSP70, HSP90, and HSP100 gene families, respectively [5]. Of these heat shock families, HSP70 has been identified as the most conserved throughout evolution and play vital role in the maintenance of normal plant development under heat stress that can be induced by exposure to sublethal temperatures in eukaryotes [6,7,8]. HSP70 act as chaperons to protect the plant under temperature stress condition by covering the heat and cold sensitive molecules. It helps to reform their folding structure and repairing the deformed structures. All the HSP70 proteins consists of two functional domains named as nucleotide binding domain (NBD) and substrate binding domain (SBD) [9].
The HSP70 family, which encodes HSP70 proteins, has been identified and studied in many plants, such as Arabidopsis (17 genes), rice (26 genes), spinach (12 genes), and soybean (61 genes) [8]. In Arabidopsis, HSP70 deficient plants showed the stunted plant growth and abnormal leaf phenotype [10], double HSP70 knockout leads to the defective male and female gametes [11]. Furthermore, the cytosolic and nuclear HSP70 proteins showed significant role in Arabidopsis plant development under abiotic stress conditions [12]. To date, little information of HSP70 genes has been elucidated in Brassica crops. In the current study, the HSP70 gene family will be explored in a Brassica rapa family member. This vegetable-based family includes cabbage, Chinese cabbage, mustard, and turnip, which are sources of oil, amino acids, and proteins for humans and animals. These vegetables are highly susceptible to temperature stress [13] and are adversely affected by heat, cool, drought, and biotic stress during their cultivation, which causes germination delays, growth arrest, frost damage, and poor head yield [14].
Brassica rapa has gained remarkable economic and nutritional value due to its heading trait, which makes it highly susceptible to stress. Under temperature stress, the leaves become pale and weakened due to chloroplast damage, and the plant becomes unable to properly regulate photosynthesis [15]. Under such conditions, the HSP70 gene family plays an important role in protecting the plant and reestablishing the cellular and biological functioning of plants. Genome-wide identification and characterization of the HSP70 gene family have not been studied in Brassica rapa to date. We identified and explored the members of the HSP70 gene family, constructed their evolutionary tree and synteny correlations, and predicted protein structures with available bioinformatics software. Moreover, we analyzed the expression of these proteins by qRT-PCR to determine their responses to heat shock stress in Chinese cabbage (Brassica rapa subsp. Pekinensis). These findings will open up new gates for understanding the structure, function, and expression of HSP70 genes in B. rapa.

2. Methodology

2.1. Identification and Characterization of the HSP70 Gene Family

In the first step of genome wide analysis of the HSP70 gene family to identify and characterization, the amino acid sequences of A. thaliana HSP70 family genes (AT3G12580.1) was obtained from the TAIR Arabidopsis genome database (TAIR-Home Page arabidopsis.org (accessed on 20 April 2022). This sequence was used as a query to retrieve the HSP70 genes in the Brassica database (http://brassicadb.cn/#/BLASTP/, accessed on 20 April 2022). Secondly, the HMMER 3.1 (http://www.hmmer.org, accessed on 20 April 2022) and BLASTP with the threshold e-value set to 1e5 were performed using the Hidden Markov Model (HMM V 3.0) profiles of the HSP70 gene family (PF00012) were downloaded from the Pfam protein database (http://pfam.xfam.org/, accessed on 20 April 2022) and used as the inquiry, The default limitation of HMMER 3.1 was set to 0.01. Finally, total of 28 HSP70 were retrieved in the Brassica rapa genome. B.rapaHSP70 proteins were further characterized by determining the molecular weight, number of amino acids, isoelectric point, and grand average of hydropathicity (GRAVY) through the ProtParam tool (ExPASy-ProtParam tool, accessed on 20 April 2022). The protein sequences were uploaded to the online database Wolf PSORT for the prediction of subcellular localization (https://wolfpsort.hgc.jp/, accessed on 20 April 2022). Furthermore, the protein conserved domain was identified using the NCBI conserved domain online server (www.ncbi.nlm.nih.gov, accessed on 20 April 2022) and motif analysis was performed by using MEME Suite (meme-suite.org, accessed on 20 April 2022). The gene structure was predicted by the Gene Structure Display Server (GSDS) (http://gsds.cbi.pku.edu.cn/, accessed on 20 April 2022), using the CDS and genomic sequences of 28 selected B.rapaHSP70. Furthermore, prediction of the subcellular location pattern of each B.rapaHSP70 was carried out using the WoLF PSORT server (https://wolfpsort.hgc.jp/, accessed on 20 April 2022; [16]).

2.2. Phylogenetic Tree and Synteny Analysis of B.rapaHSP70 Family Proteins

The protein sequences of HSP70s from Arabidopsis, B. oleracea, and B. napus were retrieved to construct the phylogenetic tree using MEGA X (V 6.06) software (https://www.megasoftware.net/, https://wolfpsort.hgc.jp/, accessed on 20 April 2022). The sequences were multiple aligned and employed using the neighbor-joining (NJ) method with 1000 bootstrap replicates [17]. Synteny relationships of B. rapa with B. oleracea, B. napus, and Arabidopsis were developed using MCScanX to obtain collinearity files that were used to build dual synteny plots in TBtools (https://github.com/CJ-Chen/TBtools, accessed on 20 April 2022).

2.3. B.rapaHSP70 Duplicated Gene Identification and Purity Selection Analysis

Duplicated genes were retrieved using the Blast, MCScanX, and Advance Circos features of TBtools [18]. For the purity selection pressure of duplicated genes, the Ks/Ka value was calculated using the Ka/Ks Calculator in TbTools, and TMY was calculated using previous studies in B. rapa [19,20]. Synteny analysis was performed for the correlation prediction among B. rapa and its closely related species through TBtools [21].

2.4. Cis-Element Analysis of B.rapaHSP70 Gene Promoters and Protein Structure

Putative cis-elements of the 28 B.rapaHSP70 genes were classified, and the 2000 bp upstream of the start codon were downloaded from the BRAD database (http://brassicadb.cn, accessed on 20 April 2022). The PlantCARE web-based tool (http://bioinformatics.psb.ugent.be/webtools/plantcare/html/, accessed on 20 April 2022) was used for further classification, and the results were presented using TBtools. The graphical construction of the 3-dimensional (3D) structure of B.rapaHSP70 proteins was done using the online web-based software PHYRE2 (PHYRE2 Protein Fold Recognition Server (ic.ac.uk), selecting the fold recognition method [22].

2.5. Targeted miRNA Prediction and Functional Analysis

CDS sequences of B.rapaHSP70 were used to determine the interaction of genes with microRNAs using the psRNATarget database (http://plantgrn.noble.org/psRNATarget, accessed on 20 April 2022), and the interactions were further prophesied by Cytoscape Software. Gene ontology (GO) annotation was performed to explore functional characteristics. The B.rapaHSP70 gene sequences were uploaded to the online eggNOG database (http://eggnog-mapper.embl.de/, accessed on 20 April 2022). Then, the GO annotation data were handled by using (http://brassicadb.cn, accessed on 20 April 2022) and graphical demonstration was given by using OmicShare (https://www.omicshare.com/, accessed on 20 April 2022).

2.6. Digital Expression Analysis of B.rapaHSP70

RNA-seq data were used to determine the expression of B.rapaHSP70 genes in different tissues, and a heat map was constructed using TbTools [23]. The data used for expression profiling were retrieved from the NCBI Gene Expression Omnibus (http://www.ncbi.nlm.nih.gov/geo/, accessed on 20 April 2022) under accession no. GSE43245. In addition, expression profiles of B.rapaHSP70 under cold and heat stress conditions were obtained by performing qRT-PCR.

2.7. Plant Material and Stress Conditions

Seeds of Chinese cabbage were grown in pots containing soil: vermiculite mixture (3:1) in a controlled chamber (24/18 °C, 60–65% relative humidity, 16/8 day/night) until they reached the five-leaf stage. Cold and heat stress conditions were applied to five-leaf seedlings. Seedlings were transferred to 4 °C for cold stress and 45 °C for heat stress under the same day/night and humidity conditions. Three biological replications were used in both stress conditions. Leaf samples were harvested after 0, 1, 3, 6, 12, and 24 h, placed in liquid nitrogen, and stored at −80 °C [24].

2.8. RNA Extraction and qRT-PCR Analysis

Leaf samples were used to extract the RNA, and qRT-PCR was performed with three replicates to check B.rapaHSP70 gene expression; actin was used as the internal reference gene in Chinese cabbage. All primers used in this experiment are listed in Table S4 The 2−ΔΔCt method was used to check the relative expression levels, and the results were graphically represented [25].

3. Results

3.1. Identification and Characteristics of HSP70 Gene Family Members in B. rapa

In this study, 28 genes were selected for further analysis using the A. thaliana query sequence (Gene I.D AT3G125801), and all selected genes were named B.rapaHSP70-1B.rapaHSP70-28. These proteins were further analyzed for the HSP70 domain (PF00012) (Figure 1). Conserved motif along with phylogenetic tree demonstrate that all the B.rapaHSP70s are clustered into four groups (1, 2, 3 and 4), equal number and similar motif are present within each group except in group 4 (Figure 1A). Detailed information about the basic physical characteristics of the proteins is given in Table 1. Within the 28 HSP70 proteins, 12 members were localized in the cytoplasmic membrane, 5 in the endoplasmic reticulum, 4 in the chloroplast, 4 in the mitochondria, and 3 in the nucleus (Table 1). Gene structure predicts that the genes localized in the nucleus consists of the higher number of intron and exon while the cytoplasmic genes consist of the lower number of intron and exon (Figure 1B). The amino acid length of B.rapaHSP70 proteins was 636–894 aa. Among these, the shortest protein was B.rapaHSP70-15(636 aa), and the longest was B.rapaHSP70-28 (894 aa). The genes that translate into HSP70 proteins were distributed on 10 chromosomes, A01–A10. Among these, the maximum genes were distributed on chromosome A03 and the minimum on chromosomes A02, A04 and A05 (Figure 2).

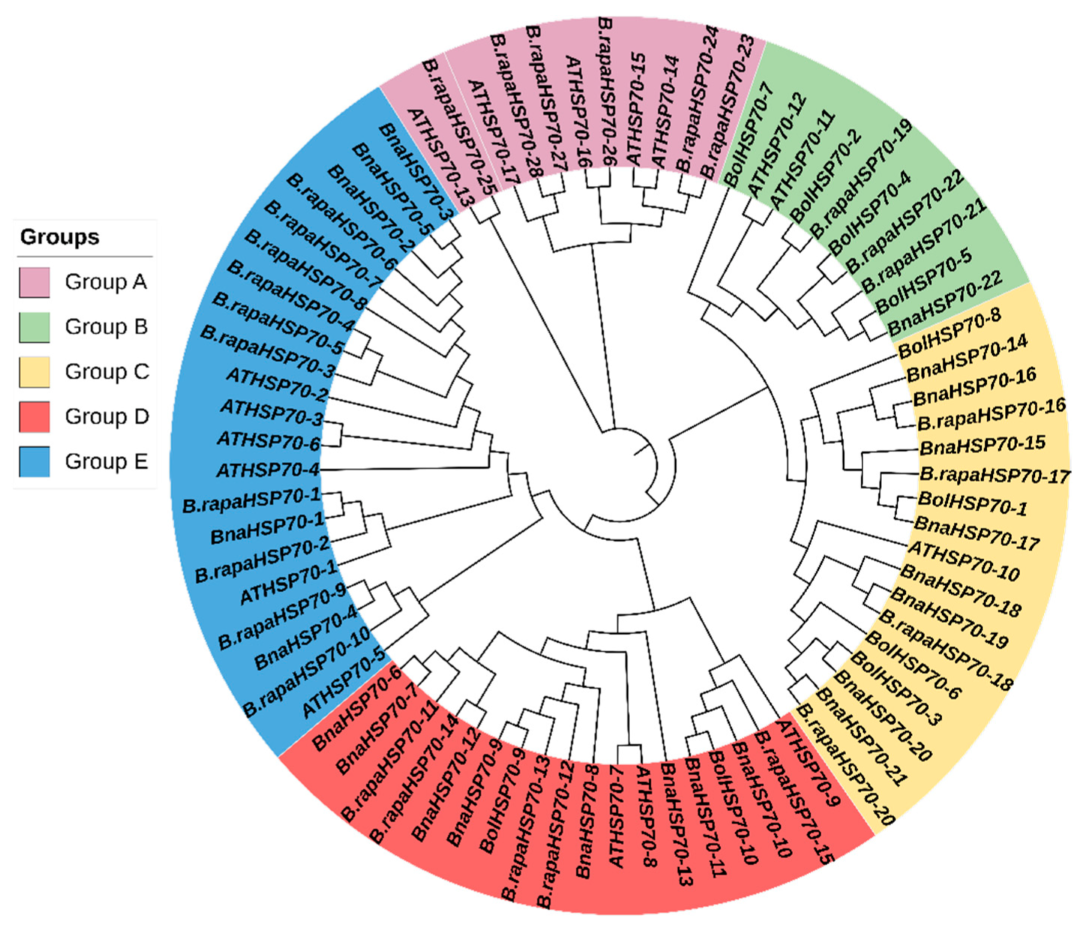
3.2. Evolutionary Relationship of B.rapaHSP70 Gene

The evolutionary relationships between B.rapaHSP70, B.nHSP70, B.olHSP70, and AtHSP70 were analyzed. Based on domains and a phylogenetic tree, 77 HSP70s were clustered into six major groups (A, B, C, D, and E) (Figure 3). The results from the evolutionary relationship showed that group A consists of 11 B. rapa, among which 5 members belonged to Arabidopsis. Group B was the largest group, containing 10 members, among which 4 members belonged to B. rapa, 1 member to B. napus, 3 to B. oleracea, and 2 to Arabidopsis. A total of 17 HSP70 members were clustered into group C, 4 from B. rapa, 8 from B. napus, 4 from B. oleracea, and 1 from Arabidopsis. Group D contained 18 members: 5 from B. rapa, 8 from B. napus, 2 from B. oleracea, and 3 from Arabidopsis. Group E consisted of 21 members: 10 from B. rapa, 5 from B. napus, and 6 from Arabidopsis. Hence, B.rapaHSP70s exhibited a close relationship with the other two Brassica crops (B. oleracea and B. napus) and Arabidopsis.

3.3. B.rapaHSP70 Gene Duplication and Ka/Ks Analysis

Gene duplication is one of the most important characteristics of a plant genomic structure, and it can occur by independent mechanisms resulting in segmental or tandem duplications. Due to the importance of gene duplications in the evolution of gene families in plants, we analyzed the gene duplication of putative B.rapaHSP70 genes in the B. rapa genome. We detected duplicated gene couples among the 28 B.rapaHSP70 genes identified in B. rapa (Figure 4A). Duplicated gene couples included BraA10g033140.3C/BraA10g033130.3C, BraA09g038510.3C/BraA01g027130.3C, BraA01g038810.3C/BraA03g035360.3C, BraA08g029700.3C/BraA06g012060.3C, BraA03g019440.3C/BraA03g016490.3C, BraA03g051830.3C/BraA08g020460.3C, BraA02g003050.3C/BraA03g003930.3C, BraA08g021750.3C/BraA01g001130.3C, BraA03g047170.3C/BraA01g019900.3C, and BraA06g001280.3C/BraA04g004290.3C. The value of Ka/Ks can be used as an indicator of the selection pressure of a gene during evolution. All of the values were <1, suggesting that the B.rapaHSP70 genes were primarily evolved under the influence of purifying selection [26]. The divergence time million year ago (TMY) value was calculated based on T = Ks/2x, and the value of x was used according to [20] (Table 2).

3.4. B.rapaHSP70 Gene Duplication and Synteny Analysis of the B.rapaHSP70 Gene Family among Closely Related Species

BraA10g033140.3C/BraA10g033130.3C, BraA09g038510.3C/BraA01g027130.3C, BraA01g038810.3C/BraA03g035360.3C, BraA08g029700.3C/BraA06g012060.3C, BraA03g019440.3C/BraA03g016490.3C, BraA03g051830.3C/BraA08g020460.3C, BraA02g003050.3C/BraA03g003930.3C, BraA08g021750.3C/BraA01g001130.3C, BraA03g047170.3C/BraA01g019900.3C, and BraA06g001280.3C/BraA04g004290.3C were determined (Figure 4A), which shows that segmental duplication events occurred during evolution. Furthermore, a number of orthologs were identified among A. thaliana, B. rapa (AA), B. napus (AC), and B. oleracea (CC) using collinearity analysis. In addition, a comparative synteny analysis of HSP70 gene pairs among B. rapa, B. napus, B. oleracea, and A. thaliana was conducted (Figure 4B). We selected these species on the base of highest morphotype similarity of B. rapa (such as Chinese cabbage) and B. oleracea (Cabbage) and B. napus (Mustard) was included due the presence of both sub genome (A and C). B.rapaHSP70 displayed the most collinearity with B. napus, followed by A. thaliana and B. oleracea. Results demonstrated that homologues genes from A genome of B. rapa are present in A as well as C genome of B.napus. Similar behavior was also observed in C genome of B. oleracea. These results suggest that, in addition to the whole genome duplication event, an independent duplication event also occurred during the evolution of these species.

3.5. Cis-Element Analysis in Promoter Regions of B.rapaHSP70 and Their Distribution

The sequence length of 2000 bp of all identified B.rapaHSP70 genes was retrieved and uploaded to the PlantCare database to examine the cis-elements in the promoter region. The graphical representation (Figure 5A) illustrates a summary of the cis-acting elements. In total, 5 phytohormonal (ABA, abscisic acid; MeJA, methyl jasmonate, GA, gibberellin, and SA, salicylic acid) associated elements and 4 abiotic stress (temperature, drought, and light, and salinity) responsive elements were identified. Maximum elements were found for light response and auxin hormone response, and minimum elements were found for salicylic acid response in all promoters of the 28 B.rapaHSP70 (Figure 5B and Table S1).

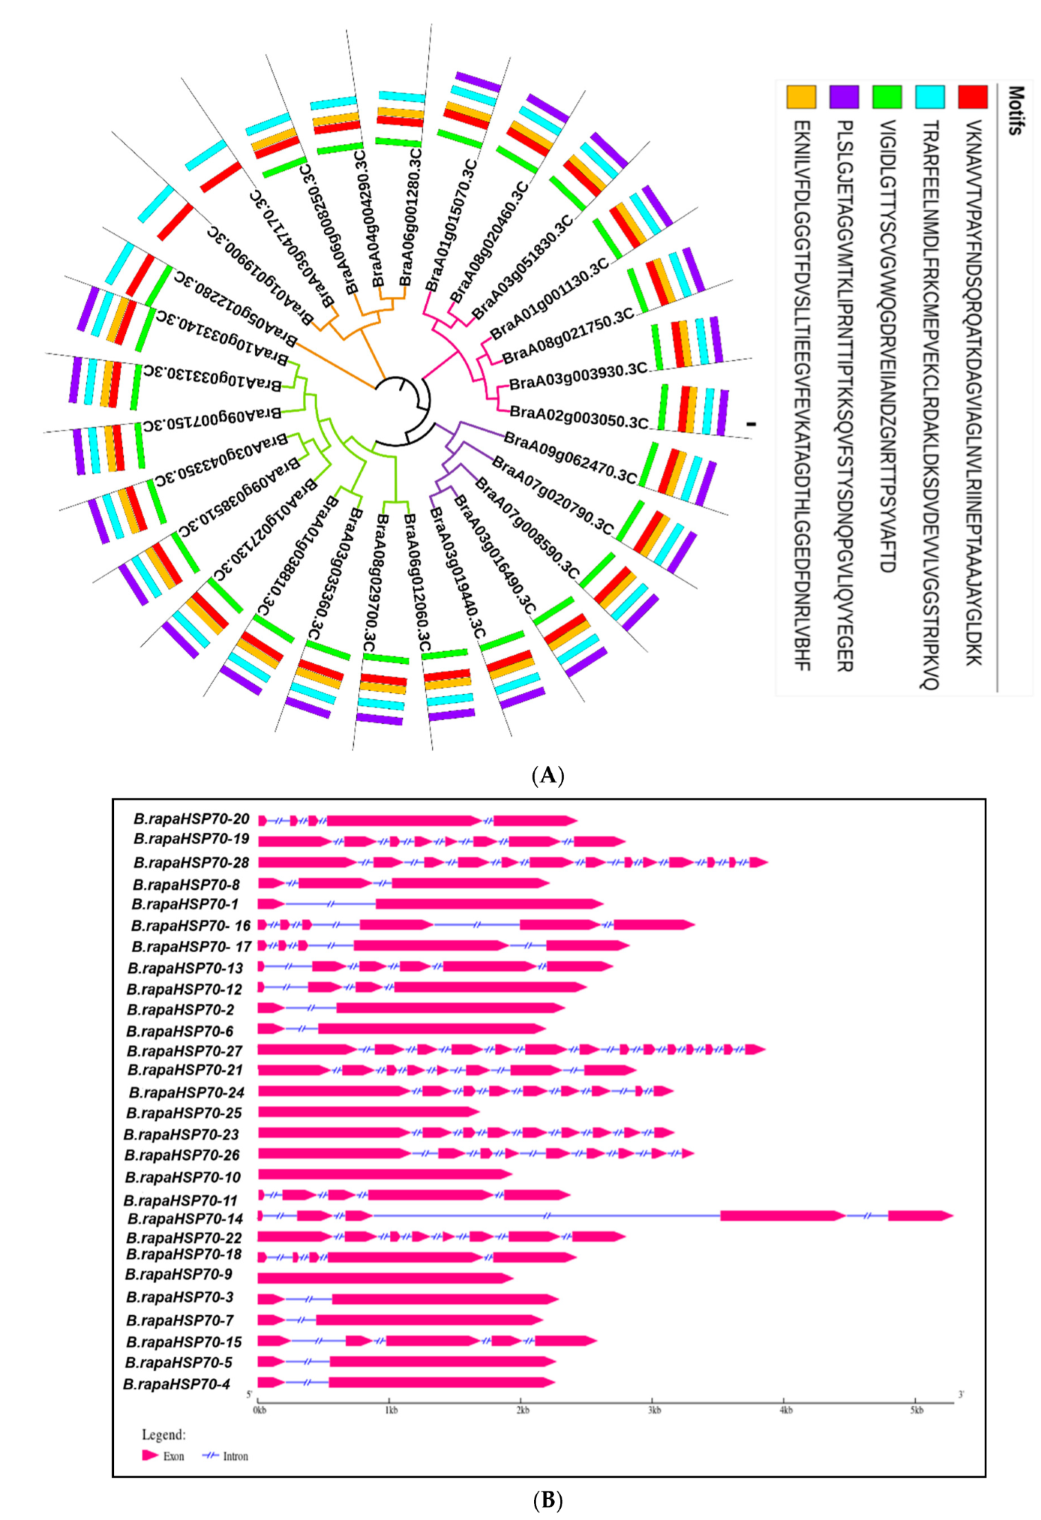
3.6. Prediction of the 3D Structures of B.rapaHSP70s

With the advent of graphical visualization of genomic data, 3D protein structures also explain the properties, as well as facilitate the comparative studies, of proteins. All 28 B.rapaHSP70s structures elucidate that all the HSP70 members in B. rapa possess the uniform monomer structure with alpha (α) helices and beta (β) sheets, because proteins with similar structures often have similar functions (Figure 6). Protein prediction also showed the existence of HSP70 domain (PF00012) in all the B.rapaHSP70s. The protein structures were modelled via c2khoA template at a confidence level of 100%. The overall fold of the B.rapaHSP70 domain remains similar to other known HSP70 with the typical (αβα) topology, thus preserving conserved signature fold of HSP70 family with central mixed β-sheet sandwiched between α-helices [27]. On the bases of protein structure guide design, binding ligand can be determined, which are essential to bind with the external or internal residues. In addition, the tertiary structure of proteins predicted physical connections, distinct functional roles, independent divergence sequences, and conserved biological properties in the B.rapaHSP70 protein family.

3.7. Genome-Wide Analysis of miRNA-Associated B.rapaHSP70 Genes

With all other factors, miRNAs have been reported to be crucial regulators of plant growth and development and have always been associated with stress responses in plants. Therefore, to further expand the knowledge of B.rapaHSP70 genes, we identified the miRNAs associated with the identified genes (Figure 7). We found that 34 types of microRNA are associated with the B.rapaHSP70s to regulate their functioning. Such as Bra-miRN355, Bra-miR390, Bra-miRN363, Bra-miR395, Bra-miR6032, Bra-miR159a, Bra-miRN366, Bra-miRN368, Bra-miRN351, Bra-miRN338, Bra-miR397, Bra-miRN324, and Bra-miR319, all are targeting the only one B.rapaHSP70 gene out of 28. Bra-miR162, Bra-miR168, Bra-miR394, Bra-miR396, Bra-miRN329, Bra-miR5714, Bra-miRN271, and Bra-miRN375 targeting the two different B.rapaHSP70 genes. Bra-miRN316, Bra-miRN347, Bra-miR5717, Bra-miR9556, and Bra-miRN371 targeting the three B.rapaHSP70 gene. Bra-miRN373, Bra-miR172, Bra-miRN317, Bra-miRN334, Bra-miRN348, and Bra-miR408 targeting the different four B.rapaHSP70 gene. Bra-miRN379 targeting the five different B.rapaHSP70s and Bra-miR858 targeting the maximum, six different B.rapaHSP70s (Figure 7). Detailed information of B.rapaHSP70s along with their respective targeting microRNAs is summarized in Table 3. Raw information of the miRNA-targeted sites is presented in Table S2.

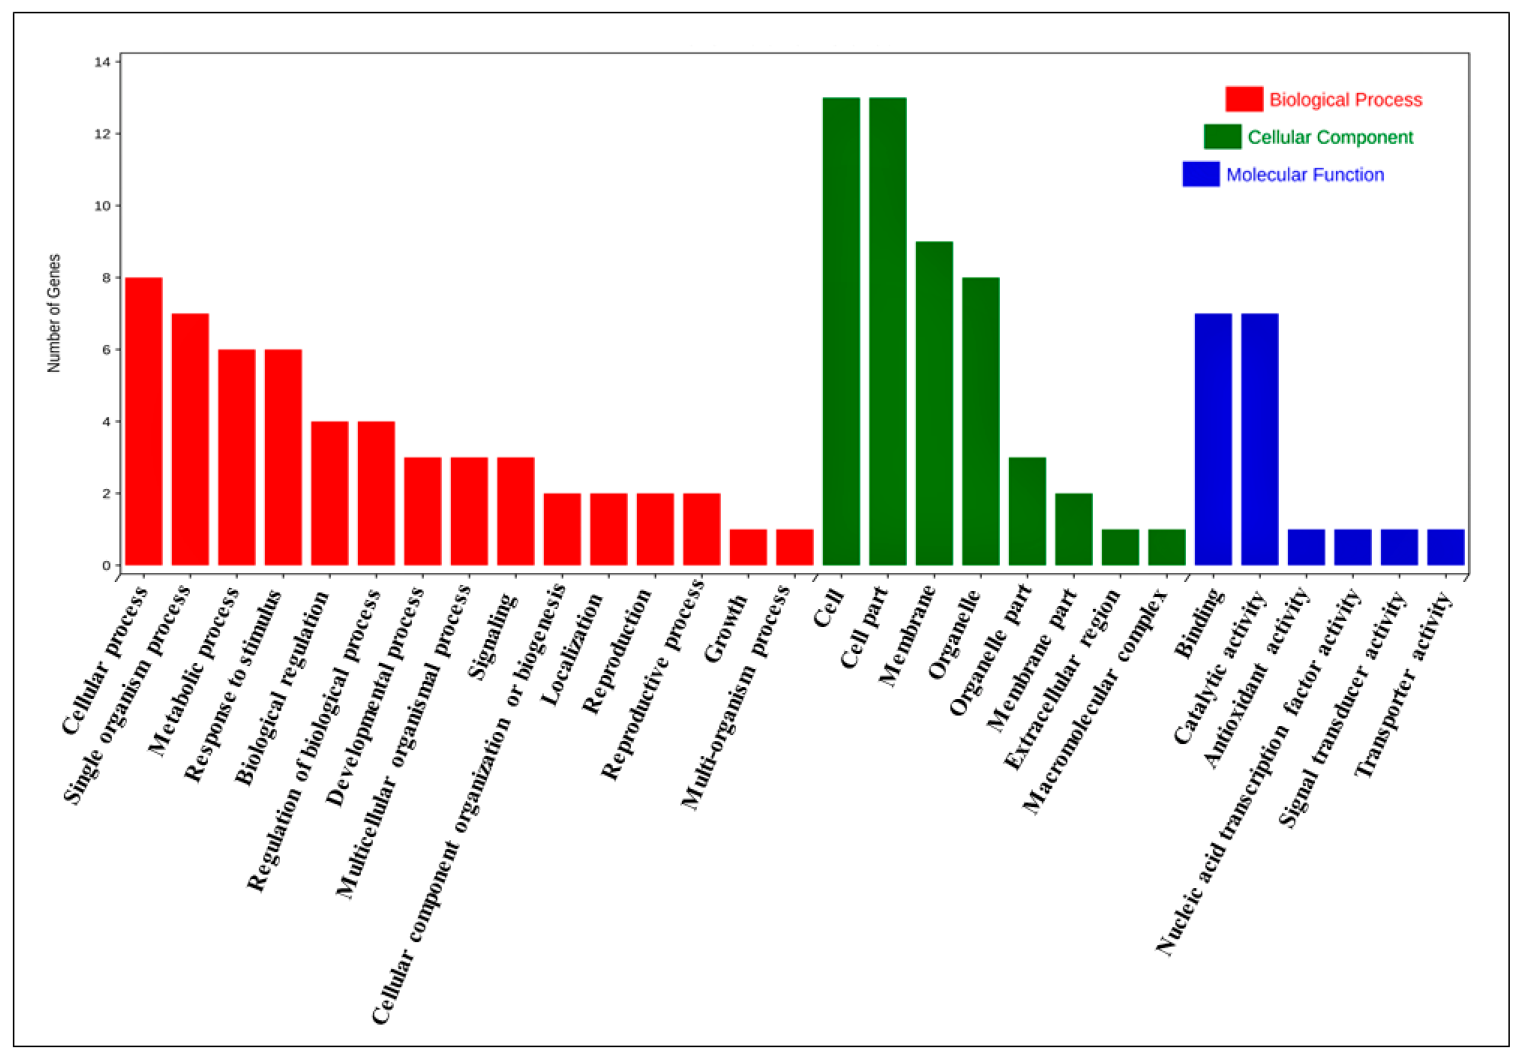
3.8. Functional Annotation Analysis of B.rapaHSP70 Genes

Functional analysis using GO annotation and enrichment terms, such as molecular function (MF), cellular component (CC), and biological process (BP), were investigated to further explore the B.rapaHSP70 genes’ functions. The annotation results for BP, MF, and CC exhibited several significantly enriched terms (Table S3). Some of the most enriched terms are highlighted in the subsequent section with a graphical illustration (Figure 8).
The GO-MF (Molecular Function) enrichment results detected 19 enriched terms, namely, protein serine/threonine phosphatase activity (GO:0004722 and GO:0004674), manganese ion binding (GO:0030145), pectate lyase activity (GO:0030570), 1-phosphatidylinositol binding (GO:0005545), glycoprotein binding (GO:0005515), DNA-binding transcription factor activity (GO:0003700), calmodulin binding (GO:0005516), cobalt ion binding (GO:0050897), clathrin binding (GO:0030276), ATP binding (GO:0005524 and GO:0005524), oligopeptide transmembrane transporter activity (GO:0015198), oxidoreductase activity (GO:0016491 and GO:0016491), glutathione peroxidase activity (GO:0004602), 2,3-bisphosphoglycerate-independent phosphoglycerate mutase activity (GO:0046537), protein serine/threonine kinase activity (GO:0004674), beta-amylase activity (GO:0016161), and maltose biosynthetic process (GO:0000024).
The GO-BP (Biological Process) enrichment results detected 26 enriched terms, namely, floral organ development (GO:0048437), oxidative stress responsive (GO:0006979), signal transduction (GO:0007165), signal transduction (GO:0006857), defense response (GO:0006952), pollen development (GO:0009555), male gamete generation (GO:0048235), signal transduction by cis-phosphorylation (GO:0007165), clathrin coat assembly (GO:0048268), regulation of transcription (GO:0006355), metabolic process (GO:0008152), salt stress responsive (GO:0009651), transmembrane transport (GO:0055085), plasma membrane organization (GO:0007009), glycolytic process (GO:0006096), abscisic acid responsive (GO:0009737), transmembrane receptor protein tyrosine kinase signaling pathway (GO:0007169), protein phosphorylation (GO:0006468), starch catabolic process (GO:0005983), cold stress responsive (GO:0009409), cadmium sensitivity/resistance (GO:0046686), regulation of meristem growth (GO:0010075), cadmium ion responsive (GO:0046686), temperature stimulus responsive (GO:0009409), maltose biosynthetic process (GO:0000024), and protein phosphorylation (GO:0006468).
The GO-CC (cellular component) enrichment results detected 29 enriched terms, including mitochondrial protein-transporting ATPase activity (GO:0005739 and GO:0005739), plasma membrane (GO:0005886), chloroplast envelope (GO:0009941), endomembrane system (GO:0012505), nucleus (GO:0005634 and GO:0005634), chloroplast (GO:0009507), apoplast (GO:0048046), endomembrane system (GO:0012505), chloroplast stroma (GO:0009570), cytosol (GO:0005829), clathrin coat (GO:0030118), mitochondrial envelope (GO:0005740), vacuole (GO:0005773), and integral component of membrane (GO:0016021) (Table S3).

3.9. Expression Profiling of B.rapaHSP70 Genes in Various Tissues

To illustrate the transcript levels of the B.rapaHSP70 genes, we examined 8 tissues and organs of B. rapa at various growth phases based on RNA-seq data of B. rapa (‘Chiifu-401-42’ variety; NCBI Gene Expression Omnibus; http://www.ncbi.nlm.nih.gov/geo/, accessed on 20 April 2022) under accession no. GSE43245. For instance, the expression patterns of most B.rapaHSP70 genes in the silique, callus, and flower were higher than those of other tissues (Figure 9). Three B.rapaHSP70 genes (B.rapaHSP70-10, B.rapaHSP70-11, B.rapaHSP70-12) showed no transcript changes in any tissue/organ.
The expression profiles of the B.rapaHSP70 genes varied in various tissues and organs. In silique, the expression level of B.rapaHSP70-4, B.rapaHSP70-9, and B.rapaHSP70-24 showing higher expression, and that of B.rapaHSP70-19 was lowest. In callus, B.rapaHSP70-25 was highly expressed, and B.rapaHSP70-10, B.rapaHSP70-11, B.rapaHSP70-12, B.rapaHSP70-16, B.rapaHSP70-18, B.rapaHSP70-20, B.rapaHSP70-4, and B.rapaHSP70-4 was the least expressed. In callus, B.rapaHSP70-4, B.rapaHSP70-9, B.rapaHSP70-24 and B.rapaHSP70-25 are expressing highly and B.rapaHSP70-10, B.rapaHSP70-11, B.rapaHSP70-12, B.rapaHSP70-18, B.rapaHSP70-22 and B.rapaHSP70-28 are showing no expression change. In stem, B.rapaHSP70-4, B.rapaHSP70-9, B.rapaHSP70-24 and B.rapaHSP70-25 are highly expressing, whereas B.rapaHSP70-10, B.rapaHSP70-11, B.rapaHSP70-12, B.rapaHSP70-16, B.rapaHSP70-20, and B.rapaHSP70-26 showing no expression change. In roots, B.rapaHSP70-4, B.rapaHSP70-9, B.rapaHSP70-24, and B.rapaHSP70-25 are highly expressed, whereas B.rapaHSP70-10, B.rapaHSP70-11, B.rapaHSP70-12, B.rapaHSP70-16, B.rapaHSP70-20, and B.rapaHSP70-26 showing no expression change. In flower, B.rapaHSP70-4, B.rapaHSP70-9, and B.rapaHSP70-24 are highly expressed genes, whereas B.rapaHSP70-10, B.rapaHSP70-11, B.rapaHSP70-12, B.rapaHSP70-16, and B.rapaHSP70-22 showing zero expression change. Lastly, the expression was analyzed in leaf, according to the expression pattern the B.rapaHSP70-4, B.rapaHSP70-9, B.rapaHSP70-17, B.rapaHSP70-24, and B.rapaHSP70-25 showing higher expression whereas B.rapaHSP70-10, B.rapaHSP70-11, B.rapaHSP70-12, B.rapaHSP70-16, B.rapaHSP70-20, and B.rapaHSP70-26 showing no expression change. These findings suggest that these candidate genes may play diverse roles in regulating B. rapa growth processes (Figure 9).

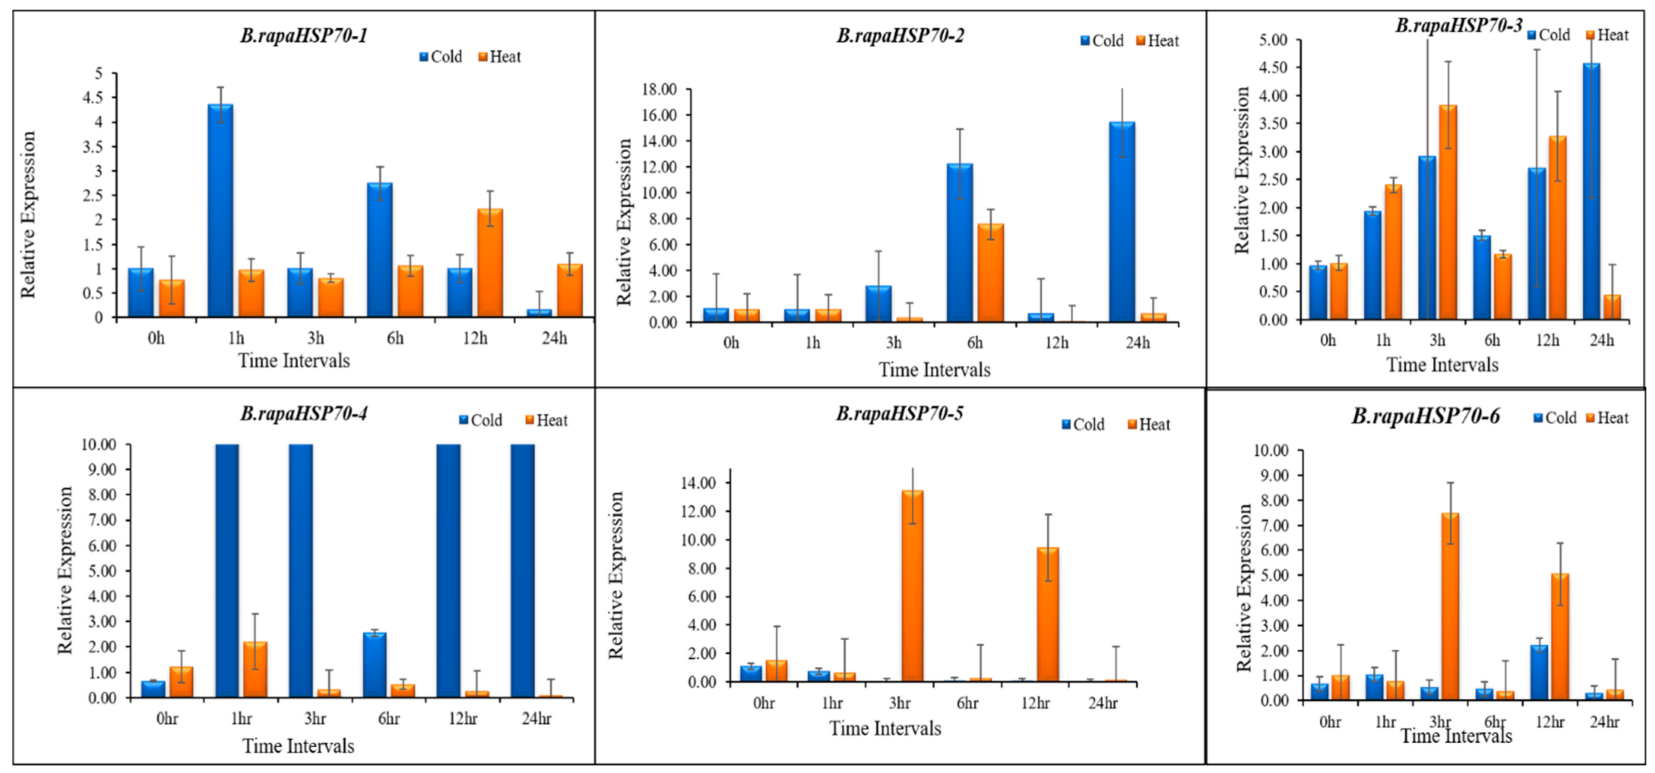
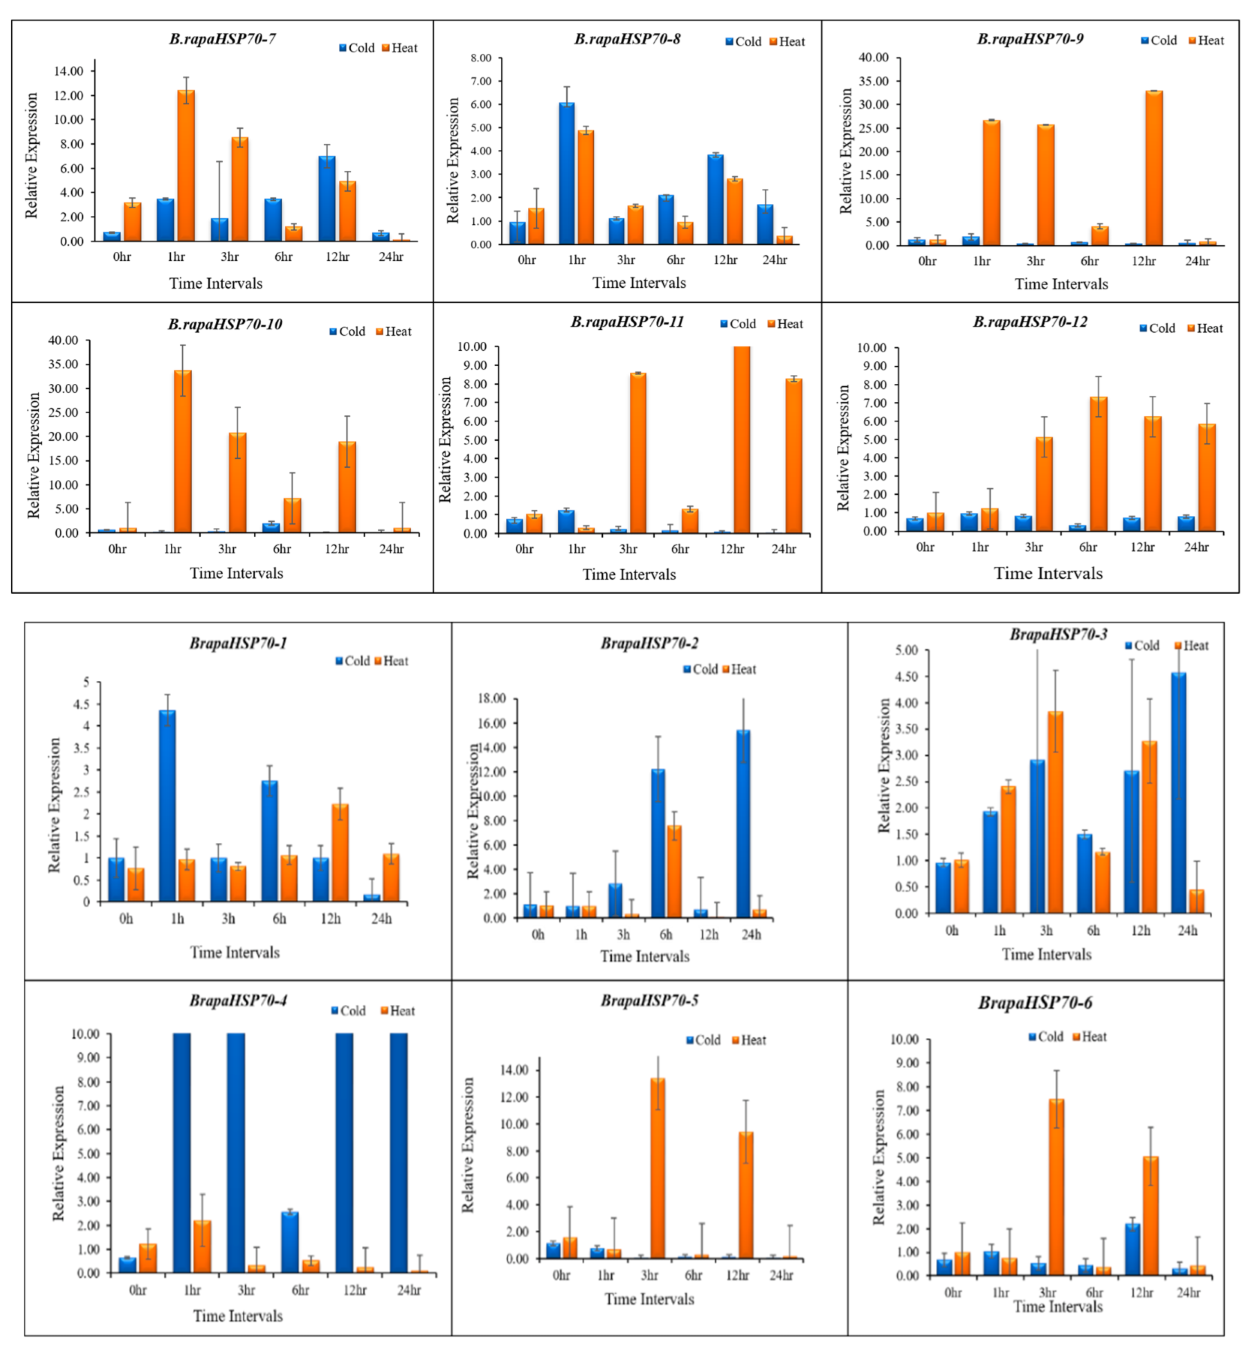
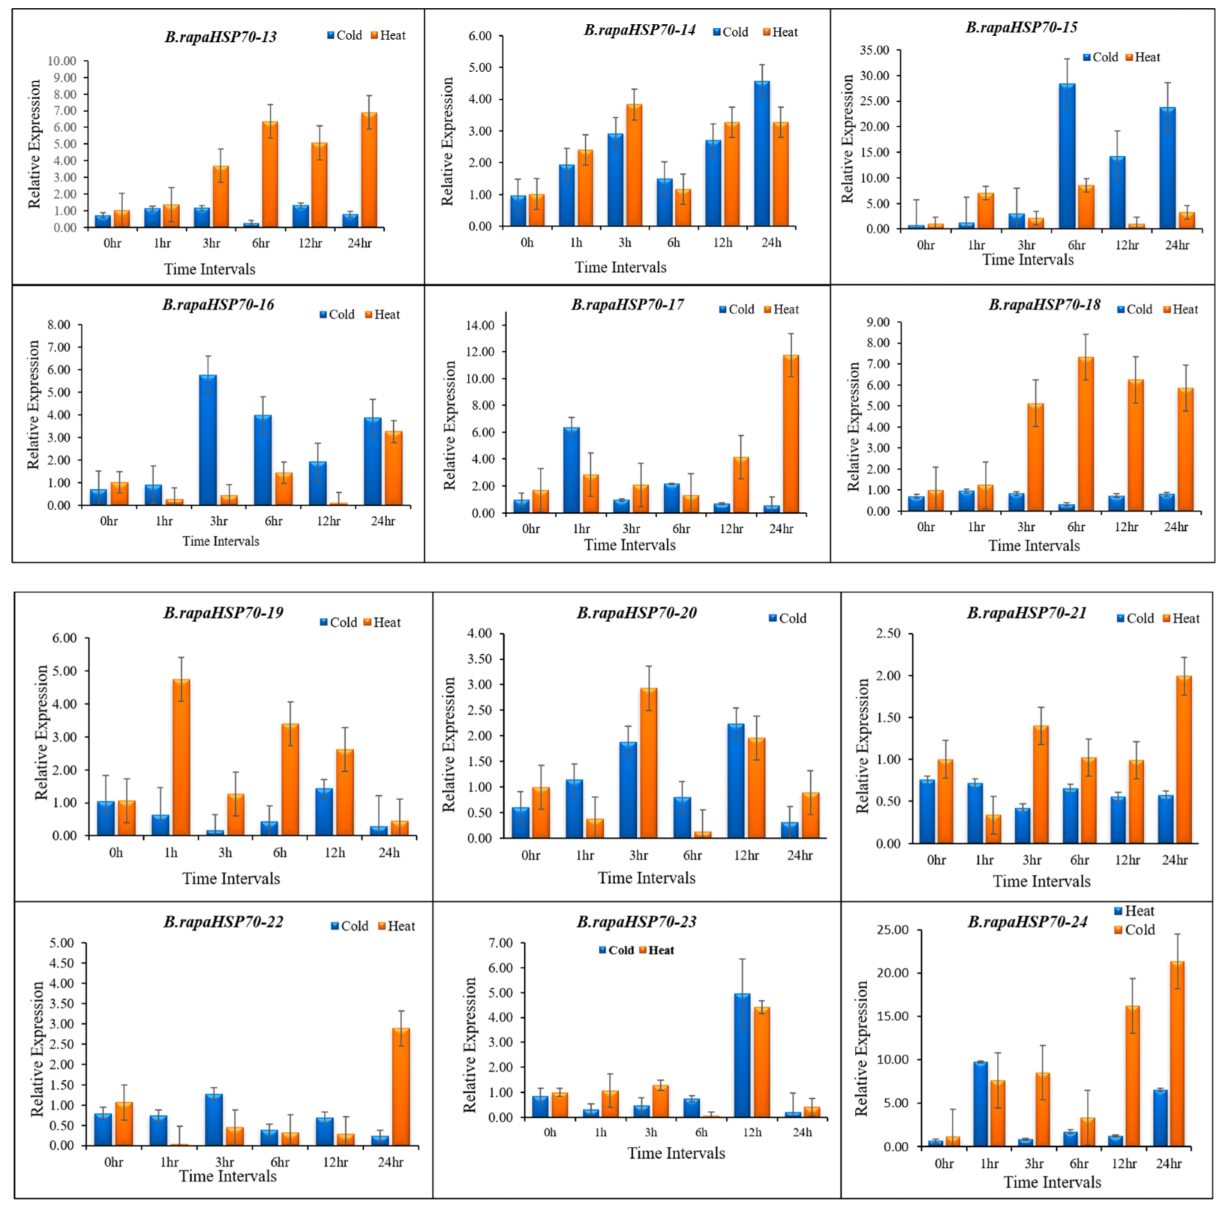
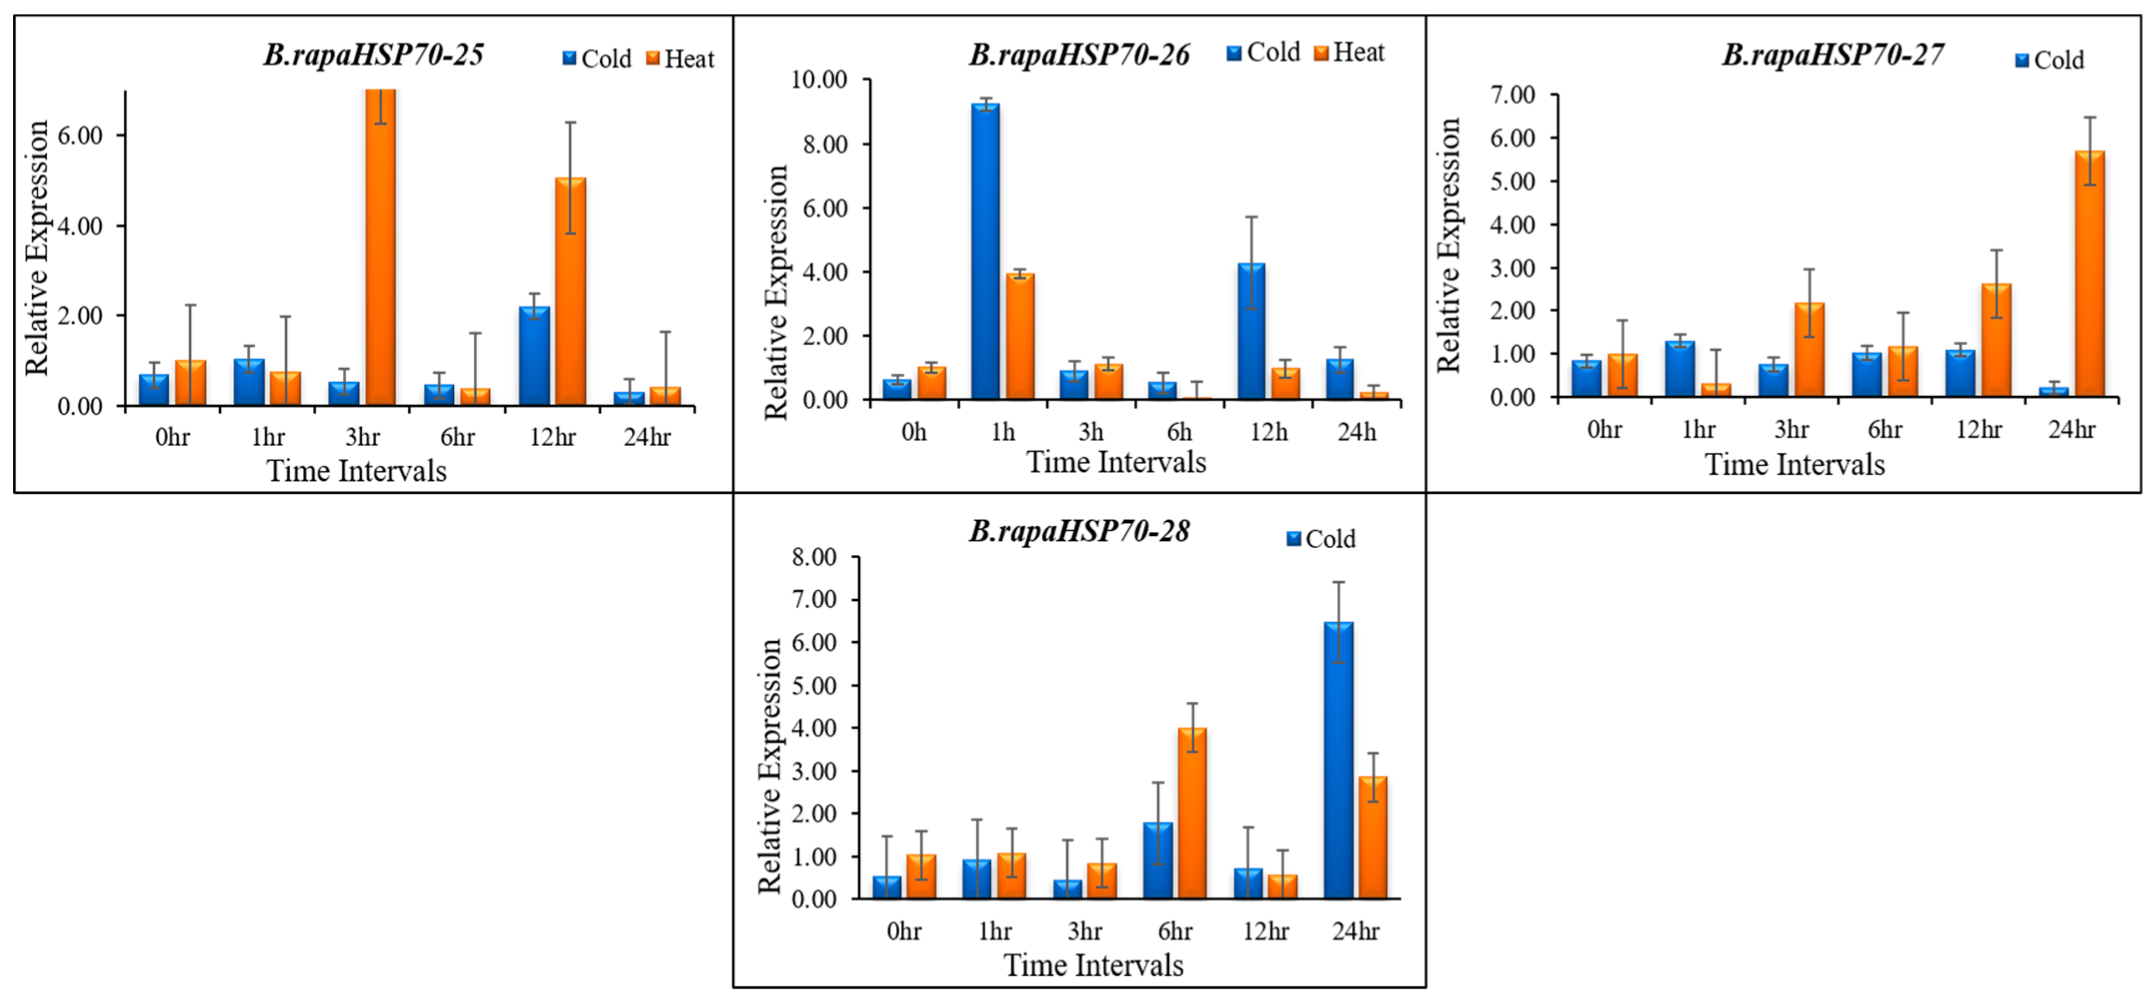
3.10. B.rapaHSP70 Gene Expression in Response to Heat and Cold Stress

To examine the response of B.rapaHSP70s under cold and heat stress, we investigated the gene expression of B.rapaHSP70s in Chinese cabbage plants grown at 4 °C under cold stress and 45 °C under heat stress conditions. qRT-PCR was used to investigate the transcript levels of each B.rapaHsp70 gene with three biological repetitions and two technical repetitions. The primers used in this experiment are provided in Table S4. Generally, the relative expression level of the B.rapaHSP70 genes under all stress conditions fluctuated during the 24-h treatments.
Most of the B.rapaHSP70 genes were sensitive to heat stress, and most were highly regulated under high-temperature stress compared to cold stress. A few B.rapaHSP70s showed no significant expression differences after being treated under different time intervals. The expression levels of 16 B.rapaHSP70s (B.rapaHSP70-1, -2, -3, -4, -8, -14, -15, -16, -19, -20, -22, -23, -24, -25, -27, and -28) were upregulated under high-temperature stress at different time intervals, and most were highly expressed after 24 h of heat stress. The expression levels of 16 B.rapaHSP70s (B.rapaHSP70-1, -2, -3, -4, -7, -8, -13, -14, -17, -20, -21, -22, -23, -24, -26, and -28) were high at different time intervals under cold stress (Figure 10 and Figure S5). qRT-PCR analysis showed that most of the B.rapaHSP70s expression were higher under heat stress as compared to cold stress. Interestingly, it is noticeable that B.rapaHSP70-3, B.rapaHSP70-14, and B.rapaHSP70-20 showed higher expression under both stress conditions. With the comparison of digital expression pattern results and our experimental analysis, there is significant difference in the expression of B.rapaHSP70 genes. The B.rapaHSP70 genes that are showing no expression changes in the normal condition such as B.rapaHSP70-10, B.rapaHSP70-11, B.rapaHSP70-12, and B.rapaHSP70-16, there expression is higher under the heat and cold shock conditions. All 28 B.rapaHSP70s exhibited a change in expression under stress conditions, these findings may help the breeders to improve the heat and cold tolerance in the Chinese cabbage.

4. Discussion

In this cutting-edge era of modern science, with the availability of open-source databases of whole genome sequences, HSP70 gene families have been explored in model plants and a diverse range of horticultural plant species, such as soybean. With the availabilities of the whole genome sequence of many plants, several HSP70 families have been identified, such as in A. thaliana and N. tabacum, as well as in different horticultural plants, such as B. napus, B. oleracea, and pumpkin [28,29,30,31,32]. However, this technique (genome-wide analysis) has not yet been employed in the HSP70 family in Brassica rapa.

4.1. Characterization of the B.rapaHSP70 Gene Family in B. rapa

The model plant A. thaliana belongs to the same family (Brassicaceae) as B. rapa. We identified 28 gene family members of HSP70 in B. rapa, which is higher than that found in Arabidopsis (11 AtHSP70) [8]. The identified genes were analyzed to explore their physical properties. There was no difference in the location of exon/intron boundaries or coding sequences. However, there were significant variances in the sequences and sizes of the introns in each of the 28 HSP70 genes.
Notably, genes within the same phylogenetic subgroup had similar motif compositions and exon/intron structures (Figure 1 and Table 1). Genes without introns or those with few introns have been found to have enhanced plant expression levels in some studies [33]. In addition, the gene classifications of B.rapaHSP70 were confirmed by the correlation between intron numbers and motif arrangements in combination with phylogeny. A phylogenetic tree was created to show the evolutionary relationships between B. rapa, B. napus, B. oleracea, and Arabidopsis. Recently, research has examined the evolutionary associations among these species [32,34].
During the genome evolution process, gene duplications and chromosomal segments are major forces in the evolution of plant genome structure and content [35]. Tandem or segmental duplication events in which two or more neighboring genes duplicate on the same chromosome or on different chromosomes, respectively, can occur [36]. Based on the importance of duplication events, gene duplication events were explored to further understand the expansion mechanism of the B.rapaHSP70 family genes and we find all the duplicated B.rapaHSP70s are segmental duplicated.

4.2. Promoter Analysis and Gene Ontology

Previously, a total of 11 HSP70 genes from A. thaliana were identified and subjected to promoter analysis to investigate the presence of temperature-associated (heat shock element (HSE)) and dehydration-associated cis-elements (dehydration responsive element; DRE) [8]. Based on our findings, most HSP70 genes were predicted to be light responsive, presenting their effects when light or heat intensities were altered.
These stress-related cis elements revealed the involvement of HSP70 genes in B. rapa stress tolerance. Furthermore, GO enrichment analysis supports the findings of the HSP70 gene association with stress tolerance (Table S2). The molecular mechanism and functional investigation of stress-related HSP70 genes in Brassica crops should be a focus in the future to understand the underlying mechanisms.

4.3. miRNA: Key Players in the Regulation of Stress Responses

Several studies have revealed the importance and role of microRNAs (miRNAs) in post-transcriptional gene regulation [37]. In the past few years, numerous miRNAs have been identified in B. rapa that respond to different environmental stress conditions [13,38]. For instance, miR166 has been upregulate due to sunlight in maize crops and under heat stress in Chinese cabbage [39]. Similarly, miR393 has been reported to be associated with cold stress in tea plants (Camellia sinensis) [40]. These studies suggest that these Brassica-associated miRNAs might play decisive roles against numerous stressors by modifying the transcript levels of HSP70 genes. In our study, we found that Bra-miR162, Bra-miR165, Bra-miR172, Bra-miR316, Bra-miR375, Bra-miR396, Bra-miR397, Bra-miR408, Bra-miR858, Bra-miR5714, and Bra-miR5717 families targeted the B.rapaHSP70 genes (Table 3 and Table S3).

5. Differential Expression Analysis of B.rapaHSP70 Genes in Chinese Cabbage Leaves under Heat and Cold Stress

The expression patterns of genes are associated with their function [41]. Several studies have reported the use of qRT-PCR for investigating transcript levels, such as expression profiling of StHSP20 under heat stress. In another study, the results verified the involvement of B.rapaHSP70 proteins in thermotolerance [42]. Until now, few HSP70 genes have been identified and functionally described in B. rapa and other plant species. In this study, we laid a foundation for recognizing signaling controlled by HSP70 proteins under biotic and abiotic stress conditions.

6. Conclusions

In the current study, we performed a genome-wide analysis of the HSP70 gene family in B. rapa, and 28 putative members were identified. In silico analyses were performed, including gene structure, distribution, phylogenetic relationship, and syntenic studies, which helped to explore the evolutionary properties of the HSP70 gene family in B. rapa. In addition, targeted miRNAs, promotor cis-acting regulatory elements, and gene ontology (GO) were executed. The finding of all these analysis elucidating that B.rapaHSP70s are targeted by 34 different families of microRNAs, these genes are highly responsive to light, temperature and phytohormones, and B.rapaHSP70s are involved in the Biological, cellular and molecular functioning of B. rapa, respectively. Three dimensional protein structural knowledge can help improve crop properties, such as improving stress resistance and biomass yield. Furthermore, quantitative real-time PCR results indicated that HSP70 genes are strongly involved in heat and cold stress responses in B. rapa plants. To a large extent, all analyses performed on the HSP70 gene family will lay the foundation for further studies of molecular and physiological functions in Brassica crops.

Supplementary Materials

The following supporting information can be downloaded at: https://www.mdpi.com/article/10.3390/cells11152316/s1, Table S1; Cis-Element Analysis of B.rapaHSP70 Gene Promoters. Putative cis-elements of the 28 B.rapaHSP70 genes identified via PlantCARE web-based tool, Table S2; Genome-Wide Analysis of miRNA-Associated B.rapaHSP70 Genes. Detailed information of the miRNA-targeted sites determined by psRNATarget database, Table S3; Functional Annotation Analysis of B.rapaHSP70 Genes. Detailed information of the GO annotation data retrived from Brassica database, Table S4; Primers used in qRT-PCR. Expression patteren analysis in Response to Heat and Cold Stress, Table S5; Average fold expression and standard error values of B.rapaHSP70s. Relative expression level of the B.rapaHSP70 genes under heat and cold Stress.

Author Contributions

J.T., J.Z. and W.M. conceptualized the project. J.T., Q.S., D.F. and S.Z. performed the experiment. J.T., Q.S., S.S. and W.M. prepared the manuscript. All authors read and approved the final manuscript.

Funding

This work was financially supported in part by grants from the Hebei Youth Top Talent Project (BJ2021024), the Natural Science Foundation of Hebei (C2021204049), the International Cooperation Project in the Science and Technology Support Program of Hebei (Grant No. 2019YX023A, 17396315D), Starting Grant from Hebei Agricultural University (YJ2020016).

Institutional Review Board Statement

Not applicable.

Informed Consent Statement

Not applicable.

Data Availability Statement

The datasets used and/or analyzed during the current study are available from the corresponding author on reasonable request. However, most of the data is shown in Supplementary files.

Acknowledgments

The authors are grateful to all lab members for their useful suggestions, support, and encouragement. We are thankful to Asad Riaz for helping throughout the manuscript work and also in designing the graphical illustrations.

Conflicts of Interest

The authors declare no conflict of interest.

References

  1. Huang, Z.; Duan, W.; Song, X.; Tang, J.; Wu, P.; Zhang, B.; Hou, X. Retention, Molecular Evolution, and Expression Divergence of the Auxin/Indole Acetic Acid and Auxin Response Factor Gene Families in Brassica Rapa Shed Light on Their Evolution Patterns in Plants. Genome. Biol. Evol. 2015, 8, 302–316. [Google Scholar] [CrossRef] [Green Version]
  2. Chinnusamy, V.; Zhu, J.; Zhu, J.K. Cold stress regulation of gene expression in plants. Trends Plant Sci. 2007, 12, 444–451. [Google Scholar] [CrossRef] [PubMed]
  3. Kotak, S.; Larkindale, J.; Lee, U.; von Koskull-Döring, P.; Vierling, E.; Scharf, K.-D. Complexity of the Heat Stress Response in Plants. Curr. Opin. Plant Biol. 2007, 10, 310–316. [Google Scholar] [CrossRef] [PubMed]
  4. Maimbo, M.; Ohnishi, K.; Hikichi, Y.; Yoshioka, H.; Kiba, A. Induction of a Small Heat Shock Protein and Its Functional Roles in Nicotiana Plants in the Defense Response against Ralstonia solanacearum. Plant Physiol. 2007, 145, 1588–1599. [Google Scholar] [CrossRef] [PubMed] [Green Version]
  5. Miemyk, J. The 70 kDa Stress-Related Proteins as Molecular Chaperones. Trends Plant Sci. 1997, 2, 180–187. [Google Scholar] [CrossRef]
  6. Radons, J. The Human HSP70 Family of Chaperones: Where Do We Stand? Cell Stress Chaperones 2016, 21, 379–404. [Google Scholar] [CrossRef] [Green Version]
  7. Seguí-Simarro, J.; Testillano, P.; Risueño, M. Hsp70 and Hsp90 Change Their Expression and Subcellular Localization After Microspore Embryogenesis Induction in Brassica napus L. J. Struct. Biol. 2003, 142, 379–391. [Google Scholar] [CrossRef]
  8. Sung, D.Y.; Vierling, E.; Guy, C.L. Comprehensive Expression Profile Analysis of the Arabidopsis Hsp70 Gene Family. Plant Physiol. 2001, 126, 789–800. [Google Scholar] [CrossRef] [Green Version]
  9. Lindquist, S.; Craig, E.A. The Heat-Shock Proteins. Annu. Rev. Genet. 1988, 22, 631–677. [Google Scholar] [CrossRef]
  10. Jungkunz, I.; Link, K.; Vogel, F.; Voll, L.M.; Sonnewald, S.; Sonnewald, U. AtHsp70-15-Deficient Arabidopsis Plants are Characterized by Reduced Growth, a Constitutive Cytosolic Protein Response and Enhanced Resistance to TuMV. Plant J. 2011, 66, 983–995. [Google Scholar] [CrossRef]
  11. Su, P.-H.; Li, H.-M. Arabidopsis Stromal 70-kD Heat Shock Proteins Are Essential for Plant Development and Important for Thermotolerance of Germinating Seeds. Plant Physiol. 2008, 146, 1231–1241. [Google Scholar] [CrossRef] [PubMed] [Green Version]
  12. Leng, L.; Liang, Q.; Jiang, J.; Zhang, C.; Hao, Y.; Wang, X.; Su, W. A Subclass of HSP70s Regulate Development and Abiotic Stress Responses in Arabidopsis Thaliana. J. Plant Res. 2016, 130, 349–363. [Google Scholar] [CrossRef] [PubMed]
  13. Yu, X.; Wang, H.; Lu, Y.; De Ruiter, M.; Cariaso, M.; Prins, M.; Van Tunen, A.; He, Y. Identification of Conserved and Novel MicroRNAs that are Responsive to Heat Stress in Brassica Rapa. J. Exp. Bot. 2011, 63, 1025–1038. [Google Scholar] [CrossRef]
  14. Lee, S.-C.; Lim, M.-H.; Kim, J.A.; Lee, S.-I.; Kim, J.S.; Jin, M.; Kwon, S.-J.; Mun, J.-H.; Kim, Y.-K.; Kim, H.U. Tran-Scriptome Analysis in Brassica Rapa Under the Abiotic Stresses Using Brassica 24K Oligo Microarray. Mol. Cells 2008, 24, 595–605. [Google Scholar] [CrossRef]
  15. Wang, F.; Dong, Q.; Jiang, H.; Zhu, S.; Chen, B.; Xiang, Y. Genome-Wide Analysis of the Heat Shock Transcription Factors in Populus Trichocarpa and Medicago Truncatula. Mol. Biol. Rep. 2011, 39, 1877–1886. [Google Scholar] [CrossRef] [PubMed]
  16. Gasteiger, E.; Hoogland, C.; Gattiker, A.; Wilkins, M.R.; Appel, R.D.; Bairoch, A. Protein identification and analysis tools on the ExPASy server. In The Proteomics Protocols Handbook; Walker, J.M., Ed.; Humana Press: Totowa, NJ, USA, 2005; pp. 571–607. [Google Scholar] [CrossRef]
  17. Tamura, K.; Peterson, D.; Peterson, N.; Stecher, G.; Nei, M.; Kumar, S. MEGA5: Molecular Evolutionary Genetics Analysis Using Maximum Likelihood, Evolutionary Distance, and Maximum Parsimony Methods. Mol. Biol. Evol. 2011, 28, 2731–2739. [Google Scholar] [CrossRef] [Green Version]
  18. Sarwar, R.; Jiang, T.; Ding, P.; Gao, Y.; Tan, X.; Zhu, K. Genome-Wide Analysis and Functional Characterization of the DELLA Gene Family Associated with Stress Tolerance in B. Napus. BMC Plant Biol. 2021, 21, 1–19. [Google Scholar] [CrossRef]
  19. He, L.; Zhang, F.; Wu, X.; Hu, Y.; Dong, L.; Dewitte, W.; Wen, B. Genome-Wide Characterization and Expression of Two-Component System Genes in Cytokinin-Regulated Gall Formation in Zizania latifolia. Plants 2020, 9, 1409. [Google Scholar] [CrossRef]
  20. Mun, J.-H.; Kwon, S.-J.; Yang, T.-J.; Seol, Y.-J.; Jin, M.; Kim, J.-A.; Lim, M.-H.; Kim, J.S.; Baek, S.; Choi, B.-S.; et al. Genome-Wide Comparative Analysis of the Brassica Rapa Gene Space Reveals Genome Shrinkage and Differential Loss of Duplicated Genes after Whole Genome Triplication. Genome Biol. 2009, 10, R111. [Google Scholar] [CrossRef] [Green Version]
  21. Tang, H.; Bowers, J.E.; Wang, X.; Ming, R.; Alam, M.; Paterson, A.H. Synteny and Collinearity in Plant Genomes. Science 2008, 320, 486–488. [Google Scholar] [CrossRef] [Green Version]
  22. Yadav, S.; Kushwaha, H.R.; Kumar, K.; Verma, P.K. Comparative Structural Modeling of a Monothiol GRX from Chickpea: Insight in Iron–Sulfur Cluster Assembly. Int. J. Biol. Macromol. 2012, 51, 266–273. [Google Scholar] [CrossRef] [PubMed]
  23. Tong, C.; Wang, X.; Yu, J.; Wu, J.; Li, W.; Huang, J.; Dong, C.; Hua, W.; Liu, S. Comprehensive Analysis of RNA-Seq Data Reveals the Complexity of the Transcriptome in Brassica Rapa. BMC Genom. 2013, 14, 689. [Google Scholar] [CrossRef] [PubMed] [Green Version]
  24. Song, X.; Liu, G.; Duan, W.; Liu, T.; Huang, Z.; Ren, J.; Li, Y.; Hou, X. Genome-Wide Identification, Classification and Expression Analysis of the Heat Shock Transcription Factor Family in Chinese Cabbage. Mol. Genet. Genom. 2014, 289, 541–551. [Google Scholar] [CrossRef] [PubMed]
  25. Livak, K.J.; Schmittgen, T.D. Analysis of Relative Gene Expression Data Using Real-Time Quantitative PCR and the 2−ΔΔCT Method. Methods 2001, 25, 402–408. [Google Scholar] [CrossRef] [PubMed]
  26. Guéguen, L.; Duret, L. Unbiased Estimate of Synonymous and Nonsynonymous Substitution Rates with Nonstationary Base Composition. Mol. Biol. Evol. 2017, 35, 734–742. [Google Scholar] [CrossRef] [PubMed] [Green Version]
  27. Abbas, M.; Li, Y.; Elbaiomy, R.G.; Yan, K.; Ragauskas, A.J.; Yadav, V.; Soaud, S.A.; Islam, M.; Saleem, N.; Noor, Z.; et al. Genome-Wide Analysis and Expression Profiling of SlHsp70 Gene Family in Solanum lycopersicum Revealed Higher Expression of SlHsp70-11 in Roots under Cd2+ Stress. Front. Biosci. 2022, 27, 186. [Google Scholar] [CrossRef]
  28. Chaudhary, R.; Baranwal, V.K.; Kumar, R.; Sircar, D.; Chauhan, H. Genome-Wide Identification and Expression Analysis of Hsp70, Hsp90, and Hsp100 Heat Shock Protein Genes in Barley Under Stress Conditions and Reproductive Development. Funct. Integr. Genom. 2019, 19, 1007–1022. [Google Scholar] [CrossRef]
  29. Hu, Y.; Zhang, T.; Liu, Y.; Li, Y.; Wang, M.; Zhu, B.; Liao, D.; Yun, T.; Huang, W.; Zhang, W.; et al. Pumpkin (Cucurbita moschata) HSP20 Gene Family Identification and Expression Under Heat Stress. Front. Genet. 2021, 12, 753953. [Google Scholar] [CrossRef]
  30. Liang, Z.; Li, M.; Liu, Z.; Wang, J. Genome-Wide Identification and Characterization of the Hsp70 Gene Family in Allo-polyploid Rapeseed (Brassica napus L.) Compared with Its Diploid Progenitors. PeerJ. 2019, 7, e7511. [Google Scholar] [CrossRef] [Green Version]
  31. Song, Z.; Pan, F.; Lou, X.; Wang, D.; Yang, C.; Zhang, B.; Zhang, H. Genome-Wide Identification and Characterization of Hsp70 Gene Family in Nicotiana Tabacum. Mol. Biol. Rep. 2019, 46, 1941–1954. [Google Scholar] [CrossRef]
  32. Su, H.; Xing, M.; Liu, X.; Fang, Z.; Yang, L.; Zhuang, M.; Zhang, Y.; Wang, Y.; Lv, H. Genome-Wide Analysis of HSP70 Family Genes in Cabbage (Brassica oleracea var. capitata) Reveals Their Involvement in Floral Development. BMC Genom. 2019, 20, 369. [Google Scholar] [CrossRef] [PubMed]
  33. Jeffares, D.C.; Penkett, C.J.; Bähler, J. Rapidly Regulated Genes are Intron Poor. Trends Genet. 2008, 24, 375–378. [Google Scholar] [CrossRef] [PubMed]
  34. Wang, W.; Cheng, Y.; Chen, D.; Liu, D.; Hu, M.; Dong, J.; Zhang, X.; Song, L.; Shen, F. The Catalase Gene Family in Cotton: Genome-Wide Characterization and Bioinformatics Analysis. Cells 2019, 8, 86. [Google Scholar] [CrossRef] [PubMed] [Green Version]
  35. Liu, S.; Liu, Y.; Yang, X.; Tong, C.; Edwards, D.; Parkin, I.A.P.; Zhao, M.; Ma, J.; Yu, J.; Huang, S.; et al. The Brassica Oleracea Genome Reveals the Asymmetrical Evolution of Polyploid Genomes. Nat. Commun. 2014, 5, 3930. [Google Scholar] [CrossRef]
  36. Cannon, S.B.; Mitra, A.; Baumgarten, A.; Young, N.D.; May, G. The Roles of Segmental and Tandem Gene Duplication in the Evolution of Large Gene Families in Arabidopsis Thaliana. BMC Plant Biol. 2004, 4, 10. [Google Scholar] [CrossRef] [Green Version]
  37. Statello, L.; Guo, C.-J.; Chen, L.-L.; Huarte, M. Gene Regulation by Long Non-Coding RNAs and Its Biological Functions. Nat. Rev. Mol. Cell Biol. 2021, 22, 96–118. [Google Scholar] [CrossRef] [PubMed]
  38. Wang, A.; Hu, J.; Gao, C.; Chen, G.; Wang, B.; Lin, C.; Song, L.; Ding, Y.; Zhou, G. Genome-Wide Analysis of Long Non-Coding RNAs Unveils the Regulatory Roles in the Heat Tolerance of Chinese Cabbage (Brassica rapa ssp. Chinensis). Sci. Rep. 2019, 9, 5002. [Google Scholar] [CrossRef] [Green Version]
  39. Wang, L.; Yu, X.; Wang, H.; Lu, Y.-Z.; De Ruiter, M.; Prins, M.; He, Y.-K. A Novel Class of Heat-Responsive Small RNAs Derived from the Chloroplast Genome of Chinese Cabbage (Brassica rapa). BMC Genom. 2011, 12, 289. [Google Scholar] [CrossRef] [Green Version]
  40. Zhang, Y.; Zhu, X.; Chen, X.; Song, C.; Zou, Z.; Wang, Y.; Wang, M.; Fang, W.; Li, X. Identification and Characterization of Cold-Responsive MicroRNAs in Tea Plant (Camellia sinensis) and Their Targets Using High-Throughput Sequencing and Degradome Analysis. BMC Plant Biol. 2014, 14, 271. [Google Scholar] [CrossRef] [Green Version]
  41. Neta-Sharir, I.; Isaacson, T.; Lurie, S.; Weiss, D. Dual Role for Tomato Heat Shock Protein 21: Protecting Photosystem II from Oxidative Stress and Promoting Color Changes during Fruit Maturation. Plant Cell 2005, 17, 1829–1838. [Google Scholar] [CrossRef] [Green Version]
  42. Waters, E.R. The evolution, function, structure, and expression of the plant sHSPs. J. Exp. Bot. 2013, 64, 391–403. [Google Scholar] [CrossRef] [PubMed] [Green Version]
Figure 1. (A) Graphical representation of B.rapaHSP70 conserved motif along with phylogenetic demonstration, divided into four groups, Group 1 (Brown), Group 2 (Pink), Group 3 (Purple) and Group 4 (Green). (B). Graphical representation of B.rapaHSP70 gene structure (Intron, Exon).
Cells 11 02316 g001
Figure 2. Chromosomal map of B. rapa, with distribution of HSP70 gene family members on B. rapa chromosomes by TBtools.
Cells 11 02316 g002
Figure 3. Comparative phylogenetic tree of the HSP70 proteins in A. thaliana (AtHSP70), B. rapa (B.rapaHSP70), B. napus (BnaHSP70), and B. oleracea (BolHSP70).
Cells 11 02316 g003
Figure 4. (A) Duplication of B.rapaHSP70 genes. The lines indicate the association of segmentally duplicated pairs of genes. (B) Graphical illustration of syntenic association of B. rapa with A. thaliana, B. oleracea, and B. napus.
Cells 11 02316 g004
Figure 5. Graphical summary of identified cis-acting elements in HSP70 genes. (A) Phylogenetic tree with colored blocks of position and type of elements. (B) The pie chart shows the total identified elements and the number of each element in a specific color.
Cells 11 02316 g005
Figure 6. Predicted 3D models of B.rapaHSP70 proteins. Models have been generated by using the Phyre 2 server in intensive mode. Models were visualized by rainbow colour from N to C terminus.
Cells 11 02316 g006
Figure 7. Smart graphical illustration of miRNAs targeting the HSP70 genes in B. rapa.
Cells 11 02316 g007
Figure 8. GO enrichment analysis of B.rapaHSP70.
Cells 11 02316 g008
Figure 9. Expression pattern of HSP70 genes in different tissues based on fragments per kilobase of transcript per million mapped reads (FPKM). The color scheme represents expression intensity (purple, low expression; green, high expression) in different tissues.
Cells 11 02316 g009
Figure 10. B.rapaHSP70 gene expression in Chinese cabbage leaves after exposure to cold and heat stress. Heat treatment was represented with orange bars, and cold treatment with blue bars. Samples were taken at 0, 1, 3, 6, 12, and 24 h after heat stress treatment.
Cells 11 02316 g010aCells 11 02316 g010bCells 11 02316 g010cCells 11 02316 g010d
Table 1. B.rapaHSP70s gene information retrieved for genome wide analysis.
Transcript IDGene NameChr PositionLocation Start–EndStrandCDS(BP)Instability IndexProtein Length (A.A)Protein MW (KDa)PIGRAVYIntron, Exon Sub-Cellular Localization
BraA01g038810.3CB.rapaHSP70-1A0126269513–26272150Positive195332.2665071.275.13−0.4291,2Cytoplasm
BraA03g035360.3CB.rapaHSP70-2A0317438369–17440713Negative195833.1765271.385.13−0.4431,2Cytoplasm
BraA09g007150.3CB.rapaHSP70-3A094091084–4093380Negative194436.1264770.945.04−0.4011,2Cytoplasm
BraA10g033140.3CB.rapaHSP70-4A1020445814–20448082positive194136.264670.875.07−0.3961,2Cytoplasm
BraA10g033130.3CB.rapaHSP70-5A1020434824–20437099 Negative194136.264670.875.07−0.3961,2Cytoplasm
BraA03g043350.3CB.rapaHSP70-6A0321842760–21844958Positive195334.365071.185.07−0.4191,2Cytoplasm
BraA09g038510.3CB.rapaHSP70-7A0930333133–30335310Positive195035.564971.055.02−0.4161,2Cytoplasm
BraA01g027130.3CB.rapaHSP70-8A0117439040–17441266Negative198636.3166172.345.11−0.4072,3Cytoplasm
BraA08g029700.3CB.rapaHSP70-9A0820365638–20367590Positive195335.4765071.345.28−0.4340,1Cytoplasm
BraA06g012060.3CB.rapaHSP70-10A066488327–6490270Negative194435.5164771.045.48−0.4080,1Cytoplasm
BraA07g008590.3CB.rapaHSP70-11A078612041–8614425Negative20103066973.845.08−0.4774,5Endoplasmic Reticulum
BraA03g019440.3CB.rapaHSP70-12A039196468–9198979Positive201027.9666973.625.08−0.4643,4Endoplasmic Reticulum
BraA03g016490.3CB.rapaHSP70-13A037627325–7630035Negative201027.7966973.635.08−0.4685,6Endoplasmic Reticulum
BraA07g020790.3CB.rapaHSP70-14A0717199507–17204802Negative199830.9966573.495.11−0.4664,5Endoplasmic Reticulum
BraA09g062470.3CB.rapaHSP70-15A0943345497–43348084Positive191132.863670.554.94−0.484,5Endoplasmic Reticulum
BraA02g003050.3CB.rapaHSP70-16A021492088–1495420Positive204334.4268072.875.82−0.3355,6Mitochondrial
BraA03g003930.3CB.rapaHSP70-17A031680387–1683221Positive204633.9468172.675.55−0.3364,5Mitochondrial
BraA08g021750.3CB.rapaHSP70-18A0816460538–16462970Negative203136.7967672.485.79−0.2814,5Mitochondrial
BraA01g015070.3CB.rapaHSP70-19A017988766–7991570Positive213631.4871176.15.09−0.3164,5Chloroplast
BraA01g001130.3CB.rapaHSP70-20A01523816–526255Positive204938.2668273.015.56−0.3067,8Mitochondrial
BraA03g051830.3CB.rapaHSP70-21A0326797918–26800806Positive213327.7171075.915.27−0.3167,8Chloroplast
BraA08g020460.3CB.rapaHSP70-22A0815677635-15680441Negative215428.5271776.425.14−0.3137,8Chloroplast
BraA06g001280.3CB.rapaHSP70-23A06802745–805920Positive245739.5481890.295.17−0.4028,9Cytoplasmic
BraA04g004290.3CB.rapaHSP70-24A042645163–2648333Negative237340.9179087.165.23−0.48,9Cytoplasmic
BraA05g012280.3CB.rapaHSP70-25A056664594–6666288Negative169541.5556460.815.390.0510,1Chloroplast
BraA06g008250.3CB.rapaHSP70-26A064497297–4500623Positive228647.6876184.545.73−0.4938,9Nuclear
BraA03g047170.3CB.rapaHSP70-27A0323836812-23840680Positive263142.8987697.595.78−0.48313,14Nuclear
BraA01g019900.3CB.rapaHSP70-28A0110687460–10691347Negative268544.4789499.975.89−0.49912,13Nuclear
Table 2. Ka/Ks values of B.rapaHSP70 duplicated genes.
Seq_1Seq_2KaKsKa_KsT(MYA)
BraA10g033140.3CBraA10g033130.3C00.098340303278010.814
BraA09g038510.3CBraA01g027130.3C0.00568560.20356010.0279310496.785335295
BraA01g038810.3CBraA03g035360.3C0.00864990.97332260.00888702632.44408789
BraA08g029700.3CBraA06g012060.3C0.02737810.72998680.03750491224.33289231
BraA03g019440.3CBraA03g016490.3C0.00354360.24557050.0144301958.185684806
BraA03g051830.3CBraA08g020460.3C0.02180320.51653880.04221014417.21796007
BraA02g003050.3CBraA03g003930.3C0.02068640.37711920.05485384612.57063953
BraA08g021750.3CBraA01g001130.3C0.02530080.43833110.05772082414.61103702
BraA03g047170.3CBraA01g019900.3C0.05060280.3151820.16055119210.50606656
BraA06g001280.3CBraA04g004290.3C0.01601460.33839360.04732536111.27978551
Table 3. MicroRNA targeting B.rapaHSP70s.
MicroRNAsMicroRNA Targeting B.rapaHSP70s
Bra-miRN355B.rapaHSP70-3
Bra-miR390B.rapaHSP70-8
Bra-miRN363B.rapaHSP70-10
Bra-miR395B.rapaHSP70-13
Bra-miR6032B.rapaHSP70-14
Bra-miR159aB.rapaHSP70-15
Bra-miRN366B.rapaHSP70-15
Bra-miRN368B.rapaHSP70-15
Bra-miRN351B.rapaHSP70-16
Bra-miRN338B.rapaHSP70-19
Bra-miR397B.rapaHSP70-23
Bra-miRN324B.rapaHSP70-25
Bra-miR319B.rapaHSP70-26
Bra-miR162B.rapaHSP70-21B.rapaHSP70-22
Bra-miR168B.rapaHSP70-2B.rapaHSP70-13
Bra-miR394B.rapaHSP70-14B.rapaHSP70-27
Bra-miR396B.rapaHSP70-23B.rapaHSP70-24
Bra-miRN329B.rapaHSP70-4B.rapaHSP70-5
Bra-miR5714B.rapaHSP70-18B.rapaHSP70-22
Bra-miRN271B.rapaHSP70-16B.rapaHSP70-17
Bra-miRN375B.rapaHSP70-21B.rapaHSP70-23
Bra-miRN316B.rapaHSP70-15B.rapaHSP70-23B.rapaHSP70-24
Bra-miRN347B.rapaHSP70-6B.rapaHSP70-12B.rapaHSP70-13
Bra-miR5717B.rapaHSP70-20B.rapaHSP70-21B.rapaHSP70-22
Bra-miR9556B.rapaHSP70-9B.rapaHSP70-13B.rapaHSP70-15
Bra-miRN371B.rapaHSP70-19B.rapaHSP70-21B.rapaHSP70-22
Bra-miRN373B.rapaHSP70-1B.rapaHSP70-22B.rapaHSP70-27B.rapaHSP70-28
Bra-miR172B.rapaHSP70-2B.rapaHSP70-9B.rapaHSP70-14B.rapaHSP70-23
Bra-miRN317B.rapaHSP70-15B.rapaHSP70-19B.rapaHSP70-27B.rapaHSP70-28
Bra-miRN334B.rapaHSP70-7B.rapaHSP70-8B.rapaHSP70-16B.rapaHSP70-17
Bra-miRN348B.rapaHSP70-3B.rapaHSP70-4B.rapaHSP70-5B.rapaHSP70-8
Bra-miR408B.rapaHSP70-6B.rapaHSP70-11B.rapaHSP70-21B.rapaHSP70-22
Bra-miRN379B.rapaHSP70-1B.rapaHSP70-2B.rapaHSP70-25B.rapaHSP70-27B.rapaHSP70-28
Bra-miR858B.rapaHSP70-12B.rapaHSP70-13B.rapaHSP70-18B.rapaHSP70-19B.rapaHSP70-20B.rapaHSP70-22
Publisher’s Note: MDPI stays neutral with regard to jurisdictional claims in published maps and institutional affiliations.

