
Kidney Cancer Biomarker Selection Using Regularized Survival Models


Abstract
:
1. Introduction
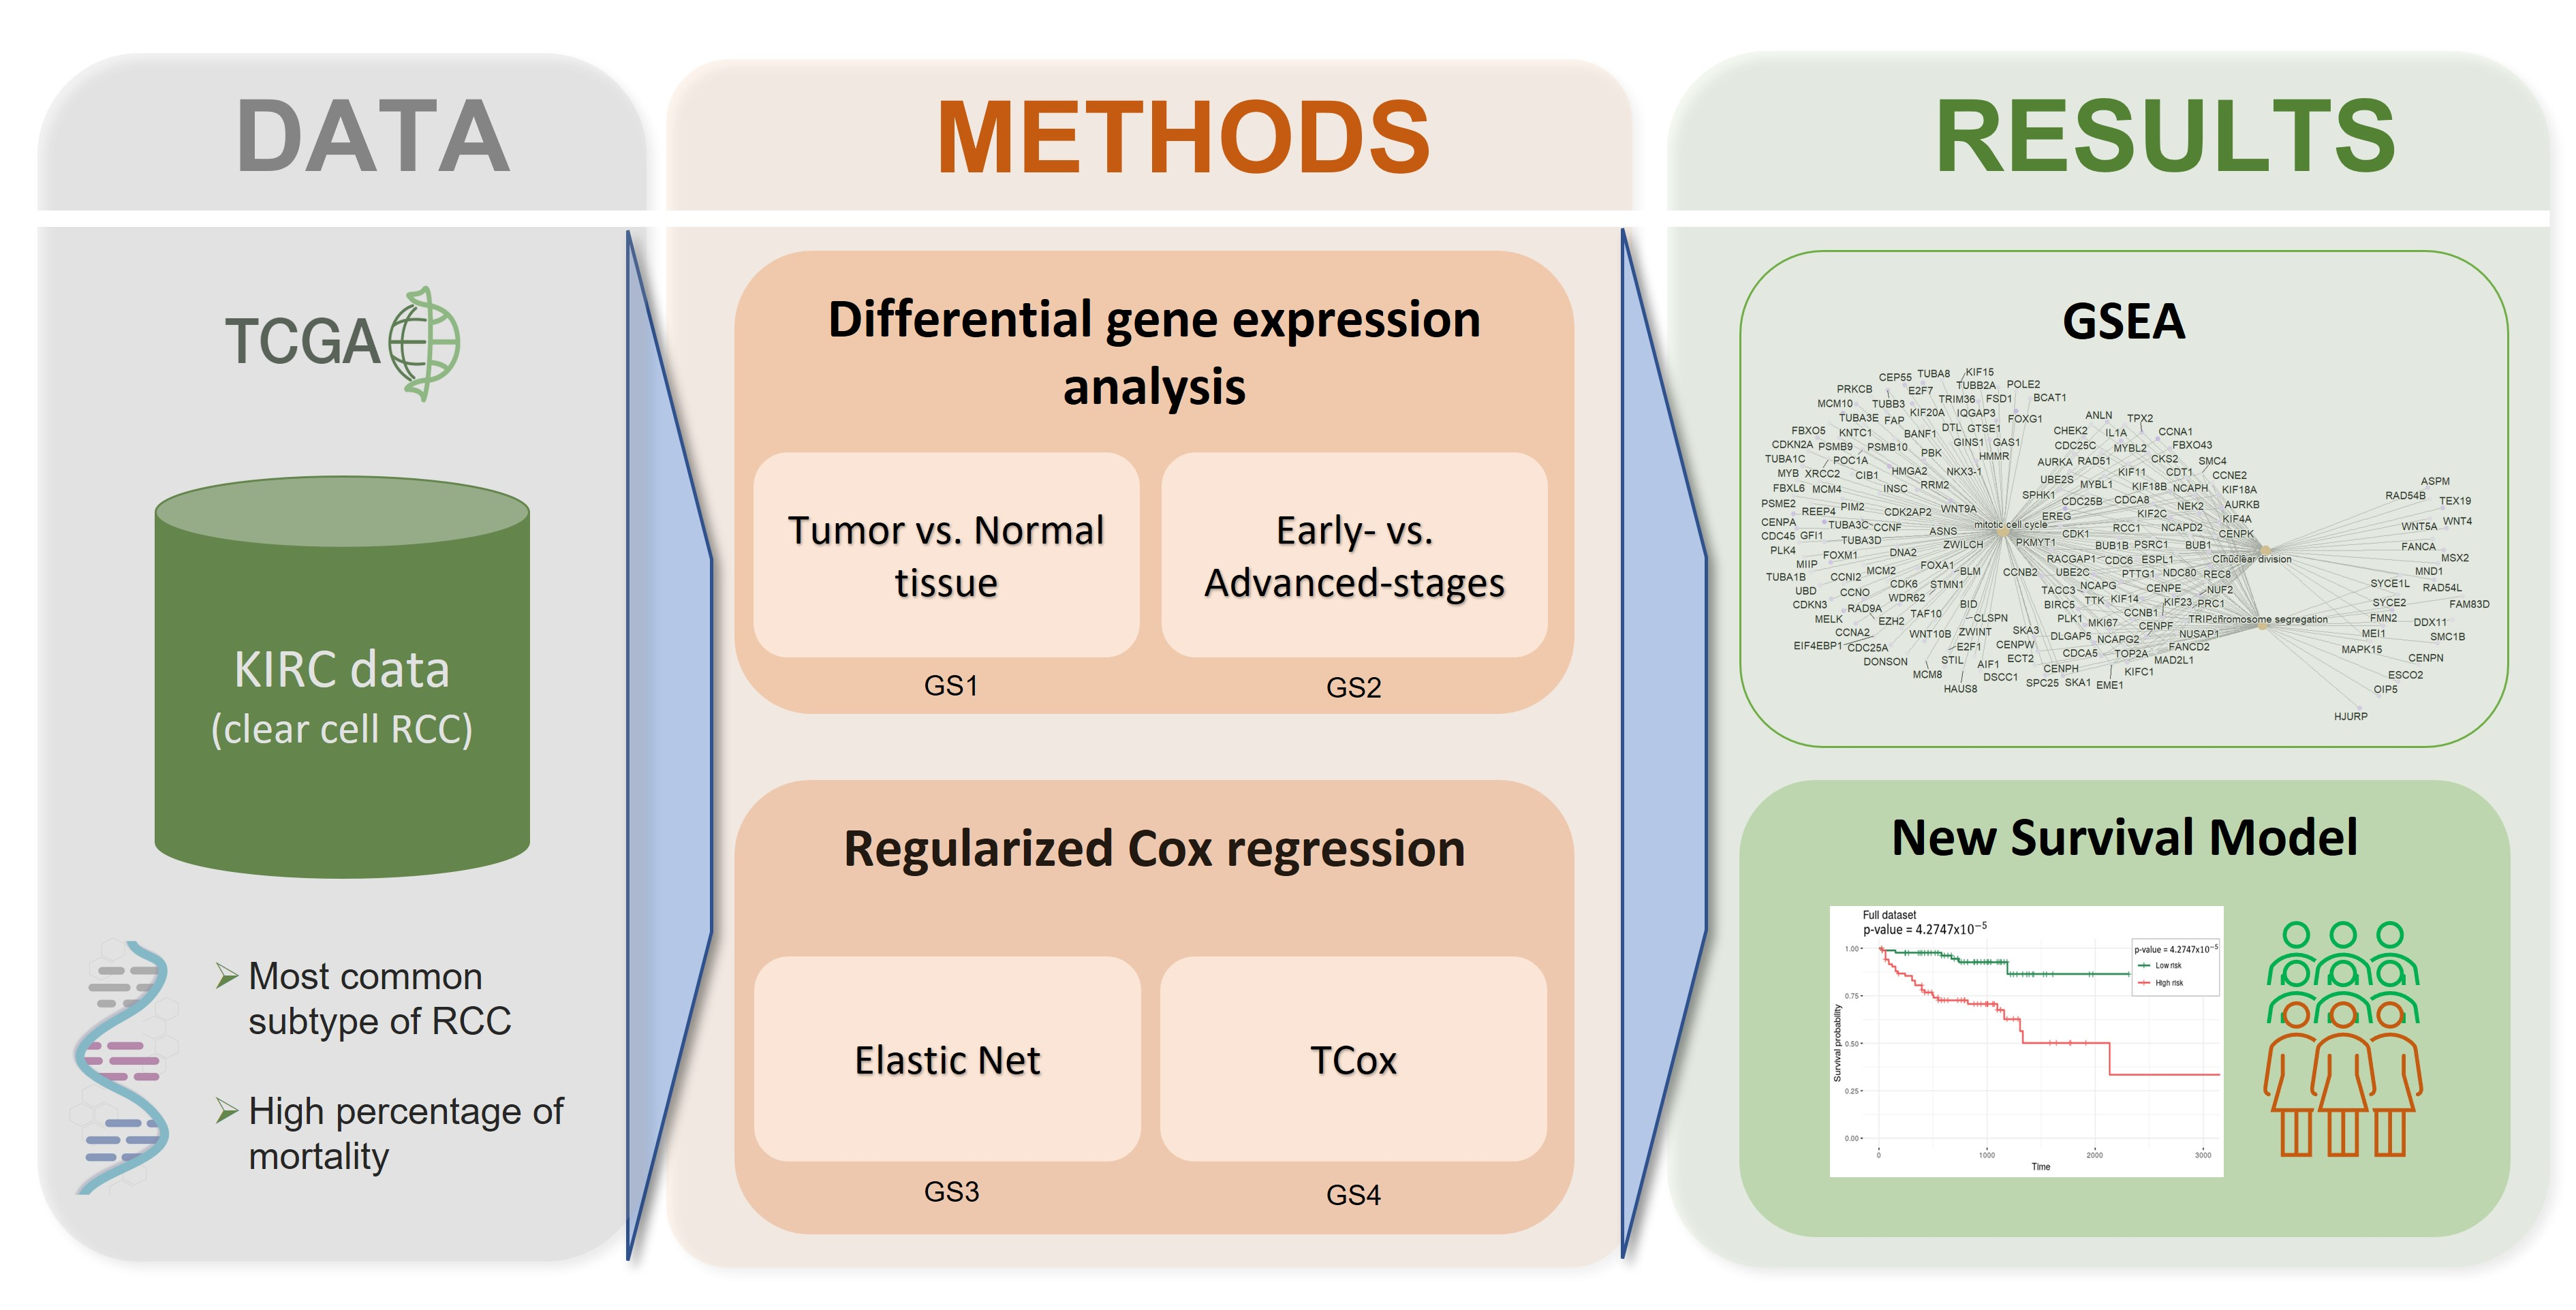
2. Materials and Methods
2.1. Datasets
2.2. Differential Gene Expression
2.3. Survival Analysis
Cox Regression
2.4. Model Evaluation
2.5. Gene Set Enrichment Analysis
3. Results
3.1. Exploratory Analysis
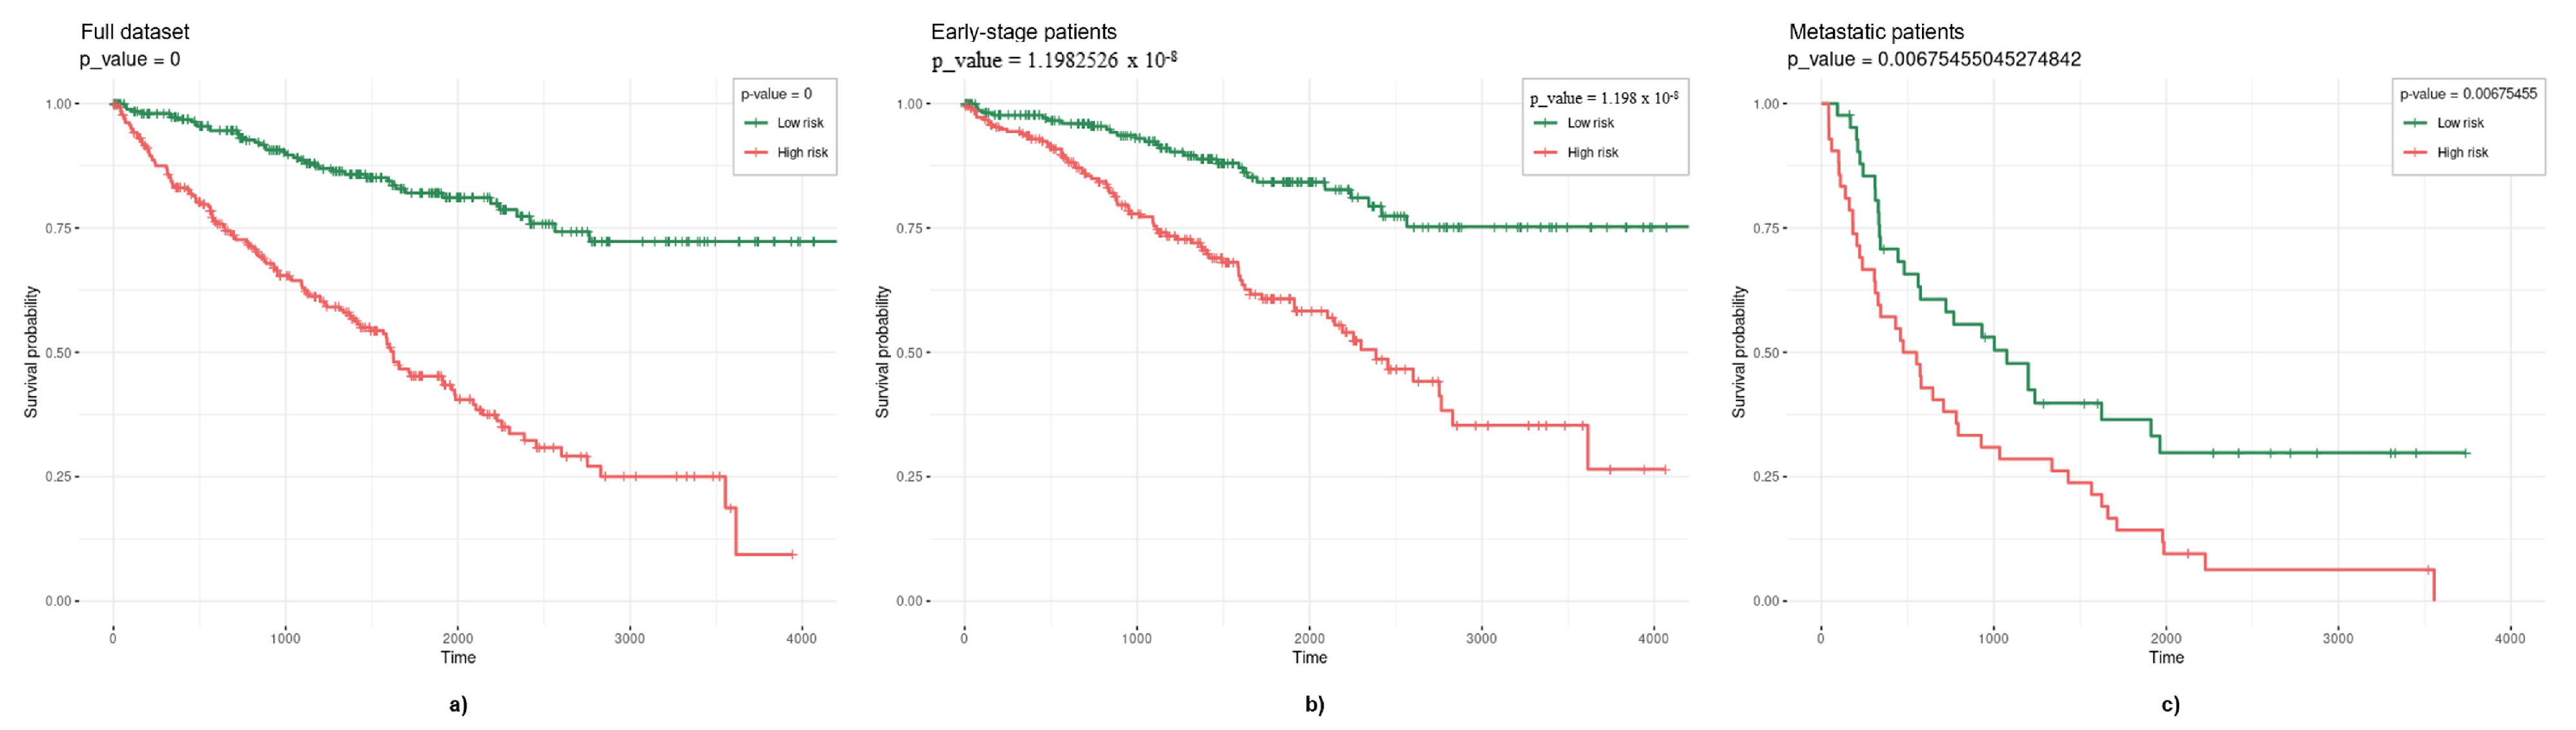
3.2. Survival Models
3.2.1. Elastic Net
3.2.2. TCox
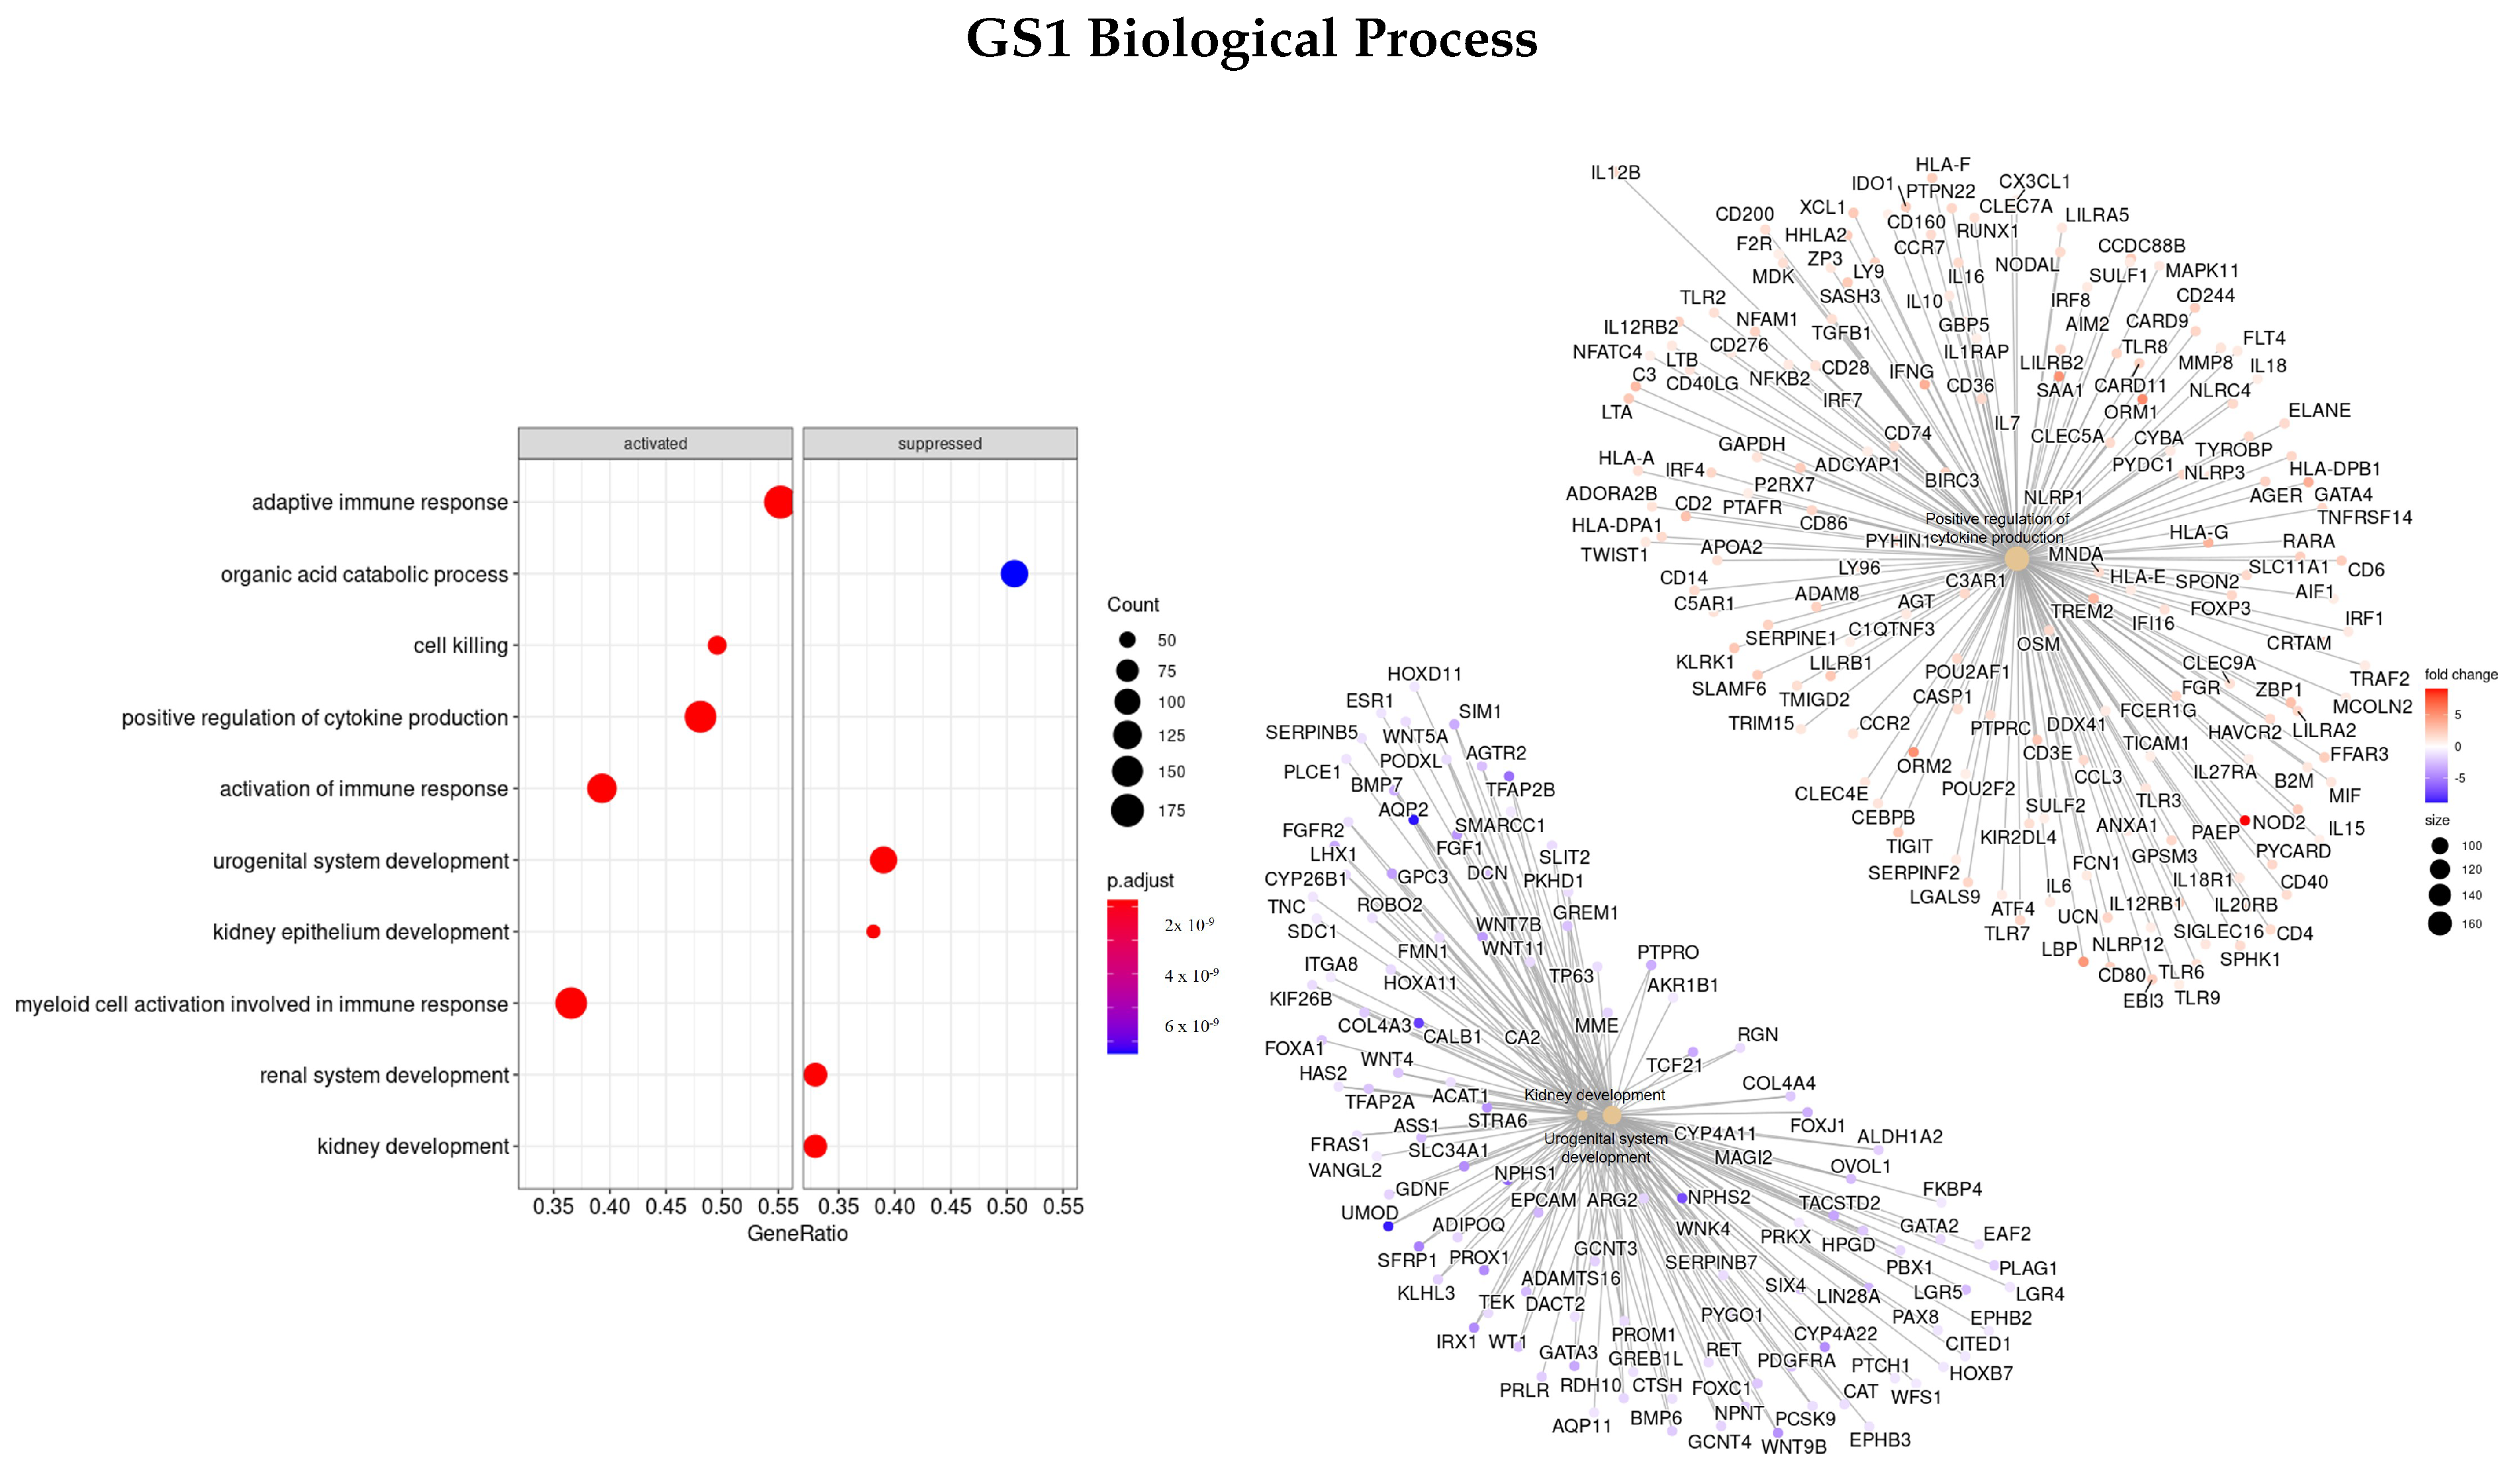
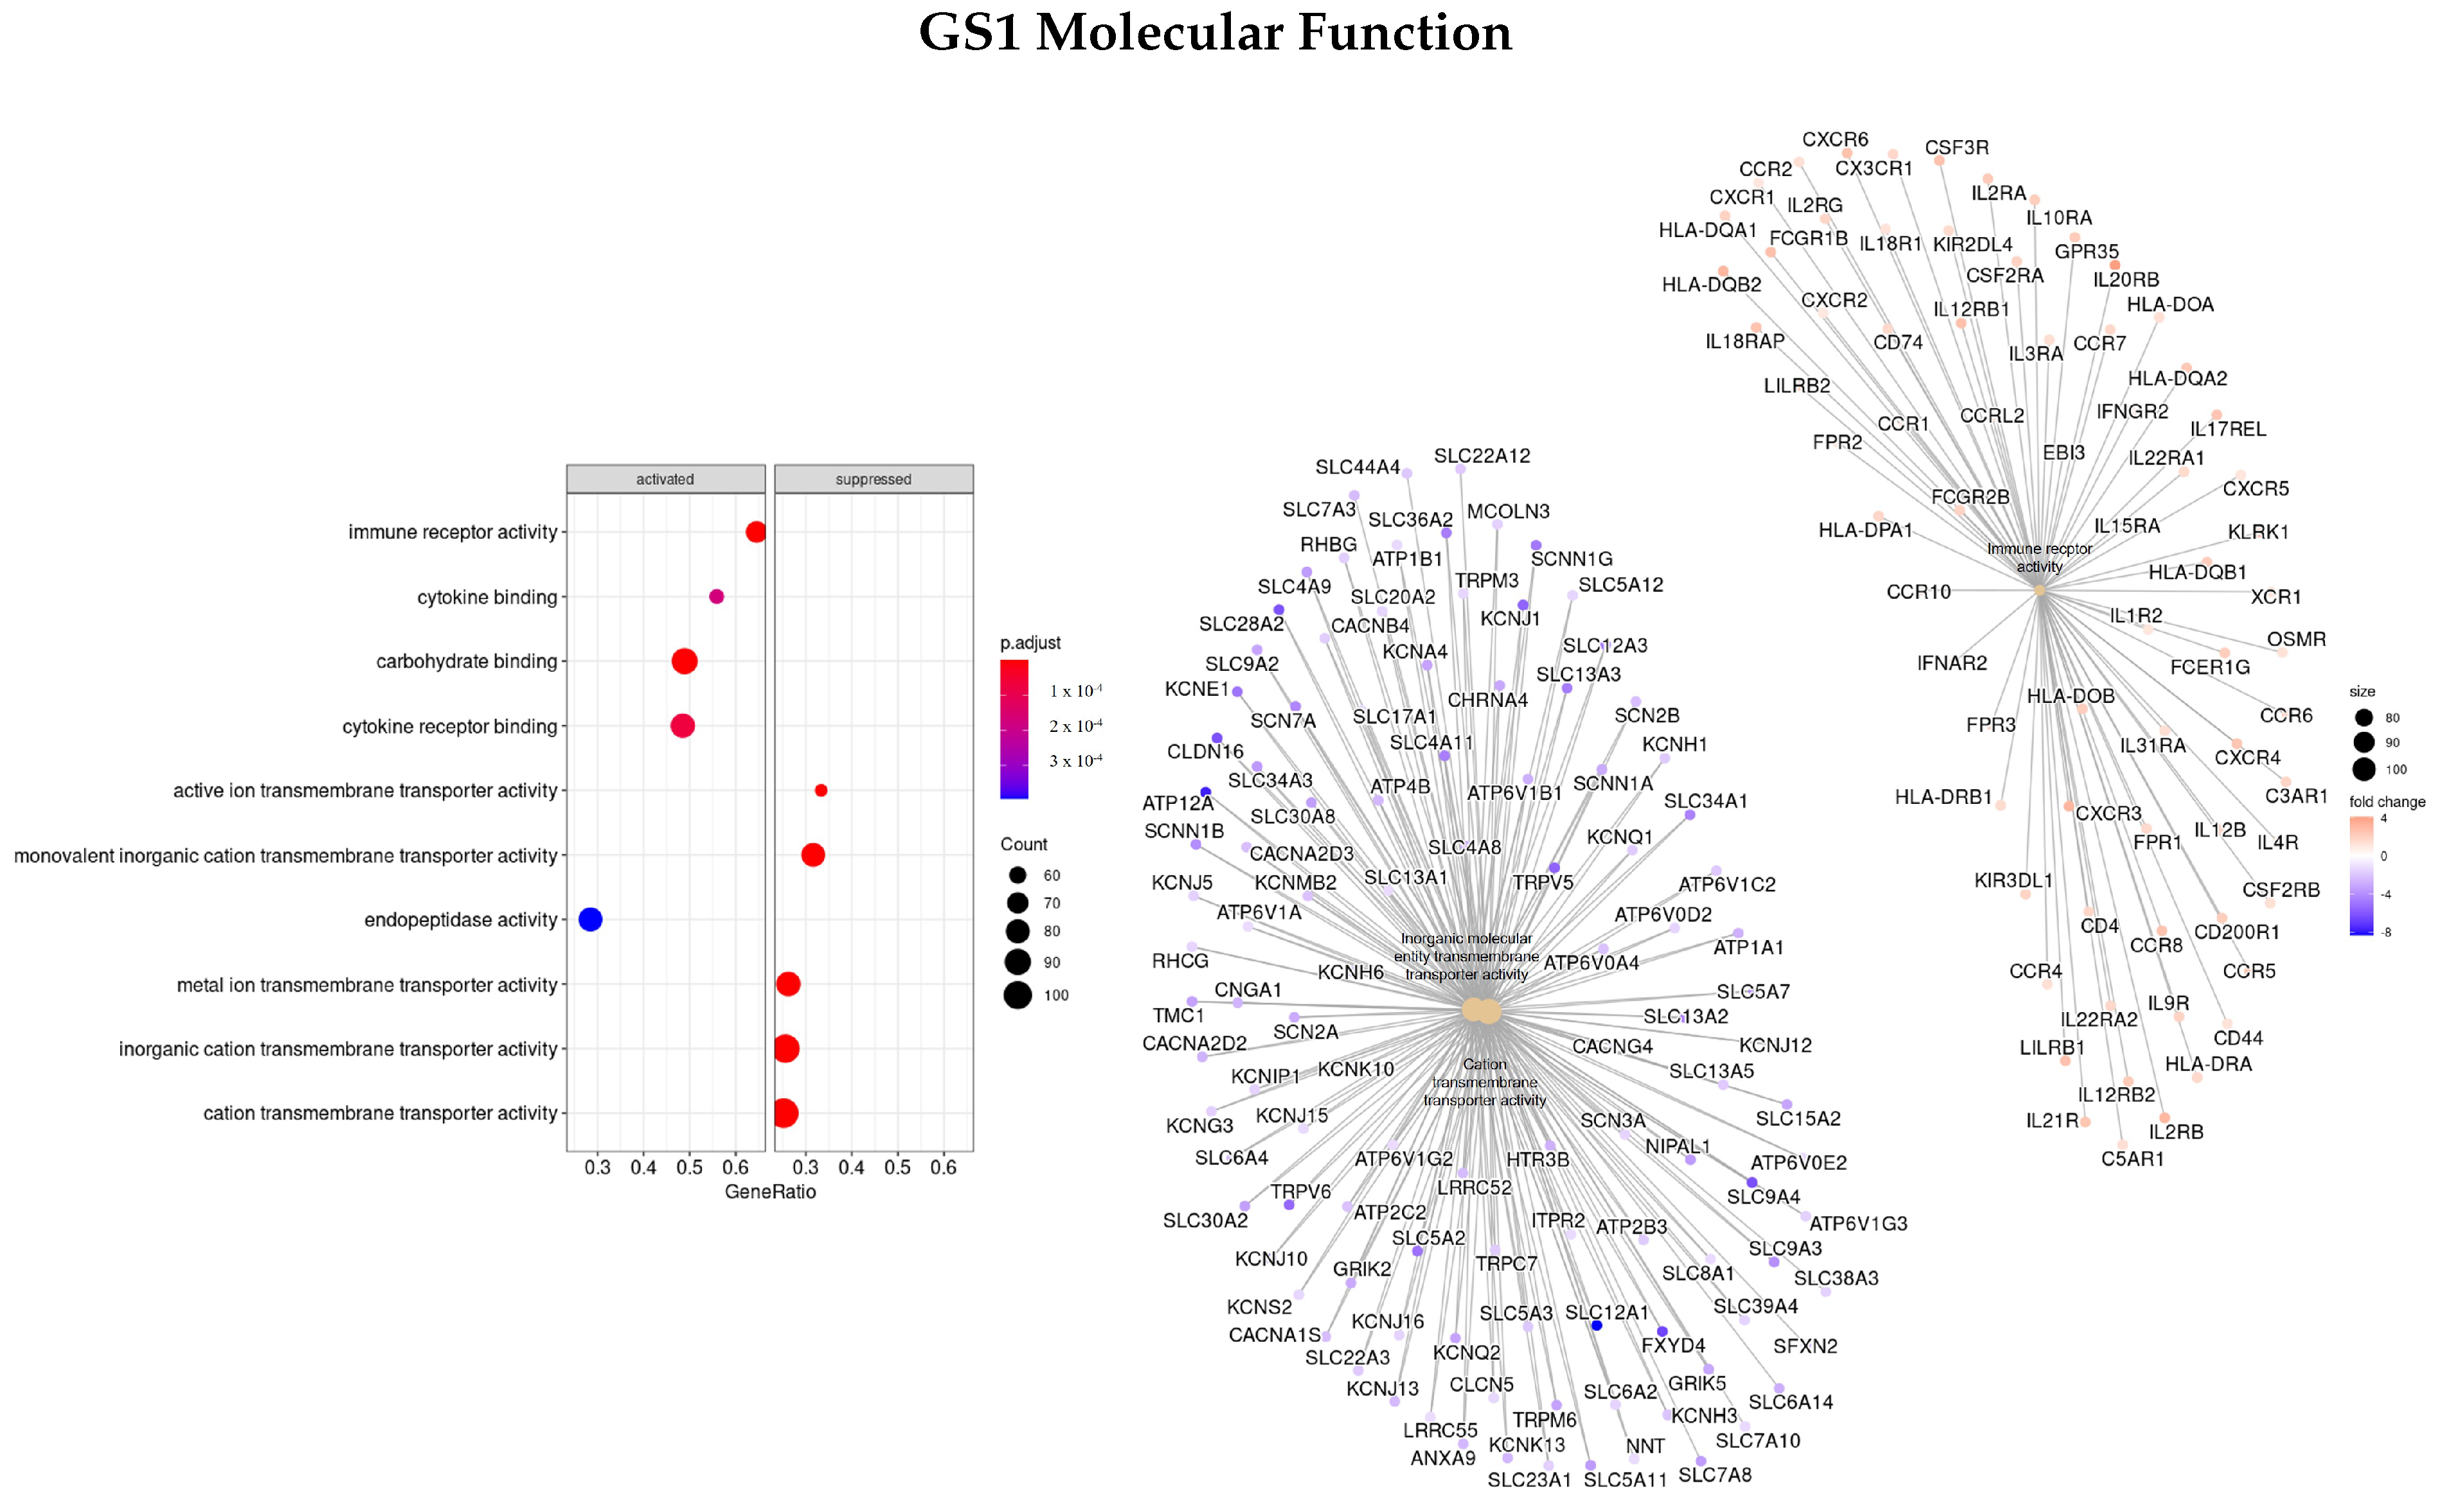
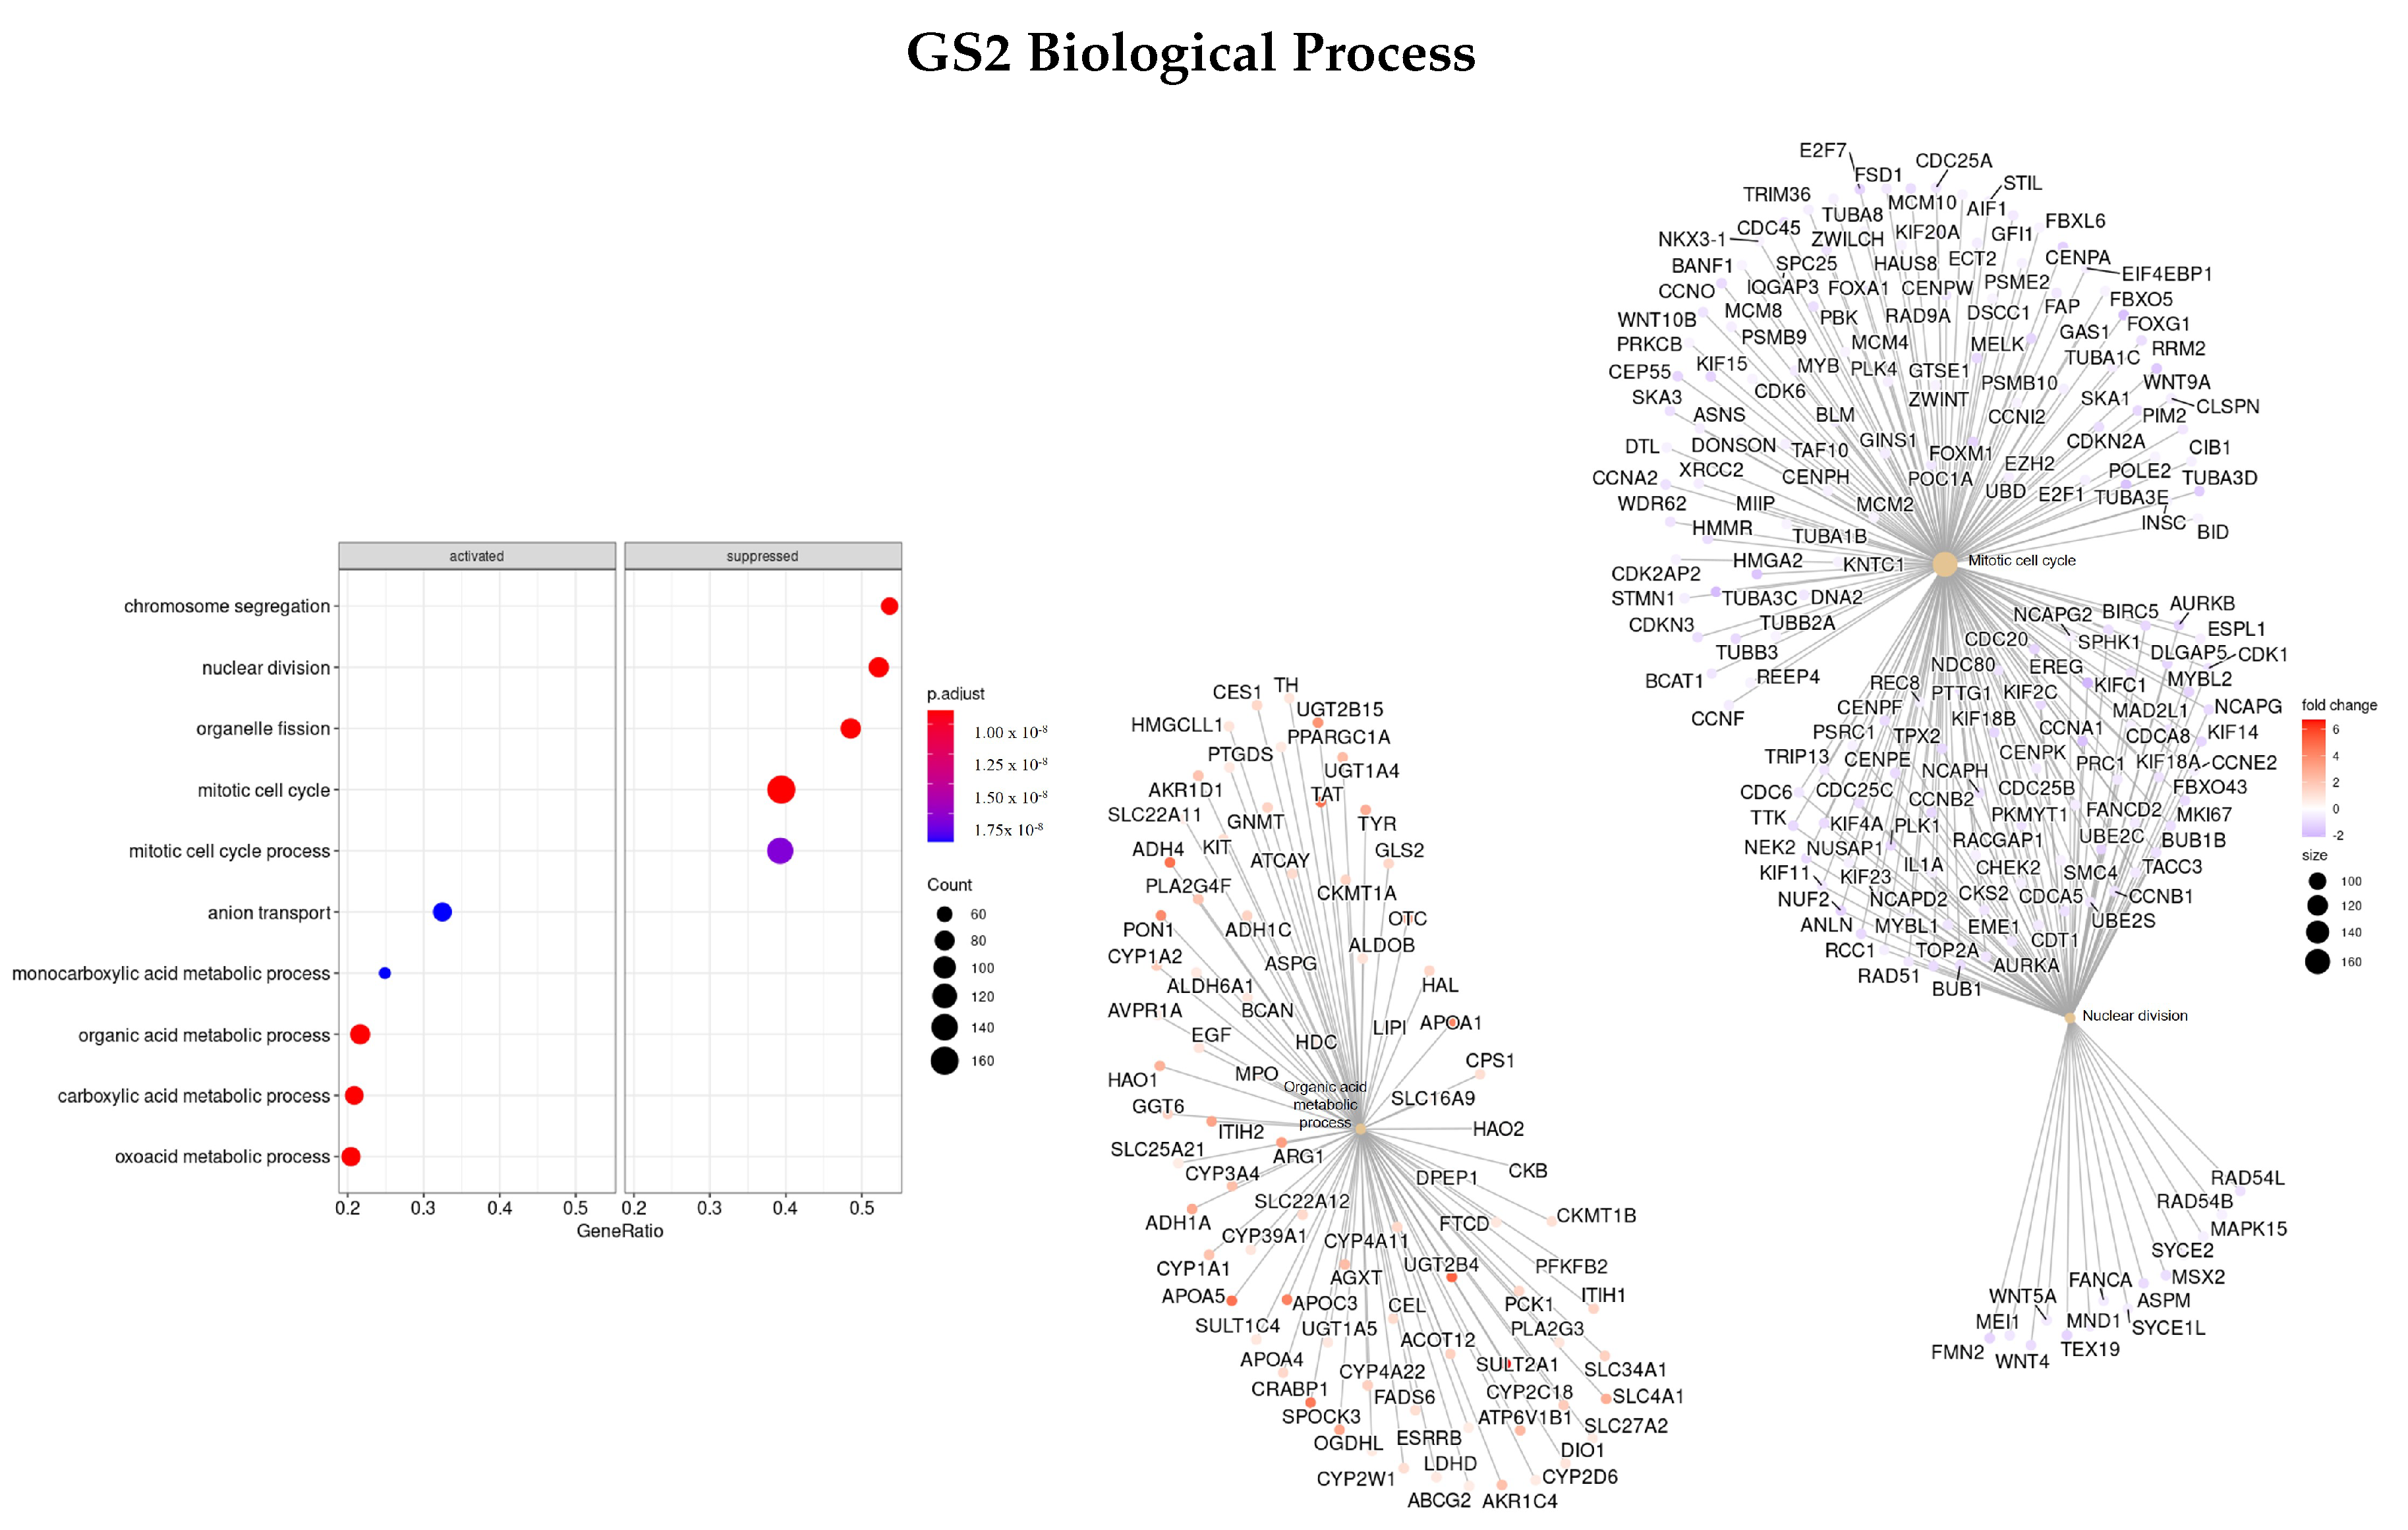
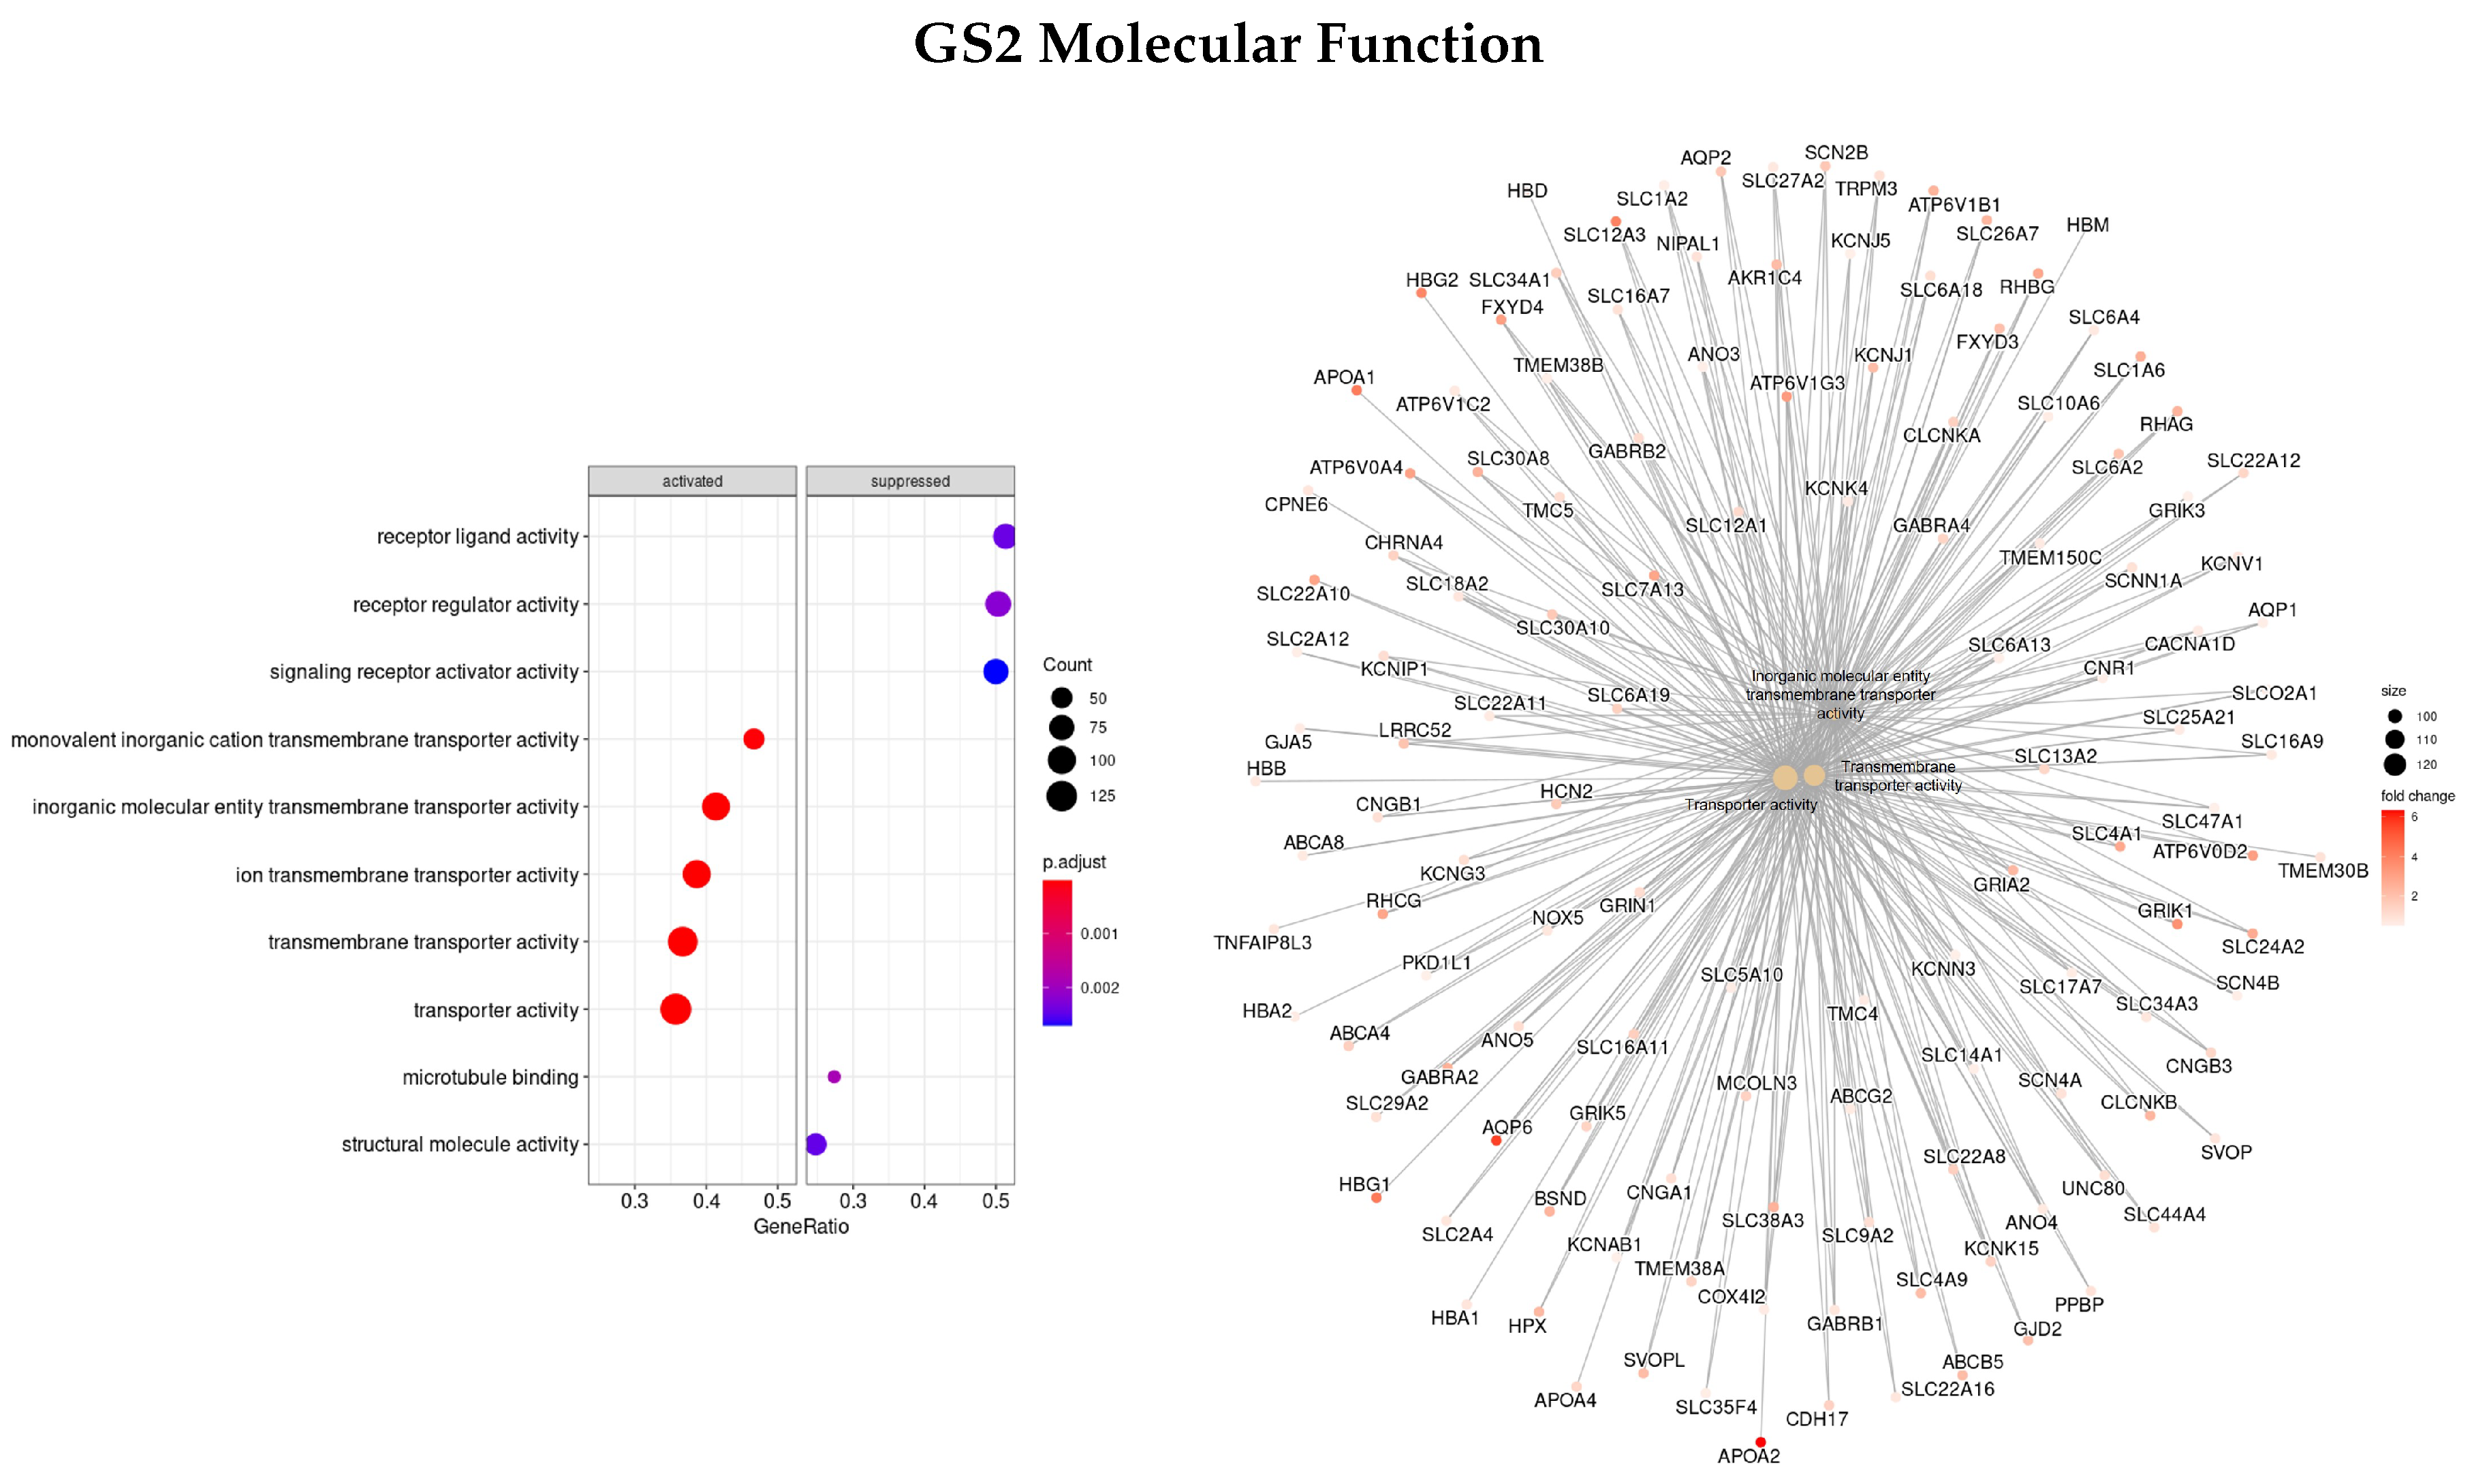
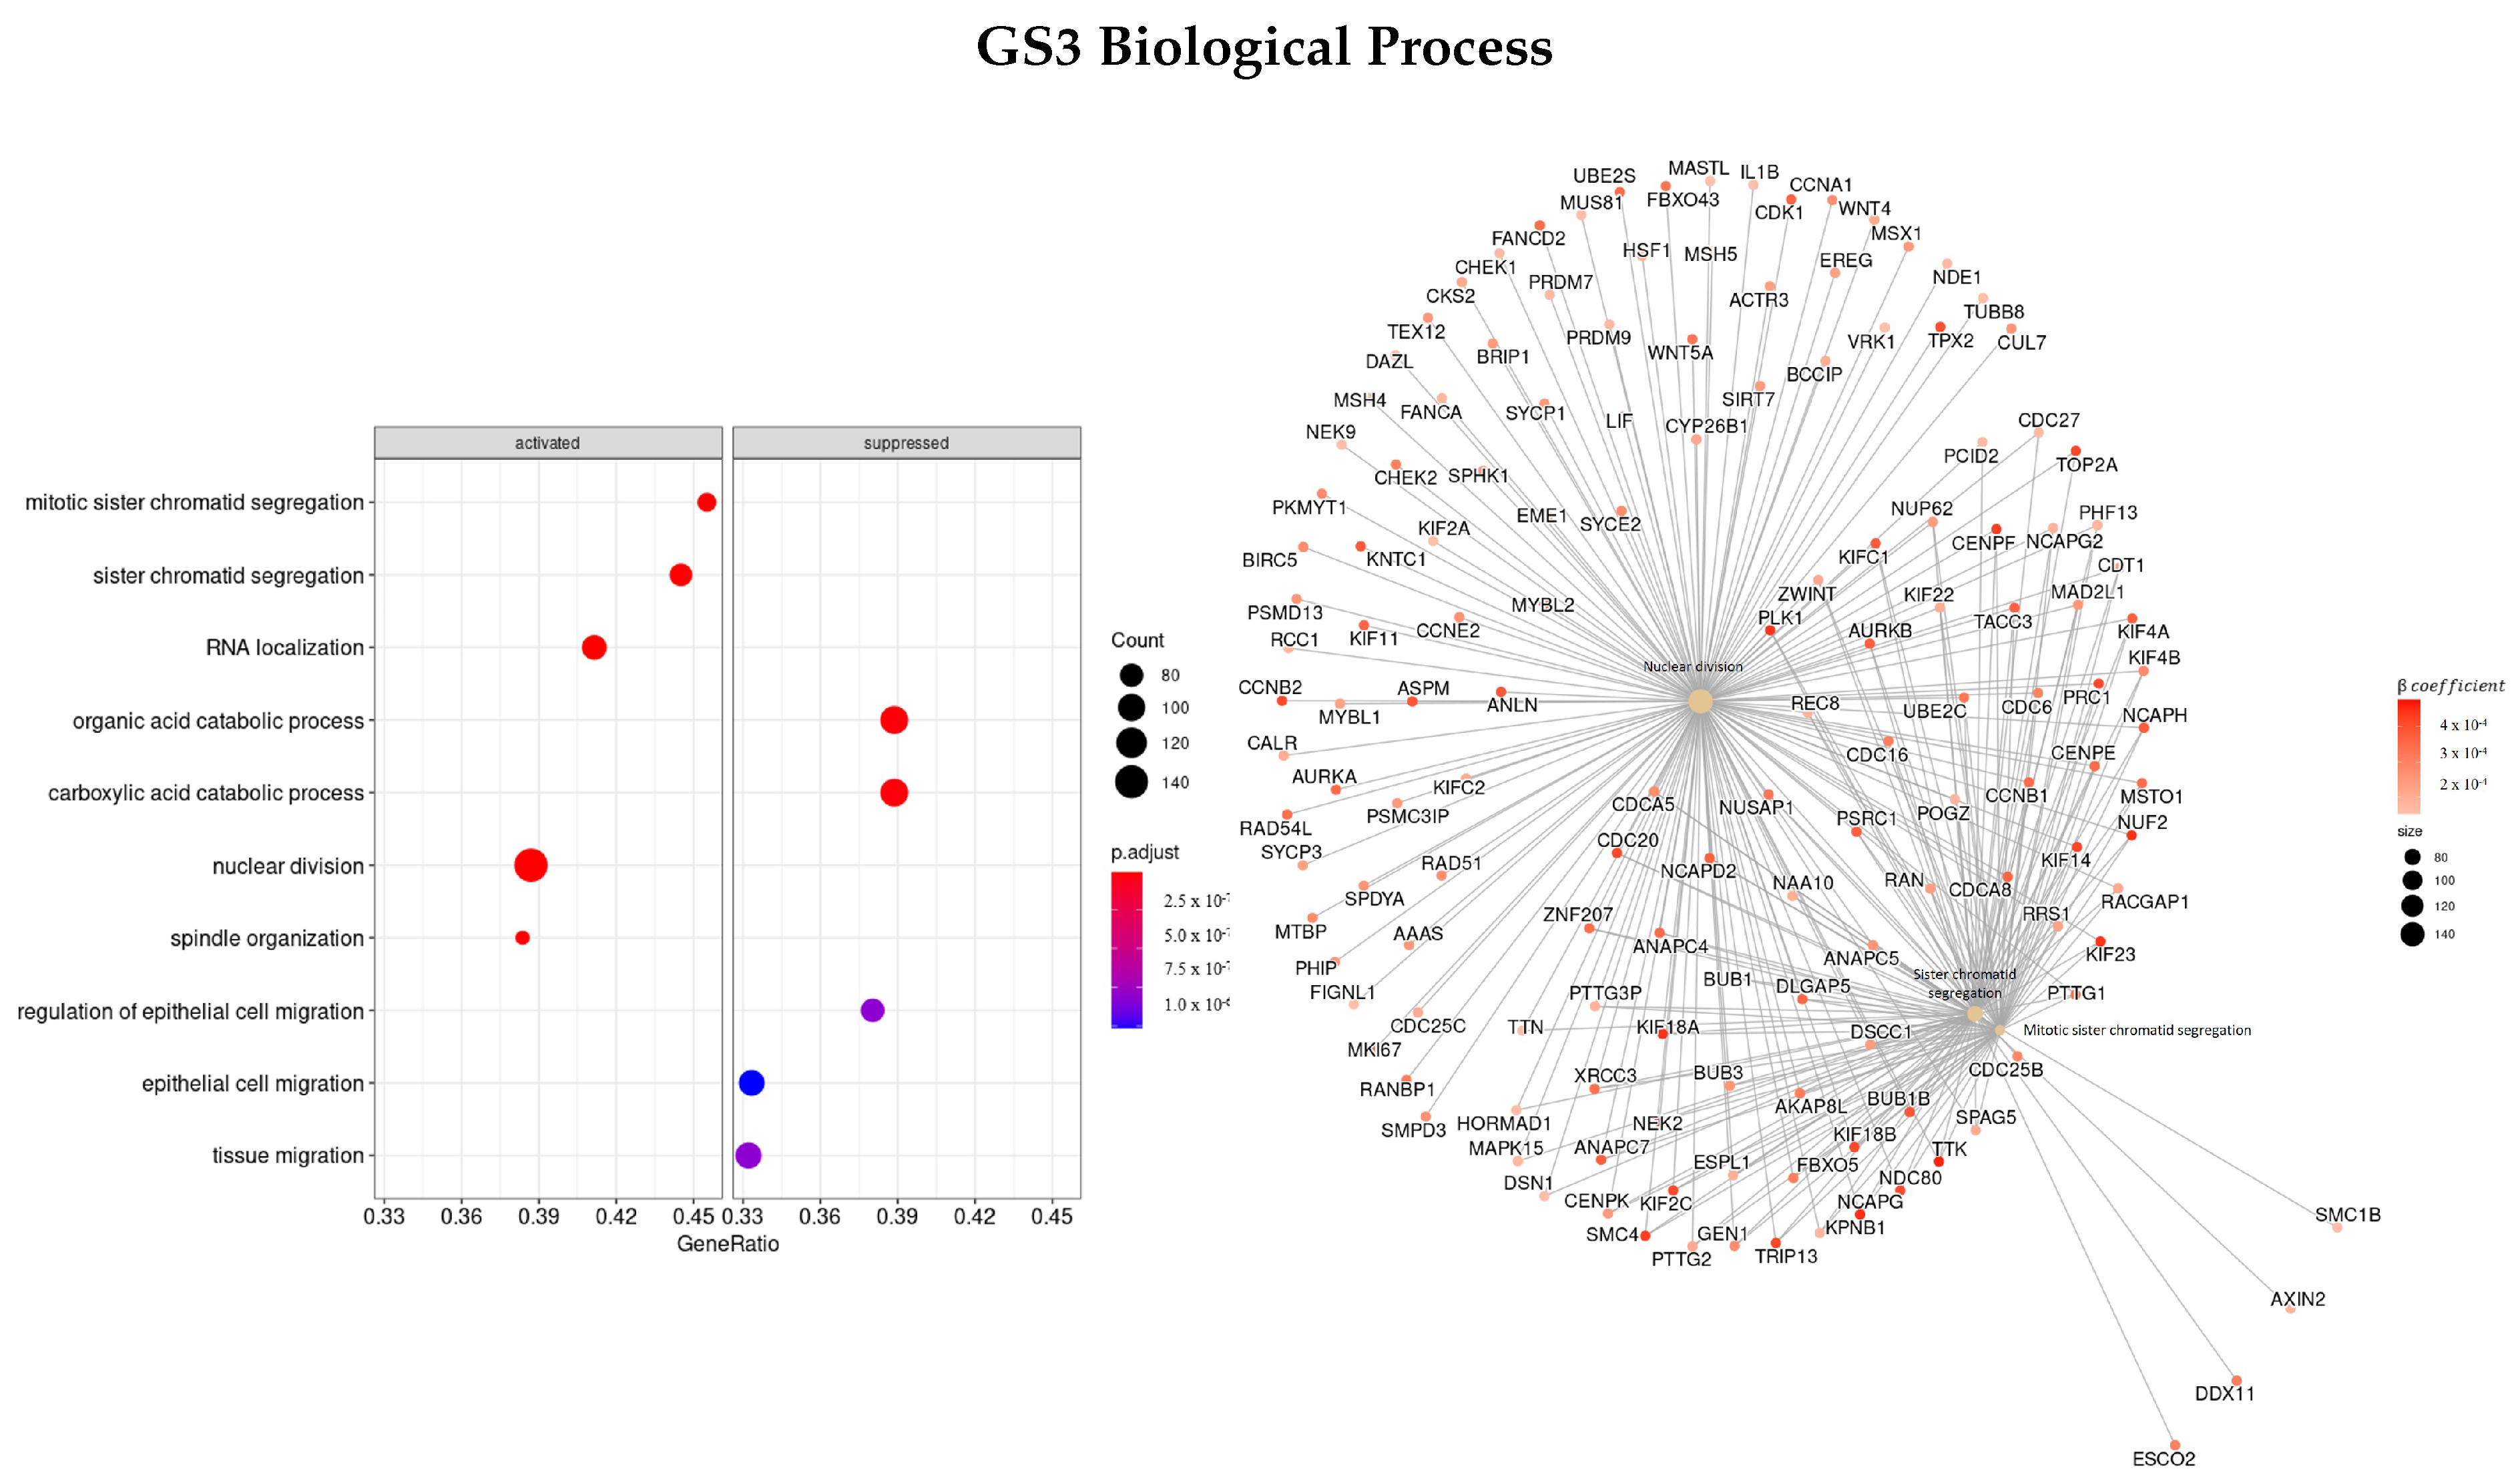
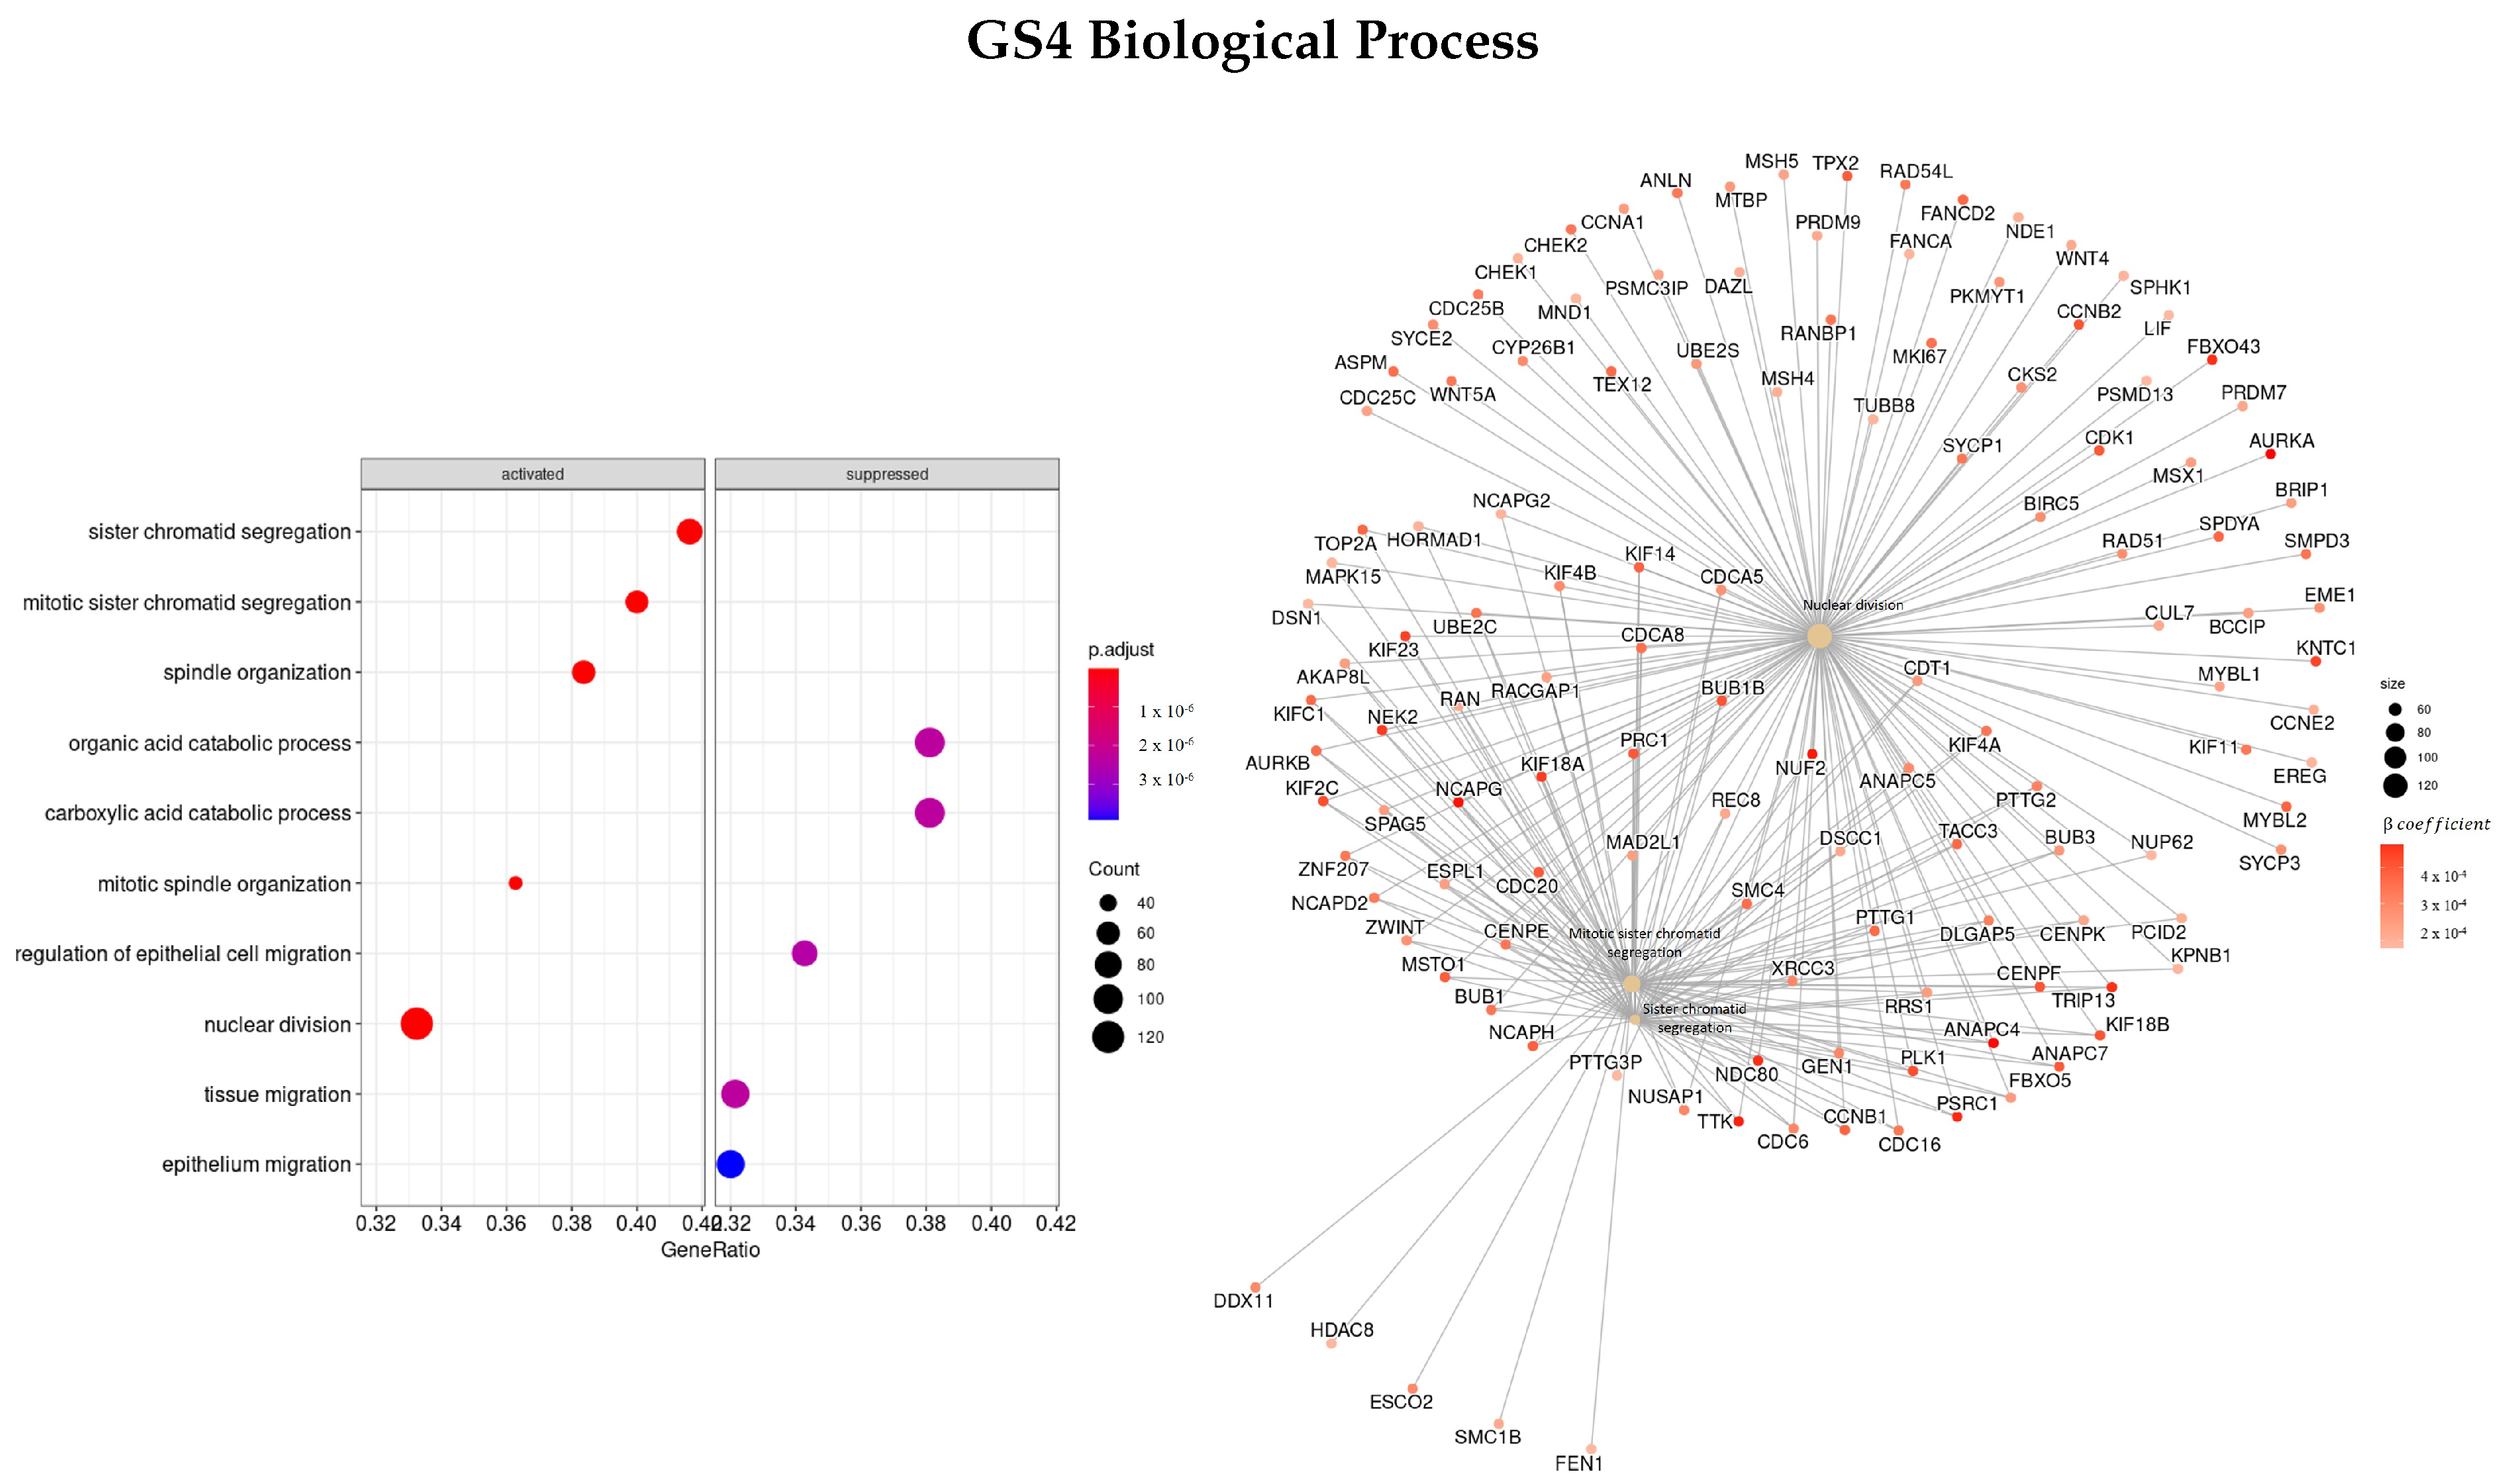
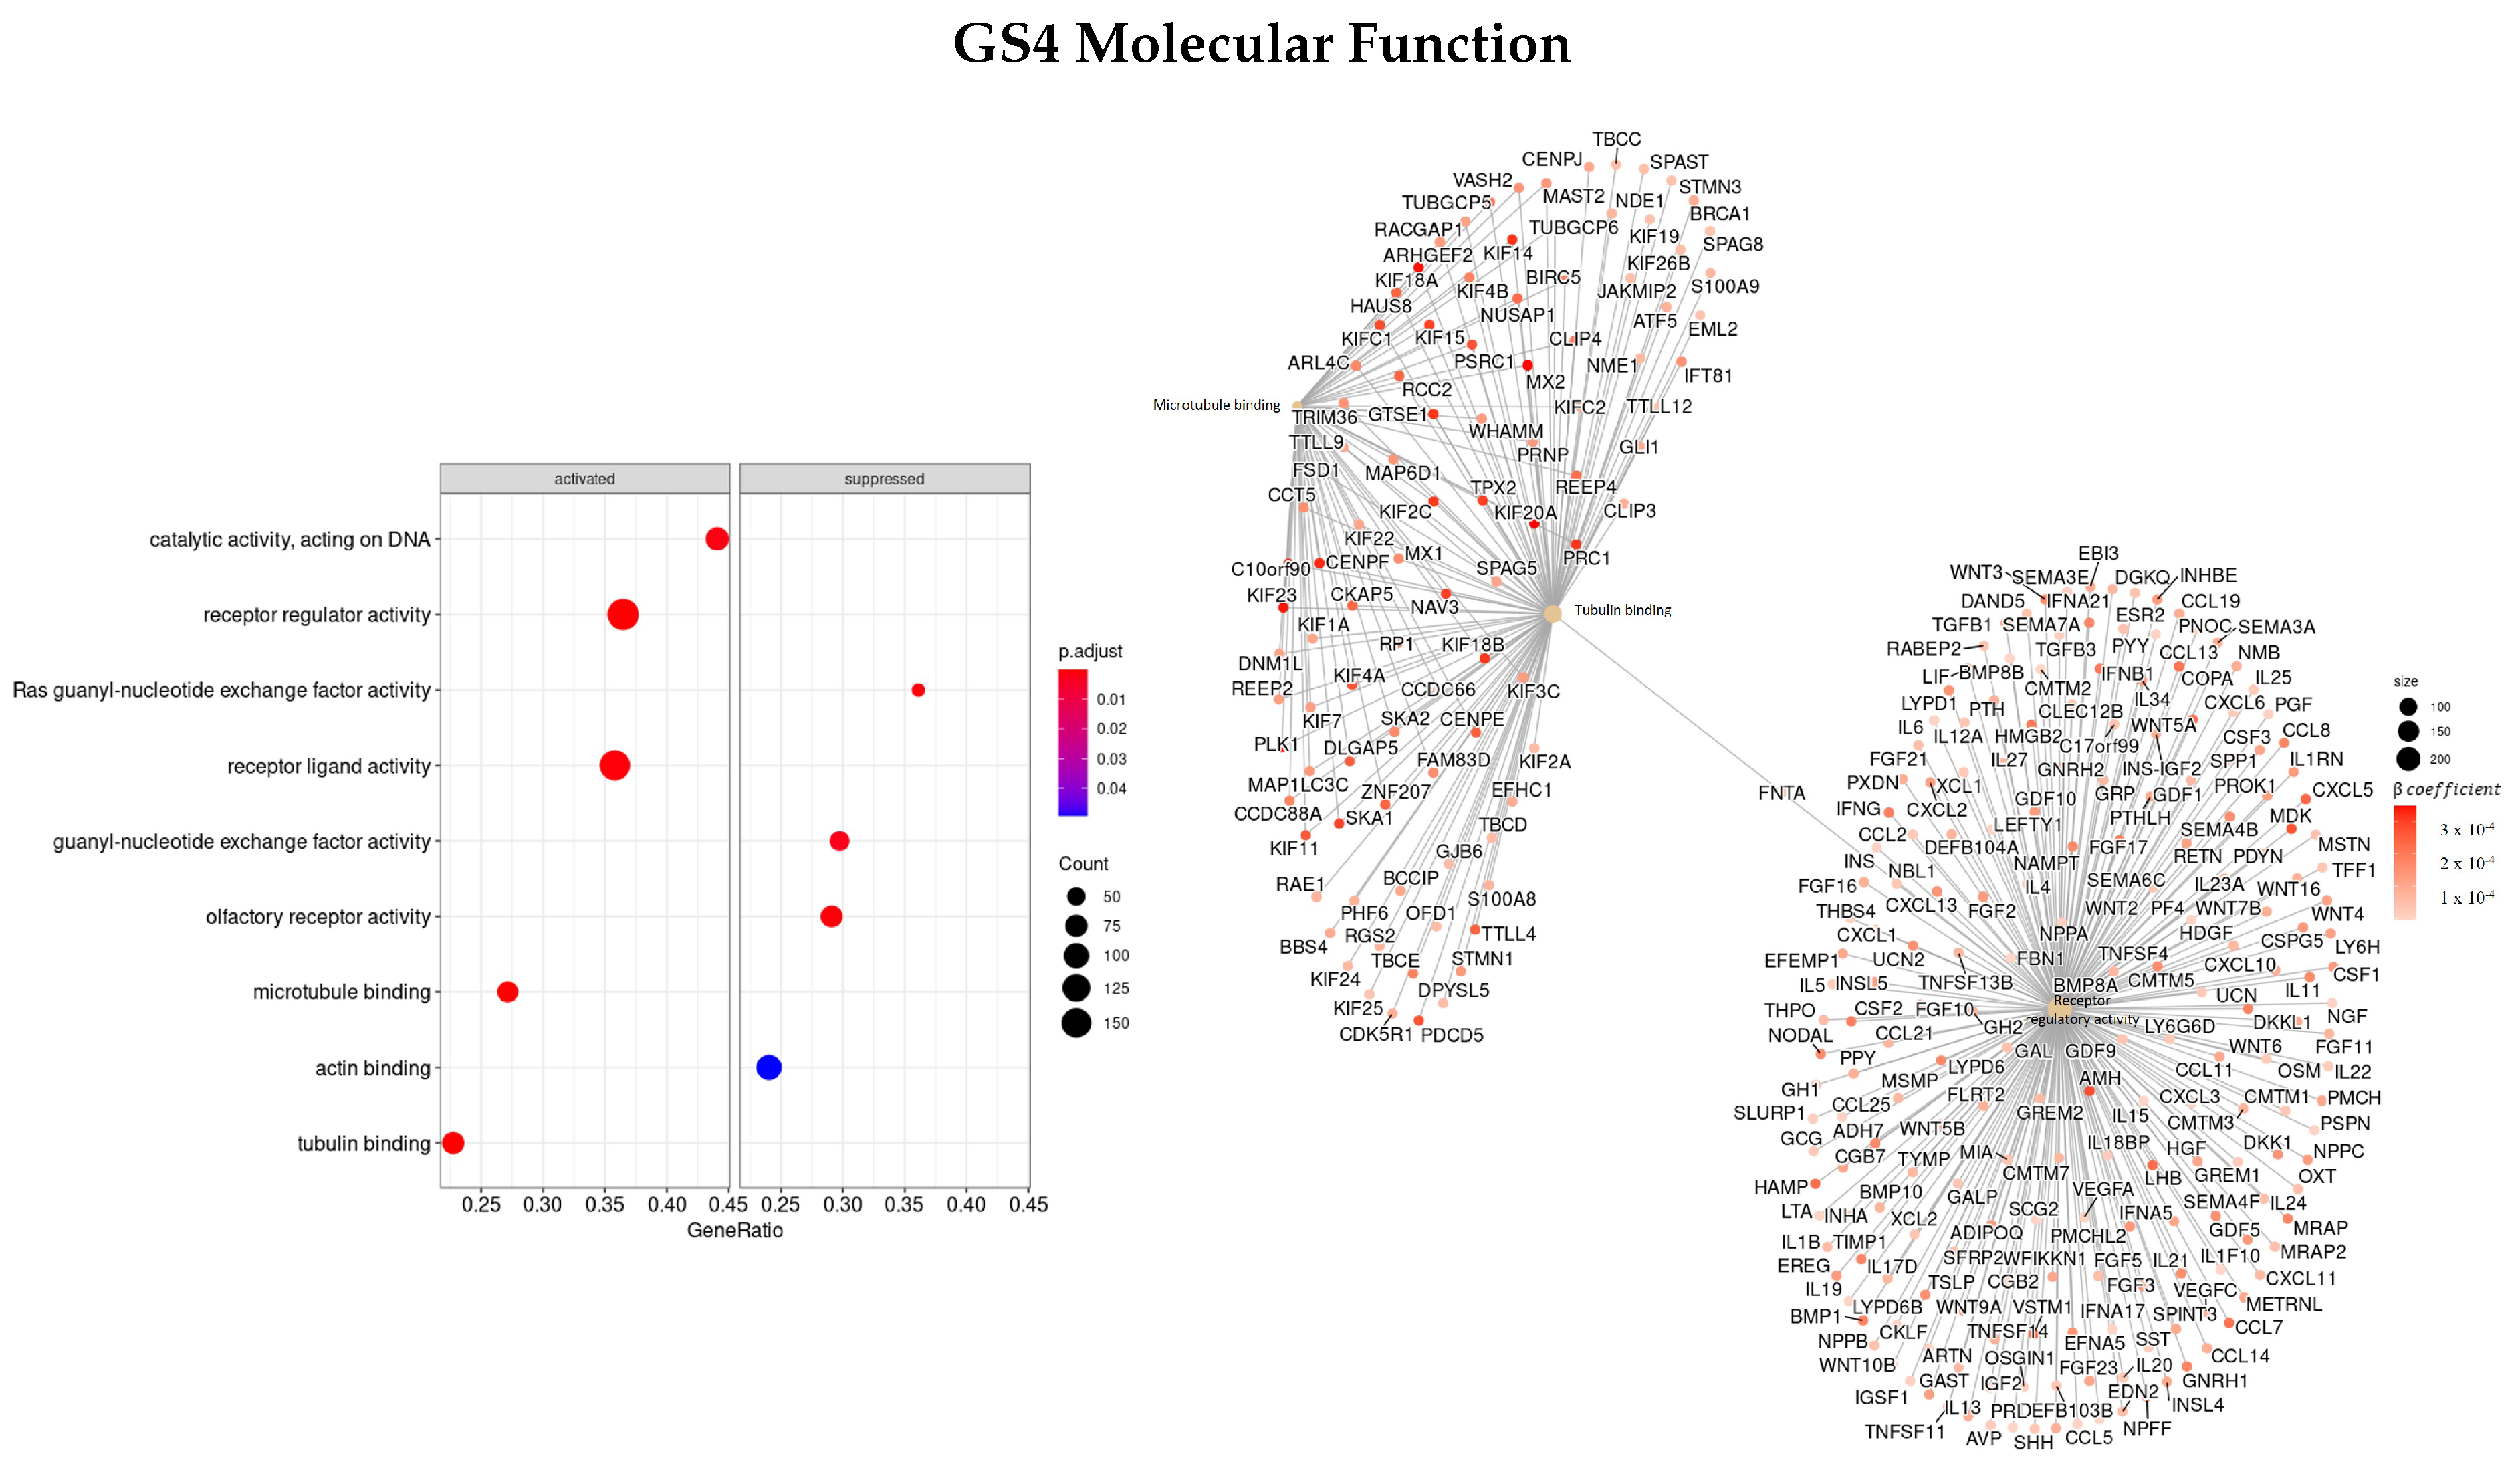
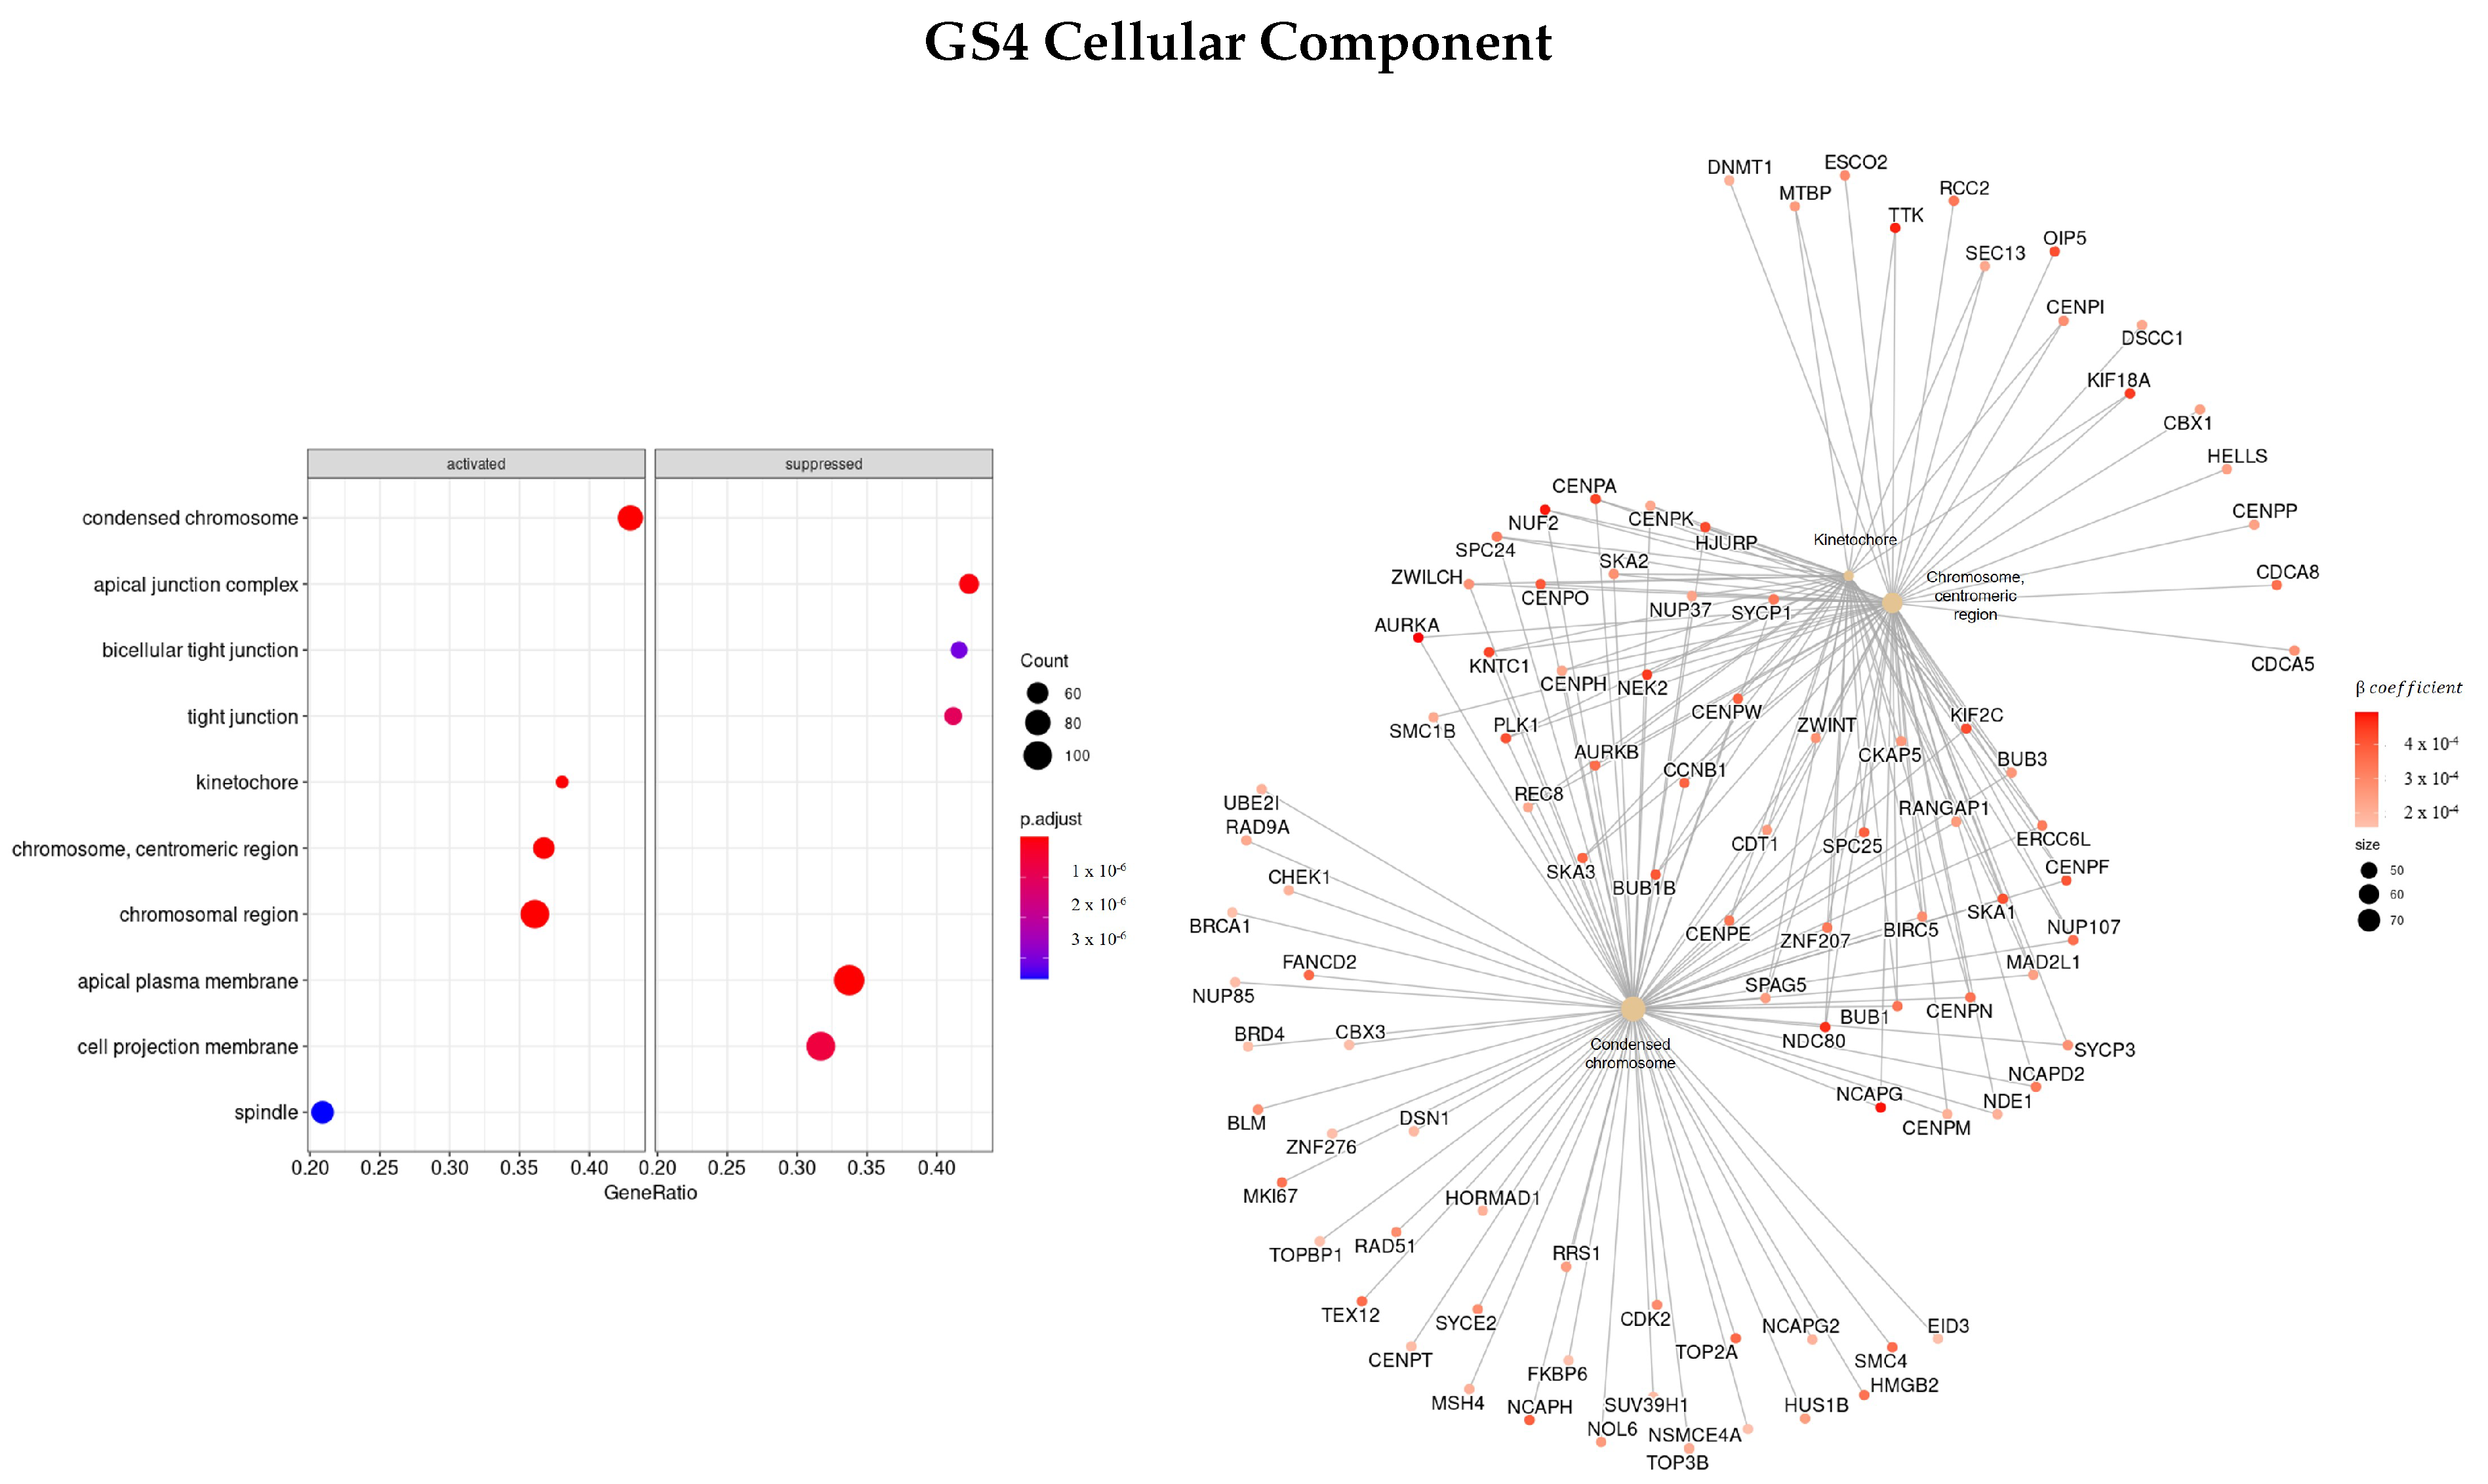
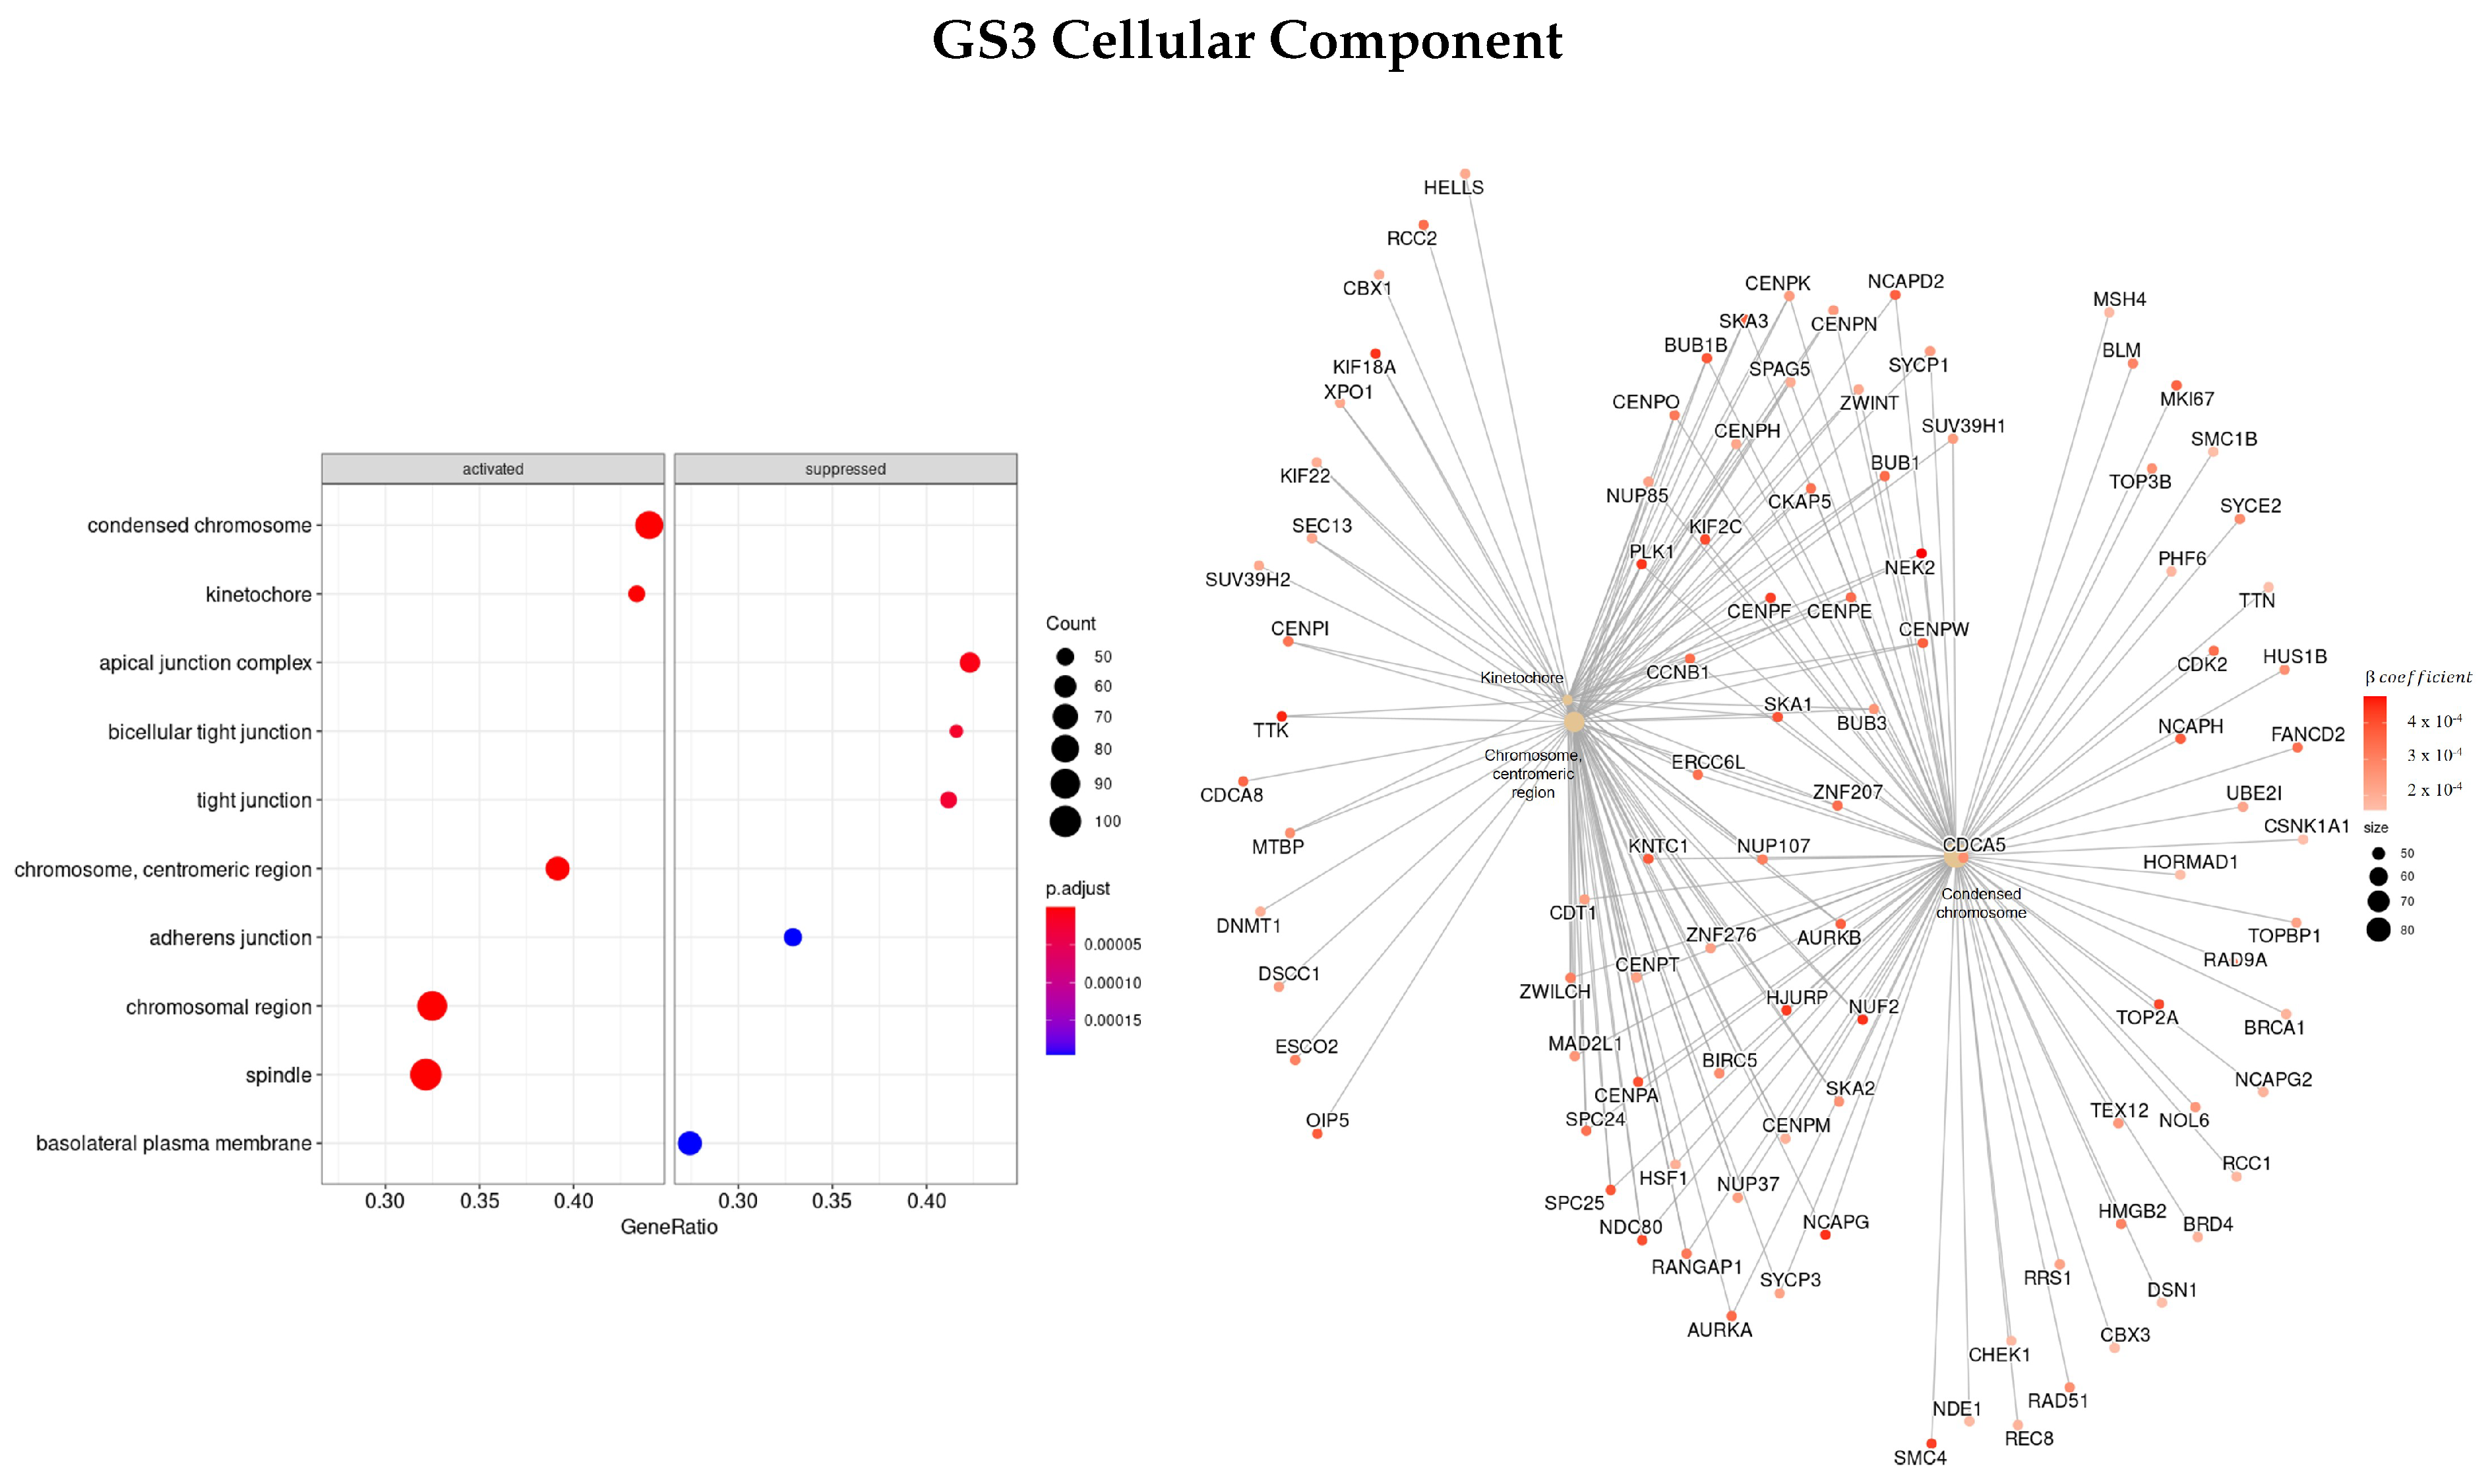
3.3. Gene Ontology
3.3.1. DEGS Tumor vs. Normal
3.3.2. DEGs Early vs. Advanced Stage
3.3.3. Genes Based on EN Regularization
3.3.4. Genes Based on TCox Regularization
4. Discussion
5. Conclusions
Author Contributions
Funding
Institutional Review Board Statement
Informed Consent Statement
Data Availability Statement
Conflicts of Interest
Abbreviations
| RCC | Renal cell carcinoma |
| ccRCC | Clear cell renal cell carcinoma |
| GO | Gene Ontology |
| GSEA | Gene set enrichment analysis |
| KEGG | Kyoto Encyclopedia of Genes and Genomes |
| RNA-seq | RNA-sequencing |
| TCGA | The Cancer Genome Atlas |
| KIRC | Kidney renal clear cell carcinoma |
| RSEM | RNA-seq by expectation–maximization |
| TNM | TNM Classification of Malignant Tumors |
| KM | Kaplan–Meier |
| HR | Hazard ratio |
| EN | Elastic net |
| DEGs | Differential expressed genes |
| LogFC | Log fold change |
| FDR | False discovery rate |
| MF | Molecular function |
| CC | Cellular component |
| BP | Biological process |
| ES | Enrichment score |
References
- Díaz-Montero, C.M.; Rini, B.I.; Finke, J.H. The immunology of renal cell carcinoma. Nat. Rev. Nephrol. 2020, 16, 721–735. [Google Scholar] [CrossRef] [PubMed]
- Sung, H.; Ferlay, J.; Siegel, R.L.; Laversanne, M.; Soerjomataram, I.; Jemal, A.; Bray, F. Global cancer statistics 2020: GLOBOCAN estimates of incidence and mortality worldwide for 36 cancers in 185 countries. CA A Cancer J. Clin. 2021, 71, 209–249. [Google Scholar] [CrossRef] [PubMed]
- Ferlay, J.; Laversanne, M.; Ervik, M.; Lam, F.; Colombet, M.; Mery, L.; Piñeros, M.; Znaor, A.; Soerjomataram, I.; Bray, F. Global Cancer Observatory: Cancer Tomorrow; International Agency for Research on Cancer: Lyon, France, 2020; Available online: https://gco.iarc.fr/tomorrow (accessed on 16 May 2022).
- Cheng, Y.; Xu, T.; Li, S.; Ruan, H. GPX1, a biomarker for the diagnosis and prognosis of kidney cancer, promotes the progression of kidney cancer. Aging (Albany NY) 2019, 11, 12165. [Google Scholar] [CrossRef]
- Harrison, H.; Thompson, R.E.; Lin, Z.; Rossi, S.H.; Stewart, G.D.; Griffin, S.J.; Usher-Smith, J.A. Risk prediction models for kidney cancer: A systematic review. Eur. Urol. Focus 2021, 7, 1380–1390. [Google Scholar] [CrossRef]
- Capitanio, U.; Bensalah, K.; Bex, A.; Boorjian, S.A.; Bray, F.; Coleman, J.; Gore, J.L.; Sun, M.; Wood, C.; Russo, P. Epidemiology of renal cell carcinoma. Eur. Urol. 2019, 75, 74–84. [Google Scholar] [CrossRef]
- Li, L.; Liu, Z.P. Detecting prognostic biomarkers of breast cancer by regularized Cox proportional hazards models. J. Transl. Med. 2021, 19, 1–20. [Google Scholar] [CrossRef]
- Malone, E.R.; Oliva, M.; Sabatini, P.J.; Stockley, T.L.; Siu, L.L. Molecular profiling for precision cancer therapies. Genome Med. 2020, 12, 1–19. [Google Scholar] [CrossRef] [Green Version]
- Veríssimo, A.; Oliveira, A.L.; Sagot, M.F.; Vinga, S. DegreeCox–a network-based regularization method for survival analysis. BMC Bioinform. 2016, 17, 109–121. [Google Scholar] [CrossRef] [Green Version]
- Lopes, M.B.; Casimiro, S.; Vinga, S. Twiner: Correlation-based regularization for identifying common cancer gene signatures. BMC Bioinform. 2019, 20, 1–15. [Google Scholar] [CrossRef]
- Chi, C.L.; Street, W.N.; Wolberg, W.H. Application of artificial neural network-based survival analysis on two breast cancer datasets. In Proceedings of the AMIA Annual Symposium Proceedings, American Medical Informatics Association, Chicago, IL, USA, 11 October 2007; Volume 2007, p. 130. [Google Scholar]
- Bradburn, M.J.; Clark, T.G.; Love, S.B.; Altman, D.G. Survival analysis part II: Multivariate data analysis–an introduction to concepts and methods. Br. J. Cancer 2003, 89, 431–436. [Google Scholar] [CrossRef]
- Lam, J.S.; Leppert, J.T.; Figlin, R.A.; Belldegrun, A.S. Role of molecular markers in the diagnosis and therapy of renal cell carcinoma. Urology 2005, 66, 1–9. [Google Scholar] [CrossRef]
- Marx, V. The big challenges of big data. Nature 2013, 498, 255–260. [Google Scholar] [CrossRef] [PubMed] [Green Version]
- Tibshirani, R. The lasso method for variable selection in the Cox model. Stat. Med. 1997, 16, 385–395. [Google Scholar] [CrossRef] [Green Version]
- Zou, H.; Hastie, T. Regularization and variable selection via the elastic net. J. R. Stat. Soc. Ser. B (Stat. Methodol.) 2005, 67, 301–320. [Google Scholar] [CrossRef] [Green Version]
- Park, M.Y.; Hastie, T. L1-regularization path algorithm for generalized linear models. J. R. Stat. Soc. Ser. B (Stat. Methodol.) 2007, 69, 659–677. [Google Scholar] [CrossRef]
- Simon, N.; Friedman, J.; Hastie, T.; Tibshirani, R. Regularization paths for Cox’s proportional hazards model via coordinate descent. J. Stat. Softw. 2011, 39, 1. [Google Scholar] [CrossRef]
- Zhang, W.; Ota, T.; Shridhar, V.; Chien, J.; Wu, B.; Kuang, R. Network-based survival analysis reveals subnetwork signatures for predicting outcomes of ovarian cancer treatment. PLoS Comput. Biol. 2013, 9, e1002975. [Google Scholar] [CrossRef] [Green Version]
- Peixoto, C.; Lopes, M.B.; Martins, M.; Costa, L.; Vinga, S. TCox: Correlation-Based Regularization Applied to Colorectal Cancer Survival Data. Biomedicines 2020, 8, 488. [Google Scholar] [CrossRef]
- Nagy, Á.; Munkácsy, G.; Gyorffy, B. Pancancer survival analysis of cancer hallmark genes. Sci. Rep. 2021, 11, 1–10. [Google Scholar] [CrossRef]
- Consortium, G.O. The gene ontology resource: 20 years and still GOing strong. Nucleic Acids Res. 2019, 47, D330–D338. [Google Scholar]
- Samur, M.K. RTCGAToolbox: A new tool for exporting TCGA Firehose data. PLoS ONE 2014, 9, e106397. [Google Scholar] [CrossRef] [Green Version]
- Li, B.; Dewey, C.N. RSEM: Accurate transcript quantification from RNA-Seq data with or without a reference genome. BMC Bioinform. 2011, 12, 1–16. [Google Scholar] [CrossRef] [PubMed] [Green Version]
- Johnson, K.A.; Krishnan, A. Robust normalization and transformation techniques for constructing gene coexpression networks from RNA-seq data. Genome Biol. 2022, 23, 1–26. [Google Scholar]
- Robinson, M.D.; McCarthy, D.J.; Smyth, G.K. edgeR: A Bioconductor package for differential expression analysis of digital gene expression data. Bioinformatics 2010, 26, 139–140. [Google Scholar] [CrossRef] [PubMed] [Green Version]
- McCarthy, D.J.; Chen, Y.; Smyth, G.K. Differential expression analysis of multifactor RNA-Seq experiments with respect to biological variation. Nucleic Acids Res. 2012, 40, 4288–4297. [Google Scholar] [CrossRef] [Green Version]
- Chen, Y.; Lun, A.T.; Smyth, G.K. From reads to genes to pathways: Differential expression analysis of RNA-Seq experiments using Rsubread and the edgeR quasi-likelihood pipeline. F1000Research 2016, 5, 1438. [Google Scholar] [PubMed] [Green Version]
- Haynes, W. Benjamini–Hochberg Method. In Encyclopedia of Systems Biology; Dubitzky, W., Wolkenhauer, O., Cho, K.H., Yokota, H., Eds.; Springer: New York, NY, USA, 2013; p. 78. [Google Scholar] [CrossRef]
- Kaplan, E.L.; Meier, P. Nonparametric estimation from incomplete observations. J. Am. Stat. Assoc. 1958, 53, 457–481. [Google Scholar] [CrossRef]
- Bewick, V.; Cheek, L.; Ball, J. Statistics review 12: Survival analysis. Crit. Care 2004, 8, 1–6. [Google Scholar]
- Peto, R.; Pike, M.; Armitage, P.; Breslow, N.E.; Cox, D.; Howard, S.; Mantel, N.; McPherson, K.; Peto, J.; Smith, P. Design and analysis of randomized clinical trials requiring prolonged observation of each patient. II. analysis and examples. Br. J. Cancer 1977, 35, 1–39. [Google Scholar] [CrossRef] [Green Version]
- Walters, S.J. What is a Cox Model? Hayward Medical Communications: Newmarket, UK, 1999. [Google Scholar]
- Cox, D.R. Regression models and life-tables. J. R. Stat. Soc. Ser. B (Methodol.) 1972, 34, 187–202. [Google Scholar] [CrossRef]
- Friedman, J.; Hastie, T.; Tibshirani, R. Regularization Paths for Generalized Linear Models via Coordinate Descent. J. Stat. Softw. 2010, 33, 1–22. [Google Scholar] [CrossRef] [Green Version]
- Wu, T.; Hu, E.; Xu, S.; Chen, M.; Guo, P.; Dai, Z.; Feng, T.; Zhou, L.; Tang, W.; Zhan, L.; et al. clusterProfiler 4.0: A universal enrichment tool for interpreting omics data. Innovation 2021, 2, 100141. [Google Scholar] [CrossRef]
- Ashburner, M.; Ball, C.A.; Blake, J.A.; Botstein, D.; Butler, H.; Cherry, J.M.; Davis, A.P.; Dolinski, K.; Dwight, S.S.; Eppig, J.T.; et al. Gene ontology: Tool for the unification of biology. Nat. Genet. 2000, 25, 25–29. [Google Scholar] [CrossRef] [PubMed] [Green Version]
- Kanehisa, M.; Goto, S. KEGG: Kyoto encyclopedia of genes and genomes. Nucleic Acids Res. 2000, 28, 27–30. [Google Scholar] [CrossRef] [PubMed]
- Kanehisa, M. Toward understanding the origin and evolution of cellular organisms. Protein Sci. 2019, 28, 1947–1951. [Google Scholar] [CrossRef] [PubMed]
- Kanehisa, M.; Furumichi, M.; Sato, Y.; Ishiguro-Watanabe, M.; Tanabe, M. KEGG: Integrating viruses and cellular organisms. Nucleic Acids Res. 2021, 49, D545–D551. [Google Scholar] [CrossRef]
- Chen, B.; Jiao, Z.; Yin, X.; Qian, Z.; Gu, J.; Sun, H. Novel insights into biomarkers associated with renal cell carcinoma. Oncol. Lett. 2018, 16, 83–90. [Google Scholar] [CrossRef]
- Ding, L.; Zhao, Y.; Dang, S.; Wang, Y.; Li, X.; Yu, X.; Li, Z.; Wei, J.; Liu, M.; Li, G. Circular RNA circ-DONSON facilitates gastric cancer growth and invasion via NURF complex dependent activation of transcription factor SOX4. Mol. Cancer 2019, 18, 1–11. [Google Scholar] [CrossRef]
- Klümper, N.; Blajan, I.; Schmidt, D.; Kristiansen, G.; Toma, M.; Hölzel, M.; Ritter, M.; Ellinger, J. Downstream neighbor of SON (DONSON) is associated with unfavorable survival across diverse cancers with oncogenic properties in clear cell renal cell carcinoma. Transl. Oncol. 2020, 13, 100844. [Google Scholar] [CrossRef]
- Zeng, Q.; Lei, F.; Chang, Y.; Gao, Z.; Wang, Y.; Gao, Q.; Niu, P.; Li, Q. An oncogenic gene, SNRPA1, regulates PIK3R1, VEGFC, MKI67, CDK1 and other genes in colorectal cancer. Biomed. Pharmacother. 2019, 117, 109076. [Google Scholar] [CrossRef]
- Jiang, A.; Meng, J.; Gong, W.; Zhang, Z.; Gan, X.; Wang, J.; Wu, Z.; Liu, B.; Qu, L.; Wang, L. Elevated SNRPA1, as a promising predictor reflecting severe clinical outcome via effecting tumor immunity for ccRCC, is related to cell invasion, metastasis, and sunitinib sensitivity. Front. Immunol. 2022, 13, 842069. [Google Scholar] [CrossRef] [PubMed]
- Mamoor, S. SEC61A2 is differentially expressed in the brain metastases of patients with metastatic breast cancer. (OSF Preprints, 2020). Available online: https://doi.org/10.31219/osf.io/tus7h (accessed on 12 July 2022).
- Yan, B.; Peng, Z.; Xing, C. SORBS2, mediated by MEF2D, suppresses the metastasis of human hepatocellular carcinoma by inhibitiing the c-Abl-ERK signaling pathway. Am. J. Cancer Res. 2019, 9, 2706. [Google Scholar] [PubMed]
- Lv, Q.; Dong, F.; Zhou, Y.; Cai, Z.; Wang, G. RNA-binding protein SORBS2 suppresses clear cell renal cell carcinoma metastasis by enhancing MTUS1 mRNA stability. Cell Death Dis. 2020, 11, 1–12. [Google Scholar] [CrossRef]
- Bi, G.; Zhu, D.; Bian, Y.; Huang, Y.; Zhan, C.; Yang, Y.; Wang, Q. Knockdown of GTF2E2 inhibits the growth and progression of lung adenocarcinoma via RPS4X in vitro and in vivo. Cancer Cell Int. 2021, 21, 1–13. [Google Scholar] [CrossRef]
- Kim, S.; Lee, S.; Chung, J.; Cho, S.; Lee, J.; Lee, C. P2. 03-30 Genetic Characteristics of Lung Cancer in Patients with Idiopathic Pulmonary Fibrosis. J. Thorac. Oncol. 2019, 14, S694–S695. [Google Scholar] [CrossRef]
- GeneCards—The Human Gene Database—[Cited 2022 06 01]. Available online: www.genecards.org (accessed on 1 June 2022).
- Gao, J.; Yang, D.; Cao, R.; Huang, H.; Ma, J.; Wang, Z.; Xia, J.; Pan, X. The role of Fbxo5 in the development of human malignant tumors. Am. J. Cancer Res. 2022, 12, 1456. [Google Scholar]
- Ma, R.m.; Yang, F.; Huang, D.p.; Zheng, M.; Wang, Y.l. The prognostic value of the expression of SMC4 mRNA in breast cancer. Dis. Markers 2019, 2019, 2183057. [Google Scholar] [CrossRef]
- Li, J.; Dallmayer, M.; Kirchner, T.; Musa, J.; Grünewald, T.G. PRC1: Linking cytokinesis, chromosomal instability, and cancer evolution. Trends Cancer 2018, 4, 59–73. [Google Scholar] [CrossRef]
- Kang, W.; Zhang, M.; Wang, Q.; Gu, D.; Huang, Z.; Wang, H.; Xiang, Y.; Xia, Q.; Cui, Z.; Jin, X. The SLC family are candidate diagnostic and prognostic biomarkers in clear cell renal cell carcinoma. BioMed Res. Int. 2020, 2020, 1932948. [Google Scholar]
- Yu, Y.; Feng, Y.M. The role of kinesin family proteins in tumorigenesis and progression: potential biomarkers and molecular targets for cancer therapy. Cancer 2010, 116, 5150–5160. [Google Scholar] [CrossRef] [PubMed]
- Neumayer, G.; Belzil, C.; Gruss, O.J.; Nguyen, M.D. TPX2: Of spindle assembly, DNA damage response, and cancer. Cell. Mol. Life Sci. 2014, 71, 3027–3047. [Google Scholar] [CrossRef]
- Lin, F.; Xie, Y.J.; Zhang, X.K.; Huang, T.J.; Xu, H.F.; Mei, Y.; Liang, H.; Hu, H.; Lin, S.T.; Luo, F.F.; et al. GTSE1 is involved in breast cancer progression in p53 mutation-dependent manner. J. Exp. Clin. Cancer Res. 2019, 38, 1–16. [Google Scholar] [CrossRef] [PubMed] [Green Version]
- Shayakul, C.; Clémençon, B.; Hediger, M.A. The urea transporter family (SLC14): Physiological, pathological and structural aspects. Mol. Asp. Med. 2013, 34, 313–322. [Google Scholar] [CrossRef] [PubMed]
- Wang, J.; Feng, L.; Zhu, Z.; Zheng, M.; Wang, D.; Chen, Z.; Sun, H. Aquaporins as diagnostic and therapeutic targets in cancer: How far we are? J. Transl. Med. 2015, 13, 1–11. [Google Scholar] [CrossRef] [PubMed] [Green Version]
- Kaistha, B.; Honstein, T.; Müller, V.; Bielak, S.; Sauer, M.; Kreider, R.; Fassan, M.; Scarpa, A.; Schmees, C.; Volkmer, H.; et al. Key role of dual specificity kinase TTK in proliferation and survival of pancreatic cancer cells. Br. J. Cancer 2014, 111, 1780–1787. [Google Scholar] [CrossRef] [Green Version]
- Fang, Y.; Zhang, X. Targeting NEK2 as a promising therapeutic approach for cancer treatment. Cell Cycle 2016, 15, 895–907. [Google Scholar] [CrossRef] [Green Version]
- Xu, W.; Wang, Y.; Wang, Y.; Lv, S.; Xu, X.; Dong, X. Screening of differentially expressed genes and identification of NUF2 as a prognostic marker in breast cancer. Int. J. Mol. Med. 2019, 44, 390–404. [Google Scholar] [CrossRef] [Green Version]


| KIRC () | ||
|---|---|---|
| Age | 60.57 ± 12.15 | |
| Status | 0 | 360 (67%) |
| 1 | 177 (33%) | |
| Stage | I | 269 (50%) |
| II | 57 (11%) | |
| III | 125 (23%) | |
| IV | 84 (16%) | |
| T-stage | I | 275 (51%) |
| II | 69 (13%) | |
| III | 182 (34%) | |
| IV | 11 (2%) | |
| N-stage | 0 | 240 (45%) |
| 1 | 17 (3%) | |
| x | 280 (52%) | |
| M-stage | 0 | 426 (79%) |
| 1 | 79 (15%) | |
| x | 30 (6%) | |
| Sex | Female | 191 (36%) |
| Male | 346 (64%) | |
| Race | Caucasian | 466 (87%) |
| African American | 56 (10%) | |
| Asian | 8 (2%) | |
| NA | 7 (1%) | |
| 0.3 | 0.2 | 0.1 | 0.05 | |||||
|---|---|---|---|---|---|---|---|---|
| p-Value | # Genes | p-Value | # Genes | p-Value | # Genes | p-Value | # Genes | |
| EN | 1.11 × 10⁻¹⁸ | 30 | 1.22 × 10⁻¹⁷ | 48 | 0 | 90 | 1.43 × 10⁻¹⁶ | 162 |
| TCox | 1.02 × 10⁻¹⁵ | 18 | 1.77 × 10⁻¹⁵ | 28 | 8.98 × 10⁻¹⁶ | 51 | 1.86 × 10⁻¹⁵ | 87 |
| Genes | LogFC | FDR |
|---|---|---|
| MFSD4 | −5.34 | 1.96 × 10−235 |
| UNCX | −6.42 | 2.46 × 10−225 |
| SEMG2 | −7.10 | 1.40 × 10−195 |
| RBP2 | −6.08 | 1.79 × 10−183 |
| GADL1 | −6.83 | 9.19 × 10−179 |
| LOC340094 | −5.68 | 1.23 × 10−173 |
| ELF5 | −8.18 | 6.98 × 10−173 |
| SIM2 | −4.52 | 9.04 × 10−171 |
| LOC284578 | −6.88 | 1.07 × 10−170 |
| HCRTR2 | −5.41 | 4.48 × 10−169 |
| Genes | LogFC | FDR |
|---|---|---|
| SPANXB2 | −5.70 | 2.27 × 10−84 |
| GABRA3 | −4.68 | 4.58 × 10−67 |
| MAGEC2 | −5.88 | 8.13 × 10−57 |
| SPATS1 | −4.41 | 7.53 × 10−50 |
| EPYC | −4.09 | 6.73 × 10−49 |
| RDH8 | −4.20 | 6.43 × 10−46 |
| CSMD3 | −3.78 | 9.30 × 10−42 |
| BAAT | −4.42 | 4.79 × 10−39 |
| TMEM158 | −2.46 | 3.31 × 10−38 |
| ANKFN1 | −3.35 | 2.34 × 10⁻³³ |
| Genes | % | DEGs Tumor Tissue | DEGs in Advanced Stage |
|---|---|---|---|
| COPS7B | 100 | ↑ | ↑ |
| DONSON | 100 | ↑ | ↑ |
| LOC100272146 | 100 | ↑ | – |
| CCNF | 99 | ↑ | ↑ |
| CKAP4 | 99 | ↑ | ↑ |
| NCKAP5L | 99 | ↑ | ↑ |
| SEC61A2 | 99 | – | ↑ |
| SNRPA1 | 99 | ↑ | ↑ |
| STAT2 | 99 | ↑ | ↑ |
| STRADA | 99 | ↓ | ↑ |
| NUMBL | 98 | ↑ | ↑ |
| SORBS2 | 98 | ↑ | ↓ |
| CHFR | 97 | ↑ | ↑ |
| GIPC2 | 96 | ↑ | ↓ |
| MBOAT7 | 96 | – | ↑ |
| AR | 95 | – | ↓ |
| GTPBP2 | 95 | ↑ | ↑ |
| KIF20A | 95 | ↑ | ↑ |
| NARF | 95 | ↑ | ↑ |
| FAM72B | 94 | ↑ | ↑ |
| Genes | % | DEGs Tumor Tissue | DEGs in Advanced Stage |
|---|---|---|---|
| GTF2E2 | 100 | ↑ | ↑ |
| HAUS8 | 100 | ↑ | ↑ |
| PRH2 | 100 | ↑ | ↑ |
| SEC61A2 | 100 | – | ↑ |
| ZNF18 | 100 | ↑ | ↓ |
| C20orf72 | 99 | ↑ | ↑ |
| DONSON | 99 | ↑ | ↑ |
| LOC286467 | 99 | ↑ | ↑ |
| PRH1 | 99 | ↑ | – |
| TFAP2E | 99 | ↑ | ↑ |
| TMEM86B | 99 | ↑ | – |
| TRAIP | 99 | ↑ | ↑ |
| DNAJC2 | 96 | ↑ | ↑ |
| SLC26A6 | 96 | ↓ | ↑ |
| SNRPA1 | 96 | ↑ | ↑ |
| SORBS2 | 96 | ↑ | ↓ |
| TCTE3 | 96 | ↑ | ↑ |
| TMEM150C | 96 | ↓ | ↓ |
| C12orf32 | 94 | ↑ | ↑ |
| C8orf44 | 94 | – | – |
| GO | GS1 | GS2 | GS3 | GS4 |
|---|---|---|---|---|
| BP | PAEP, ORM1, SAA1, LBP, AQP2, CALB1, NPHS1/2 | TAT, CRABP1, APOA1/5, APOC3, UGT2B4, SULT2A1, ADH4, ANKFN1 | SMC4, KIF, NEK2, PLK1, TTK, NUF2 | NUF2, TRIP13, TTK, PRC1, KIF, NDC80, NEK2, PSRC1, AURKA, FBX |
| MF | AQP2, SLC12A1, ATP12A | APOA1/2, SLC12A3, AQP6 | KIF, PLK1, PRC1, MX2, GTSE1, RGP1, TPX2 | NAV3, HAUS8, IFNB1, CCL8, GTSE1, PSRC1, FNTA |
| CC | MUC17, SLC14A1/2, ATP12A, UMOD, AQP2 | AHSG, TTR, HRG, ALB, AQP6, LRRTM2 | NEK2, NUF2, TTK, PLK1, CENPF KIF | NCAPG, NEK2, TTK, OIP5, NUF2, PLK1, NDC80 |
| Genes | Full Dataset | Early Stage | Advanced Stage | |||
|---|---|---|---|---|---|---|
| HR | HR | HR | ||||
| COPS7B | 0.0930 | 1.10 | 0.0686 | 1.07 | 0.0539 | 1.06 |
| DONSON | 0.0840 | 1.09 | 0.0753 | 1.08 | 0.0557 | 1.06 |
| SEC61A2 | 0.0731 | 1.09 | 0.0728 | 1.08 | 0.0552 | 1.06 |
| SNRPA1 | 0.0481 | 1.08 | 0.0316 | 1.03 | 0.0226 | 1.02 |
| SORBS2 | −0.0977 | 0.91 | −0.0688 | 0.93 | −0.0616 | 0.94 |
| GTF2E2 | 0.0687 | 1.07 | 0.0428 | 1.04 | 0.0271 | 1.03 |
| HAUS8 | 0.0313 | 1.03 | 0.0240 | 1.02 | 0.0228 | 1.02 |
| PRH2 | 0.0647 | 1.07 | 0.0734 | 1.08 | 0.0363 | 1.04 |
| ZNF18 | 0.0427 | 1.04 | 0.0552 | 1.06 | 0.0251 | 1.03 |
| FBXO5 | 0.0227 | 1.02 | −0.0151 | 0.99 | 0.0258 | 1.03 |
| SMC4 | 0.0544 | 1.06 | 0.0097 | 1.01 | 0.0491 | 1.05 |
| PRC1 | 0.0053 | 1.01 | 0.0101 | 1.01 | 0.0210 | 1.02 |
| SLC34A1 | −0.0335 | 0.97 | −0.0213 | 0.98 | −0.0335 | 0.97 |
| SLC12A3 | −0.0166 | 0.98 | −0.0111 | 0.99 | −0.0115 | 0.99 |
| KIFC1 | −0.0045 | 1.00 | −0.0082 | 0.99 | 0.0276 | 1.03 |
| KIF18A | 0.0187 | 1.02 | 0.0080 | 1.01 | 0.0445 | 1.05 |
| KIF23 | 0.0121 | 1.01 | 0.0101 | 1.01 | 0.0315 | 1.03 |
| TPX2 | −0.0029 | 1.00 | −0.0045 | 1.00 | 0.0415 | 1.04 |
| GTSE1 | 0.0208 | 1.02 | 0.0063 | 1.01 | 0.0278 | 1.03 |
| SLC14A2 | 0.0135 | 1.01 | −0.0173 | 0.98 | 0.0381 | 1.04 |
| AQP2 | −0.0058 | 0.99 | −0.0015 | 1.00 | 0.0090 | 1.01 |
| TTK | 0.0213 | 1.02 | 0.0046 | 1.00 | 0.0302 | 1.03 |
| NEK2 | 0.0356 | 1.04 | 0.0392 | 1.04 | 0.0334 | 1.03 |
| NUF2 | 0.0345 | 1.04 | 0.0263 | 1.03 | 0.0346 | 1.04 |
| Genes | Full Dataset | Early Stage | Advanced Stage | |||
|---|---|---|---|---|---|---|
| HR | HR | HR | ||||
| DONSON | 0.1946 | 1.21 | 0.1920 | 1.21 | 0.2365 | 1.27 |
| SEC61A2 | 0.1728 | 1.19 | 0.1857 | 1.20 | 0.2226 | 1.25 |
| SNRPA1 | 0.1371 | 1.15 | 0.0857 | 1.09 | 0.0421 | 1.04 |
| SORBS2 | −0.2417 | 0.79 | −0.1781 | 0.84 | −0.2341 | 0.79 |
Publisher’s Note: MDPI stays neutral with regard to jurisdictional claims in published maps and institutional affiliations. |
© 2022 by the authors. Licensee MDPI, Basel, Switzerland. This article is an open access article distributed under the terms and conditions of the Creative Commons Attribution (CC BY) license (https://creativecommons.org/licenses/by/4.0/).
Share and Cite
Peixoto, C.; Martins, M.; Costa, L.; Vinga, S. Kidney Cancer Biomarker Selection Using Regularized Survival Models. Cells 2022, 11, 2311. https://doi.org/10.3390/cells11152311
Peixoto C, Martins M, Costa L, Vinga S. Kidney Cancer Biomarker Selection Using Regularized Survival Models. Cells. 2022; 11(15):2311. https://doi.org/10.3390/cells11152311
Chicago/Turabian StylePeixoto, Carolina, Marta Martins, Luís Costa, and Susana Vinga. 2022. "Kidney Cancer Biomarker Selection Using Regularized Survival Models" Cells 11, no. 15: 2311. https://doi.org/10.3390/cells11152311
APA StylePeixoto, C., Martins, M., Costa, L., & Vinga, S. (2022). Kidney Cancer Biomarker Selection Using Regularized Survival Models. Cells, 11(15), 2311. https://doi.org/10.3390/cells11152311