Article

Substrate- and Calcium-Dependent Differential Regulation of Mitochondrial Oxidative Phosphorylation and Energy Production in the Heart and Kidney

1
Department of Biomedical Engineering, Medical College of Wisconsin, Milwaukee, WI 53226, USA
2
Department of Biomedical Engineering, Marquette University, Milwaukee, WI 53223, USA
3
Center of Systems Molecular Medicine, Medical College of Wisconsin, Milwaukee, WI 53226, USA
4
Department of Physiology, Medical College of Wisconsin, Milwaukee, WI 53226, USA
*
Authors to whom correspondence should be addressed.
These authors contributed equally to this work as first authors.
These authors contributed equally to this work as senior authors.
Cells 2022, 11(1), 131; https://doi.org/10.3390/cells11010131
Submission received: 10 December 2021 / Revised: 26 December 2021 / Accepted: 28 December 2021 / Published: 31 December 2021
(This article belongs to the Special Issue Mitochondrial Dysfunction in Cardiovascular Disease)

Abstract

:
Mitochondrial dehydrogenases are differentially stimulated by Ca2+. Ca2+ has also diverse regulatory effects on mitochondrial transporters and other enzymes. However, the consequences of these regulatory effects on mitochondrial oxidative phosphorylation (OxPhos) and ATP production, and the dependencies of these consequences on respiratory substrates, have not been investigated between the kidney and heart despite the fact that kidney energy requirements are second only to those of the heart. Our objective was, therefore, to elucidate these relationships in isolated mitochondria from the kidney outer medulla (OM) and heart. ADP-induced mitochondrial respiration was measured at different CaCl2 concentrations in the presence of various respiratory substrates, including pyruvate + malate (PM), glutamate + malate (GM), alpha-ketoglutarate + malate (AM), palmitoyl-carnitine + malate (PCM), and succinate + rotenone (SUC + ROT). The results showed that, in both heart and OM mitochondria, and for most complex I substrates, Ca2+ effects are biphasic: small increases in Ca2+ concentration stimulated, while large increases inhibited mitochondrial respiration. Furthermore, significant differences in substrate- and Ca2+-dependent O2 utilization towards ATP production between heart and OM mitochondria were observed. With PM and PCM substrates, Ca2+ showed more prominent stimulatory effects in OM than in heart mitochondria, while with GM and AM substrates, Ca2+ had similar biphasic regulatory effects in both OM and heart mitochondria. In contrast, with complex II substrate SUC + ROT, only inhibitory effects on mitochondrial respiration was observed in both the heart and the OM. We conclude that the regulatory effects of Ca2+ on mitochondrial OxPhos and ATP synthesis are biphasic, substrate-dependent, and tissue-specific.

1. Introduction

Understanding the molecular basis of how metabolic abnormalities lead to heart and kidney failure is of fundamental importance to advance our understanding of how metabolic regulators may improve the organ’s functions and lessen mortality in disease states such as hypertension [1,2,3,4]. In eukaryotic cells, most of the energy is produced in the form of ATP by mitochondria via oxidative phosphorylation (OxPhos) [5]. Mitochondria also perform many other vital functions, including cation handling and signaling required for maintaining cellular homeostasis [6,7,8,9]. Mitochondrial ATP synthesis is regulated most notably by the availability of ADP and inorganic phosphate (Pi) [10,11,12,13] and by the availability of substrates [14,15,16]. The latter are required for the optimal functioning of various mitochondrial dehydrogenase (DH) enzymes [17]. These include pyruvate dehydrogenase (PDH), isocitrate dehydrogenase (ICDH), 2-oxoglutarate dehydrogenase (OGDH), and malate dehydrogenase (MDH), which oxidize substrates by transferring protons (H+) from organic compounds to an electron acceptor that, in mammals, is either the co-enzyme NAD+ (forming NADH) or a flavin co-enzyme (forming FADH2) [18]. The activities of these DH enzymes within the tricarboxylic acid (TCA) cycle are known to be differentially regulated via changes in intra-mitochondrial-free calcium (Ca2+) concentration [19,20,21,22,23,24,25]. Furthermore, Ca2+ is known to have diverse regulatory effects on other mitochondrial transporters and enzymes, including substrate and cation transporters and respiratory complexes [26,27,28]. It is, however, uncertain as to what extent increases in intra-mitochondrial-free Ca2+ concentration ([Ca2+]m)—which occur in parallel with increases in cytosolic-free Ca2+ concentration ([Ca2+]c) [29,30,31]—stimulate the Krebs cycle DH enzymes in situ of key organs such as the kidney and heart, enhancing ATP production during increased workloads and ATP demands, and in response to the availability of different substrates.
It is well known that Ca2+ plays a major role in cellular signaling and regulation of mitochondrial function by boosting the production of NADH and FADH2 through enhancements in the activities of several mitochondrial substrate transporters and DH enzymes, thereby enhancing mitochondrial respiratory chain activity with a subsequent increase in H+ pumping, proton motive force generation, O2 consumption, and ATP synthesis [6,32,33,34,35,36]. However, how different respiratory substrates differentially regulate this Ca2+-dependent regulation of mitochondrial respiration and ATP synthesis (OxPhos activity) in different tissues having different substrate preferences, such as the heart and kidneys, is not well-understood. In addition, the accumulation of Ca2+ within the mitochondrial matrix is known to have detrimental effects on mitochondrial function, specifically OxPhos [6,7,8,9]. Despite the importance of Ca2+ in the regulation of mitochondrial respiration and ATP synthesis, it has not been systematically characterized in different tissues, which is the focus of the present study.
[Ca2+]m and [Ca2+]c are controlled by mitochondrial uptake and release of Ca2+ via Ca2+ channels and transporters present in the inner mitochondrial membrane (IMM) and by intra-mitochondrial Ca2+ sequestration [6,7,8,9,30,37,38,39,40,41]. Specifically, studies using isolated mitochondria have shown that mitochondrial Ca2+ uniporter (MCU) and Na+/Ca2+ exchanger (NCE) pathways and intra-mitochondrial Ca2+ sequestration by different Ca2+ buffering metabolites and proteins play important roles in Ca2+ signaling and [Ca2+]c and [Ca2+]m regulations [30,37,38,39,40,41,42], thereby regulating mitochondrial energy metabolism. Although the role of Ca2+ in excitation–contraction coupling and energy homeostasis in the heart and skeletal muscle has been well studied [32,33,34,35,36,43,44,45], little is known about the extent to which Ca2+ participates in kidney bioenergetic function despite having energy requirements second only to the heart [2,46,47,48].
The heart is a constantly active muscle and is the most energy-consuming organ in the human body, requiring high levels of mitochondrial OxPhos activity [49,50,51]. Its huge oxidative metabolism capacity enables up to a six-fold increase in cardiac output during increased workloads and ATP demands without requiring anaerobic metabolism. The kidneys are next to the heart in terms of mitochondrial content and O2 consumption at rest [2,46,47]. The kidneys, which have been found to have one of the highest specific metabolic rates among all organs [46,48], must generate enormous energy (ATP) for the reabsorption of great amounts of life-sustaining glomerular filtrates, including electrolytes and various nutrients required to maintain the balance of electrolytes and fluid within the body [1,46,52,53,54].
The impetus for the present study of kidney mitochondrial bioenergetics was the emerging evidence in human and animal models that renal metabolic abnormalities contribute to salt-sensitive hypertension [1,2]. The present study focuses on the kidney outer medulla (OM), which contains thick medullary ascending limbs (mTAL) of the loop of Henle which actively reabsorb ~25% of sodium filtered by the cortical glomeruli [46]. It is a region of the kidney known to be prone to injury in many disease states, such as hypertension [55]. Unlike the kidney cortex, which is overly perfused with blood to sustain high levels of glomerular filtration, blood flow to the kidney OM is quite low (~5–7% of cortical flow) and barely sufficient to supply the O2 needed for the transport loads of mTAL; hence, the kidney OM functions in a near-hypoxic state [56]. Blood flow to the vasa recta circulation of the renal medulla must be maintained at low levels to avoid the washout of interstitial osmolytes required to reabsorb water and concentrate the urine while balancing the metabolic needs of mTAL. The reduction of blood flow to the renal medulla is known to reduce its ability to excrete both sodium and water, which results in hypertension [1,57].
Given the contrasting functions of the heart and kidney OM, it is expected that these tissues may utilize different fuels to produce energy (ATP). In contrast to the heart, which largely metabolizes free fatty acids when normally perfused [58,59], the kidney OM is known to largely metabolize glucose via glycolysis-generating pyruvate to be utilized in the TCA cycle and the mitochondrial electron transport chain (ETC) for the production of ATP [1]. Beyond this general knowledge, however, the mitochondrial metabolic pathways and related bioenergetic functions have not been systematically studied in the kidney OM. The extent to which changes in [Ca2+]m play a role in the stimulation or inhibition of mitochondrial respiration and ATP synthesis in the kidney OM, compared to the heart, is largely unknown. Even in the heart and skeletal muscle, where Ca2+ stimulation of mitochondrial respiration and ATP synthesis are well-recognized at low levels of [Ca2+]m [23,60,61], consensus is lacking regarding the quantitative relevance and the sensitivity of the mitochondrial DH enzymes to changes in [Ca2+]m and the effect of such changes on mitochondrial respiration and ATP synthesis characterizing OxPhos activity [33]. This may be a consequence of differences in the selection of respiratory substrates used in these isolated mitochondria studies, and differences in the methods used to energize mitochondria or perturb [Ca2+]m [32,62,63,64].
The present study was carried out to determine the extent to which mitochondrial respiration and ATP synthesis (OxPhos activity) is substrate- and tissue-dependent, and to determine the extent to which Ca2+ can stimulate OxPhos in mitochondria isolated from the heart compared to that from the kidney OM of Sprague–Dawley (SD) rats. ADP-induced mitochondrial respiration was determined at different concentrations of CaCl2 in the presence of a variety of respiratory substrates. The results showed that mitochondrial respiration and ATP synthesis are dependent on both the respiratory substrates used and the concentration of CaCl2, and that this dependency is tissue-specific and biphasic with respect to the added [Ca2+]. These results strengthen our understanding of tissue-specific differences in mitochondrial bioenergetics and regulations, which, in turn, provide a basis for a deeper understanding of the roles of mitochondrial dysfunction in the pathogenesis of chronic diseases, such as hypertension. These results are also useful for building predictive mathematical models of mitochondrial bioenergetics and regulations in the heart and kidney, and to study the emergent properties of cardiac and renal metabolic systems.

2. Materials and Methods

The chemicals used in this study were purchased from Sigma–Aldrich (St. Louis, MO, USA) unless otherwise stated. Adult male Sprague–Dawley (SD) rats (8–9 weeks old; 300–350 gm weight) were purchased from Envigo (Madison, WI, USA) and were housed in our animal facilities for at least a week for acclimation to the new environment before being used in this study. Rats were housed in individual cages maintained at 21 ± 2 °C with a 12:12-h of light–dark cycle, and were given water and food ad libitum. The Medical College of Wisconsin (MCW) Institutional Animal Care and Use Committee (IACUC: AUA00000851) approved the animal use and the experimental protocols described below.

2.1. Mitochondrial Isolation

Mitochondria were freshly isolated from the ventricles of the heart and the OM of the kidneys of adult SD rats (8–9 weeks, 300–350 gm), as detailed in our recent study [65]. Following an intraperitoneal injection of pentobarbital to achieve a deep plane of anesthesia, the hearts and kidneys were excised, and the mitochondria were isolated, as briefly described below.

2.1.1. Heart Mitochondria

Cardiac mitochondria were isolated via the differential centrifugation method, as described previously [10,65,66,67]. Briefly, the ventricles of the heart were isolated and immediately placed in ice-cold isolation buffer (IB) containing 200 mM mannitol, 50 mM sucrose, 5 mM KH2PO4, 5 mM MOPS, 1 mM EGTA, and 0.1% BSA, with the pH adjusted to 7.15 with KOH. They were then minced, 2.5 mL of a 5 U/mL protease solution was added, and they were then homogenized for 40 s. The homogenate was first centrifuged twice at 8000× g for 10 min at 4 °C to remove the protease. The supernatant was then discarded, and the pellet was re-suspended in the IB to 25 mL and centrifuged at 700× g for 10 min. Then, the mitochondria-enriched supernatant was centrifuged at 8000× g for 10 min. The resulting mitochondrial-enriched pellet was re-suspended in IB and kept on ice. The mitochondrial protein content was measured using BSA as the standard with Biorad Quick Start Bradford Assay Kit (Biorad, Hercules, CA, USA). Depending on the protein content, the suspended pellet volume was adjusted to have a protein concentration of 12.5 mg protein/mL to allow comparison across groups or conditions without the confounding influence of differences in the concentration of mitochondria loaded into the chamber.

2.1.2. Kidney Outer Medulla (OM) Mitochondria

Renal OM mitochondria were isolated through the differential centrifugation method with a slight modification from that for the cardiac mitochondria [65]. Briefly, OM were dissected from both kidneys, weighed, and minced in the 4 °C IB. The volume was adjusted to a total of 15 mL with IB and centrifuged at 600× g at 4 °C for 10 min, and the remaining supernatant was centrifuged at 12,000× g for 15 min. The resulting pellet was mixed well in IB and the volume adjusted up to 15 mL. This suspension was centrifuged again for a third time at 12,000× g for 15 min, and the final mitochondrial pellet was then transferred to a dark Eppendorf tube, and placed on ice to determine protein content, as described above, to enable adjustments of the final suspension volume to attain a protein concentration of 12.5 mg protein/mL IB.

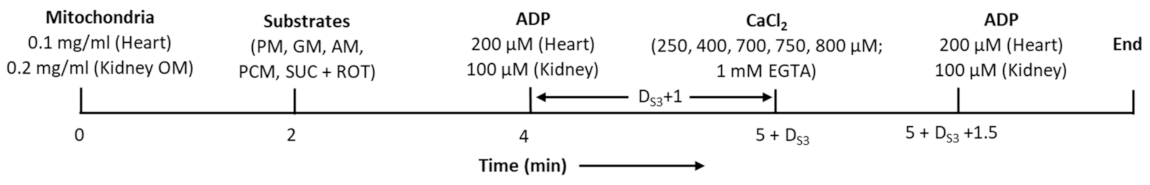
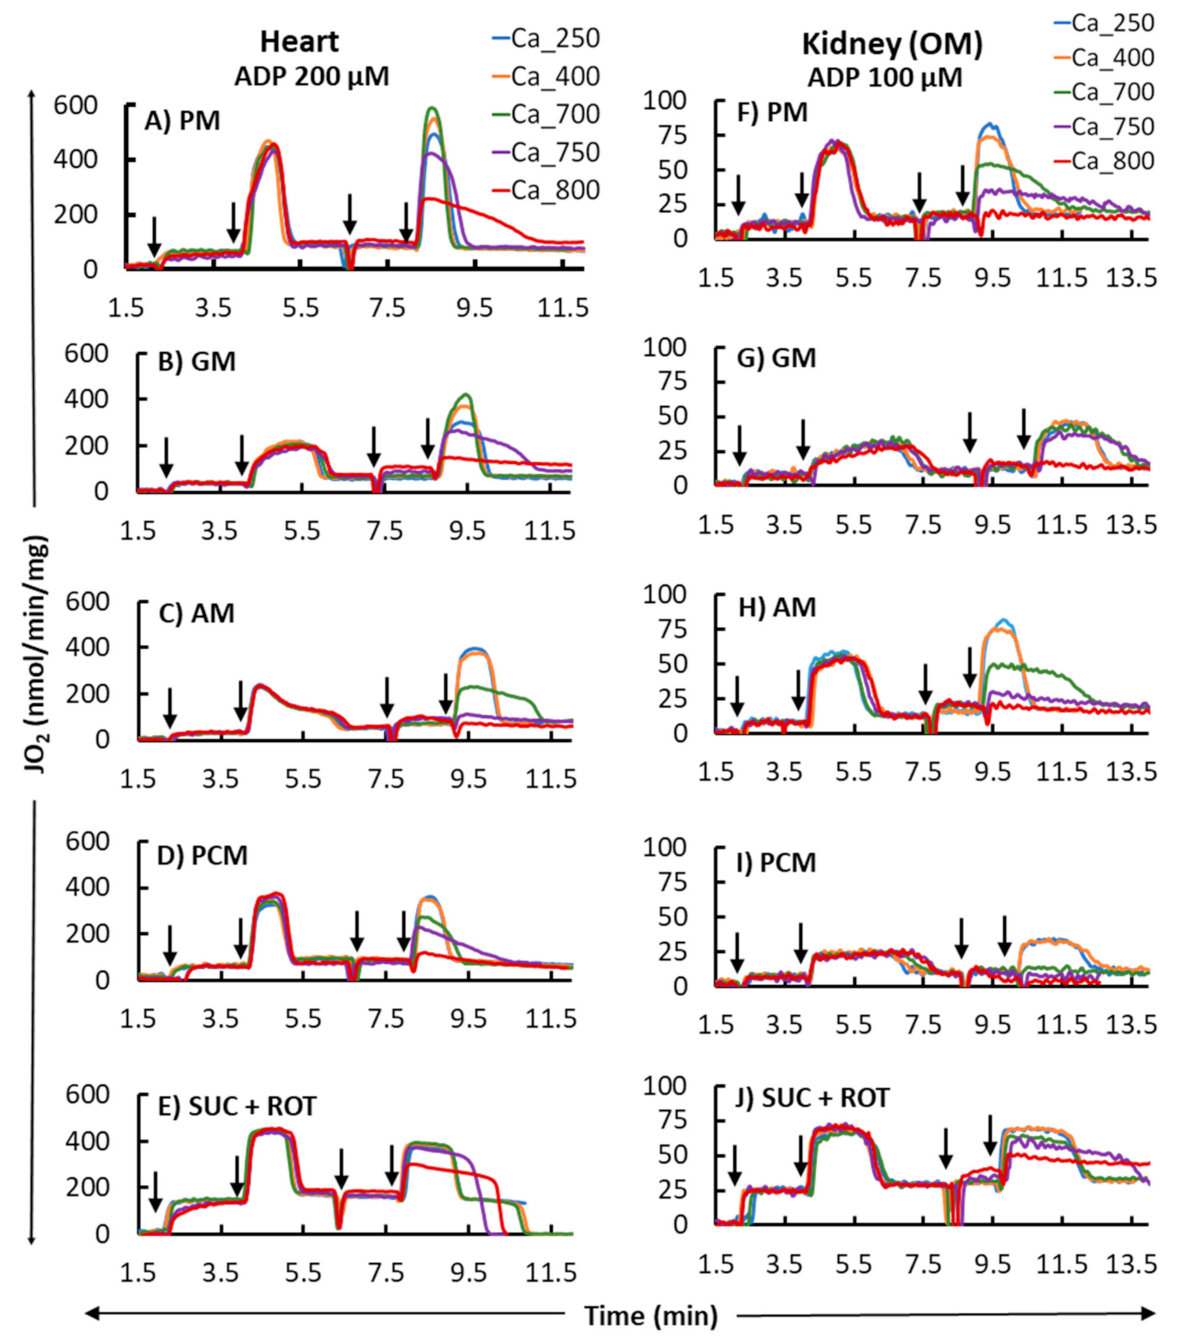
2.2. Mitochondrial O2 Consumption Measurement

Mitochondrial O2 consumption (respiration) was measured using an Oxygraph-2k (O2k) high-resolution respirometer (Oroboros Instruments, Innsbruck, Austria) with its DatLab 7 software used for data acquisition and analysis. Figure 1 shows the timeline of the experimental protocol for the respiration measurements for all reported studies. Before each experiment, O2 concentration in the KCl-enriched respiration buffer (RB) was equilibrated for more than 10 min with the air within the O2k chambers at 37 °C, until a steady stable signal was obtained at an O2 concentration of ~205 μM. The experiments were initiated at time t = 0 min with isolated mitochondria (0.1 mg protein/mL for heart and 0.2 mg protein/mL for kidney OM) suspended at 37 °C in 2 mL of RB containing (in mM) 130 KCl, 5 K2HPO4, 20 MOPS, 1 EGTA, and 0.1% BSA, at pH 7.2 adjusted with KOH. The mitochondrial suspension in the RB was continuously stirred (750 rpm) inside the O2k chambers, and chemicals were added to the chamber through the titanium injection port of the stoppers using Hamilton syringes.
In the first set of experiments, state 2 respiration was initiated with the complex I substrates pyruvate + malate at saturating concentrations (PM; 5 + 2.5 mM) at time t = 2 min. State 3 respiration was measured by adding 500 and 250 μM ADP for heart and kidney OM mitochondria, respectively, at time t = 4 min, and state 4 respiration was measured after phosphorylation of the added ADP to ATP. The functional integrity and intactness of isolated mitochondria on a given experimental day was determined using respiratory control ratio (RCR), defined as the ratio of maximum O2 consumption measured after the addition of ADP (state 3) to the state 2 O2 consumption (i.e., steady O2 consumption after addition of the substrate PM to the O2k chamber containing the mitochondria).
In the second set of experiments, the time-courses of states 2, 3, and 4 respiration were monitored by adding a variety of respiratory substrates (Table 1) to isolated mitochondria (0.1 mg protein/mL for heart and 0.2 mg protein/mL for kidney OM) [65], including pyruvate + malate (PM; 5:2.5 mM), glutamate + malate (GM; 5:2.5 mM), alpha-ketoglutarate + malate (AM; 5:2.5 mM), palmitoyl-l-carnitine + malate (PCM; 0.025:2.5 mM), and succinate + rotenone (SUC + ROT; 10 mM + 1 μM) at time t = 2 min, and ADP (200 and 100 μM for heart and kidney OM mitochondria; respectively) at time t = 4 min, which initiates state 3 respiration proceeding to state 4 respiration after the conversion of the added ADP to ATP. To assess the effect of Ca2+ on mitochondrial O2 consumption, various concentrations of Ca2+ (250, 400, 700, 750, or 800 μM of CaCl2 in the presence of the Ca2+ chelator EGTA at 1 mM; negligible changes in total Cl concentration of 130 mM) were added a minute after state 4 was reached. This was followed by the addition of ADP at the above concentration. O2 consumption rates (OCR; JO2) during different states of respiration were computed as the negative time derivative of O2 concentration measured in the closed O2k chambers and expressed as nmol of O2/min/mg of mitochondrial protein. Data were acquired at every 1 s, and 5 data point averages were made to compute the slope of the O2 concentration data using the DatLab 7 software version 7.4.0.4. The unique timeline protocol of Figure 1 enabled us to study both the effects of various respiratory substrates and a range of CaCl2 concentrations on mitochondrial respiration and ATP synthesis characterizing OxPhos activity.

2.3. Control of Extra-Mitochondrial free Ca2+ Concentrations

Free Ca2+ concentration ([Ca2+]free) in RB was controlled with 1 mM EGTA. The addition of the buffer components did not alter the total Ca2+ concentration ([Ca2+]total) added to the buffer to achieve the desired [Ca2+]free. For a given [Ca2+]total, [Ca2+]free was calculated using the Ca-EGTA online calculator v1.3, along with constants from Schoenmakers’s Chelator from Fheuvenet et al. [68] for 1 mM EGTA and other experimental buffer constituents (ionic strength 0.17, pH 7.2, temperature 37 °C). The correspondence between [Ca2+]total and [Ca2+]free is given in Table 2, which is 0 µM ↔ 0 nM, 250 µM ↔ 100 nM, 400 µM ↔ 200 nM, 700 µM ↔ 750 nM, 750 µM ↔ 900 nM, and 800 µM ↔ 1.2 µM. The calculated [Ca2+]free values are subjected to 5% uncertainty, due to a 1% uncertainty in the stability constants, or 0.01 pH unit uncertainty in the measured pH.

2.4. Data Analysis and Statistics
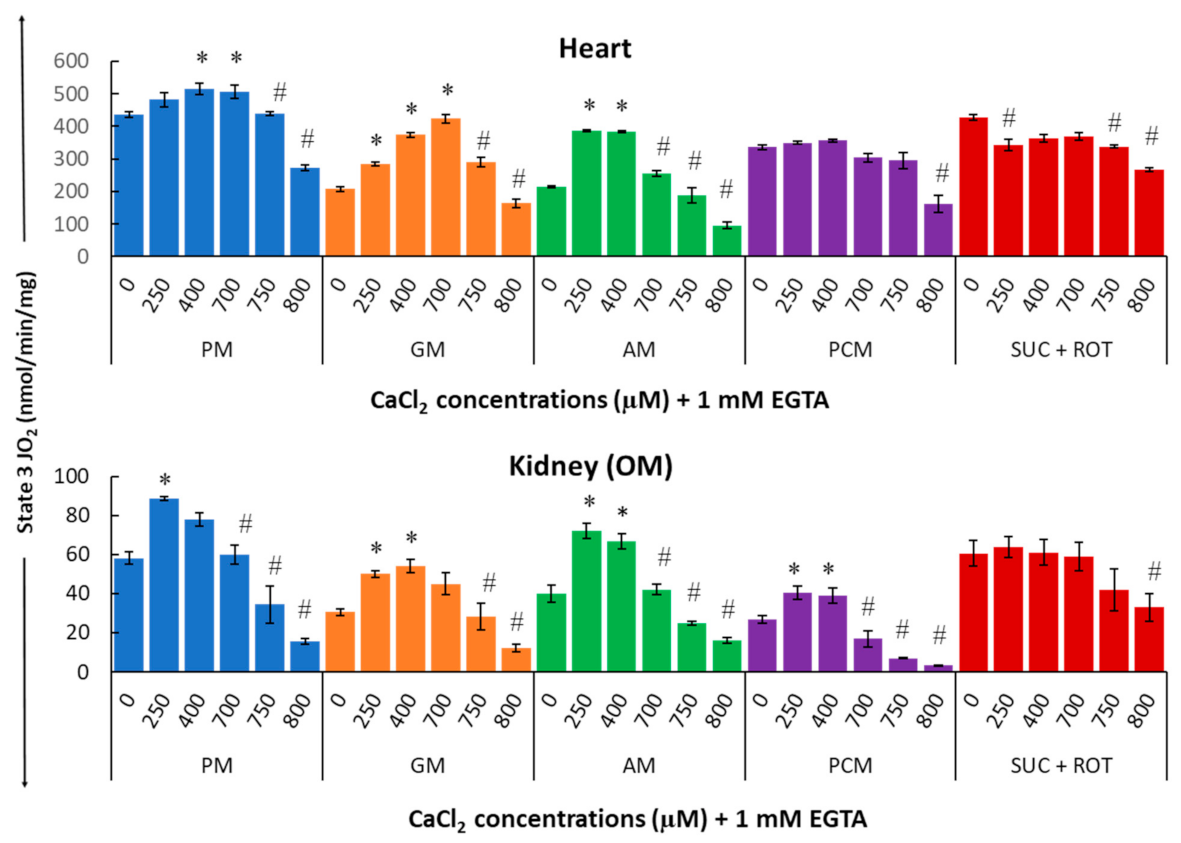
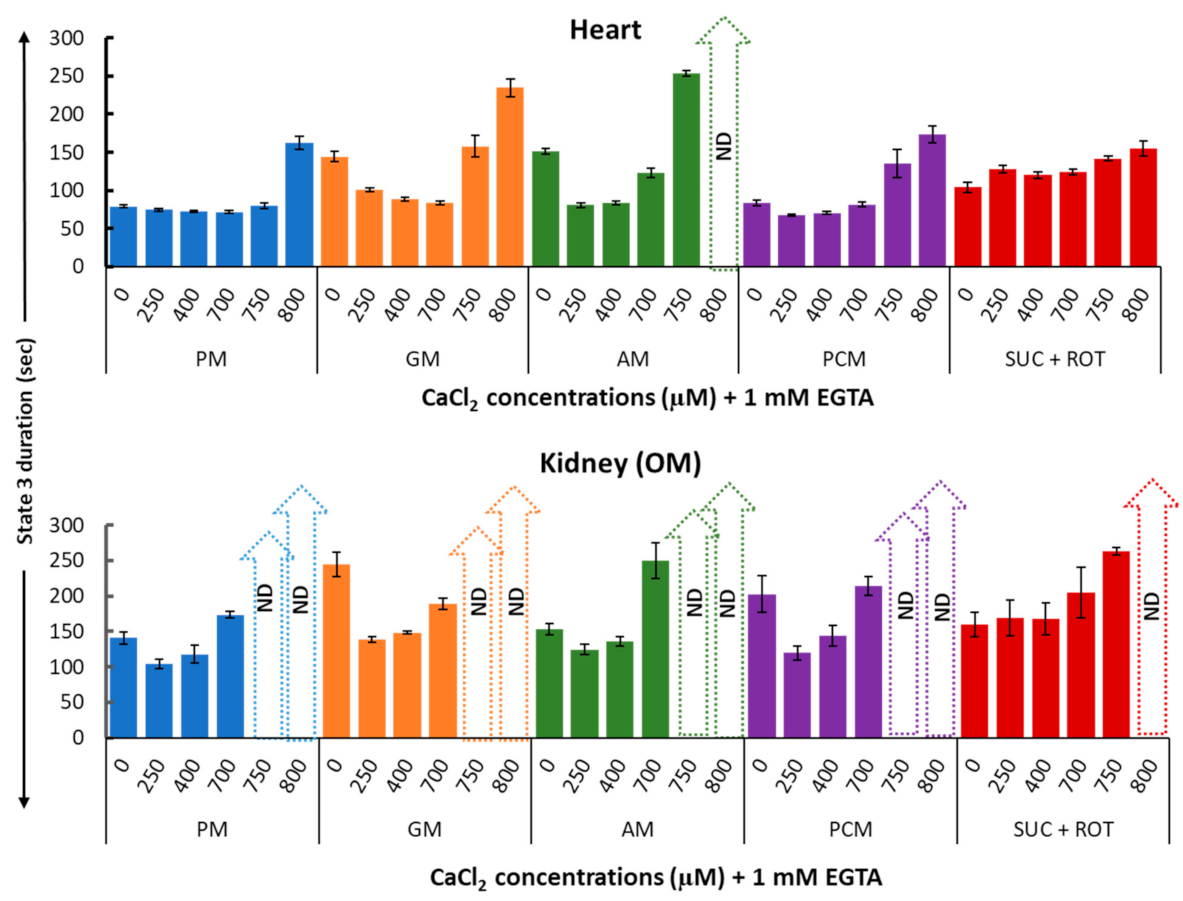
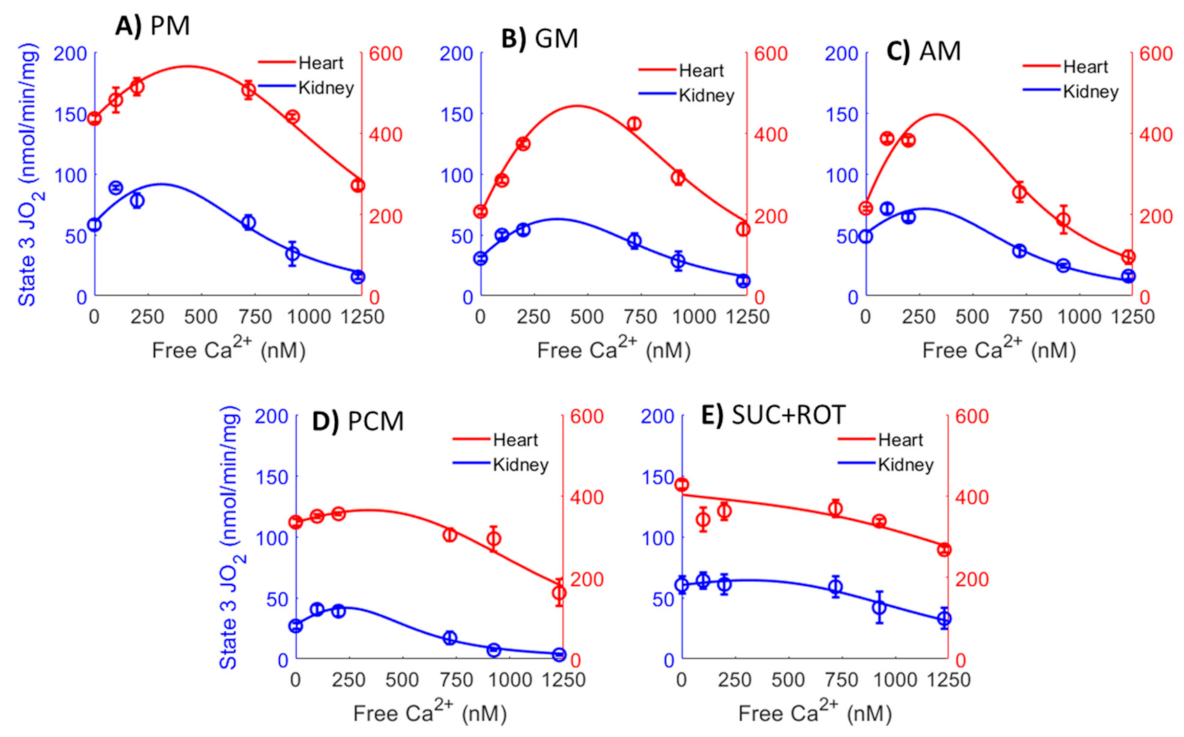
All data were analyzed using computer programs written in MATLAB that access the raw data of specific variables from the Excel® spreadsheets of day-to-day experiments generated from the Datlab software. The programs performed the required calculations to calibrate absolute values and changes in variables from one state to another, including statistical analyses (i.e., computations of mean, standard deviation, and standard error of a particular variable over multiple-day experiments). The final data of a particular variable were expressed as mean ± standard error (SE) over at least 3 biological replicates of the same variable (n > 3), each measured with two technical replicates. Comparisons within and between groups were performed by ANOVA (analysis of variance) with Tukey’s post hoc test for significance of means.
To characterize the biphasic behavior of the relationship between mitochondrial O2 consumption rates (OCR; JO2) and free Ca2+ concentration ([Ca2+]free), the following empirical Equation (1) was applied to describe the state 3 JO2 − [Ca2+]free relationship:
JO 2 = V 0 + V max - V 0 Ca 2 + free K Ca + Ca 2 + free K Ca nH K Ca nH + Ca 2 + free nH
where KCa is the apparent binding constant for Ca2+; V0 and Vmax are the basal and maximal state 3 respiratory rates, respectively; nH is the Hill coefficient for inhibitory term, which was set at an optimal value of 3 with several trials of the nonlinear regression fitting of the model to the data. The first term of this equation accounts for the stimulatory effect and the second term accounts for the inhibitory effect of Ca2+. V0 corresponds to state 3 JO2 when [Ca2+] is 0.
Experimental data for each group (5 substrates and 2 tissues) were separately fitted to the above kinetic model using the MATLAB curve-fit function “lsqcurvefit” to estimate the values of V0, Vmax, KCa, peak Ca2+-stimulated state 3 JO2, and [Ca2+]free, necessary to achieve the peak Ca2+ stimulated state 3 JO2. The resulting residuals and Jacobian matrix were fed to the MATLAB function “nlparci” to calculate the 95% confidence interval for each of the parameters in Equation (1).

3. Results

First, we determined the substrate-dependent respiratory rates under different states using isolated heart and kidney OM mitochondria. Five different substrate combinations were used in the study, namely, PM, GM, AM, PCM, and SUC + ROT. After that, we determined the extent and the nature of Ca2+ stimulation of mitochondrial respiration and ATP synthesis characterizing OxPhos activity in the heart and kidney OM and the extent of their dependency on the choice of substrates. The first step was to measure the respiratory control ratio (RCR; state 3/state 2 OCR) with the PM substrates with saturated ADP concentration (500 and 250 μM for the heart and kidney OM mitochondria, respectively) to ensure the functional integrity of the isolated mitochondria, which averaged 10.40 ± 0.24 for the heart and 8.54 ± 0.25 for the kidney OM.
Figure 2 shows the representative time courses of mitochondrial O2 consumption rates (respiration) for the heart and kidney OM for different substrates (PM, GM, AM, PCM, and SUC + ROT), based on the timeline experimental protocol of Figure 1. These data exemplify the dynamic profiles of: (1) tissue-specific differential effects of different substrates on mitochondrial respiration transitioning from state 2 to state 3 to state 4 respirations, and (2) tissue-specific and substrate-dependent differential effects of different [Ca2+] on mitochondrial OxPhos (ADP-induced state 3 respiration and ATP synthesis). Importantly, the analysis of mitochondrial respiration with the second dose of ADP demonstrates that the effect of Ca2+ on mitochondrial state 3 respiration and ATP synthesis (OxPhos activity) is biphasic in the presence of all substrates studied, except for SUC + ROT, with a stimulatory effect at lower [Ca2+] and inhibitory effect at higher [Ca2+]. This is characterized by increased peak state 3 respiration and decreased state 3 duration of ADP phosphorylation at low [Ca2+] and decreased peak state 3 respiration and increased state 3 duration of ADP phosphorylation at high [Ca2+]. Interestingly, for the SUC + ROT substrate in both the heart and kidney OM mitochondria, and for the PCM substrate in the kidney OM mitochondria, only an inhibitory effect of Ca2+ was observed for all concentrations of CaCl2 added to the mitochondrial suspension.
The bar plots in Figure 3 summarize respiration rates under different states and other relevant respiratory parameters derived from the respiratory responses of different substrates and the first dose of ADP (i.e., 200 and 100 μM for heart and kidney OM mitochondria, respectively) in Figure 2 (no Ca2+ addition). Figure 3A,B,F,G show that the extents of states 2 and 3 mitochondrial respiration are substrate-dependent in both heart and kidney OM mitochondria. The orders of substrate-dependent respiration rates are similar for both heart and kidney OM mitochondria, except for the fatty acid-based substrate PCM: the state 3 respiration rate is highest when using PM and SUC + ROT and lowest when using GM and AM as substrates. Interestingly, the state 3 respiration rate in heart mitochondria with PCM substrate was higher than that with GM and AM substrates, but the state 3 respiration in kidney OM mitochondria with PCM substrate was lower than that with GM and AM substrates. Overall, heart mitochondrial state 3 respiration rate is more than eight-fold higher than that of kidney OM mitochondria before the addition of Ca2+. Figure 3C,H show the time duration (sec) of state 3 respiration for heart and kidney OM mitochondria for a given ADP concentration. The state 3 respiration time duration was computed as the difference between the time when ADP was added to the isolated mitochondrial suspension and the time when all the added ADP was utilized by the mitochondria (start of state 4). The time duration of the state 3 respiration is usually inversely related to the state 3 respiration rate, i.e., when the state 3 respiration rate is higher, mitochondria would take less time to consume all the added ADP, and vice versa. The other derived respiratory parameters RCR (respiratory control ratio, defined as the ratio of state 3 to state 2 respiration rate) and PO ratio (defined as the ratio of amount of ADP consumed to amount of O2 consumed) are shown in Figure 3D,E,I,J. The RCR was slightly higher in heart mitochondria compared to kidney OM mitochondria for a given substrate. In addition, RCR with PM and AM substrates were significantly higher than those with other substrates in both heart and kidney OM mitochondria. The PO ratio was consistently lower than 3 with complex I substrates and approximately 1.5 with a complex II substrate (SUC + ROT).
Figure 4 shows a summary of the substrate-dependent Ca2+ effects on the heart (upper panel) and kidney OM (lower panel) mitochondrial state 2 respiration (leak respiration). Heart mitochondria exhibited no change in state 2 respiration at different concentrations of Ca2+ in the presence of PM substrates. In contrast, kidney OM mitochondria exhibited a progressive but not significant increase for added Ca2+ concentrations between 0 and 700 µM. Among the different substrate combinations studied, state 2 respiration rates with GM and AM substrates show small Ca2+-stimulated increases in both heart and kidney OM mitochondria over the range of the Ca2+ concentrations studied. This is consistent with the fact that these substrates are involved with Ca2+-sensitive metabolic pathways due to the higher activation of alpha-ketoglutarate dehydrogenation (AKGDH) compared to pyruvate dehydrogenase (PDH). The effects of Ca2+ concentration on state 2 respiration rates are relatively small in the presence of the substrate combinations PCM and SUC + ROT in both heart and kidney OM mitochondria, indicating that state 2 respiration is independent of Ca2+ in the presence of fatty acid-based or complex II-based substrates.
Figure 5 summarizes the substrate-dependent effects of different concentrations of Ca2+ on mitochondrial state 3 respiration in the heart (upper panel) and kidney OM (lower panel). Figure 5 shows that Ca2+ differentially regulates mitochondrial state 3 respiration and that this regulatory effect is both substrate-dependent and tissue-specific. In cardiac mitochondria with PM substrates, an ~18% increase in maximal state 3 respiration (JO2) was observed with 400 μM [Ca2+]total (i.e., 200 nM [Ca2+]free). For the same substrates, the effect of Ca2+ was significantly larger in kidney OM mitochondria, with an ~52% increase in maximal state 3 JO2 achieved with only 250 μM [Ca2+]total (i.e., 100 nM [Ca2+]free). Interestingly, with GM substrates, ~105% and ~77% increases in maximal state 3 JO2 were observed with 700 μM and 400 μM [Ca2+]total (i.e., 720 nM and 200 nM [Ca2+]free) for heart and kidney OM mitochondria, respectively. In contrast, with AM substrates, only 250 μM [Ca2+]total (i.e., 100 nM [Ca2+]free) was sufficient to stimulate ~80% increase in maximal state 3 JO2 in both heart and kidney OM mitochondria. The effect of Ca2+ on state 3 JO2 with PCM substrates was insignificant in cardiac mitochondria, but quite prominent (~51% increase) in kidney OM mitochondria. Finally, Figure 5 also shows that in both heart and kidney OM mitochondria, with SUC as the substrate in the presence of ROT, the addition of Ca2+ consistently resulted in an inhibitory effect on the state 3 respiratory rate.
Indeed, for all complex I substrates studied, (PM, GM, and AM), a biphasic relationship is observed in which a small increase in [Ca2+] has a stimulatory effect on state 3 respiration, whereas a large increase in [Ca2+] has an inhibitory effect. Moreover, the concentrations of Ca2+ necessary for this switching from the stimulatory to inhibitory effects are both substrate-dependent and organ-specific. For example, in the presence of PM substrates, state 3 respiration in heart mitochondria peaked at 400 µM [Ca2+]total, as compared to 250 µM [Ca2+]total in kidney OM mitochondria. When using PCM as a substrate combination, the addition of Ca2+ induced an increase in state 3 respiration in kidney OM mitochondria for concentrations between 0 and 400 μM. However, this effect was negligible in heart mitochondria. When using SUC as a substrate in the presence of ROT, the addition of Ca2+ induced a partial inhibition of state 3 respiration for most of the [Ca2+] studied in heart mitochondria, but only for the highest [Ca2+] studied in kidney OM mitochondria. Our results also show that, except for the substrate combination SUC + ROT, the effects of varying [Ca2+] on mitochondrial state 3 respiration and ATP synthesis are more prominent in kidney OM mitochondria than those in heart mitochondria.
Figure 6 summarizes the effects of Ca2+ on the respiratory control ratio (RCR; ratio of the state 3 to state 2 respiration rate) for different substrate combinations in isolated mitochondria from the heart (upper panel) and kidney OM (lower panel). The RCR data show a biphasic pattern similar to that for state 3 respiration (Figure 5) since the state 2 respiration was fairly constant (Figure 4).
Figure 7 provides a summary of the effects of varying [Ca2+] on the duration of mitochondrial state 3 JO2 (in seconds) in the presence of different substrate combinations for both heart (upper panel) and kidney OM (lower panel). These data suggest that small increases in [Ca2+] resulted in higher state 3 JO2 peaks and shorter state 3 durations, whereas large increases in [Ca2+] resulted in lower state 3 JO2 peaks and longer state 3 durations as compared to values with no [Ca2+] added. In general, the duration of state 3 JO2 is inversely proportional to peak state 3 JO2. This is due to the fact that if the respiration is slower, it would take more time for mitochondria to convert the added ADP to ATP. The white strips with upward arrows in Figure 7 highlight the values that are not quantitatively defined (ND) and cannot be calculated because higher concentrations of Ca2+ greatly inhibited state 3 JO2, preventing an accurate determination of the state 3 duration.
A detailed data analysis using nonlinear regression was performed to determine the relationships between [Ca2+]free and state 3 JO2 with different substrate combinations. The data in Figure 8 (circle with error bars) are the same as state 3 JO2 data in Figure 5, except that the total Ca2+concentrations ([Ca2+]total) was converted to the free Ca2+ concentration ([Ca2+]free) present in the extra-mitochondrial buffer space, based on the Ca2+ chelator calculator [68], as shown in Table 2. Solid lines are the nonlinear regression fits of Equation (1)’s solutions to the data. Nonlinear regression was performed as described in the Methods section. This nonlinear regression analysis enabled us to obtain more accurate estimates of the peak Ca2+-stimulated state 3 JO2 and [Ca2+]free required for achieving this peak Ca2+ stimulated state 3 JO2 for ATP synthesis than those inferred from the data in Figure 5. It is apparent from Figure 8 that the JO2 − [Ca2+]free curves for the heart and kidney OM mitochondria are almost the scaled versions of each other for all substrate combinations studied, except for the substrate combinations of GM and AM, where the heart mitochondria curve showed a steeper decline at higher [Ca2+]free. This indicates that heart mitochondria are more sensitive to Ca2+ inhibition when GM or AM are provided as substrate combinations.
The estimated parameter values, including V0, Vmax, apparent KCa, peak Ca2+ stimulated state 3 JO2, and [Ca2+]free, required to achieve this peak, along with the corresponding confidence intervals (represented as error bars) are shown in Figure 9. V0 values (state 3 JO2 at [Ca2+]free = 0) are highest for the substrate combinations SUC+ROT and PM for both heart and kidney OM mitochondria. In general, V0, Vmax, and peak Ca2+-stimulated state 3 JO2 values for heart mitochondria are several folds higher than those for kidney OM mitochondria. However, the apparent binding constants (KCa values; nM) and [Ca2+]free required for achieving the peak Ca2+ stimulated state 3 JO2 for mitochondria from heart and kidney OM are of the same order of magnitude.

4. Discussion

Mitochondrial metabolism is known to play an important role in many human disorders including heart failure, hypertension, diabetes, cancer, brain disorders, and many others [3,4,69]. It is remarkable that relatively few studies have focused on the role of renal mitochondrial metabolism despite the close link between renal tubular transport activities and the critical regulation of fluid and electrolyte homeostasis required for survival [1]. The mitochondrial bioenergetic system is a complex network that, within varying organs/tissues, is influenced by energetic needs, the source and availability of respiratory substrates for intermediate metabolism [53,64], unique transporters of these substrates [46,53], different expression and activity of enzymes, and variations in the key determinants of the activity of these enzymes such as Ca2+ and Mg2+ [21,24]. The bioenergetic aspects of mitochondrial functions have been challenging, and reports of studies even of the same organ, such as the heart, have been conflicting since many key factors that influence ATP production have not been consistently controlled or quantitatively accounted for in most studies [5,10,15,35,61,63]. In the present study, we demonstrated that different respiratory substrates resulted in dramatically different respiratory rates in the heart and kidney OM mitochondria, consistent with our recent study [65]. In addition, the effects of Ca2+ upon mitochondrial respiration and ATP production in the heart and kidney OM were distinctly dependent on the respiratory substrates [63]. The respiratory parameters of the heart and kidney OM mitochondria in our study were quantitatively determined under highly controlled conditions, with mitochondria respiring in the presence of different respiratory substrates. The effects of Ca2+ on the heart mitochondrial respiration and ATP production have been extensively studied [32,63,64], but little is known about the effects of Ca2+ on kidney mitochondrial bioenergetics and regulations. Although dietary Ca2+ is clearly important in a wide range of biological functions, the use of dietary Ca2+ supplements in heart and kidney diseases remains controversial. It is well known that kidney disease leads to increased production of the parathyroid hormone and a build-up of phosphate in the body which, in turn, binds to Ca2+ and leads to brittle bones [70]. This has led to widespread use of dietary Ca2+ supplements, which have been of questionable value in reducing the risk of osteoporosis and may lead to Ca2+-based plaque buildup [71]. Remarkably, the effects of dietary Ca2+ upon the efficiency of energy production in the heart and kidney are unknown.
Thus, in the present study, we specifically focused on investigating the extent to which Ca2+ can stimulate or inhibit OxPhos and ATP synthesis in mitochondria isolated from the heart compared to that from the kidney OM of the same animal, and how this regulatory effect is dependent on respiratory substrates. Mitochondria were isolated from the heart and kidney OM obtained from the same rat to control for environmental factors, diet, and age. As such, an important outcome of the present study is a novel set of data showing that Ca2+ regulation of mitochondrial respiration and ATP synthesis is biphasic in both the heart and OM mitochondria and that these effects are both substrate-dependent and tissue-specific.

4.1. Intermediate Metabolism and Energy Production: Unique Challenges Due to Different Energy Demands of the Heart and Kidneys

Although the functions of the heart and kidneys are uniquely different, both have enormous energy requirements and are subject to a broad range of stressors. In addition to differences in function, the heart and kidneys have different morphology, structure, and mitochondrial content [2,72,73]. Human kidneys have a metabolic rate estimated to be nearly 400 kcal/kg tissue, a rate similar to that for the resting heart [74]. With strenuous exercise, the human heart may increase its output and O2 consumption up to six-fold [58,75,76]. The kidneys of humans subjected to a high salt diet increase their energy usage for tubular reabsorptive activity by an estimated 50% (33.5 to 49.2 kcal/day). This is based on a known stoichiometry of 4.6 for renal transepithelial Na+ transport to ATP usage with an assumption of 7.3 kcal/mol for the free energy that is equivalent of ATP [77]. Intermediate metabolism and substrate utilization for the heart and kidneys are known to be different. Heart mitochondria utilize fatty acids as the primary fuel, producing 60–70% of the energy [58,59]. In contrast, the intermediate metabolism and preference of the substrates of the kidney greatly differ between the nephron segments of the cortex and medulla [1]. The proximal tubules (PT) of the cortex rely largely upon lipids, fatty acids, ketone bodies, lactate, and some amino acids. The thick medullary ascending limbs (mTAL) of the medulla utilize primarily glucose, succinate, or lactate [1], with only the glycolysis pathway used when needed to generate pyruvate [1].
The heart is challenged by rapid changes in energy demands from a resting to an exercise state, and the mitochondria of myocytes face great fluctuations of O2 consumption and ATP production [21,36,76]. The kidneys, although viewed as being more stable in metabolic demands, can also face large fluctuations in these demands when suddenly faced with a high workload imposed by a large salty meal of carbohydrates and proteins. Unlike the heart, the kidney can be thought of as two separately functioning organs with vastly different blood flows and metabolic demands. The kidney cortex receives a blood flow well in excess of its metabolic needs, which is necessary for the bulk filtration at glomeruli to remove the metabolic wastes. It is over-perfused for its normal metabolic needs, and its partial pressure tissue oxygen levels are ~50 mmHg. By contrast, the kidney OM is metabolically quite similar to the heart in that blood flow and oxygen levels are low (~10 to 15 mmHg) [78,79]. Yet, the metabolic needs of the mTAL, driven by the active reabsorption of ~25% of the total sodium filtered by the cortical glomeruli of the kidney, require sufficient O2 delivery and substrates to meet these demands. Similar to the heart, as mTAL of the kidney are faced with increased metabolic needs; greater blood flow is required to prevent a hypoxic state [1,79]. To elucidate the contributions of mitochondrial OxPhos towards ATP production and its regulation by Ca2+ to the tissue-specific physiology and energy needs of the heart and kidney OM, we performed a systematic investigation of the regulation of mitochondrial bioenergetics involving different respiratory substrates and different extra-mitochondrial [Ca2+]. These results further our understanding of tissue-specific differences in mitochondrial bioenergetics and regulations under physiological and pathophysiological conditions. These results are also useful for building predictive mathematical models of mitochondrial bioenergetics and regulations to investigate the emergent properties of cardiac and renal metabolic systems.

4.2. Substrate-Dependent Mitochondrial Respiratory Rates for the Heart and Kidney OM with Addition of a Fixed ADP Concentration

Heart and kidneys have different energy demands, and hence, their mitochondrial OxPhos capacities and efficiencies are expected to be different [80,81]. However, integrated quantitative studies have not been undertaken to shed light on the reasons for the differences in the OxPhos capacities and efficiencies of these organs and tissues. It is scientifically informative to determine the mitochondrial bioenergetics of the heart and kidneys using mitochondria isolated from the same animal [65]. In order to dissect the functionality of OxPhos, we employed different TCA cycle substrates, followed by the addition of a fixed ADP concentration, to isolate mitochondria from the heart and kidney OM. This protocol enabled us to determine and compare tissue- and substrate-specific respiratory states and rates with an identical stimulus. Figure 3 depicts the summary of the substrate- and tissue-specific comparisons of mitochondrial O2 consumption rates (JO2; OCR) for isolated heart and kidney OM mitochondria following the timeline protocol of Figure 1 with no CaCl2 addition. The OCR (states 2 and 3), state 3 durations (sec), RCR, and PO ratios were derived from the dynamic data shown in Figure 2 before the CaCl2 addition. The state 2 respiration was significantly higher in the presence of the FADH2-linked substrate SUC in the presence of ROT (SUC + ROT), in comparison to the NADH-linked substrates provided to heart and kidney OM mitochondria (Figure 3A,F). In contrast, state 3 respiration was highest in the presence of both PM and SUC + ROT in heart and kidney OM mitochondria (Figure 3B,G). GM is one substrate combination which resulted the lowest state 3 respiration and OxPhos efficiency for the heart and kidney OM mitochondria, and hence, the longest state 3 duration (Figure 3C,H). Moreover, heart mitochondria showed the highest RCR with PM substrates. RCR with SUC + ROT was the lowest for both heart and kidney OM mitochondria. The ratio of the added ADP concentration to the utilized O2 concentration in the chamber during the state 3 respiration is called the PO ratio for OxPhos. The PO ratios for the NADH-linked substrates averaged ~2.75, and that for the FADH2-linked substrates averaged ~1.5 for heart and kidney OM mitochondria, which is consistent with existing knowledge [65,82,83,84], validating the accuracy of the present studies.

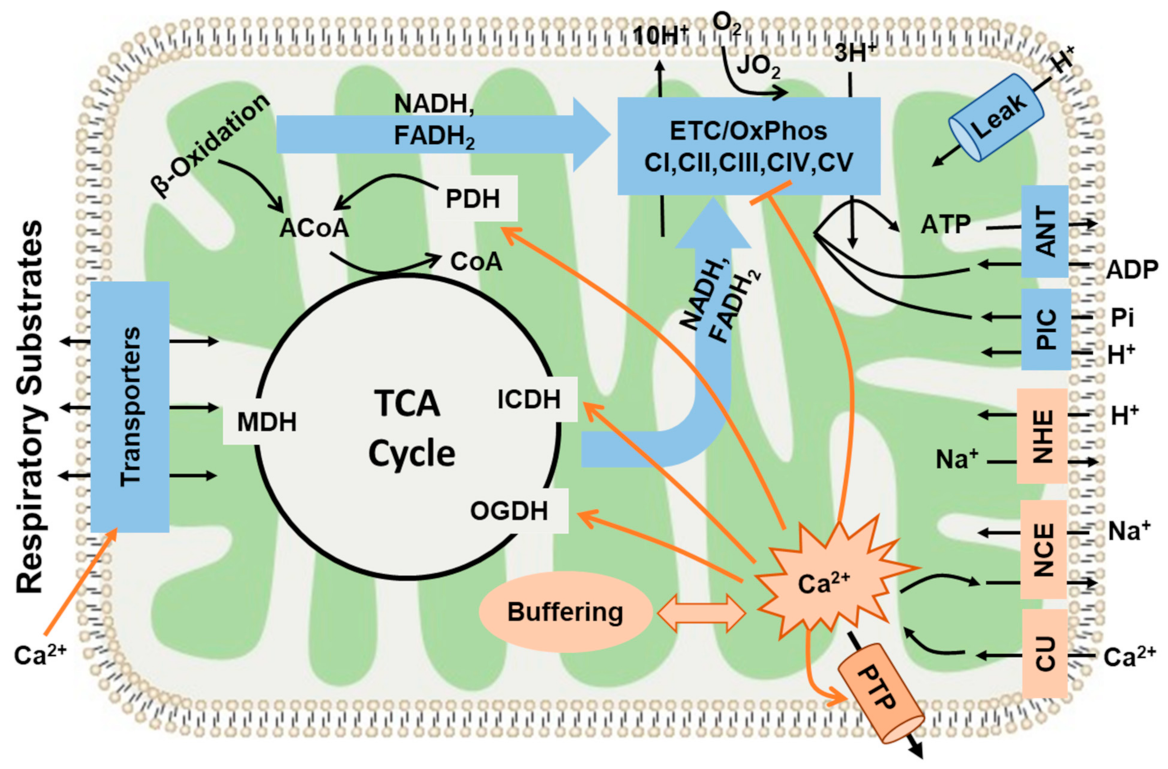
4.3. Current Understanding of Mitochondrial Ca2+ Regulation and Regulation of Mitochondrial Substrate Transport and Energy Metabolism by Ca2+

Since Ca2+ plays a major role in regulating mitochondrial OxPhos and ATP synthesis [26,60], it is therefore crucial to understand the major mechanisms that regulate mitochondrial Ca2+ concentration, [Ca2+]m. These include mitochondrial Ca2+ influx, efflux, and buffering mechanisms. Mitochondrial Ca2+ influx occurs through the electrophoretic Ca2+ uniporter (MCU), while Ca2+ efflux occurs through the Na+-dependent electrogenic 3Na+/Ca2+ exchanger (NCE) and/or Na+-independent electroneutral Ca2+/2H+ exchanger (CHE) at the inner mitochondrial membrane (IMM) [37,38,39,40,85,86]. In addition, the Ca2+ influx via MCU and the Ca2+ efflux via NCE in energized mitochondria are driven by membrane potential, (ΔΨm) and the Ca2+ influx via MCU is inhibited by cytosolic Mg2+ [30,37]. Furthermore, [Ca2+]m is controlled by complex mitochondrial Ca2+ buffering mechanisms [28]. To maintain steady-state [Ca2+]m, a dynamic balance is required between the MCU-based Ca2+ influx, the NCE- and/or CHE-based Ca2 + efflux, and Ca2+ buffering within the mitochondrial matrix [87,88]. The relationship between [Ca2+]c to [Ca2+]m and the influence of [Ca2+]m on the TCA cycle was evaluated in the presence of different ionic concentrations, such as Na+ and Mg2+, in the buffers by [23,30,31] and modeled by [86,89]. It is important to know that the dominant Ca2+ transport system is tissue-specific, with NCE more dominant in heart and brain mitochondria [90], while CHE is more dominant in liver and kidney mitochondria [91,92,93].
The three consequential functional phases of mitochondrial Ca2+ can be distinguished, viz. the regulation of mitochondrial DH enzymes, the buffering of extramitochondrial Ca2+, and ultimately, the activation of the mitochondrial permeability transition pore (mPTP) [20,29,94,95]. There is ample evidence that isolated mitochondria can buffer extramitochondrial Ca2+ to the same extent as mitochondria in vivo [96,97]. Since [Ca2+]m is crucial for regulating mitochondrial energy metabolism in response to changes in workload, the Ca2+ buffering level in the mitochondrial matrix is critical to reaching the desired steady-state [Ca2+]m level. Steady-state [Ca2+]m controls mitochondrial ATP production via Ca2+ regulation of the mitochondrial DH enzymes that activate mitochondrial metabolic machinery and, in the process, stimulate ATP production to meet the cellular energy demands [25,98]. Therefore, it was assumed earlier that [Ca2+]m controls the mitochondrial energy metabolism without considering the role of cytoplasmic Ca2+ ([Ca2+]c) on the mitochondrial substrate transport that ultimately impacts the mitochondrial energy metabolism.
Several studies using MCU knockout mice showed that deleting MCU did not alter OxPhos, suggesting that other factors, in addition to [Ca2+]m, are responsible for the regulation of OxPhos [99,100,101,102,103]. Substrate transport has a great impact on the ability of Ca2+ to regulate metabolic activities [104]. For instance, [Ca2+]c stimulates OxPhos to respond to increased cellular workload by adjusting the rate of pyruvate transport from the cytosol to the mitochondria [105]. For this reason, the role of a malate–aspartate shuttle (MAS)-dependent substrate transport in regulating OxPhos responses is crucial. Interestingly, the study by Szibor et al. [99] concluded that [Ca2+]c controls ~85% of OxPhos rates when pyruvate is provided as a substrate, and the remaining ~15% is regulated by [Ca2+]m. The mitochondrial glutamate–aspartate carrier (Aralar), an essential component of MAS with a regulatory Ca2+-binding site facing the inter membrane space (IMS), promotes Ca2+ sensitivity of the MAS [106,107]. It is interesting to note that the MAS senses the [Ca2+]c and not the [Ca2+]m [108]. In contrast to the Ca2+ activation of DH enzymes, the Ca2+ activation of the Aralar carrier occurs by increasing its capacity (i.e., Vmax), rather than by decreasing its affinity for Ca2+ (i.e., KCa). Apart from glutamate transport [109], Aralar also transports redox equivalents into the mitochondrial matrix [110,111]. These results suggest that the concept of mitochondrial OxPhos stimulation through intra-mitochondrial Ca2+ is not consistent with all existing knowledge since it overlooks the fact that the mitochondrial processes can also be activated by Ca2+ ions that are not already accumulated within the mitochondrial matrix. The present study dissects the roles of different extra-mitochondrial [Ca2+] on mitochondrial state 3 respiration in heart and kidney OM in the present of the different respiratory substrate combinations as mitochondrial fuel. Our results suggest that Ca2+ differentially regulates mitochondrial state 3 respiration, and that this differential regulation is both substrate-dependent and organ-specific (Figure 5). Kidney OM mitochondria demonstrated more sensitivity towards the extra-mitochondrial Ca2+ perturbations, resulting in higher state 3 respiration in comparison to heart mitochondria for all substrate combinations studied. Interestingly, in the presence of the FADH2-based substrate SUC + ROT, the addition of Ca2+ consistently resulted in an inhibitory effect on state 3 respiratory rate for both heart and kidney OM mitochondria. Based on the above-mentioned existing knowledge regarding Ca2+ regulation of substrate transport, we can interpret our results as showing that different organs (heart and kidney OM in the present study) may vary in the extent of MAS activation and MCU-mediated Ca2+ uptake.

4.4. Complex Effects of Respiratory Substrates upon Ca2+ Activation of Mitochondrial Respiration and ATP Production in the Heart and Kidney OM

Little is known about whether mitochondria of kidney OM respond to Ca2+ and metabolic substrates in a manner similar to that of the heart, or whether they respond differently. The free Ca2+ level in cardiac mitochondria is 50–100 nM at rest, but can increase to >1µM during exercise [7,58,63]. It is also known that the level of free Ca2+ in the kidney is higher [112].
The present study finds that, although kidney OM mitochondria can retain and buffer less Ca2+ than heart mitochondria [112], the effects of Ca2+ upon mitochondrial state 3 respiration in the kidney OM are significantly greater than those in the heart. This was particularly observed when PM and PCM were provided as substrate combinations (Figure 5). Specifically, Ca2+ induced a significant increase in kidney OM mitochondrial state 3 respiration in the presence of PM and PCM substrate combinations. An energy-linked mitochondrial uptake of Ca2+ in the presence of phosphate has been studied by Carafoli et al. [113]. They demonstrated that kidney mitochondria can accumulate Ca2+ around 2500 ng-atoms/mg of mitochondrial protein in the presence of ADP. The same study sheds light on the effects of mitochondrial Ca2+ accumulation by showing the functional responses of the mitochondria to lower [Ca2+], and by showing higher state 3 respiration with Ca2+ stimulation than with ADP alone. The results of the present study show that, in comparison to kidney OM, the Ca2+-induced increase in heart mitochondrial state 3 respiration was negligible, exhibiting only an ~18% increase with PM and an ~6% increase with PCM as substrate combinations (Figure 5).
Interestingly, as seen in Figure 5, Ca2+ has a stimulatory effect on mitochondrial state 3 respiration in the presence of complex I substrates, but not in the presence of complex II substrates. Ca2+ enhances both the heart and kidney OM mitochondrial state 3 respiration in the presence of NADH-generating substrates, including PM, GM, or AM. However, no activation was observed in mitochondria of either tissue when SUC was provided as the substrate. This can be explained by the fact that FADH2 is generated from complex II upon using SUC as a substrate, so the DH enzymes are mostly inactive and the Ca2+ effects are, thereby, minimal. In contrast, palmitoyl-carnitine is a long-chain fatty acid, and its oxidation generates equal molar amounts of NADH and FADH2. The magnitude of the Ca2+ modulation effects of PCM groups may therefore be expected to fall in between complex I groups (PM, GM, AM) and complex II groups (SUC), as we have observed (Figure 5). In brief, Ca2+ has strong activation effects on respiration when complex I substrates are used, and has little to effect when complex II substrates are used. Importantly, the results in this study are consistent with the previous knowledge—that Ca2+ activation is largely a consequence of dehydrogenase (DH) enzymes in the TCA cycle—and also provide the first quantitative data of these relationships [114,115].
As mentioned previously, mitochondrial energy metabolism is regulated by Ca2+ via its effect on major DH enzymes [19,115]. As shown in Figure 10, these enzymes serve as targets for regulation by [Ca2+]m. The differential regulation of these DH enzymes by Ca2+ lies in their different binding activation constants (KCa) for Ca2+ and, therefore, these are sensitive to different ranges of [Ca2+] [116]. FAD-glycerol phosphate dehydrogenase (GPDH) senses Ca2+ in the IMS (KCa = 0.1 µM) [117]. The other three DH enzymes that sense [Ca2+]m are the pyruvate dehydrogenase (PDH) phosphatase (KCa ~ 1 µM; the complex that modulates the PDH activity), isocitrate dehydrogenase (ICDH), and oxoglutarate dehydrogenase (OGDH). PDH and OGDH are the primary DH enzymes responsible for pyruvate and α-ketoglutarate oxidation, respectively. High mitochondrial [Ca2+] stimulates the activity of PDH phosphatase, which further dephosphorylates PDH and increases its activity [98]. The affinity of ICDH for calcium (KCa) ranges from 5 to 50 μM depending on the ATP/ADP ratio [118]. OGDH, a TCA cycle enzyme, catalyzes the conversion of α-ketoglutarate to succinyl-CoA and is also stimulated by Ca2+ (KCa = 1 μM). ICDH and OGDH enzymes become more sensitive to Ca2+ with a decrease in the NADH/NAD+ ratio [25,119]. The high activation constant (KCa) makes ICDH less relevant since inhibitory effects occur before [Ca2+] reaches the KCa for ICDH. This may explain the relatively moderate activation effects of Ca2+ with PM and PCM as substrate combinations in heart mitochondria. The differences in the Ca2+ binding activation constants (KCa) also explain the reason behind the substrate- and organ-dependent [Ca2+] required to reach maximum respiration. Interestingly, Ca2+ also increases the MAS activity [116,120] that activates mitochondrial respiration when using GM as substrates. We can state that this might be the reason for relationships between state 3 respiration and [Ca2+], as summarized in Figure 5, which shows the integrated effects of intra-mitochondrial Ca2+ on DH enzymes in the TCA cycle and the activation effects of extra-mitochondrial Ca2+ on MAS activity [116].
It is evident that the effects of Ca2+ upon mitochondrial state 3 respiration are determined by the factors through which the components of the TCA cycle reactions are activated [19,23]. For example, when using AM as a substrate combination, the enzyme PDH is not active in isolated mitochondria and, hence, is less relevant to the activation effect of Ca2+. When using PM as a substrate combination, PDH becomes the dominant enzyme that sensitizes mitochondria to Ca2+ activation. As with other examples, the reaction rates of OGDH and ICDH are dependent on the mitochondrial NADH/NAD ratio, because NADH is a potent inhibitor of ICDH [121]. When NADH levels are higher in the mitochondrial matrix, the enzyme ICDH is inhibited and citrate is released outside of mitochondria. The downstream enzyme OGDH is also limited, unless exogenous α-ketoglutarate is provided. Considering yet another substrate component of the TCA cycle, palmitoyl-carnitine enters the TCA cycle through acetyl-CoA, much like pyruvate, and is subsequently converted to citrate, while PDH is bypassed when using PCM as a substrate combination. Among the important take-home messages of the present analysis is the importance of recognizing the different sites of modulation by Ca2+ while investigating the effects of different metabolic substrates on the state 3 respiration rates characterizing the OxPhos activity. Figure 10 summarizes the hypothetical regulatory sites of Ca2+ ion on mitochondria bioenergetics. As described earlier and mentioned through ample evidences that Ca2+ accumulation occurs via MCU [103,105], DH enzymes are activated by a rising matrix [Ca2+] [19]. Therefore, based on our results, and as demonstrated in Figure 5, we can conclude that the regulation of mitochondrial ATP synthesis by Ca2+ is complex and depends upon a combination of mechanisms, including an increase in ADP and substrate supply as well as an increase in both cytosolic and mitochondrial [Ca2+].

4.5. Mechanisms That May Explain the Seemingly Paradoxical Inhibitory Effects of Higher Ca2+ Concentrations on Mitochondrial State 3 Respiration

A balanced relationship between Ca2+ and metabolism is essential for maintaining cellular energy homeostasis. It starts with maintaining ΔΨm, which is essential for balancing cellular Ca2+ homeostasis [122]. The alteration of ΔΨm is responsible for maintaining the fine balance between the relative rates of Ca2+ uptake and efflux responsible for maintaining the equilibrium between [Ca2+]c and [Ca2+]m. This, in turn, prevents [Ca2+]m from reaching levels that can induce an irreversible disruption of mitochondrial structure and function. As clearly seen in the present studies, the effects of Ca2+ on mitochondrial state 3 respiration in both heart and kidney OM are biphasic. A reduction in mitochondrial state 3 respiration in both heart and OM (Figure 5) was observed at higher [Ca2+]free. Although the stimulatory actions can be rather well explained, the underlying mechanisms for the inhibitory action on mitochondrial state 3 respiration are not well explained. Several mechanisms must be considered for explaining the observed inhibitory action (Figure 10). First, it must be considered that higher [Ca2+]free can initiate the opening of mitochondrial permeability transition pores (mPTPs), resulting in decreased mitochondrial state 3 respiration [95]. Ca2+ overload can result in a reduction of the ETC activity and compromised ATP production capacity through the respiratory uncoupling and disruption of the IMM [7,123,124]. This also leads to the depolarization of ΔΨm and the inhibition of mitochondrial dehydrogenases [60,125]. Specifically, mPTP opening requires a certain threshold for matrix [Ca2+]free concentrations >5 µM [95], and we found in the current study that the highest [Ca2+]free in the buffer was around 1 µM, which may not be enough to attain a matrix [Ca2+]free of >5 µM to initiate the mPTP opening. In addition, mPTP opening should significantly affect mitochondrial respiration under a leak state (i.e., states 2 and 4) [58,76,95], which was also not observed in our data. It is unlikely, therefore, that mPTP opening can explain the inhibitory effect of higher [Ca2+]free upon mitochondrial state 3 respiration. Second, it has been proposed that Ca2+ and its derivatives could inhibit mitochondrial enzymes. For example, Lai et al. [125] suggested that PDH can be inhibited by a Ca2+ overload. Although mitochondria can strongly buffer Ca2+ ions that are transported from cytosol by MCU, high calcium-phosphate precipitation within the mitochondrial matrix has been implicated in reduced OxPhos activity [126,127].

4.6. Simple Kinetic Model Comparing the Activation and Inhibition Effects of Free Ca2+ on Mitochondria State 3 Respiration

The mitochondrial state 3 respiration rates obtained in the present studies were analyzed by fitting each state 3 OCR − [Ca2+]free curve to a kinetic model (Equation (1)) to provide a clearer representation of the effects of different [Ca2+]free on mitochondrial state 3 respiration. As seen in Figure 9, excellent fits were obtained for most of the groups, indicating that the relationship between state 3 OCR and [Ca2+]free can be well described by an equation that accounts for both stimulatory and inhibitory effects of [Ca2+]free on state 3 OCR. It should be noted that only one apparent KCa value and mitochondrial matrix binding site was considered for data analysis since differentiating the activation binding constant (KCa value) from the inhibition constant did not improve the fits.
The estimated V0, Vmax, and apparent KCa values for heart and kidney OM mitochondria, and their corresponding confidence intervals (Figure 9), indicate that although the V0 and Vmax values are much higher for the heart than they are for the kidney OM mitochondria, the binding constant KCa values are quite similar. In addition, among all of the substrate combinations used, GM was required for high levels of [Ca2+]free to reach maximum levels of mitochondrial state 3 respiration. At these high levels of [Ca2+]free, the inhibition of state 3 respiration was already occurring for other substrate combinations. This may explain the experimental results by Panov et al. [64], who examined the effects of two different [Ca2+] (0 µM and 700 µM [Ca2+]total, or equivalently 0 µM and ~1 µM [Ca2+]free) in isolated heart mitochondria, but did not observe significant stimulatory effects of Ca2+ in the presence of the substrate combinations, AM, PM, or SUC. However, their results suggested that the state 3 OCR was stimulated by ~31–110% when using GM as a substrate combination [64]. Importantly, the present study extended the range of [Ca2+]free used in experiments, which suggests a biphasic relationship between state 3 OCR and [Ca2+]free.
The data obtained in the present study indicate that multiple regulatory mechanisms play an important role in the inhibitory actions of Ca2+ (Figure 10). Specifically, the Hill coefficient for the inhibition term in Equation (1) needs to be higher than 3 to fit the experimental data, suggesting that multiple inhibitory mechanisms might be cooperative in the overall Ca2+ inhibition effects. It is also evident from our data that tissue-specific differences exist in mitochondrial respiration responses to Ca2+, and it has been found that cardiac mitochondria are more sensitive to impairment in the ETC than kidney mitochondria, as they are more sensitive to impairment of the ATP synthase and phosphate carrier [73].

5. Summary and Conclusions

Novel respirometry data obtained from the heart and kidney OM mitochondria of the same animal show that the heart mitochondria exhibit a > six-times higher state 3 OCR (nmol/min/mg mitochondrial protein) than that of the kidney OM mitochondria. The effects of varying [Ca2+] upon mitochondrial OxPhos were found to be both substrate-dependent and tissue-specific. The effects of varying [Ca2+] upon mitochondrial OxPhos were also found to be biphasic in both organs. The effects of varying [Ca2+] on mitochondrial respiration, as determined by substrate availability, were found to be different between the heart and kidney OM. When using complex-I substrate combinations, such as PM and PCM, Ca2+ showed more prominent activation effects in the kidney OM mitochondria compared to the heart mitochondria, as evident by percent activation of mitochondrial state 3 respiration induced by increasing [Ca2+]. When using SUC as a substrate in the presence of ROT, only an inhibitory effect on mitochondrial respiration was observed. The analysis of data indicates that the net effect of varying [Ca2+] on mitochondrial state 3 respiration is a combination of stimulatory effects on mitochondrial DH enzymes and inhibitory effects on multiple targets, including DH enzymes. As such, the net effect can be quantified by a simple empirical equation that accounts for the apparent activation and inhibition effects of Ca2+. Based on our results and the existing data, the fine coupling between increases in [Ca2+]c and [Ca2+]m is crucial to have the coordination between mitochondrial ATP production and cellular energy demands. We conclude that isolated mitochondrial studies must utilize an optimal substrate and [Ca2+] as defined by in vivo conditions in order to achieve physiological and optimal level of OxPhos activity and energy metabolism. These results will further our understanding of the role of mitochondrial dysfunction in the pathogenesis of diseases such as hypertension. These results are also useful for building predictive mathematical models of mitochondrial bioenergetics and regulations to study the emergent properties of cardiac and renal mitochondrial metabolic systems.

Author Contributions

X.Z.: Methodology, Investigation, Data Analysis, Interpretation, Writing—Original Draft, Writing—Review and Editing; N.T.: Conceptualization, Methodology, Investigation, Data Analysis, Writing—Review and Editing; S.M.K.: Conceptualization, Methodology, Investigation, Data Analysis, S.H.A. Interpretation, Writing—Review and Editing; A.W.C.J.: Conceptualization, Methodology, Investigation, Interpretation, Supervision, Writing—Review and Editing, Funding acquisition; R.K.D.: Conceptualization, Methodology, Investigation, Data Analysis, Interpretation, Supervision, Writing—Review and Editing, Project administration, Funding acquisition. All authors have read and agreed to the published version of the manuscript.

Funding

This work was supported by the NIH grants R01-HL151587 and P01-HL116264.

Institutional Review Board Statement

The animal study protocol was approved by the Institutional Animal Care and Use Committee (IACUC) of Medical College of Wisconsin (AUA00000851) for studies involving animals.

Informed Consent Statement

Not applicable.

Data Availability Statement

All data are presented in this manuscript.

Conflicts of Interest

The authors declare that they have no known competing financial interests or personal relationships that could have appeared to influence the work reported in this paper. The authors declare no conflict of interest.

Abbreviation

AKGDHAlpha-ketoglutarate dehydrogenase
AMAlpha-ketoglutarate + malate
ANTAdenine nucleotide translocase
BSABovine serum albumin
ETCElectron transport chain
GMGlutamate + malate
IBIsolation buffer
IMMInner mitochondrial membrane
ICDHIsocitrate dehydrogenase
JO2Oxygen consumption flux
MASMalate-Aspartate shuttle
MCUMitochondrial Ca2+ uniporter
MDHMalate dehydrogenase
mPTPMitochondrial permeability transition pore
mTALMedullary thick ascending limbs of loop of Henle
NCENa+/Ca2+ Exchanger
NHENa+/H+ Exchanger
O2kOxygraph-2k
OCROxygen consumption rate
OGDH2-oxo glutarate dehydrogenase
OMOuter medulla
OxPhosOxidative Phosphorylation
PCMPalmitoyl-carnitine + malate
PICInorganic phosphate carrier
PDHPyruvate dehydrogenase
PMPyruvate + malate
RBRespiration buffer
RCRRespiratory control ratio
ROTRotenone
SDSprague-Dawley
SUCSuccinate
TCATricarboxylic acid cycle

References

  1. Tian, Z.; Liang, M. Renal metabolism and hypertension. Nat. Commun. 2021, 12, 963. [Google Scholar] [CrossRef]
  2. Bhargava, P.; Schnellmann, R.G. Mitochondrial energetics in the kidney. Nat. Rev. Nephrol. 2017, 13, 629–646. [Google Scholar] [CrossRef] [PubMed]
  3. Bertero, E.; Maack, C. Metabolic remodelling in heart failure. Nat. Rev. Cardiol. 2018, 15, 457–470. [Google Scholar] [CrossRef]
  4. Vander Heiden, M.G.; DeBerardinis, R.J. Understanding the Intersections between Metabolism and Cancer Biology. Cell 2017, 168, 657–669. [Google Scholar] [CrossRef] [PubMed] [Green Version]
  5. Nicholls, D.G.; Ferguson, S.J. Bioenergetics, 4th ed.; Academic Press: London, UK, 2013. [Google Scholar]
  6. Rizzuto, R.; De Stefani, D.; Raffaello, A.; Mammucari, C. Mitochondria as sensors and regulators of calcium signalling. Nat. Reviews. Mol. Cell Biol. 2012, 13, 566–578. [Google Scholar] [CrossRef] [PubMed]
  7. Duchen, M.R. Mitochondria and calcium: From cell signalling to cell death. J. Physiol. 2000, 529 Pt 1, 57–68. [Google Scholar] [CrossRef]
  8. Bernardi, P. Mitochondrial transport of cations: Channels, exchangers, and permeability transition. Physiol. Rev. 1999, 79, 1127–1155. [Google Scholar] [CrossRef] [PubMed]
  9. Gunter, T.E.; Gunter, K.K.; Sheu, S.S.; Gavin, C.E. Mitochondrial calcium transport: Physiological and pathological relevance. Am. J. Physiol. 1994, 267, C313–C339. [Google Scholar] [CrossRef]
  10. Vinnakota, K.C.; Bazil, J.N.; Van den Bergh, F.; Wiseman, R.W.; Beard, D.A. Feedback Regulation and Time Hierarchy of Oxidative Phosphorylation in Cardiac Mitochondria. Biophys. J. 2016, 110, 972–980. [Google Scholar] [CrossRef] [Green Version]
  11. Wu, F.; Zhang, E.Y.; Zhang, J.; Bache, R.J.; Beard, D.A. Phosphate metabolite concentrations and ATP hydrolysis potential in normal and ischaemic hearts. J. Physiol. 2008, 586, 4193–4208. [Google Scholar] [CrossRef]
  12. Wu, F.; Jeneson, J.A.; Beard, D.A. Oxidative ATP synthesis in skeletal muscle is controlled by substrate feedback. Am. J. Physiol. Cell Physiol. 2007, 292, C115–C124. [Google Scholar] [CrossRef] [PubMed]
  13. Bose, S.; French, S.; Evans, F.J.; Joubert, F.; Balaban, R.S. Metabolic network control of oxidative phosphorylation: Multiple roles of inorganic phosphate. J. Biol. Chem. 2003, 278, 39155–39165. [Google Scholar] [CrossRef] [Green Version]
  14. Scholz, T.D.; Laughlin, M.R.; Balaban, R.S.; Kupriyanov, V.V.; Heineman, F.W. Effect of substrate on mitochondrial NADH, cytosolic redox state, and phosphorylated compounds in isolated hearts. Am. J. Physiol. 1995, 268, H82–H91. [Google Scholar] [CrossRef]
  15. LaNoue, K.F.; Bryla, J.; Williamson, J.R. Feedback interactions in the control of citric acid cycle activity in rat heart mitochondria. J. Biol. Chem. 1972, 247, 667–679. [Google Scholar] [CrossRef]
  16. LaNoue, K.; Nicklas, W.J.; Williamson, J.R. Control of citric acid cycle activity in rat heart mitochondria. J. Biol. Chem. 1970, 245, 102–111. [Google Scholar] [CrossRef]
  17. O’Donnell, J.M.; Doumen, C.; LaNoue, K.F.; White, L.T.; Yu, X.; Alpert, N.M.; Lewandowski, E.D. Dehydrogenase regulation of metabolite oxidation and efflux from mitochondria in intact hearts. Am. J. Physiol. 1998, 274, H467–H476. [Google Scholar] [CrossRef]
  18. Romani, A.M.P. Physiology and Pathology of Mitochondrial Dehydrogenases. In Secondary Metabolites—Sources and Applications; Ramasamy Vijayakumar, S.S.S.R., Ed.; IntechOpen: London, UK, 2018. [Google Scholar]
  19. Denton, R.M. Regulation of mitochondrial dehydrogenases by calcium ions. Biochim. Biophys. Acta 2009, 1787, 1309–1316. [Google Scholar] [CrossRef] [PubMed] [Green Version]
  20. McCormack, J.G.; Halestrap, A.P.; Denton, R.M. Role of calcium ions in regulation of mammalian intramitochondrial metabolism. Physiol. Rev. 1990, 70, 391–425. [Google Scholar] [CrossRef]
  21. McCormack, J.G.; Denton, R.M. The role of Ca2+ in the regulation of intramitochondrial energy production in heart. Biomed. Biochim. Acta 1987, 46, S487–S492. [Google Scholar]
  22. Denton, R.M.; McCormack, J.G. The calcium sensitive dehydrogenases of vertebrate mitochondria. Cell Calcium 1986, 7, 377–386. [Google Scholar] [CrossRef]
  23. Denton, R.M.; McCormack, J.G.; Edgell, N.J. Role of calcium ions in the regulation of intramitochondrial metabolism. Effects of Na+, Mg2+ and ruthenium red on the Ca2+-stimulated oxidation of oxoglutarate and on pyruvate dehydrogenase activity in intact rat heart mitochondria. Biochem. J. 1980, 190, 107–117. [Google Scholar] [CrossRef] [PubMed] [Green Version]
  24. McCormack, J.G.; Denton, R.M. The effects of calcium ions and adenine nucleotides on the activity of pig heart 2-oxoglutarate dehydrogenase complex. Biochem. J. 1979, 180, 533–544. [Google Scholar] [CrossRef]
  25. Denton, R.M.; Richards, D.A.; Chin, J.G. Calcium ions and the regulation of NAD+-linked isocitrate dehydrogenase from the mitochondria of rat heart and other tissues. Biochem. J. 1978, 176, 899–906. [Google Scholar] [CrossRef]
  26. Williams, G.S.; Boyman, L.; Lederer, W.J. Mitochondrial calcium and the regulation of metabolism in the heart. J. Mol. Cell Cardiol. 2015, 78, 35–45. [Google Scholar] [CrossRef]
  27. Rossi, A.; Pizzo, P.; Filadi, R. Calcium, mitochondria and cell metabolism: A functional triangle in bioenergetics. Biochim. Biophys. Acta Mol. Cell Res. 2019, 1866, 1068–1078. [Google Scholar] [CrossRef]
  28. Finkel, T.; Menazza, S.; Holmstrom, K.M.; Parks, R.J.; Liu, J.; Sun, J.; Liu, J.; Pan, X.; Murphy, E. The ins and outs of mitochondrial calcium. Circ. Res. 2015, 116, 1810–1819. [Google Scholar] [CrossRef] [PubMed] [Green Version]
  29. McCormack, J.G.; Browne, H.M.; Dawes, N.J. Studies on mitochondrial Ca2+-transport and matrix Ca2+ using fura-2-loaded rat heart mitochondria. Biochim. Biophys. Acta 1989, 973, 420–427. [Google Scholar] [CrossRef]
  30. Boelens, A.D.; Pradhan, R.K.; Blomeyer, C.A.; Camara, A.K.; Dash, R.K.; Stowe, D.F. Extra-matrix Mg2+ limits Ca2+ uptake and modulates Ca2+ uptake-independent respiration and redox state in cardiac isolated mitochondria. J. Bioenerg. Biomembr. 2013, 45, 203–218. [Google Scholar] [CrossRef] [Green Version]
  31. Wan, B.; LaNoue, K.F.; Cheung, J.Y.; Scaduto, R.C., Jr. Regulation of citric acid cycle by calcium. J. Biol. Chem. 1989, 264, 13430–13439. [Google Scholar] [CrossRef]
  32. Vinnakota, K.C.; Singhal, A.; Van den Bergh, F.; Bagher-Oskouei, M.; Wiseman, R.W.; Beard, D.A. Open-Loop Control of Oxidative Phosphorylation in Skeletal and Cardiac Muscle Mitochondria by Ca2+. Biophys. J. 2016, 110, 954–961. [Google Scholar] [CrossRef] [Green Version]
  33. Glancy, B.; Balaban, R.S. Role of mitochondrial Ca2+ in the regulation of cellular energetics. Biochemistry 2012, 51, 2959–2973. [Google Scholar] [CrossRef] [Green Version]
  34. Griffiths, E.J.; Rutter, G.A. Mitochondrial calcium as a key regulator of mitochondrial ATP production in mammalian cells. Biochim. Biophys. Acta 2009, 1787, 1324–1333. [Google Scholar] [CrossRef] [Green Version]
  35. Balaban, R.S. The role of Ca2+ signaling in the coordination of mitochondrial ATP production with cardiac work. Biochim. Biophys. Acta 2009, 1787, 1334–1341. [Google Scholar] [CrossRef] [PubMed] [Green Version]
  36. Balaban, R.S.; Bose, S.; French, S.A.; Territo, P.R. Role of calcium in metabolic signaling between cardiac sarcoplasmic reticulum and mitochondria in vitro. Am. J. Physiol. Cell Physiol. 2003, 284, C285–C293. [Google Scholar] [CrossRef] [Green Version]
  37. Blomeyer, C.A.; Bazil, J.N.; Stowe, D.F.; Dash, R.K.; Camara, A.K. Mg(2+) differentially regulates two modes of mitochondrial Ca(2+) uptake in isolated cardiac mitochondria: Implications for mitochondrial Ca(2+) sequestration. J. Bioenerg. Biomembr. 2016, 48, 175–188. [Google Scholar] [CrossRef] [PubMed] [Green Version]
  38. Blomeyer, C.A.; Bazil, J.N.; Stowe, D.F.; Pradhan, R.K.; Dash, R.K.; Camara, A.K. Dynamic buffering of mitochondrial Ca2+ during Ca2+ uptake and Na+-induced Ca2+ release. J. Bioenerg. Biomembr. 2013, 45, 189–202. [Google Scholar] [CrossRef] [Green Version]
  39. Bazil, J.N.; Blomeyer, C.A.; Pradhan, R.K.; Camara, A.K.; Dash, R.K. Modeling the calcium sequestration system in isolated guinea pig cardiac mitochondria. J. Bioenerg. Biomembr. 2013, 45, 177–188. [Google Scholar] [CrossRef] [Green Version]
  40. Tewari, S.G.; Camara, A.K.; Stowe, D.F.; Dash, R.K. Computational analysis of Ca2+ dynamics in isolated cardiac mitochondria predicts two distinct modes of Ca2+ uptake. J. Physiol. 2014, 592, 1917–1930. [Google Scholar] [CrossRef] [Green Version]
  41. Dash, R.K.; Beard, D.A. Analysis of cardiac mitochondrial Na+-Ca2+ exchanger kinetics with a biophysical model of mitochondrial Ca2+ handling suggests a 3:1 stoichiometry. J. Physiol. 2008, 586, 3267–3285. [Google Scholar] [CrossRef] [PubMed]
  42. Williams, G.S.; Boyman, L.; Chikando, A.C.; Khairallah, R.J.; Lederer, W.J. Mitochondrial calcium uptake. Proc. Natl. Acad. Sci. USA 2013, 110, 10479–10486. [Google Scholar] [CrossRef] [Green Version]
  43. Glancy, B.; Willis, W.T.; Chess, D.J.; Balaban, R.S. Effect of calcium on the oxidative phosphorylation cascade in skeletal muscle mitochondria. Biochemistry 2013, 52, 2793–2809. [Google Scholar] [CrossRef]
  44. Eisner, D.A.; Caldwell, J.L.; Kistamás, K.; Trafford, A.W. Calcium and Excitation-Contraction Coupling in the Heart. Circ. Res. 2017, 121, 181–195. [Google Scholar] [CrossRef] [PubMed]
  45. Bers, D.M. Calcium cycling and signaling in cardiac myocytes. Annu. Rev. Physiol. 2008, 70, 23–49. [Google Scholar] [CrossRef] [Green Version]
  46. Singh, P.; Thomson, S.C. Metabolic Basis of Solute Transport. In Brenner and Rector’s The Kidney, 11st ed.; Elsevier: Amsterdam, The Netherlands, 2019. [Google Scholar]
  47. Forbes, J.M. Mitochondria;Power Players in Kidney Function? Trends Endocrinol. Metab. 2016, 27, 441–442. [Google Scholar] [CrossRef]
  48. Elia, M. Organ and Tissue Contribution to Metabolic Rate; Raven Press: New York, NY, USA, 1992. [Google Scholar]
  49. Pohjoismaki, J.L.; Goffart, S. The role of mitochondria in cardiac development and protection. Free Radic. Biol. Med. 2017, 106, 345–354. [Google Scholar] [CrossRef] [PubMed] [Green Version]
  50. Saks, V.; Dzeja, P.; Schlattner, U.; Vendelin, M.; Terzic, A.; Wallimann, T. Cardiac system bioenergetics: Metabolic basis of the Frank-Starling law. J. Physiol. 2006, 571, 253–273. [Google Scholar] [CrossRef]
  51. Hochachka, P.W.; McClelland, G.B. Cellular metabolic homeostasis during large-scale change in ATP turnover rates in muscles. J. Exp. Biol. 1997, 200, 381–386. [Google Scholar] [CrossRef]
  52. Soltoff, S.P. ATP and the regulation of renal cell function. Annu. Rev. Physiol. 1986, 48, 9–31. [Google Scholar] [CrossRef]
  53. Mandel, L.J. Metabolic substrates, cellular energy production, and the regulation of proximal tubular transport. Annu. Rev. Physiol. 1985, 47, 85–101. [Google Scholar] [CrossRef] [PubMed]
  54. Kiil, F. Renal energy metabolism and regulation of sodium reabsorption. Kidney Int. 1977, 11, 153–160. [Google Scholar] [CrossRef] [Green Version]
  55. Bankir, L.; Figueres, L.; Prot-Bertoye, C.; Bouby, N.; Crambert, G.; Pratt, J.H.; Houillier, P. Medullary and cortical thick ascending limb: Similarities and differences. Am. J. Physiol. Renal Physiol. 2020, 318, F422–F442. [Google Scholar] [CrossRef] [PubMed]
  56. Evans, L.C.; Cowley, A.W., Jr. Renal Medullary Circulation, 1st ed.; Morgan & Claypool Publishers: San Rafael, CA, USA, 1990; p. 104. [Google Scholar]
  57. Cheng, Y.; Song, H.; Pan, X.; Xue, H.; Wan, Y.; Wang, T.; Tian, Z.; Hou, E.; Lanza, I.R.; Liu, P.; et al. Urinary Metabolites Associated with Blood Pressure on a Low- or High-Sodium Diet. Theranostics 2018, 8, 1468–1480. [Google Scholar] [CrossRef] [PubMed] [Green Version]
  58. Cao, J.L.; Adaniya, S.M.; Cypress, M.W.; Suzuki, Y.; Kusakari, Y.; Jhun, B.S.; O-Uchi, J. Role of mitochondrial Ca(2+) homeostasis in cardiac muscles. Arch. Biochem. Biophys. 2019, 663, 276–287. [Google Scholar] [CrossRef]
  59. Lopaschuk, G.D. Targets for modulation of fatty acid oxidation in the heart. Curr. Opin. Investig. Drugs 2004, 5, 290–294. [Google Scholar] [PubMed]
  60. Fink, B.D.; Bai, F.; Yu, L.; Sivitz, W.I. Regulation of ATP production: Dependence on calcium concentration and respiratory state. Am. J. Physiol. Cell Physiol. 2017, 313, C146–C153. [Google Scholar] [CrossRef] [Green Version]
  61. Tarasov, A.I.; Griffiths, E.J.; Rutter, G.A. Regulation of ATP production by mitochondrial Ca(2+). Cell Calcium 2012, 52, 28–35. [Google Scholar] [CrossRef] [PubMed] [Green Version]
  62. Wollenman, L.C.; Vander Ploeg, M.R.; Miller, M.L.; Zhang, Y.; Bazil, J.N. The effect of respiration buffer composition on mitochondrial metabolism and function. PLoS ONE 2017, 12, e0187523. [Google Scholar] [CrossRef] [Green Version]
  63. Vinnakota, K.C.; Dash, R.K.; Beard, D.A. Stimulatory effects of calcium on respiration and NAD(P)H synthesis in intact rat heart mitochondria utilizing physiological substrates cannot explain respiratory control in vivo. J. Biol. Chem. 2011, 286, 30816–30822. [Google Scholar] [CrossRef] [Green Version]
  64. Panov, A.V.; Scaduto, R.C., Jr. Substrate specific effects of calcium on metabolism of rat heart mitochondria. Am. J. Physiol. 1996, 270, H1398–H1406. [Google Scholar] [CrossRef]
  65. Tomar, N.; Zhang, X.; Kandel, S.M.; Sadri, S.; Yang, C.; Liang, M.; Audi, S.H.; Cowley, A.W., Jr.; Dash, R.K. Substrate-dependent differential regulation of mitochondrial bioenergetics in the heart and kidney cortex and outer medulla. Biochim. Biophys. Acta Bioenerg. 2021, 1863, 148518. [Google Scholar] [CrossRef]
  66. Agarwal, B.; Camara, A.K.; Stowe, D.F.; Bosnjak, Z.J.; Dash, R.K. Enhanced charge-independent mitochondrial free Ca(2+) and attenuated ADP-induced NADH oxidation by isoflurane: Implications for cardioprotection. Biochim. Biophys. Acta 2012, 1817, 453–465. [Google Scholar] [CrossRef] [PubMed] [Green Version]
  67. Agarwal, B.; Dash, R.K.; Stowe, D.F.; Bosnjak, Z.J.; Camara, A.K. Isoflurane modulates cardiac mitochondrial bioenergetics by selectively attenuating respiratory complexes. Biochim. Biophys. Acta 2014, 1837, 354–365. [Google Scholar] [CrossRef] [Green Version]
  68. Schoenmakers, T.J.; Visser, G.J.; Flik, G.; Theuvenet, A.P. CHELATOR: An improved method for computing metal ion concentrations in physiological solutions. Biotechniques 1992, 12, 870–874, 876–879. [Google Scholar]
  69. McKnight, S.L. On getting there from here. Science 2010, 330, 1338–1339. [Google Scholar] [CrossRef] [Green Version]
  70. Langman, C.B.; Cannata-Andía, J.B. Calcium in chronic kidney disease: Myths and realities. Introduction. Clin. J. Am. Soc. Nephrol. 2010, 5 (Suppl. 1), S1–S2. [Google Scholar] [CrossRef]
  71. Chiodini, I.; Bolland, M.J. Calcium supplementation in osteoporosis: Useful or harmful? Eur. J. Endocrinol. 2018, 178, D13–D25. [Google Scholar] [CrossRef] [Green Version]
  72. Forner, F.; Foster, L.J.; Campanaro, S.; Valle, G.; Mann, M. Quantitative proteomic comparison of rat mitochondria from muscle, heart, and liver. Mol. Cell Proteom. 2006, 5, 608–619. [Google Scholar] [CrossRef] [Green Version]
  73. Rossignol, R.; Letellier, T.; Malgat, M.; Rocher, C.; Mazat, J.P. Tissue variation in the control of oxidative phosphorylation: Implication for mitochondrial diseases. Biochem. J. 2000, 347 Pt 1, 45–53. [Google Scholar] [CrossRef]
  74. Shirley, M.K.; Arthurs, O.J.; Seunarine, K.K.; Cole, T.J.; Eaton, S.; Williams, J.E.; Clark, C.A.; Wells, J.C.K. Metabolic rate of major organs and tissues in young adult South Asian women. Eur. J. Clin. Nutr. 2019, 73, 1164–1171. [Google Scholar] [CrossRef] [PubMed]
  75. Goffart, S.; von Kleist-Retzow, J.-C.; Wiesner, R.J. Regulation of mitochondrial proliferation in the heart: Power-plant failure contributes to cardiac failure in hypertrophy. Cardiovasc. Res. 2004, 64, 198–207. [Google Scholar] [CrossRef] [PubMed] [Green Version]
  76. Boyman, L.; Chikando, A.C.; Williams, G.S.; Khairallah, R.J.; Kettlewell, S.; Ward, C.W.; Smith, G.L.; Kao, J.P.; Lederer, W.J. Calcium movement in cardiac mitochondria. Biophys. J. 2014, 107, 1289–1301. [Google Scholar] [CrossRef] [PubMed] [Green Version]
  77. Rossitto, G.; Maiolino, G.; Lerco, S.; Ceolotto, G.; Blackburn, G.; Mary, S.; Antonelli, G.; Berton, C.; Bisogni, V.; Cesari, M.; et al. High sodium intake, glomerular hyperfiltration, and protein catabolism in patients with essential hypertension. Cardiovasc. Res. 2021, 117, 1372–1381. [Google Scholar] [CrossRef]
  78. Stillman, I.E.; Brezis, M.; Heyman, S.N.; Epstein, F.H.; Spokes, K.; Rosen, S. Effects of salt depletion on the kidney: Changes in medullary oxygenation and thick ascending limb size. J. Am. Soc. Nephrol. 1994, 4, 1538–1545. [Google Scholar] [CrossRef] [PubMed]
  79. Friederich-Persson, M.; Thorn, E.; Hansell, P.; Nangaku, M.; Levin, M.; Palm, F. Kidney hypoxia, attributable to increased oxygen consumption, induces nephropathy independently of hyperglycemia and oxidative stress. Hypertension 2013, 62, 914–919. [Google Scholar] [CrossRef] [PubMed] [Green Version]
  80. Kunz, W.S. Different metabolic properties of mitochondrial oxidative phosphorylation in different cell types--important implications for mitochondrial cytopathies. Exp. Physiol. 2003, 88, 149–154. [Google Scholar] [CrossRef] [Green Version]
  81. Cortassa, S.; Aon, M.A.; Sollott, S.J. Control and Regulation of Substrate Selection in Cytoplasmic and Mitochondrial Catabolic Networks. A Systems Biology Analysis. Front. Physiol. 2019, 10, 201. [Google Scholar] [CrossRef] [Green Version]
  82. Hinkle, P.C.; Yu, M.L. The phosphorus/oxygen ratio of mitochondrial oxidative phosphorylation. J. Biol. Chem. 1979, 254, 2450–2455. [Google Scholar] [CrossRef]
  83. Hinkle, P.C. P/O ratios of mitochondrial oxidative phosphorylation. Biochim. Biophys. Acta 2005, 1706, 1–11. [Google Scholar] [CrossRef] [Green Version]
  84. Hinkle, P.C.; Kumar, M.A.; Resetar, A.; Harris, D.L. Mechanistic stoichiometry of mitochondrial oxidative phosphorylation. Biochemistry 1991, 30, 3576–3582. [Google Scholar] [CrossRef]
  85. Santo-Domingo, J.; Demaurex, N. Calcium uptake mechanisms of mitochondria. Biochim. Biophys. Acta 2010, 1797, 907–912. [Google Scholar] [CrossRef]
  86. Dash, R.K.; Qi, F.; Beard, D.A. A biophysically based mathematical model for the kinetics of mitochondrial calcium uniporter. Biophys. J. 2009, 96, 1318–1332. [Google Scholar] [CrossRef] [Green Version]
  87. Lehninger, A.L.; Reynafarje, B.; Vercesi, A.; Tew, W.P. Transport and accumulation of calcium in mitochondria. Ann. N. Y. Acad. Sci. 1978, 307, 160–176. [Google Scholar] [CrossRef]
  88. Palty, R.; Silverman, W.F.; Hershfinkel, M.; Caporale, T.; Sensi, S.L.; Parnis, J.; Nolte, C.; Fishman, D.; Shoshan-Barmatz, V.; Herrmann, S.; et al. NCLX is an essential component of mitochondrial Na+/Ca2+ exchange. Proc. Natl. Acad. Sci. USA 2010, 107, 436–441. [Google Scholar] [CrossRef] [PubMed] [Green Version]
  89. Pradhan, R.K.; Qi, F.; Beard, D.A.; Dash, R.K. Characterization of Mg2+ inhibition of mitochondrial Ca2+ uptake by a mechanistic model of mitochondrial Ca2+ uniporter. Biophys. J. 2011, 101, 2071–2081. [Google Scholar] [CrossRef] [PubMed] [Green Version]
  90. Crompton, M.; Kunzi, M.; Carafoli, E. The calcium-induced and sodium-induced effluxes of calcium from heart mitochondria. Evidence for a sodium-calcium carrier. Eur. J. Biochem. 1977, 79, 549–558. [Google Scholar] [CrossRef]
  91. Gunter, T.E.; Sheu, S.S. Characteristics and possible functions of mitochondrial Ca(2+) transport mechanisms. Biochim. Biophys. Acta 2009, 1787, 1291–1308. [Google Scholar] [CrossRef] [Green Version]
  92. Puskin, J.S.; Gunter, T.E.; Gunter, K.K.; Russell, P.R. Evidence for more than one Ca2+ transport mechanism in mitochondria. Biochemistry 1976, 15, 3834–3842. [Google Scholar] [CrossRef]
  93. Fiskum, G.; Lehninger, A.L. Regulated release of Ca2+ from respiring mitochondria by Ca2+/2H+ antiport. J. Biol. Chem. 1979, 254, 6236–6239. [Google Scholar] [CrossRef]
  94. Chalmers, S.; Nicholls, D.G. The relationship between free and total calcium concentrations in the matrix of liver and brain mitochondria. J. Biol. Chem. 2003, 278, 19062–19070. [Google Scholar] [CrossRef] [Green Version]
  95. Korge, P.; Yang, L.; Yang, J.H.; Wang, Y.; Qu, Z.; Weiss, J.N. Protective role of transient pore openings in calcium handling by cardiac mitochondria. J. Biol. Chem. 2011, 286, 34851–34857. [Google Scholar] [CrossRef] [PubMed] [Green Version]
  96. Nicholls, D.G. The regulation of extramitochondrial free calcium ion concentration by rat liver mitochondria. Biochem. J. 1978, 176, 463–474. [Google Scholar] [CrossRef] [PubMed] [Green Version]
  97. Joseph, S.K.; Coll, K.E.; Cooper, R.H.; Marks, J.S.; Williamson, J.R. Mechanisms underlying calcium homeostasis in isolated hepatocytes. J. Biol. Chem. 1983, 258, 731–741. [Google Scholar] [CrossRef]
  98. Gherardi, G.; Monticelli, H.; Rizzuto, R.; Mammucari, C. The Mitochondrial Ca(2+) Uptake and the Fine-Tuning of Aerobic Metabolism. Front. Physiol. 2020, 11, 554904. [Google Scholar] [CrossRef]
  99. Szibor, M.; Gizatullina, Z.; Gainutdinov, T.; Endres, T.; Debska-Vielhaber, G.; Kunz, M.; Karavasili, N.; Hallmann, K.; Schreiber, F.; Bamberger, A.; et al. Cytosolic, but not matrix, calcium is essential for adjustment of mitochondrial pyruvate supply. J. Biol. Chem. 2020, 295, 4383–4397. [Google Scholar] [CrossRef] [PubMed] [Green Version]
  100. Pan, X.; Liu, J.; Nguyen, T.; Liu, C.; Sun, J.; Teng, Y.; Fergusson, M.M.; Rovira, I.I.; Allen, M.; Springer, D.A.; et al. The physiological role of mitochondrial calcium revealed by mice lacking the mitochondrial calcium uniporter. Nat. Cell Biol. 2013, 15, 1464–1472. [Google Scholar] [CrossRef] [Green Version]
  101. Holmstrom, K.M.; Pan, X.; Liu, J.C.; Menazza, S.; Liu, J.; Nguyen, T.T.; Pan, H.; Parks, R.J.; Anderson, S.; Noguchi, A.; et al. Assessment of cardiac function in mice lacking the mitochondrial calcium uniporter. J. Mol. Cell Cardiol. 2015, 85, 178–182. [Google Scholar] [CrossRef] [Green Version]
  102. Rasmussen, T.P.; Wu, Y.; Joiner, M.L.; Koval, O.M.; Wilson, N.R.; Luczak, E.D.; Wang, Q.; Chen, B.; Gao, Z.; Zhu, Z.; et al. Inhibition of MCU forces extramitochondrial adaptations governing physiological and pathological stress responses in heart. Proc. Natl. Acad. Sci. USA 2015, 112, 9129–9134. [Google Scholar] [CrossRef] [Green Version]
  103. Hamilton, J.; Brustovetsky, T.; Rysted, J.E.; Lin, Z.; Usachev, Y.M.; Brustovetsky, N. Deletion of mitochondrial calcium uniporter incompletely inhibits calcium uptake and induction of the permeability transition pore in brain mitochondria. J. Biol. Chem. 2018, 293, 15652–15663. [Google Scholar] [CrossRef] [Green Version]
  104. Satrustegui, J.; Pardo, B.; Del Arco, A. Mitochondrial transporters as novel targets for intracellular calcium signaling. Physiol. Rev. 2007, 87, 29–67. [Google Scholar] [CrossRef] [Green Version]
  105. Luongo, T.S.; Lambert, J.P.; Yuan, A.; Zhang, X.; Gross, P.; Song, J.; Shanmughapriya, S.; Gao, E.; Jain, M.; Houser, S.R.; et al. The Mitochondrial Calcium Uniporter Matches Energetic Supply with Cardiac Workload during Stress and Modulates Permeability Transition. Cell Rep. 2015, 12, 23–34. [Google Scholar] [CrossRef] [Green Version]
  106. Palmieri, L.; Pardo, B.; Lasorsa, F.M.; del Arco, A.; Kobayashi, K.; Iijima, M.; Runswick, M.J.; Walker, J.E.; Saheki, T.; Satrustegui, J.; et al. Citrin and aralar1 are Ca(2+)-stimulated aspartate/glutamate transporters in mitochondria. EMBO J. 2001, 20, 5060–5069. [Google Scholar] [CrossRef] [PubMed]
  107. Satrustegui, J.; Contreras, L.; Ramos, M.; Marmol, P.; del Arco, A.; Saheki, T.; Pardo, B. Role of aralar, the mitochondrial transporter of aspartate-glutamate, in brain N-acetylaspartate formation and Ca(2+) signaling in neuronal mitochondria. J. Neurosci. Res. 2007, 85, 3359–3366. [Google Scholar] [CrossRef]
  108. Llorente-Folch, I.; Rueda, C.B.; Amigo, I.; del Arco, A.; Saheki, T.; Pardo, B.; Satrustegui, J. Calcium-regulation of mitochondrial respiration maintains ATP homeostasis and requires ARALAR/AGC1-malate aspartate shuttle in intact cortical neurons. J. Neurosci. 2013, 33, 13957–13971. [Google Scholar] [CrossRef]
  109. Gellerich, F.N.; Gizatullina, Z.; Arandarcikaite, O.; Jerzembek, D.; Vielhaber, S.; Seppet, E.; Striggow, F. Extramitochondrial Ca2+ in the nanomolar range regulates glutamate-dependent oxidative phosphorylation on demand. PLoS ONE 2009, 4, e8181. [Google Scholar] [CrossRef] [Green Version]
  110. LaNoue, K.F.; Williamson, J.R. Interrelationships between malate-aspartate shuttle and citric acid cycle in rat heart mitochondria. Metabolism 1971, 20, 119–140. [Google Scholar] [CrossRef]
  111. Williamson, J.R.; Safer, B.; LaNoue, K.F.; Smith, C.M.; Walajtys, E. Mitochondrial-cytosolic interactions in cardiac tissue: Role of the malate-aspartate cycle in the removal of glycolytic NADH from the cytosol. Symp. Soc. Exp. Biol. 1973, 27, 241–281. [Google Scholar]
  112. Vasington, F.D.; Murphy, J.V. Ca ion uptake by rat kidney mitochondria and its dependence on respiration and phosphorylation. J. Biol. Chem. 1962, 237, 2670–2677. [Google Scholar] [CrossRef]
  113. Carafoli, E.; Lehninger, A.L. A survey of the interaction of calcium ions with mitochondria from different tissues and species. Biochem. J. 1971, 122, 681–690. [Google Scholar] [CrossRef] [PubMed] [Green Version]
  114. Hansford, R.G.; Moreno-Sanchez, R.; Lewartowski, B. Activation of pyruvate dehydrogenase complex by Ca2+ in intact heart, cardiac myocytes, and cardiac mitochondria. Ann. N. Y. Acad. Sci. 1989, 573, 240–253. [Google Scholar] [CrossRef]
  115. Randle, P.J.; Denton, R.M.; Pask, H.T.; Severson, D.L. Calcium ions and the regulation of pyruvate dehydrogenase. Biochem. Soc. Symp. 1974, 75–88. [Google Scholar]
  116. Gellerich, F.N.; Gizatullina, Z.; Trumbeckaite, S.; Nguyen, H.P.; Pallas, T.; Arandarcikaite, O.; Vielhaber, S.; Seppet, E.; Striggow, F. The regulation of OXPHOS by extramitochondrial calcium. Biochim. Biophys. Acta 2010, 1797, 1018–1027. [Google Scholar] [CrossRef] [PubMed] [Green Version]
  117. Cole, E.S.; Lepp, C.A.; Holohan, P.D.; Fondy, T.P. Isolation and characterization of flavin-linked glycerol-3-phosphate dehydrogenase from rabbit skeletal muscle mitochondria and comparison with the enzyme from rabbit brain. J. Biol. Chem. 1978, 253, 7952–7959. [Google Scholar] [CrossRef]
  118. Rutter, G.A.; Denton, R.M. Regulation of NAD+-linked isocitrate dehydrogenase and 2-oxoglutarate dehydrogenase by Ca2+ ions within toluene-permeabilized rat heart mitochondria. Interactions with regulation by adenine nucleotides and NADH/NAD+ ratios. Biochem. J. 1988, 252, 181–189. [Google Scholar] [CrossRef] [PubMed] [Green Version]
  119. Rutter, G.A.; Denton, R.M. The binding of Ca2+ ions to pig heart NAD+-isocitrate dehydrogenase and the 2-oxoglutarate dehydrogenase complex. Biochem. J. 1989, 263, 453–462. [Google Scholar] [CrossRef] [PubMed] [Green Version]
  120. Contreras, L.; Gomez-Puertas, P.; Iijima, M.; Kobayashi, K.; Saheki, T.; Satrústegui, J. Ca2+ Activation kinetics of the two aspartate-glutamate mitochondrial carriers, aralar and citrin: Role in the heart malate-aspartate NADH shuttle. J. Biol. Chem. 2007, 282, 7098–7106. [Google Scholar] [CrossRef] [Green Version]
  121. Qi, F.; Chen, X.; Beard, D.A. Detailed kinetics and regulation of mammalian NAD-linked isocitrate dehydrogenase. Biochim. Biophys. Acta 2008, 1784, 1641–1651. [Google Scholar] [CrossRef] [Green Version]
  122. Contreras, L.; Drago, I.; Zampese, E.; Pozzan, T. Mitochondria: The calcium connection. Biochim. Biophys. Acta 2010, 1797, 607–618. [Google Scholar] [CrossRef] [Green Version]
  123. Nicholls, D.G.; Budd, S.L. Mitochondria and neuronal survival. Physiol. Rev. 2000, 80, 315–360. [Google Scholar] [CrossRef] [Green Version]
  124. Matsuzaki, S.; Szweda, L.I. Inhibition of complex I by Ca2+ reduces electron transport activity and the rate of superoxide anion production in cardiac submitochondrial particles. Biochemistry 2007, 46, 1350–1357. [Google Scholar] [CrossRef]
  125. Lai, J.C.; DiLorenzo, J.C.; Sheu, K.F. Pyruvate dehydrogenase complex is inhibited in calcium-loaded cerebrocortical mitochondria. Neurochem. Res. 1988, 13, 1043–1048. [Google Scholar] [CrossRef]
  126. Abou-Khalil, S.; Abou-Khalil, W.H.; Yunis, A.A. Inhibition of Ca2+ of oxidative phosphorylation in myeloid tumor mitochondria. Arch. Biochem. Biophys. 1981, 209, 460–464. [Google Scholar] [CrossRef]
  127. Malyala, S.; Zhang, Y.; Strubbe, J.O.; Bazil, J.N. Calcium phosphate precipitation inhibits mitochondrial energy metabolism. PLoS Comput. Biol. 2019, 15, e1006719. [Google Scholar] [CrossRef] [PubMed]
Figure 1. Timeline of the experimental protocol (in minutes) for isolated heart and kidney OM mitochondrial respiration experiments under different metabolic substrates at various Ca2+ concentrations. The mitochondria were added at t = 0 min and the substrates and ADP were added at t = 2 min and t = 4 min, respectively. Different concentrations of Ca2+, ranging from 250 µM to 800 µM, were added 1 min after reaching steady state 4 respiration, and this was followed by the addition of the same ADP concentration as the first ADP perturbation. DS3: state 3 duration for the first ADP addition. PM: pyruvate + malate, GM: glutamate + malate, AM: alpha-ketoglutarate + malate, PCM: palmitoyl-l-carnitine + malate, SUC + ROT: succinate + rotenone.
Cells 11 00131 g001
Figure 2. Representative time courses of mitochondrial O2 consumption rates (OCR; JO2) for different respiratory substrates (PM, GM, AM, PCM, and SUC + ROT) in the heart (left panel; (AE) and kidney OM (right panel; (FJ). States 2, 3, and 4 OCR were monitored by adding the substrates at t = 2 min and ADP (200 and 100 µM final concentration for heart and kidney OM mitochondria, respectively) at t = 4 min, which initiated state 3 respiration proceeding to state 4 respiration after the conversion of the added ADP to ATP. Different concentrations of CaCl2 (250, 400, 700, 750, and 800 µM) in the presence of 1 mM Ca2+ chelator EGTA were added in parallel experiments approximately 1 min after reaching the state 4 respiration, and this was followed by the addition of another ADP with the same concentration as used above. The times at which the reagents were added to the mitochondrial suspension are indicated by the vertical arrows.
Cells 11 00131 g002
Figure 3. Summary of the different substrate-dependent respiratory parameters derived from the mitochondrial O2 consumption rates (OCR; JO2) of Figure 2 before adding CaCl2 (CaCl2 = 0) for the heart (upper panel; (AE) and kidney OM (lower panel; (FJ). (A,F) State 2 JO2; (B,G) State 3 JO2; (C,H) State 3 duration of JO2; (D,I) Respiratory control ratio (RCR; state 3/state 2 JO2); and (E,J) PO ratio (ratio of ADP consumed to O2 consumed). Each bar plot represents the mean value ± SEM (n = 4–6). The symbol ‘*’ shows the statistical significance (p < 0.05) based on one-way ANOVA with repeated measures.
Cells 11 00131 g003
Figure 4. Summary of the different respiratory substrate-dependent effects of Ca2+ on mitochondrial state 2 O2 consumption rates (OCR; JO2) for the heart (upper panel) and kidney OM (lower panel). The X-axis shows CaCl2 added to the buffer in the presence of 1 mM Ca2+ chelator EGTA. Each bar plot represents the mean value ± SEM (n = 4–6) of state 2 OCR.
Cells 11 00131 g004
Figure 5. Summary of the different respiratory substrate-dependent effects of Ca2+ on mitochondrial state 3 O2 consumption rate (OCR; JO2) for the heart (upper panel) and kidney OM (lower panel). The X-axis shows CaCl2 added to the buffer in the presence of 1 mM Ca2+ chelator EGTA. Each bar plot represents the mean value ± SEM (n = 4–6) of state 3 OCR. The symbol ‘*’ represents significantly higher results than the baseline state 3 OCR (p < 0.05), while the symbol ‘#’ represents significantly lower results than the peak state 3 OCR (p < 0.05); both are based on one-way ANOVA with repeated measures.
Cells 11 00131 g005
Figure 6. Summary of the different respiratory substrate-dependent effects of Ca2+ on the respiratory control ratio (RCR; state 3/state 2 OCR) for the heart (upper panel) and kidney OM (lower panel) mitochondria. The X-axis shows CaCl2 added to the buffer in the presence of 1 mM Ca2+ chelator EGTA. Each bar plot represents the mean value ± SEM (n = 4–6) of RCR. The symbol ‘*’ denotes significantly higher results than the baseline RCR (p < 0.05), while the symbol ‘#’ denotes significantly lower results than the peak RCR (p < 0.05); both are based on one-way ANOVA with repeated measures.
Cells 11 00131 g006
Figure 7. Summary of the different respiratory substrate-dependent effects of Ca2+ on the heart (upper panel) and kidney OM (lower panel) mitochondrial state 3 duration of OCR. The X-axis shows CaCl2 added to the buffer in the presence of 1 mM Ca2+ chelator EGTA. Each bar plot represents the mean value ± SEM (n = 4–6) of state 3 durations of OCR. ND: not determined.
Cells 11 00131 g007
Figure 8. Comparison of the mitochondrial state 3 O2 consumption rates (OCR; JO2) data between the heart (red points) and kidney OM (blue points) for the different respiratory substrate combinations (A) PM, (B) GM, (C) AM, (D) PCM, and (E) SUC + ROT) used in the study. Solid lines are the nonlinear regression fits of Equation (1) to the data. The X-axis shows [Ca2+]free in the extra-mitochondrial buffer, which is calculated from the added CaCl2 ([Ca2+]total) and 1 mM Ca2+ chelator EGTA based on Table 2.
Cells 11 00131 g008
Figure 9. Estimated values of V0, Vmax, apparent KCa, peak Ca2+ stimulated state 3 JO2, and [Ca2+]free required for achieving the peak Ca2+ stimulated state 3 JO2, and their corresponding 95% confidence intervals obtained based on the nonlinear regression (fitting) of Equation (1) and the state 3 JO2 data from Figure 5. Bar plots in the upper panels (AE) and bottom panels (FJ) represent the parameters for the heart and kidney OM mitochondria, respectively, for different respiratory substrates (PM, GM, AM, PCM, and SUC + ROT). The peak Ca2+ stimulated state 3 JO2 (D,I) and [Ca2+]free required for achieving the Ca2+ peak stimulated state 3 JO2 (E,J) for each substrate and tissue was predicted by the fitting.
Cells 11 00131 g009
Figure 10. This diagram shows the major pathways and processes regulating mitochondrial bioenergetics and Ca2+ homeostasis. It includes mitochondrial substrate transport and oxidation; tricarboxylic acid (TCA) cycle; electron transport chain (ETC), H+ pumping, and oxidative phosphorylation (OxPhos); inorganic phosphate carrier (PIC: Pi-H+ cotransporter); adenine nucleotide translocase (ANT: ATP-ADP exchanger); and H+ leak. It also includes the pathways of mitochondrial Ca2+ uptake, release, and buffering regulating mitochondrial Ca2+ homeostasis (CU: Ca2+ uniporter, NCE: Na+/Ca2+ exchanger, and NHE: Na+/H+ exchanger). The diagram also shows the hypothetical regulatory (activation or inhibition) sites of Ca2+ on mitochondria OxPhos and ATP synthesis. Ca2+ activates mitochondrial dehydrogenase enzymes (PDH: pyruvate dehydrogenase, ICDH: isocitrate dehydrogenase, and OGDH: oxoglutarate dehydrogenase) at low concentrations. However, high concentrations of Ca2+ can inhibit mitochondrial complex I and can result in the opening of a mitochondrial permeability transition pore (PTP), leading to mitochondrial dysfunction.
Cells 11 00131 g010
Table 1. Substrate combinations that were used to measure mitochondrial respiration.
Substrate CodeSubstrates *Final Concentrations
PMPyruvate + Malate5 mM + 2.5 mM
GMGlutamate + Malate5 mM + 2.5 mM
AMAlpha-Ketoglutarate + Malate5 mM + 2.5 mM
PCMPalmitoyl-carnitine + Malate25 µM + 2.5 mM
SUC + ROTSuccinate + Rotenone10 mM + 0.5 µM
* The substrate stock solutions were prepared from sodium-based substrates: monosodium pyruvate, monosodium l-glutamic acid, disodium succinate, disodium malic acid, disodium alpha-ketoglutarate, and palmitoyl-l-carnitine.
Table 2. Conversion between total Ca2+ concentrations ([Ca2+]total) added to the buffer and free Ca2+ concentration ([Ca2+]free). Conversions were made based on Ca2+ chelator calculations [68]. The experimental conditions are: EGTA = 1 mM, ionic strength 0.17, pH 7.2, temperature 37 °C.
[Ca2+]total (µM)[Ca2+]free (nM)
00
250100
400200
700720
750925
8001230
Publisher’s Note: MDPI stays neutral with regard to jurisdictional claims in published maps and institutional affiliations.

