
Omega-3 Fatty Acids DHA and EPA Reduce Bortezomib Resistance in Multiple Myeloma Cells by Promoting Glutathione Degradation

 and
and 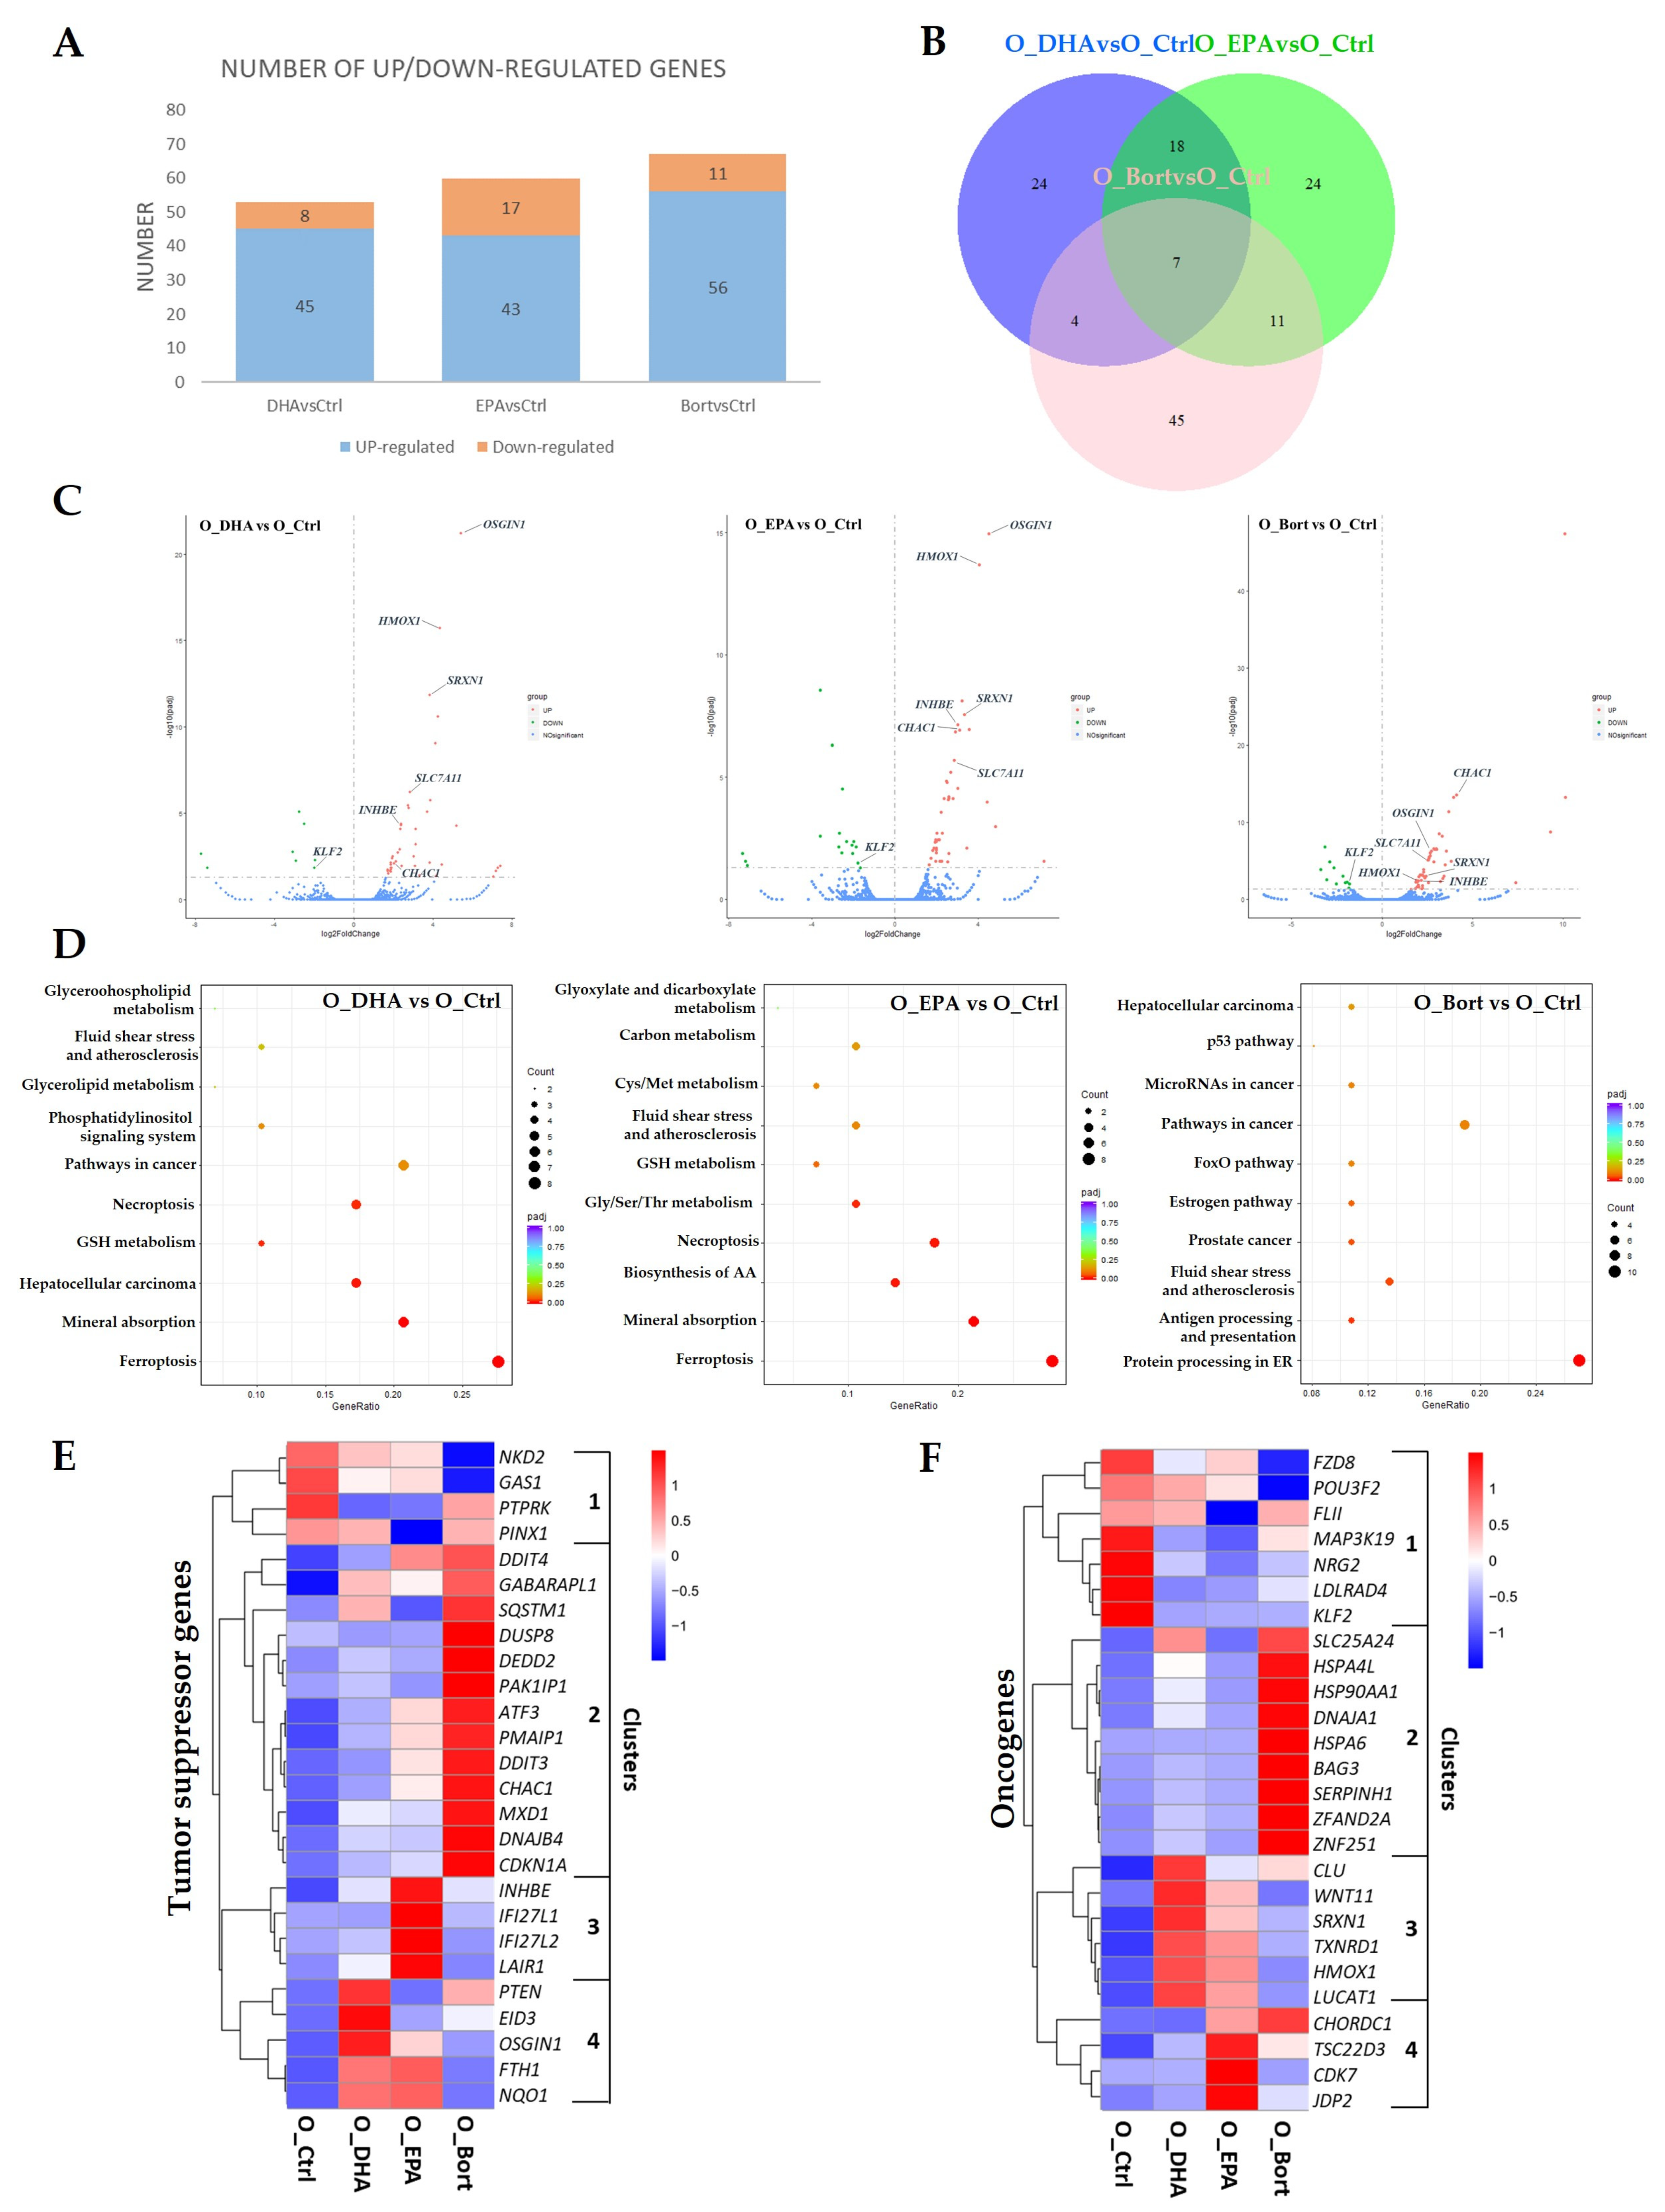
Abstract
1. Introduction
2. Materials and Methods
2.1. Reagents
2.2. Cell Culture
2.3. Cell Death Analysis by Flow Cytometry
2.4. RNA-Seq Differential Gene Expression Analysis
2.5. Metabolomic Analysis
2.6. Statistics
3. Results
3.1. Differential Changes in Transcriptome upon Treatment with DHA, EPA, or Bortezomib in MM Cells
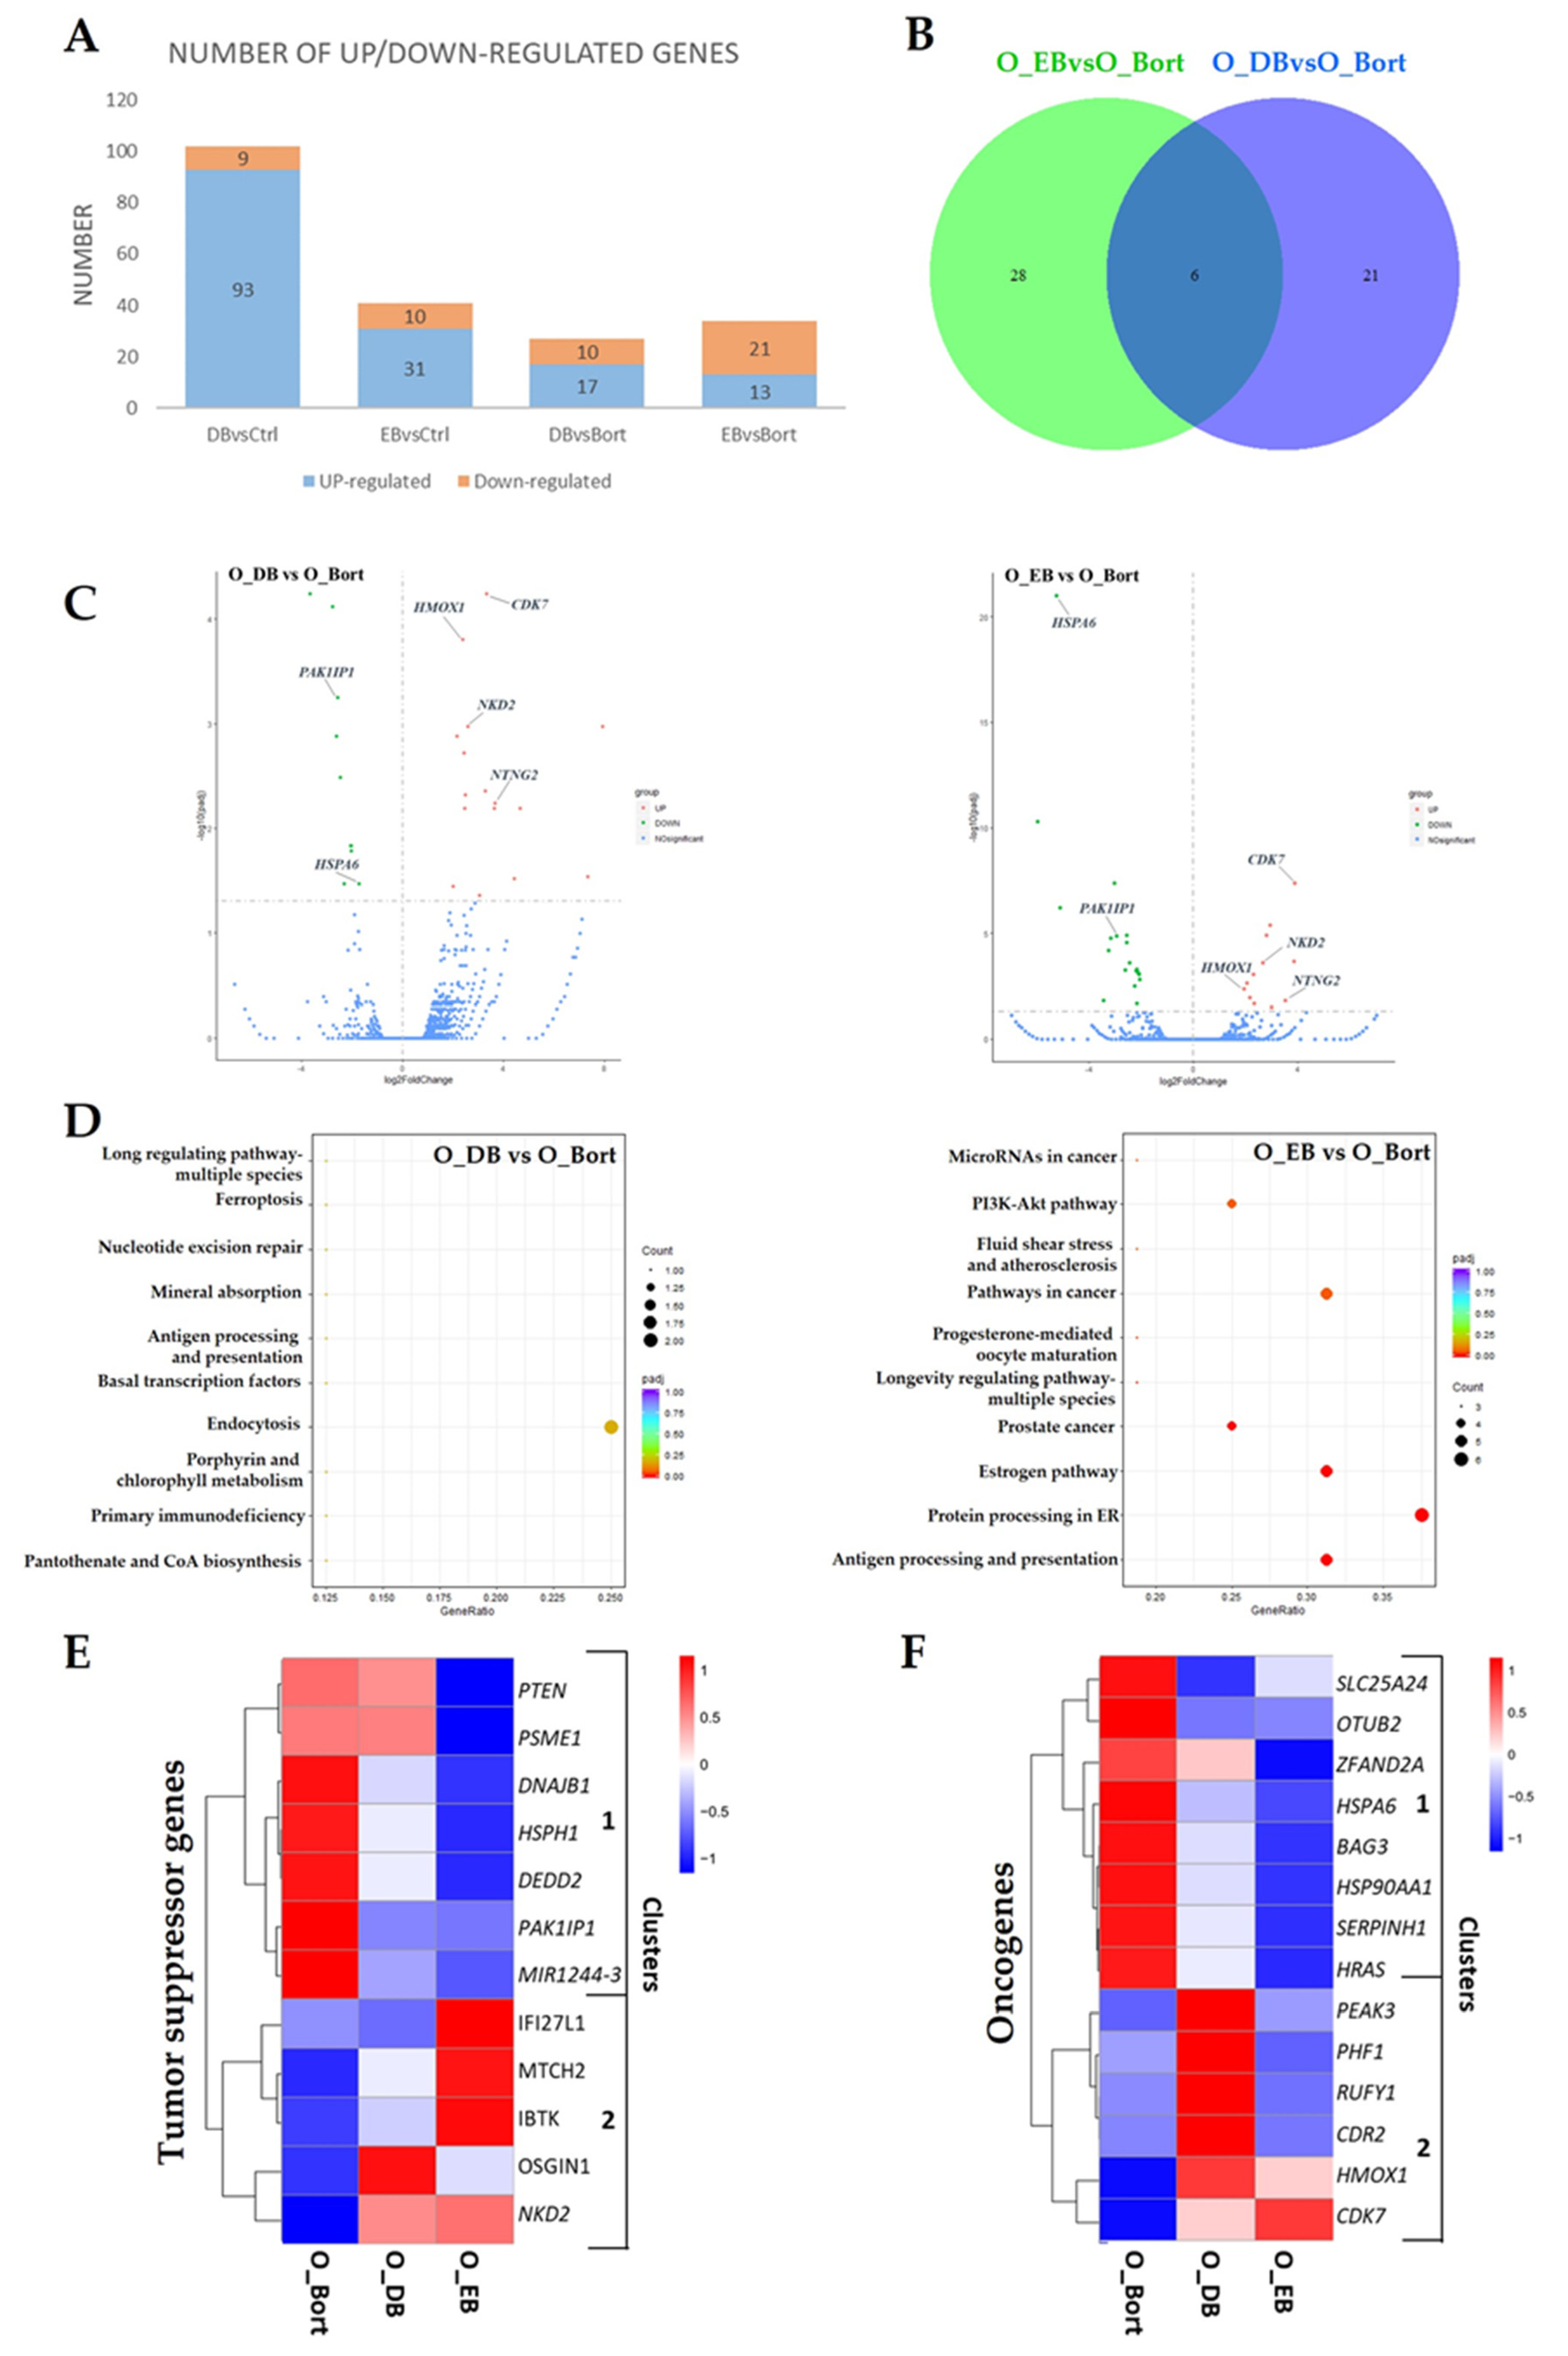
3.2. Differential Changes in Transcriptome upon Simultaneous Treatment with Bortezomib and DHA or EPA in MM Cells
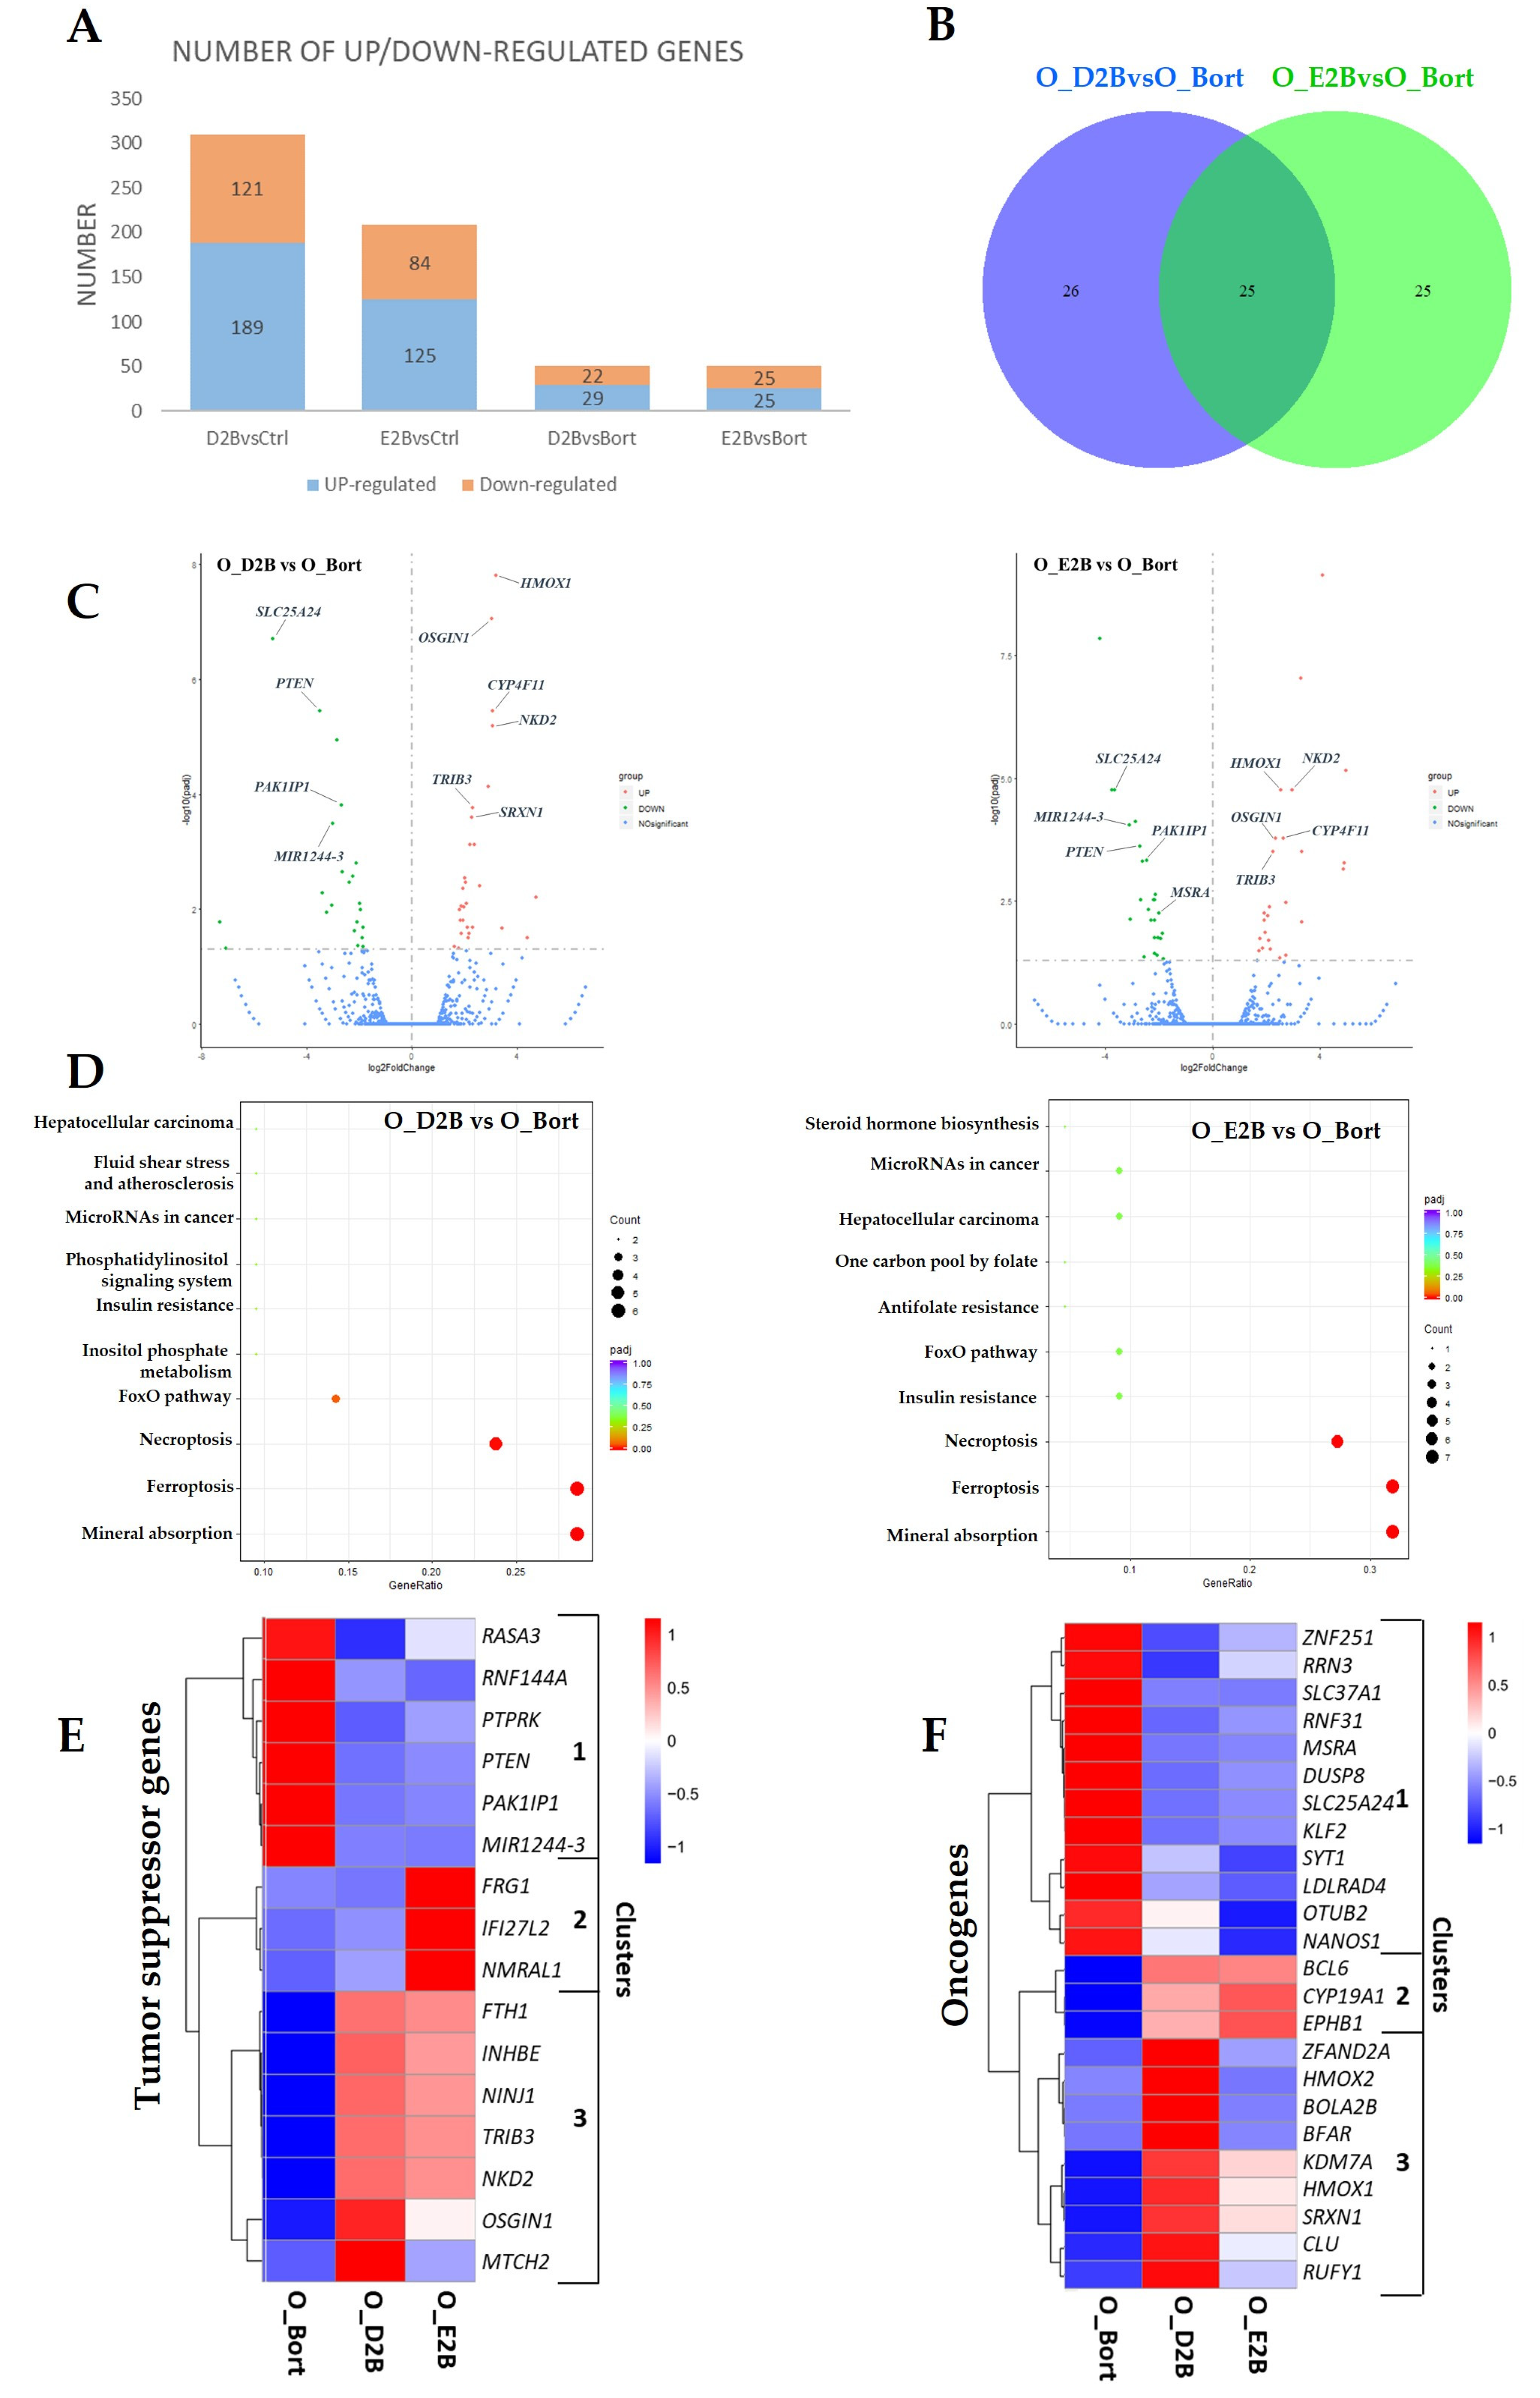
3.3. Differential Changes in Transcriptome upon Pretreatment with DHA or EPA before Bortezomib in MM Cells
3.4. Pretreatment with DHA or EPA before Bortezomib Activates GSH Degradation in MM Cells
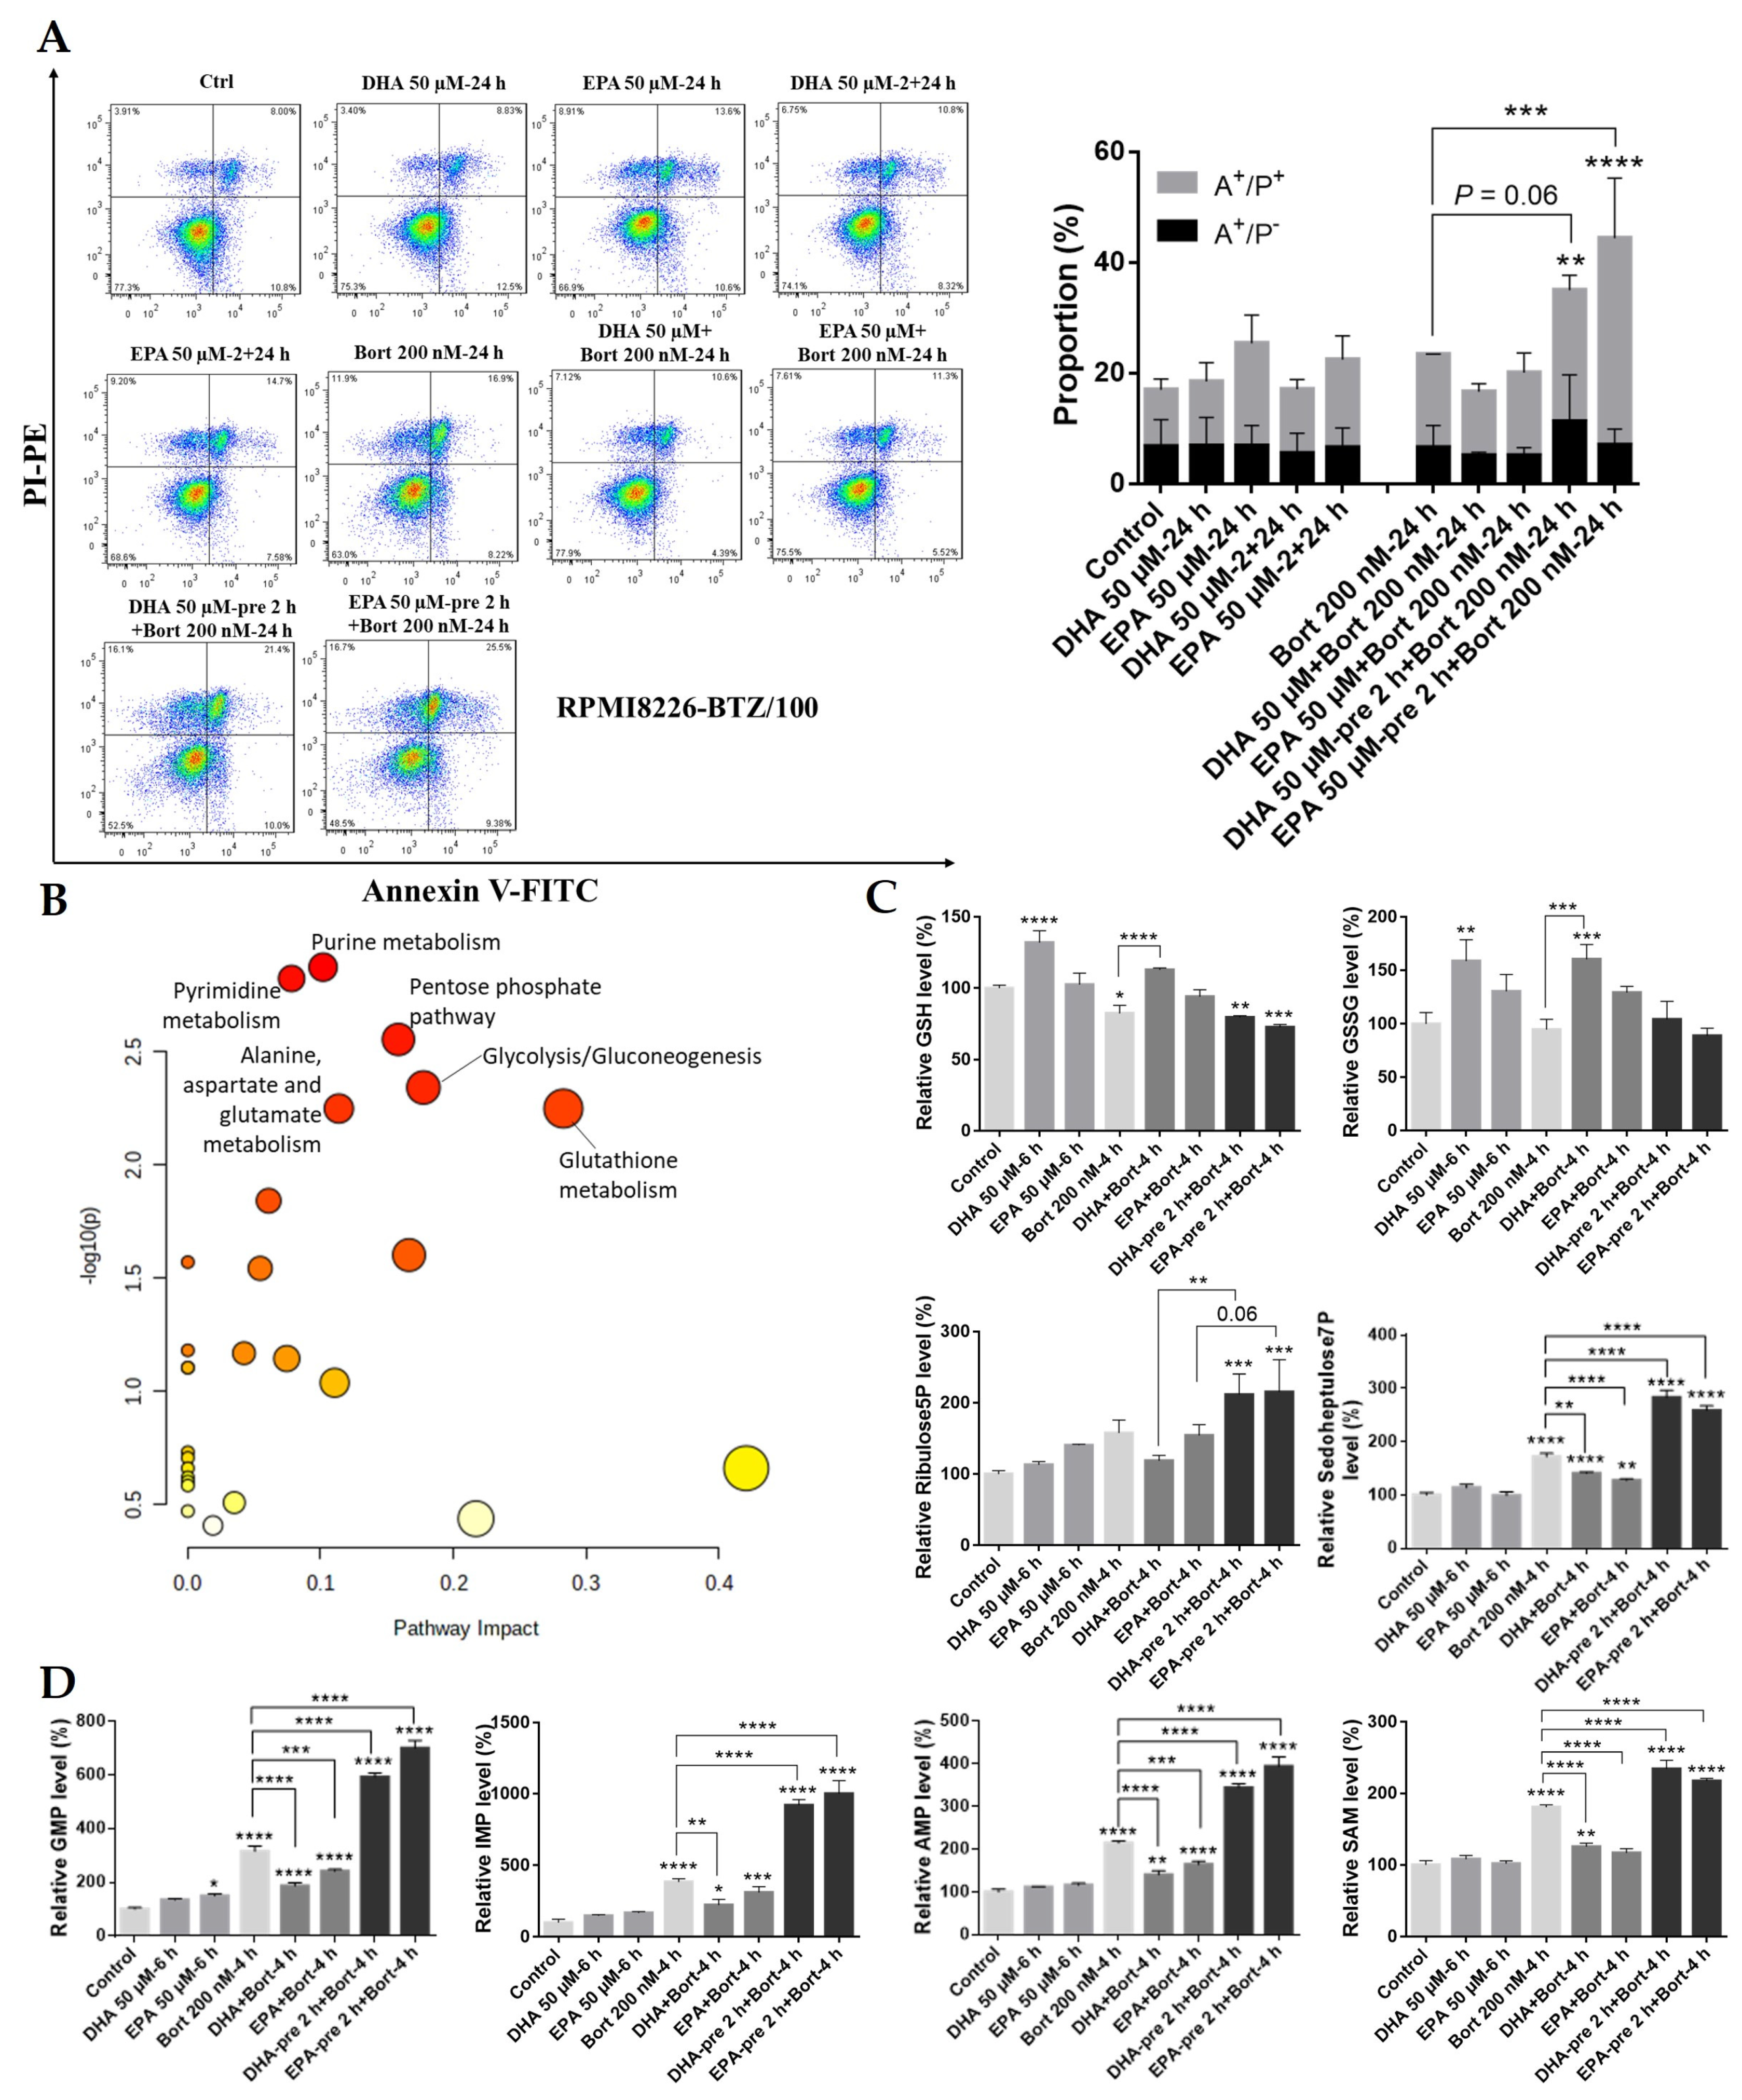
3.5. Pretreatment with DHA or EPA before Bortezomib Activates GSH Degradation in the Bortezomib-Resistant MM Cell Line RPMI8226-BTZ/100
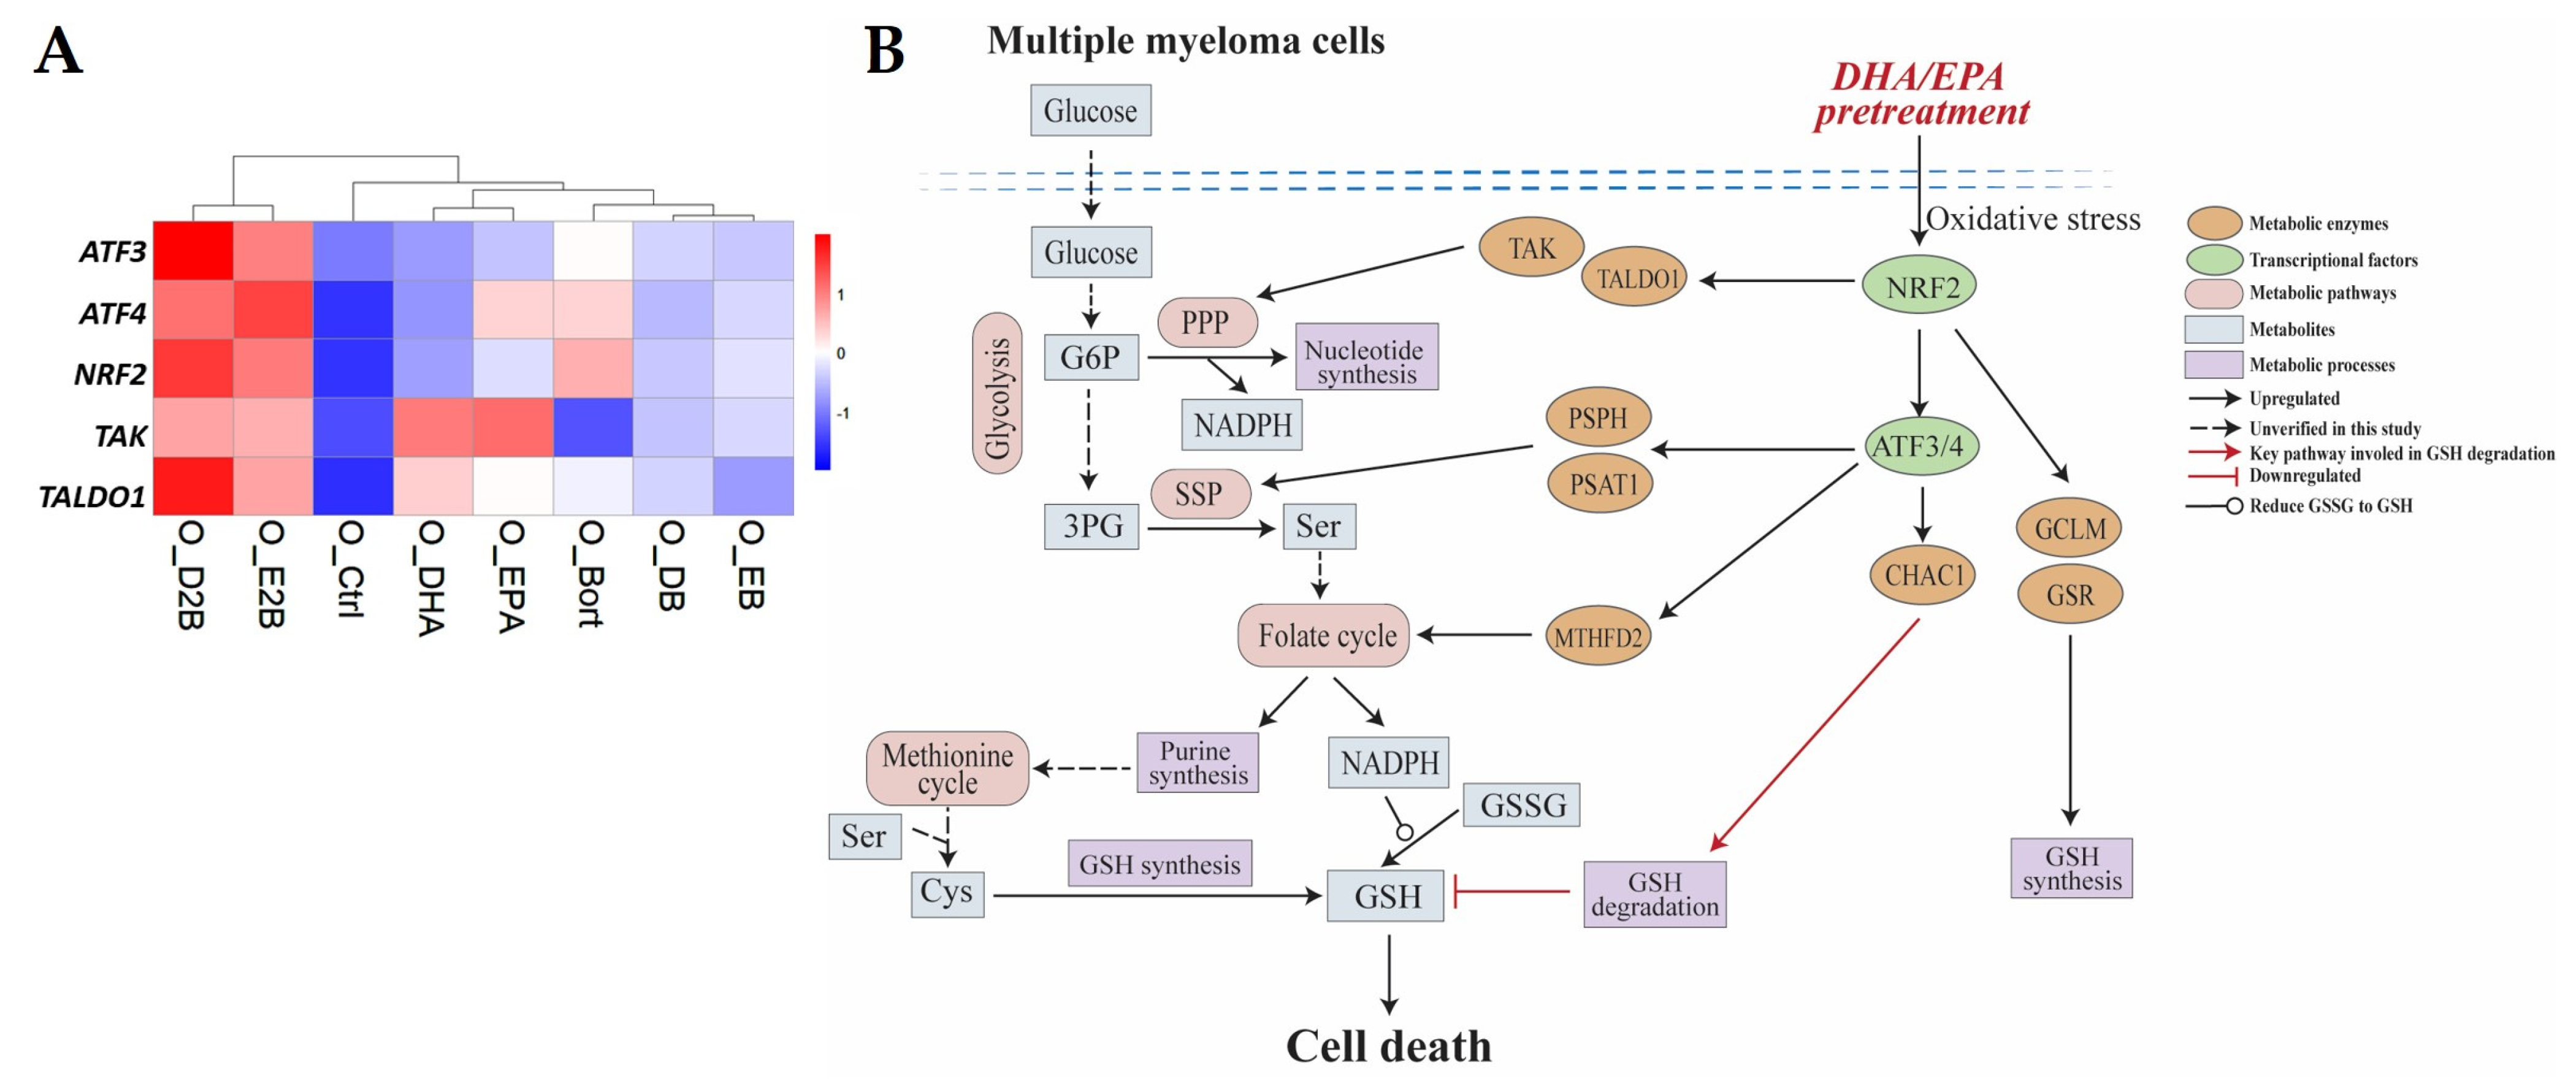
3.6. ATF3/4 Pathway-Regulated GSH Cycle Metabolism Is Activated by DHA/EPA Pretreatment in MM Cells
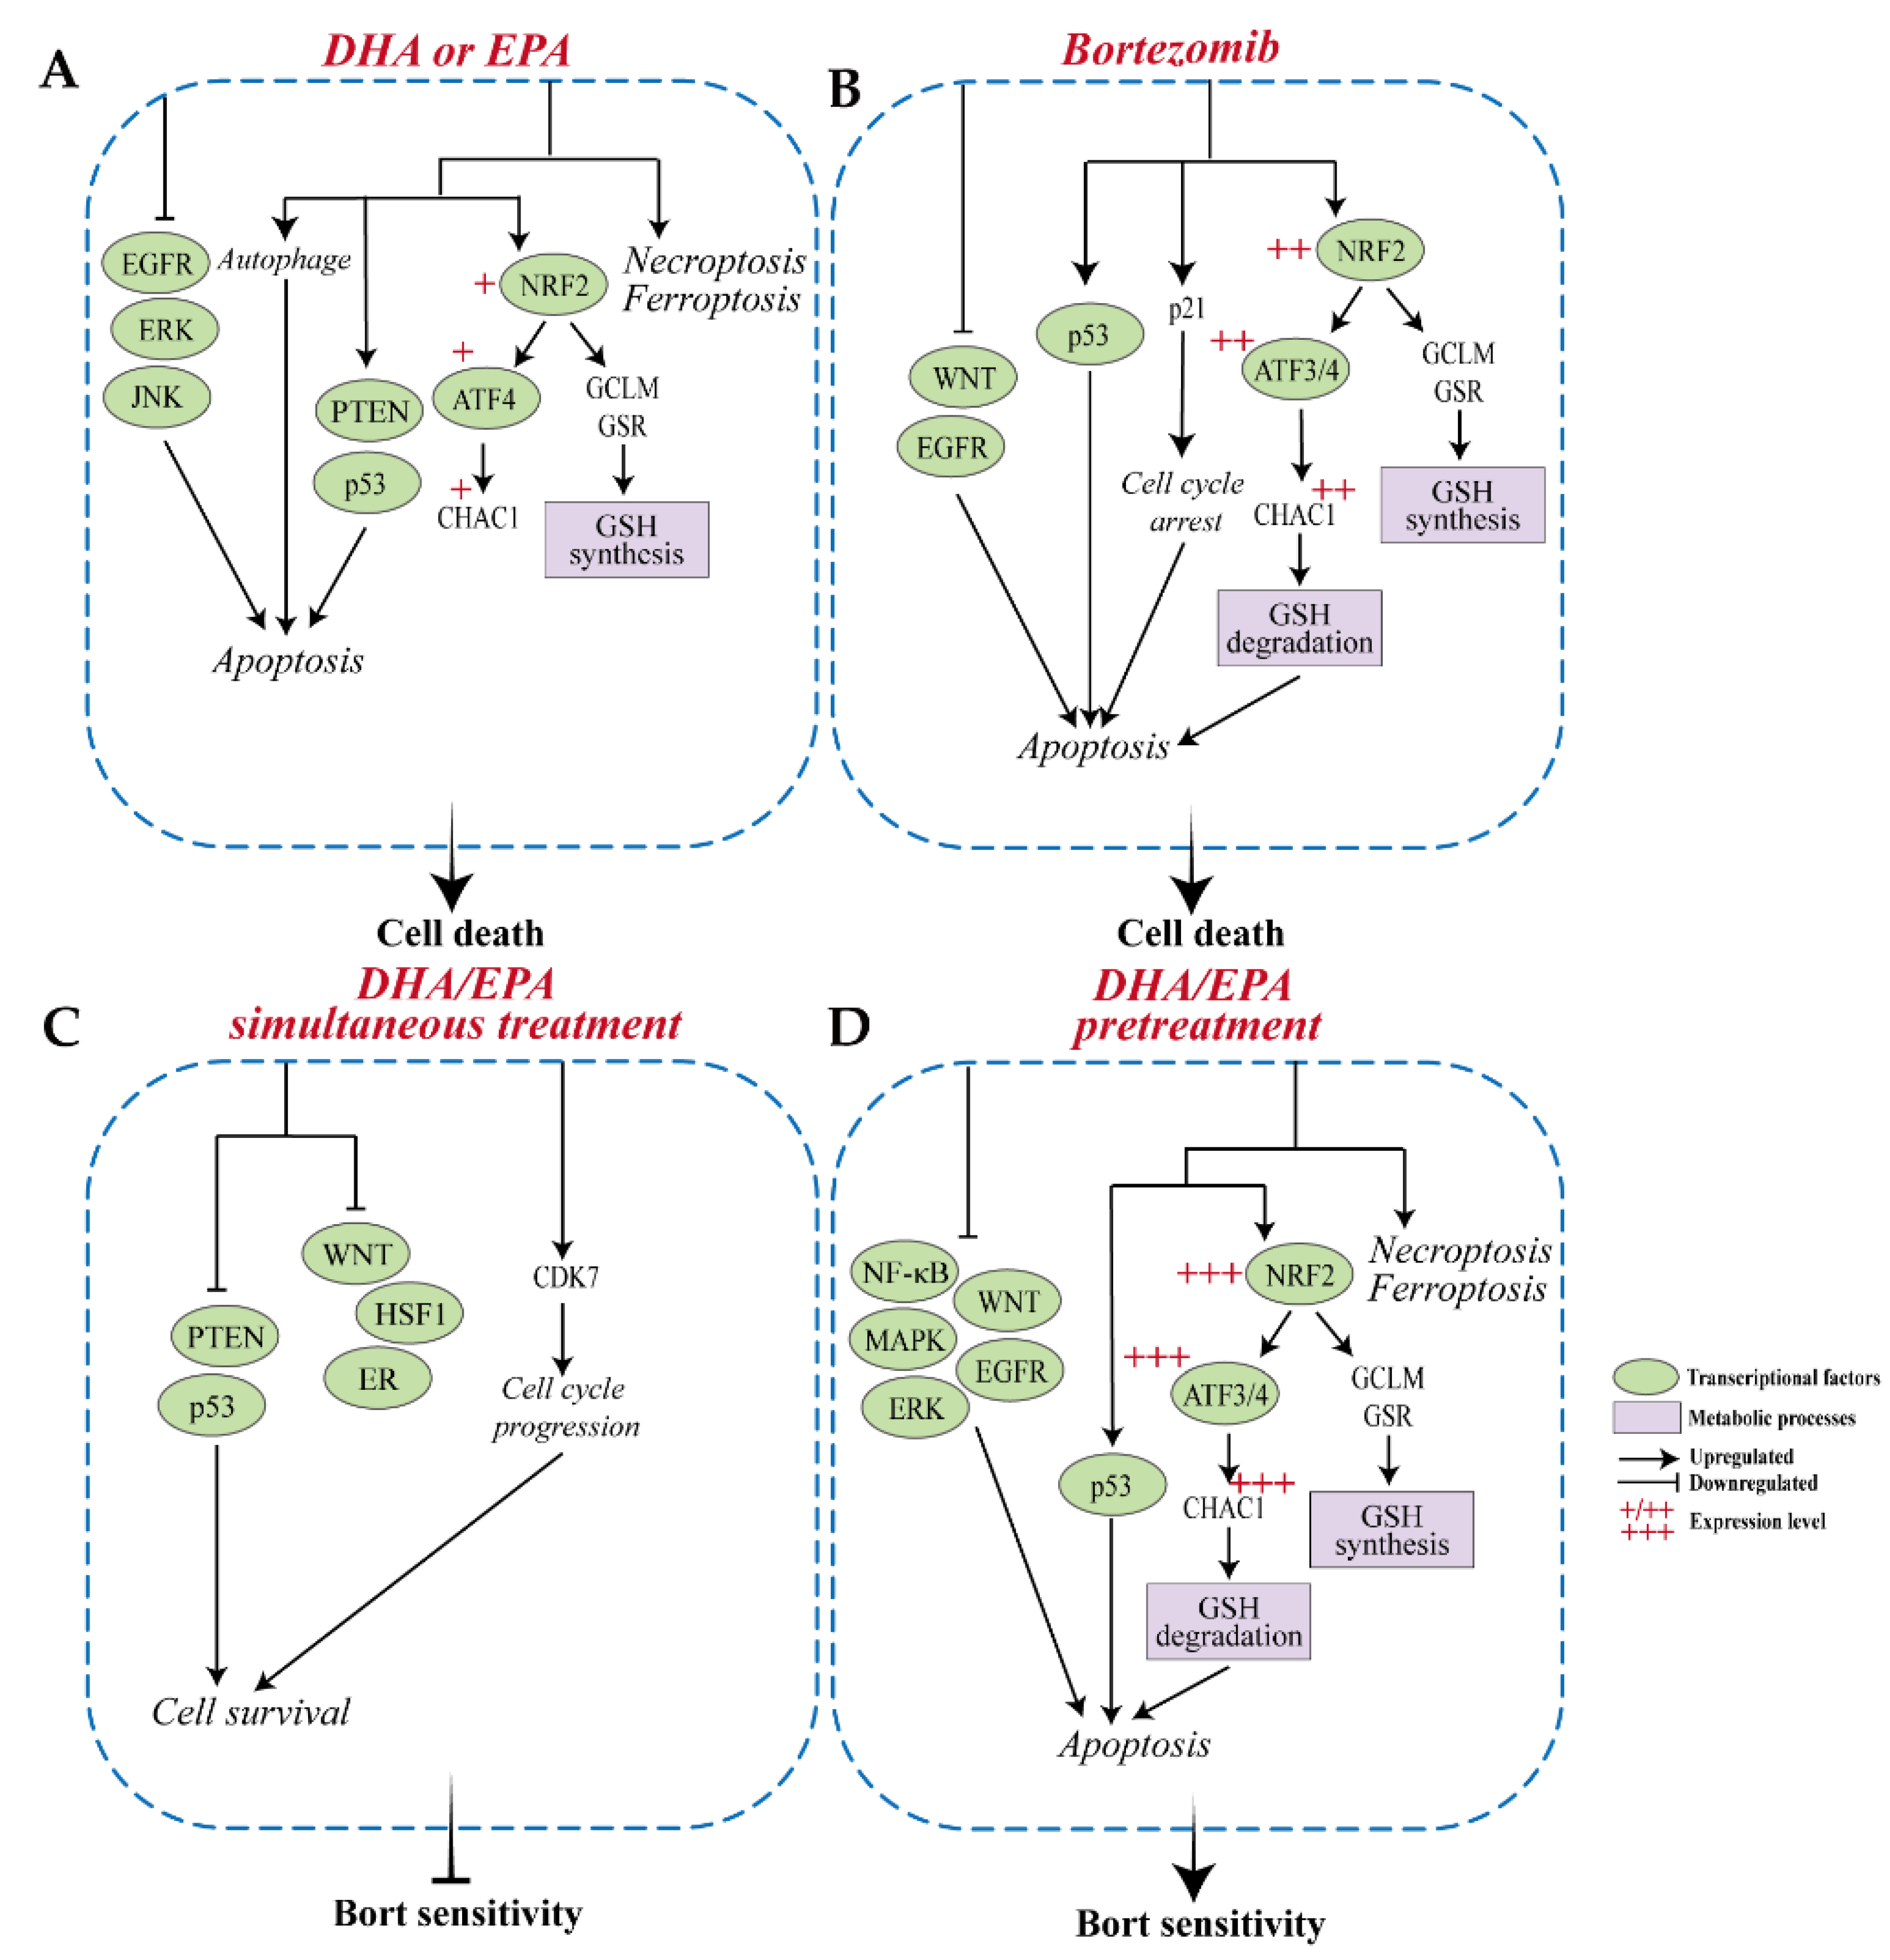
4. Discussion
5. Conclusions
Supplementary Materials
Author Contributions
Funding
Institutional Review Board Statement
Informed Consent Statement
Data Availability Statement
Acknowledgments
Conflicts of Interest
References
- Kumar, S.K.; Rajkumar, V.; Kyle, R.A.; van Duin, M.; Sonneveld, P.; Mateos, M.V.; Gay, F.; Anderson, K.C. Multiple myeloma. Nat. Rev. Dis. Primers 2017, 3, 17046. [Google Scholar] [CrossRef] [PubMed]
- Ma, Y.; Hendershot, L.M. The role of the unfolded protein response in tumour development: Friend or foe? Nat. Rev. Cancer 2004, 4, 966–977. [Google Scholar] [CrossRef]
- Vrabel, D.; Pour, L.; Sevcikova, S. The impact of NF-kappaB signaling on pathogenesis and current treatment strategies in multiple myeloma. Blood Rev. 2019, 34, 56–66. [Google Scholar] [CrossRef]
- Mohan, M.; Matin, A.; Davies, F.E. Update on the optimal use of bortezomib in the treatment of multiple myeloma. Cancer Manag Res. 2017, 9, 51–63. [Google Scholar] [CrossRef]
- Robak, P.; Drozdz, I.; Szemraj, J.; Robak, T. Drug resistance in multiple myeloma. Cancer Treat. Rev. 2018, 70, 199–208. [Google Scholar] [CrossRef]
- Lokhorst, H.M.; Plesner, T.; Laubach, J.P.; Nahi, H.; Gimsing, P.; Hansson, M.; Minnema, M.C.; Lassen, U.; Krejcik, J.; Palumbo, A.; et al. Targeting CD38 with Daratumumab Monotherapy in Multiple Myeloma. N. Engl. J. Med. 2015, 373, 1207–1219. [Google Scholar] [CrossRef] [PubMed]
- Ruckrich, T.; Kraus, M.; Gogel, J.; Beck, A.; Ovaa, H.; Verdoes, M.; Overkleeft, H.S.; Kalbacher, H.; Driessen, C. Characterization of the ubiquitin-proteasome system in bortezomib-adapted cells. Leukemia 2009, 23, 1098–1105. [Google Scholar] [CrossRef] [PubMed]
- Driscoll, J.J.; Chowdhury, R.D. Molecular crosstalk between the proteasome, aggresomes and autophagy: Translational potential and clinical implications. Cancer Lett. 2012, 325, 147–154. [Google Scholar] [CrossRef]
- Anwer, F.; Gee, K.M.; Iftikhar, A.; Baig, M.; Russ, A.D.; Saeed, S.; Zar, M.A.; Razzaq, F.; Carew, J.; Nawrocki, S.; et al. Future of Personalized Therapy Targeting Aberrant Signaling Pathways in Multiple Myeloma. Clin. Lymphoma Myeloma Leuk 2019, 19, 397–405. [Google Scholar] [CrossRef]
- Li, B.; Fu, J.; Chen, P.; Ge, X.; Li, Y.; Kuiatse, I.; Wang, H.; Wang, H.; Zhang, X.; Orlowski, R.Z. The Nuclear Factor (Erythroid-derived 2)-like 2 and Proteasome Maturation Protein Axis Mediate Bortezomib Resistance in Multiple Myeloma. J. Biol. Chem. 2015, 290, 29854–29868. [Google Scholar] [CrossRef] [PubMed]
- Liu, H.L.; Que, W.Z. Establishment of BOR-Resistant U266 Cell Line and the Detection of Its Biol.ogical Activities. Zhong guo Shi Yan Xue Ye Xue Za Zhi 2017, 25, 1722–1726. [Google Scholar] [CrossRef]
- Teoh, P.J.; Chng, W.J. p53 abnormalities and potential therapeutic targeting in multiple myeloma. Biomed. Res. Int. 2014, 2014, 717919. [Google Scholar] [CrossRef] [PubMed]
- Zaal, E.A.; Wu, W.; Jansen, G.; Zweegman, S.; Cloos, J.; Berkers, C.R. Bortezomib resistance in multiple myeloma is associated with increased serine synthesis. Cancer Metab. 2017, 5, 7. [Google Scholar] [CrossRef]
- Maiso, P.; Huynh, D.; Moschetta, M.; Sacco, A.; Aljawai, Y.; Mishima, Y.; Asara, J.M.; Roccaro, A.M.; Kimmelman, A.C.; Ghobrial, I.M. Metabolic signature identifies novel targets for drug resistance in multiple myeloma. Cancer Res. 2015, 75, 2071–2082. [Google Scholar] [CrossRef]
- Mortaz, E.; Moloudizargari, M.; Khosravi, A.; Asghari, M.H.; Movassaghi, M.; Varahram, M.; Vaezi, M.; Redegeld, F.A.; Garssen, J. EPA and DHA have selective toxicity for PBMCs from multiple myeloma patients in a partly caspase-dependent manner. Clin. Nutr. 2020, 39, 2137–2143. [Google Scholar] [CrossRef]
- Abdi, J.; Garssen, J.; Faber, J.; Redegeld, F.A. Omega-3 fatty acids, EPA and DHA induce apoptosis and enhance drug sensitivity in multiple myeloma cells but not in normal peripheral mononuclear cells. J. Nutr. Biochem. 2014, 25, 1254–1262. [Google Scholar] [CrossRef]
- Chen, J.; Garssen, J.; Redegeld, F. The efficacy of bortezomib in human multiple myeloma cells is enhanced by combination with omega-3 fatty acids DHA and EPA: Timing is essential. Clin. Nutr. 2021, 40, 1942–1953. [Google Scholar] [CrossRef]
- Ohguchi, H.; Hideshima, T.; Bhasin, M.K.; Gorgun, G.T.; Santo, L.; Cea, M.; Samur, M.K.; Mimura, N.; Suzuki, R.; Tai, Y.T.; et al. The KDM3A-KLF2-IRF4 axis maintains myeloma cell survival. Nat. Commun. 2016, 7, 10258. [Google Scholar] [CrossRef]
- Tonelli, C.; Chio, I.I.C.; Tuveson, D.A. Transcriptional Regulation by Nrf2. Antioxid. Redox Signal. 2018, 29, 1727–1745. [Google Scholar] [CrossRef] [PubMed]
- Crawford, R.R.; Prescott, E.T.; Sylvester, C.F.; Higdon, A.N.; Shan, J.; Kilberg, M.S.; Mungrue, I.N. Human CHAC1 Protein Degrades Glutathione, and mRNA Induction Is Regulated by the Transcription Factors ATF4 and ATF3 and a Bipartite ATF/CRE Regulatory Element. J. Biol. Chem. 2015, 290, 15878–15891. [Google Scholar] [CrossRef] [PubMed]
- Bruning, A.; Matsingou, C.; Brem, G.J.; Rahmeh, M.; Mylonas, I. Inhibin beta E is upregulated by drug-induced endoplasmic reticulum stress as a transcriptional target gene of ATF4. Toxicol. Appl. Pharmacol. 2012, 264, 300–304. [Google Scholar] [CrossRef]
- Zhao, S.; Kurenbekova, L.; Gao, Y.; Roos, A.; Creighton, C.J.; Rao, P.; Hicks, J.; Man, T.K.; Lau, C.; Brown, A.M.; et al. NKD2, a negative regulator of Wnt signaling, suppresses tumor growth and metastasis in osteosarcoma. Oncogene 2015, 34, 5069–5079. [Google Scholar] [CrossRef]
- Gobeil, S.; Zhu, X.; Doillon, C.J.; Green, M.R. A genome-wide shRNA screen identifies GAS1 as a novel melanoma metastasis suppressor gene. Genes Dev. 2008, 22, 2932–2940. [Google Scholar] [CrossRef] [PubMed]
- Zhou, X.Z.; Lu, K.P. The Pin2/TRF1-interacting protein PinX1 is a potent telomerase inhibitor. Cell 2001, 107, 347–359. [Google Scholar] [CrossRef]
- Shimozato, O.; Waraya, M.; Nakashima, K.; Souda, H.; Takiguchi, N.; Yamamoto, H.; Takenobu, H.; Uehara, H.; Ikeda, E.; Matsushita, S.; et al. Receptor-type protein tyrosine phosphatase kappa directly dephosphorylates CD133 and regulates downstream AKT activation. Oncogene 2015, 34, 1949–1960. [Google Scholar] [CrossRef]
- Li, Q.; Ye, L.; Zhang, X.; Wang, M.; Lin, C.; Huang, S.; Guo, W.; Lai, Y.; Du, H.; Li, J.; et al. FZD8, a target of p53, promotes bone metastasis in prostate cancer by activating canonical Wnt/beta-catenin signaling. Cancer Lett. 2017, 402, 166–176. [Google Scholar] [CrossRef] [PubMed]
- Goodall, J.; Martinozzi, S.; Dexter, T.J.; Champeval, D.; Carreira, S.; Larue, L.; Goding, C.R. Brn-2 expression controls melanoma proliferation and is directly regulated by beta-catenin. Mol. Cell Biol. 2004, 24, 2915–2922. [Google Scholar] [CrossRef] [PubMed]
- Revillion, F.; Lhotellier, V.; Hornez, L.; Bonneterre, J.; Peyrat, J.P. ErbB/HER ligands in human breast cancer, and relationships with their receptors, the bio-pathological features and prognosis. Ann. Oncol. 2008, 19, 73–80. [Google Scholar] [CrossRef]
- Liu, Z.; Huo, X.; Zhao, S.; Yang, J.; Shi, W.; Jing, L.; Li, W.; Li, Y.; Ma, L.; Gao, Y.; et al. Low density lipoprotein receptor class A domain containing 4 (LDLRAD4) promotes tumorigenesis of hepatic cancer cells. Exp. Cell Res. 2017, 360, 189–198. [Google Scholar] [CrossRef] [PubMed]
- He, J.P.; Hou, P.P.; Chen, Q.T.; Wang, W.J.; Sun, X.Y.; Yang, P.B.; Li, Y.P.; Yao, L.M.; Li, X.; Jiang, X.D.; et al. Flightless-I Blocks p62-Mediated Recognition of LC3 to Impede Selective Autophagy and Promote Breast Cancer Progression. Cancer Res. 2018, 78, 4853–4864. [Google Scholar] [CrossRef]
- Choi, S.S.; Lee, S.K.; Kim, J.K.; Park, H.K.; Lee, E.; Jang, J.; Lee, Y.H.; Khim, K.W.; Hyun, J.M.; Eom, H.J.; et al. Flightless-1 inhibits ER stress-induced apoptosis in colorectal cancer cells by regulating Ca(2+) homeostasis. Exp. Mol. Med. 2020, 52, 940–950. [Google Scholar] [CrossRef] [PubMed]
- Hoang, V.T.; Nyswaner, K.; Torres-Ayuso, P.; Brognard, J. The protein kinase MAP3K19 phosphorylates MAP2Ks and thereby activates ERK and JNK kinases and increases viability of KRAS-mutant lung cancer cells. J. Biol. Chem. 2020, 295, 8470–8479. [Google Scholar] [CrossRef]
- Wu, J.; Liu, T.; Rios, Z.; Mei, Q.; Lin, X.; Cao, S. Heat Shock Proteins and Cancer. Trends Pharmacol. Sci 2017, 38, 226–256. [Google Scholar] [CrossRef] [PubMed]
- Yu, W.; Qiu, Z.; Gao, N.; Wang, L.; Cui, H.; Qian, Y.; Jiang, L.; Luo, J.; Yi, Z.; Lu, H.; et al. PAK1IP1, a ribosomal stress-induced nucleolar protein, regulates cell proliferation via the p53-MDM2 loop. Nucleic Acids Res. 2011, 39, 2234–2248. [Google Scholar] [CrossRef] [PubMed]
- Schachter, M.M.; Merrick, K.A.; Larochelle, S.; Hirschi, A.; Zhang, C.; Shokat, K.M.; Rubin, S.M.; Fisher, R.P. A Cdk7-Cdk4 T-loop phosphorylation cascade promotes G1 progression. Mol. Cell 2013, 50, 250–260. [Google Scholar] [CrossRef]
- Hao, W.; Yu, M.; Lin, J.; Liu, B.; Xing, H.; Yang, J.; Sun, D.; Chen, F.; Jiang, M.; Tang, C.; et al. The pan-cancer landscape of netrin family reveals potential oncogenic biomarkers. Sci. Rep. 2020, 10, 5224. [Google Scholar] [CrossRef]
- Ozerova, M.; Nefedova, Y. Estrogen promotes multiple myeloma through enhancing the immunosuppressive activity of MDSC. Leuk Lymphoma 2019, 60, 1557–1562. [Google Scholar] [CrossRef]
- Li, G.J.; Zhao, G.Q.; Yang, J.P.; Zhou, Y.C.; Yang, K.Y.; Lei, Y.J.; Huang, Y.C. Effect of miR-1244 on cisplatin-treated non-small cell lung cancer via MEF2D expression. Oncol. Rep. 2017, 37, 3475–3483. [Google Scholar] [CrossRef]
- Lopez, M.L.; Lo, M.; Kung, J.E.; Dudkiewicz, M.; Jang, G.M.; Von Dollen, J.; Johnson, J.R.; Krogan, N.J.; Pawlowski, K.; Jura, N. PEAK3/C19orf35 pseudokinase, a new NFK3 kinase family member, inhibits CrkII through dimerization. Proc. Natl. Acad. Sci. USA 2019, 116, 15495–15504. [Google Scholar] [CrossRef]
- Liu, R.; Gao, J.; Yang, Y.; Qiu, R.; Zheng, Y.; Huang, W.; Zeng, Y.; Hou, Y.; Wang, S.; Leng, S.; et al. PHD finger protein 1 (PHF1) is a novel reader for histone H4R3 symmetric dimethylation and coordinates with PRMT5-WDR77/CRL4B complex to promote tumorigenesis. Nucleic Acids Res. 2018, 46, 6608–6626. [Google Scholar] [CrossRef]
- Xie, R.; Wang, J.; Liu, X.; Wu, L.; Zhang, H.; Tang, W.; Li, Y.; Xiang, L.; Peng, Y.; Huang, X.; et al. RUFY3 interaction with FOXK1 promotes invasion and metastasis in colorectal cancer. Sci. Rep. 2017, 7, 3709. [Google Scholar] [CrossRef]
- Balamurugan, K.; Luu, V.D.; Kaufmann, M.R.; Hofmann, V.S.; Boysen, G.; Barth, S.; Bordoli, M.R.; Stiehl, D.P.; Moch, H.; Schraml, P.; et al. Onconeuronal cerebellar degeneration-related antigen, Cdr2, is strongly expressed in papillary renal cell carcinoma and leads to attenuated hypoxic response. Oncogene 2009, 28, 3274–3285. [Google Scholar] [CrossRef][Green Version]
- Zaltsman, Y.; Shachnai, L.; Yivgi-Ohana, N.; Schwarz, M.; Maryanovich, M.; Houtkooper, R.H.; Vaz, F.M.; De Leonardis, F.; Fiermonte, G.; Palmieri, F.; et al. MTCH2/MIMP is a major facilitator of tBID recruitment to mitochondria. Nat. Cell Biol. 2010, 12, 553–562. [Google Scholar] [CrossRef]
- Cho, S.J.; Rossi, A.; Jung, Y.S.; Yan, W.; Liu, G.; Zhang, J.; Zhang, M.; Chen, X. Ninjurin1, a target of p53, regulates p53 expression and p53-dependent cell survival, senescence, and radiation-induced mortality. Proc. Natl. Acad. Sci. USA 2013, 110, 9362–9367. [Google Scholar] [CrossRef]
- Tiwari, A.; Mukherjee, B.; Hassan, M.K.; Pattanaik, N.; Jaiswal, A.M.; Dixit, M. Reduced FRG1 expression promotes prostate cancer progression and affects prostate cancer cell migration and invasion. BMC Cancer 2019, 19, 346. [Google Scholar] [CrossRef]
- Gytz, H.; Hansen, M.F.; Skovbjerg, S.; Kristensen, A.C.; Horlyck, S.; Jensen, M.B.; Fredborg, M.; Markert, L.D.; McMillan, N.A.; Christensen, E.I.; et al. Apoptotic properties of the type 1 interferon induced family of human mitochondrial membrane ISG12 proteins. Biol. Cell 2017, 109, 94–112. [Google Scholar] [CrossRef] [PubMed]
- Gan, Q.; Li, T.; Hu, B.; Lian, M.; Zheng, X. HSCARG inhibits activation of NF-kappaB by interacting with IkappaB kinase-beta. J. Cell Sci. 2009, 122, 4081–4088. [Google Scholar] [CrossRef]
- Kennedy, L.; Sandhu, J.K.; Harper, M.E.; Cuperlovic-Culf, M. Role of Glutathione in Cancer: From Mechanisms to Therapies. Biomolecules 2020, 10, 1429. [Google Scholar] [CrossRef] [PubMed]
- Yang, M.; Vousden, K.H. Serine and one-carbon metabolism in cancer. Nat. Rev. Cancer 2016, 16, 650–662. [Google Scholar] [CrossRef]
- He, C.H.; Gong, P.; Hu, B.; Stewart, D.; Choi, M.E.; Choi, A.M.; Alam, J. Identification of activating transcription factor 4 (ATF4) as an Nrf2-interacting protein. Implication for heme oxygenase-1 gene regulation. J. Biol. Chem. 2001, 276, 20858–20865. [Google Scholar] [CrossRef]
- Kim, K.H.; Jeong, J.Y.; Surh, Y.J.; Kim, K.W. Expression of stress-response ATF3 is mediated by Nrf2 in astrocytes. Nucleic Acids Res. 2010, 38, 48–59. [Google Scholar] [CrossRef] [PubMed]
- Rouzer, C.A.; Scott, W.A.; Griffith, O.W.; Hamill, A.L.; Cohn, Z.A. Glutathione metabolism in resting and phagocytizing peritoneal macrophages. J. Biol. Chem. 1982, 257, 2002–2008. [Google Scholar] [CrossRef]
- Ohshima-Hosoyama, S.; Davare, M.A.; Hosoyama, T.; Nelon, L.D.; Keller, C. Bortezomib stabilizes NOXA and triggers ROS-associated apoptosis in medulloblastoma. J. Neurooncol. 2011, 105, 475–483. [Google Scholar] [CrossRef]
- Du, Z.X.; Zhang, H.Y.; Meng, X.; Guan, Y.; Wang, H.Q. Role of oxidative stress and intracellular glutathione in the sensitivity to apoptosis induced by proteasome inhibitor in thyroid cancer cells. BMC Cancer 2009, 9, 56. [Google Scholar] [CrossRef] [PubMed]
- Caillot, M.; Zylbersztejn, F.; Maitre, E.; Bourgeais, J.; Herault, O.; Sola, B. ROS Overproduction Sensitises Myeloma Cells to Bortezomib-Induced Apoptosis and Alleviates Tumour Microenvironment-Mediated Cell Resistance. Cells 2020, 9, 2357. [Google Scholar] [CrossRef] [PubMed]
- Nerini-Molteni, S.; Ferrarini, M.; Cozza, S.; Caligaris-Cappio, F.; Sitia, R. Redox homeostasis modulates the sensitivity of myeloma cells to bortezomib. Br. J. Haematol. 2008, 141, 494–503. [Google Scholar] [CrossRef]
- Starheim, K.K.; Holien, T.; Misund, K.; Johansson, I.; Baranowska, K.A.; Sponaas, A.M.; Hella, H.; Buene, G.; Waage, A.; Sundan, A.; et al. Intracellular glutathione determines bortezomib cytotoxicity in multiple myeloma cells. Blood Cancer J. 2016, 6, e446. [Google Scholar] [CrossRef]
- Pelzer, A.E.; Bektic, J.; Haag, P.; Berger, A.P.; Pycha, A.; Schafer, G.; Rogatsch, H.; Horninger, W.; Bartsch, G.; Klocker, H. The expression of transcription factor activating transcription factor 3 in the human prostate and its regulation by androgen in prostate cancer. J. Urol. 2006, 175, 1517–1522. [Google Scholar] [CrossRef]
- Wang, Z.; Xu, D.; Ding, H.F.; Kim, J.; Zhang, J.; Hai, T.; Yan, C. Loss of ATF3 promotes Akt activation and prostate cancer development in a Pten knockout mouse model. Oncogene 2015, 34, 4975–4984. [Google Scholar] [CrossRef]
- Wang, H.; Jiang, M.; Cui, H.; Chen, M.; Buttyan, R.; Hayward, S.W.; Hai, T.; Wang, Z.; Yan, C. The stress response mediator ATF3 represses androgen signaling by binding the androgen receptor. Mol. Cell Biol. 2012, 32, 3190–3202. [Google Scholar] [CrossRef] [PubMed]
- Bottone, F.G., Jr.; Moon, Y.; Kim, J.S.; Alston-Mills, B.; Ishibashi, M.; Eling, T.E. The anti-invasive activity of cyclooxygenase inhibitors is regulated by the transcription factor ATF3 (activating transcription factor 3). Mol. Cancer Ther. 2005, 4, 693–703. [Google Scholar] [CrossRef] [PubMed]
- Wu, Z.Y.; Wei, Z.M.; Sun, S.J.; Yuan, J.; Jiao, S.C. Activating transcription factor 3 promotes colon cancer metastasis. Tumour Biol. 2014, 35, 8329–8334. [Google Scholar] [CrossRef] [PubMed]
- Narita, T.; Ri, M.; Masaki, A.; Mori, F.; Ito, A.; Kusumoto, S.; Ishida, T.; Komatsu, H.; Iida, S. Lower expression of activating transcription factors 3 and 4 correlates with shorter progression-free survival in multiple myeloma patients receiving bortezomib plus dexamethasone therapy. Blood Cancer J. 2015, 5, e373. [Google Scholar] [CrossRef] [PubMed]


Publisher’s Note: MDPI stays neutral with regard to jurisdictional claims in published maps and institutional affiliations. |
© 2021 by the authors. Licensee MDPI, Basel, Switzerland. This article is an open access article distributed under the terms and conditions of the Creative Commons Attribution (CC BY) license (https://creativecommons.org/licenses/by/4.0/).
Share and Cite
Chen, J.; Zaal, E.A.; Berkers, C.R.; Ruijtenbeek, R.; Garssen, J.; Redegeld, F.A. Omega-3 Fatty Acids DHA and EPA Reduce Bortezomib Resistance in Multiple Myeloma Cells by Promoting Glutathione Degradation. Cells 2021, 10, 2287. https://doi.org/10.3390/cells10092287
Chen J, Zaal EA, Berkers CR, Ruijtenbeek R, Garssen J, Redegeld FA. Omega-3 Fatty Acids DHA and EPA Reduce Bortezomib Resistance in Multiple Myeloma Cells by Promoting Glutathione Degradation. Cells. 2021; 10(9):2287. https://doi.org/10.3390/cells10092287
Chicago/Turabian StyleChen, Jing, Esther A. Zaal, Celia R. Berkers, Rob Ruijtenbeek, Johan Garssen, and Frank A. Redegeld. 2021. "Omega-3 Fatty Acids DHA and EPA Reduce Bortezomib Resistance in Multiple Myeloma Cells by Promoting Glutathione Degradation" Cells 10, no. 9: 2287. https://doi.org/10.3390/cells10092287
APA StyleChen, J., Zaal, E. A., Berkers, C. R., Ruijtenbeek, R., Garssen, J., & Redegeld, F. A. (2021). Omega-3 Fatty Acids DHA and EPA Reduce Bortezomib Resistance in Multiple Myeloma Cells by Promoting Glutathione Degradation. Cells, 10(9), 2287. https://doi.org/10.3390/cells10092287