
Loss of Ubiquitin Carboxy-Terminal Hydrolase L1 Impairs Long-Term Differentiation Competence and Metabolic Regulation in Murine Spermatogonial Stem Cells

 , , , ,
Abstract
1. Introduction
2. Materials and Methods
2.1. Mice
2.2. Cell Sorting and Culture
2.3. Histology and Immunohistochemistry
2.4. TUNEL Assay
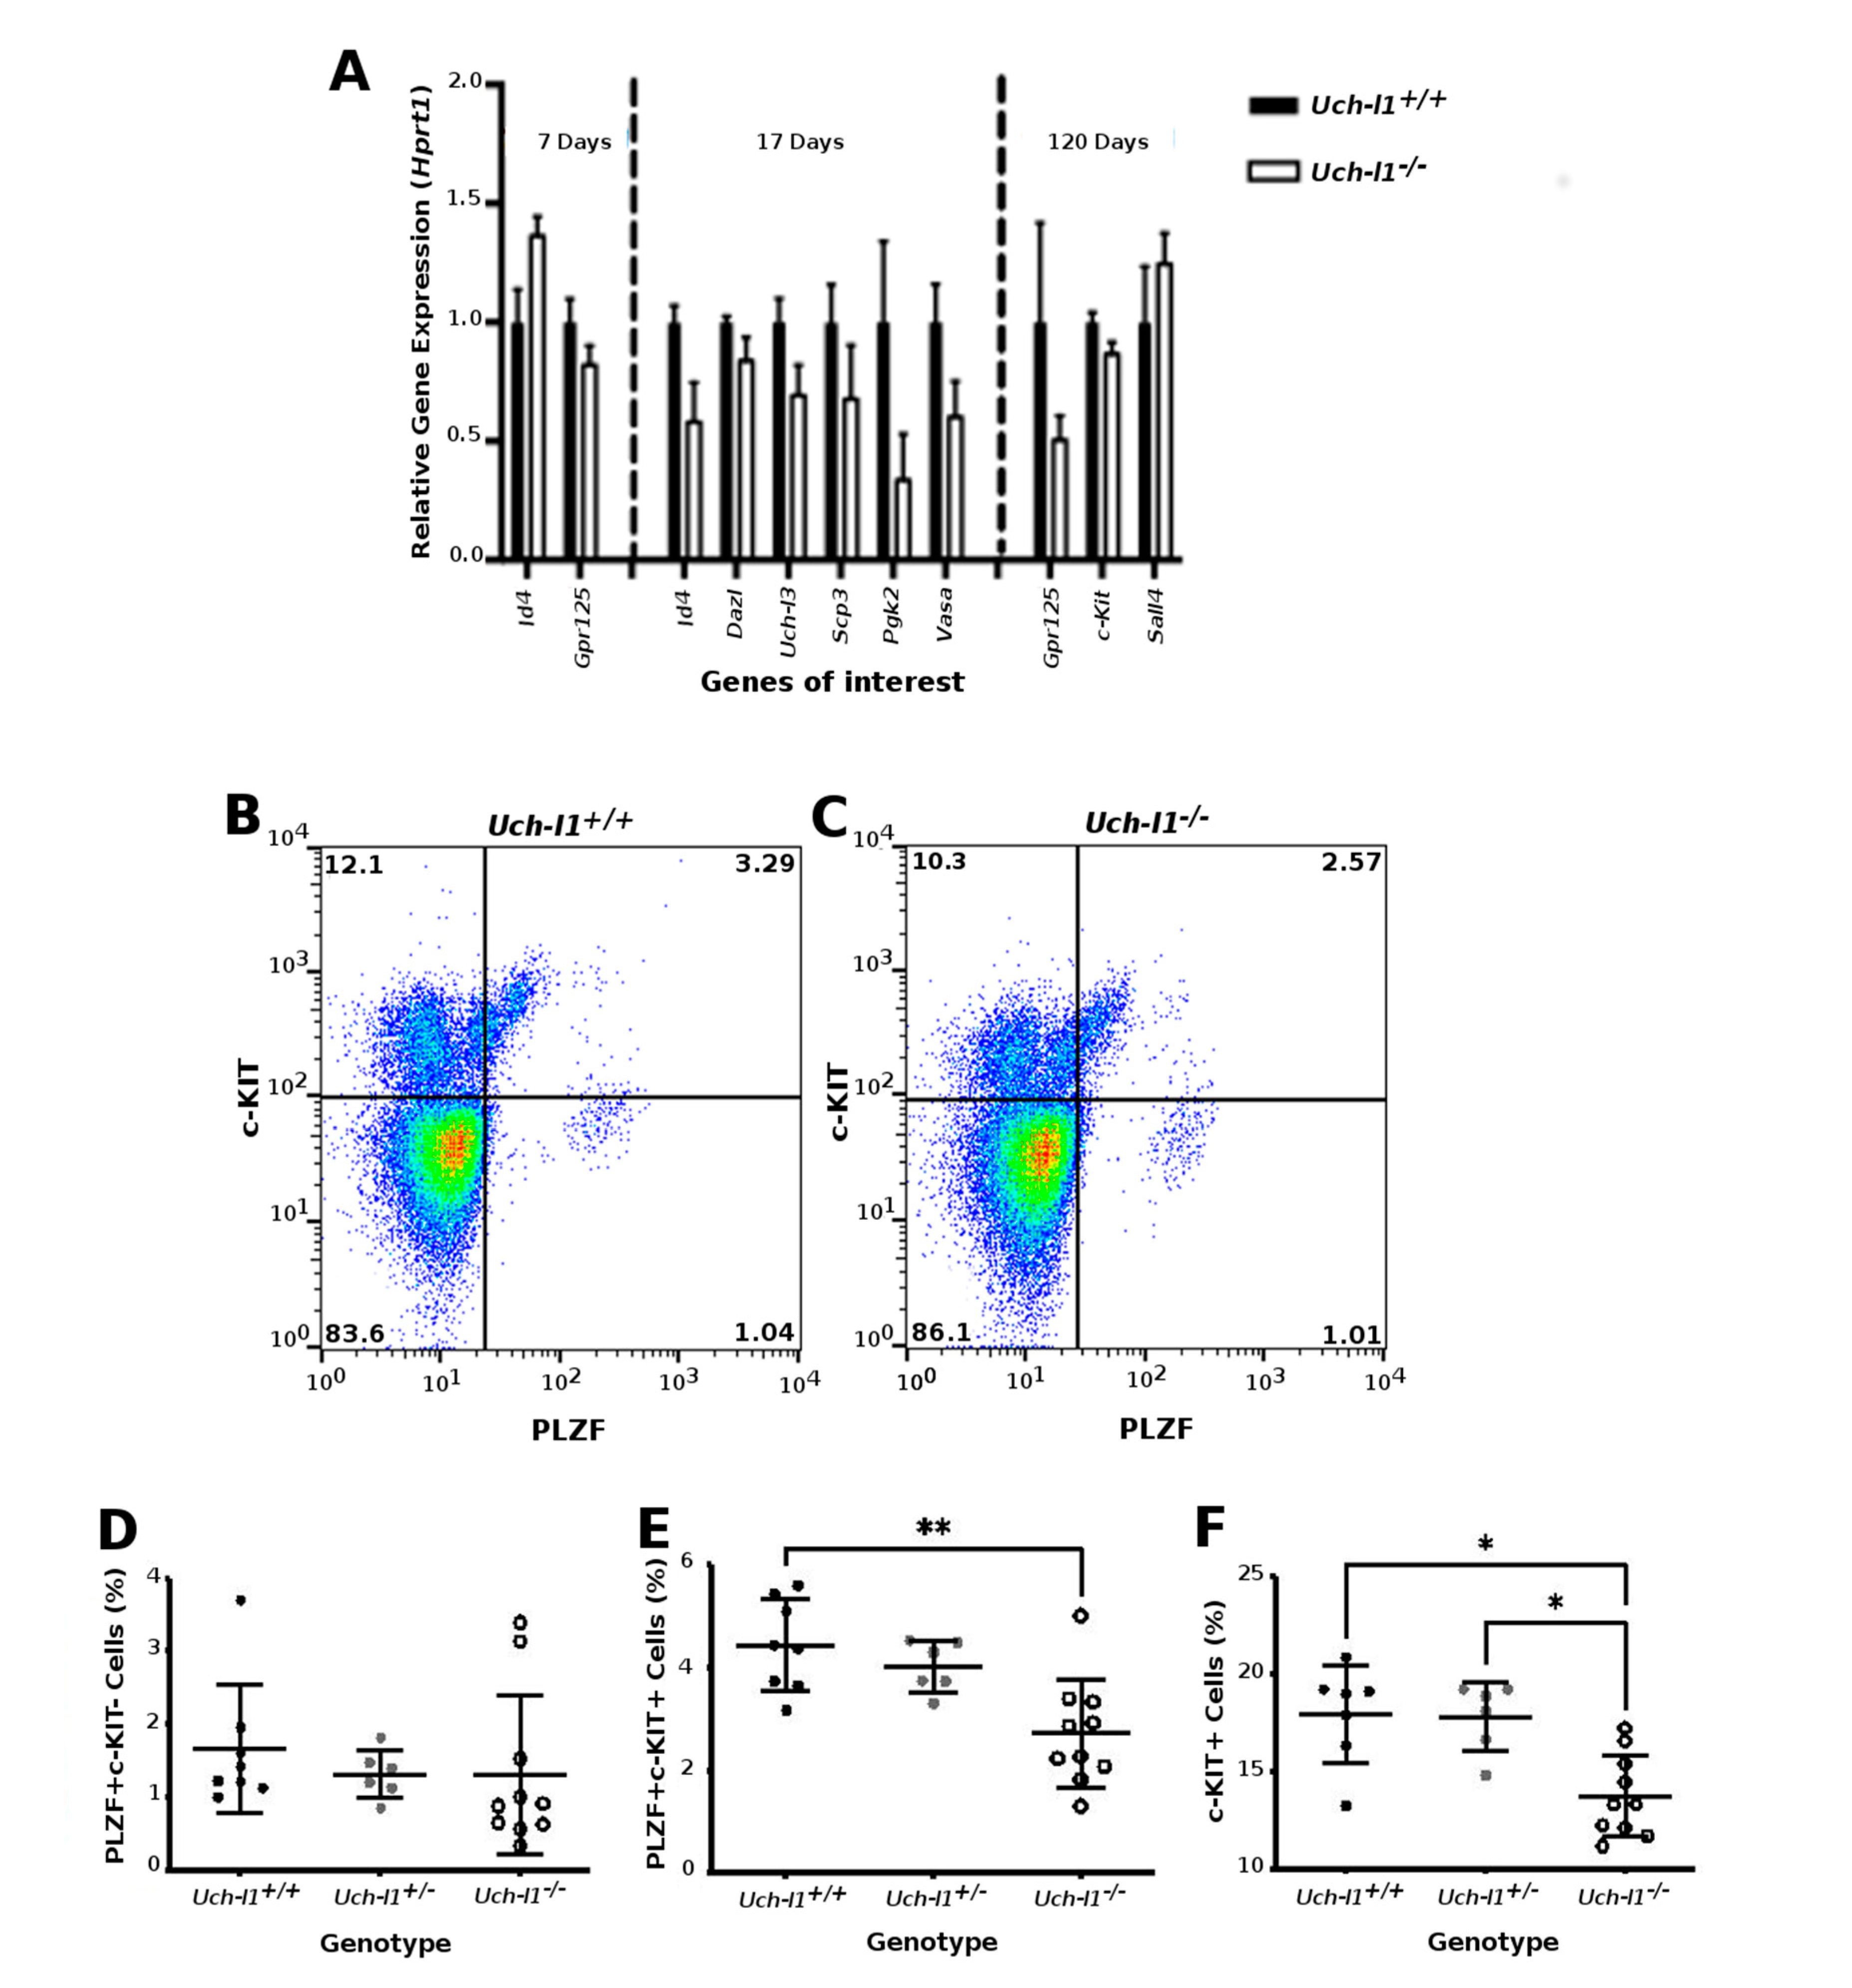
2.5. Flow Cytometry
2.6. Quantitative PCR
2.7. Germ Cell Transplantation
2.8. Oxygen Consumption Rate (OCR)
2.9. Single-Cell RNA-Sequencing
2.10. Single Cell RNA Sequencing Analyses
2.11. Gene Set Enrichment Analysis (GSEA)
2.12. Statistical Analysis
3. Results
3.1. UCH-L1 Is Expressed in Mouse Spermatogonia and Sertoli Cells
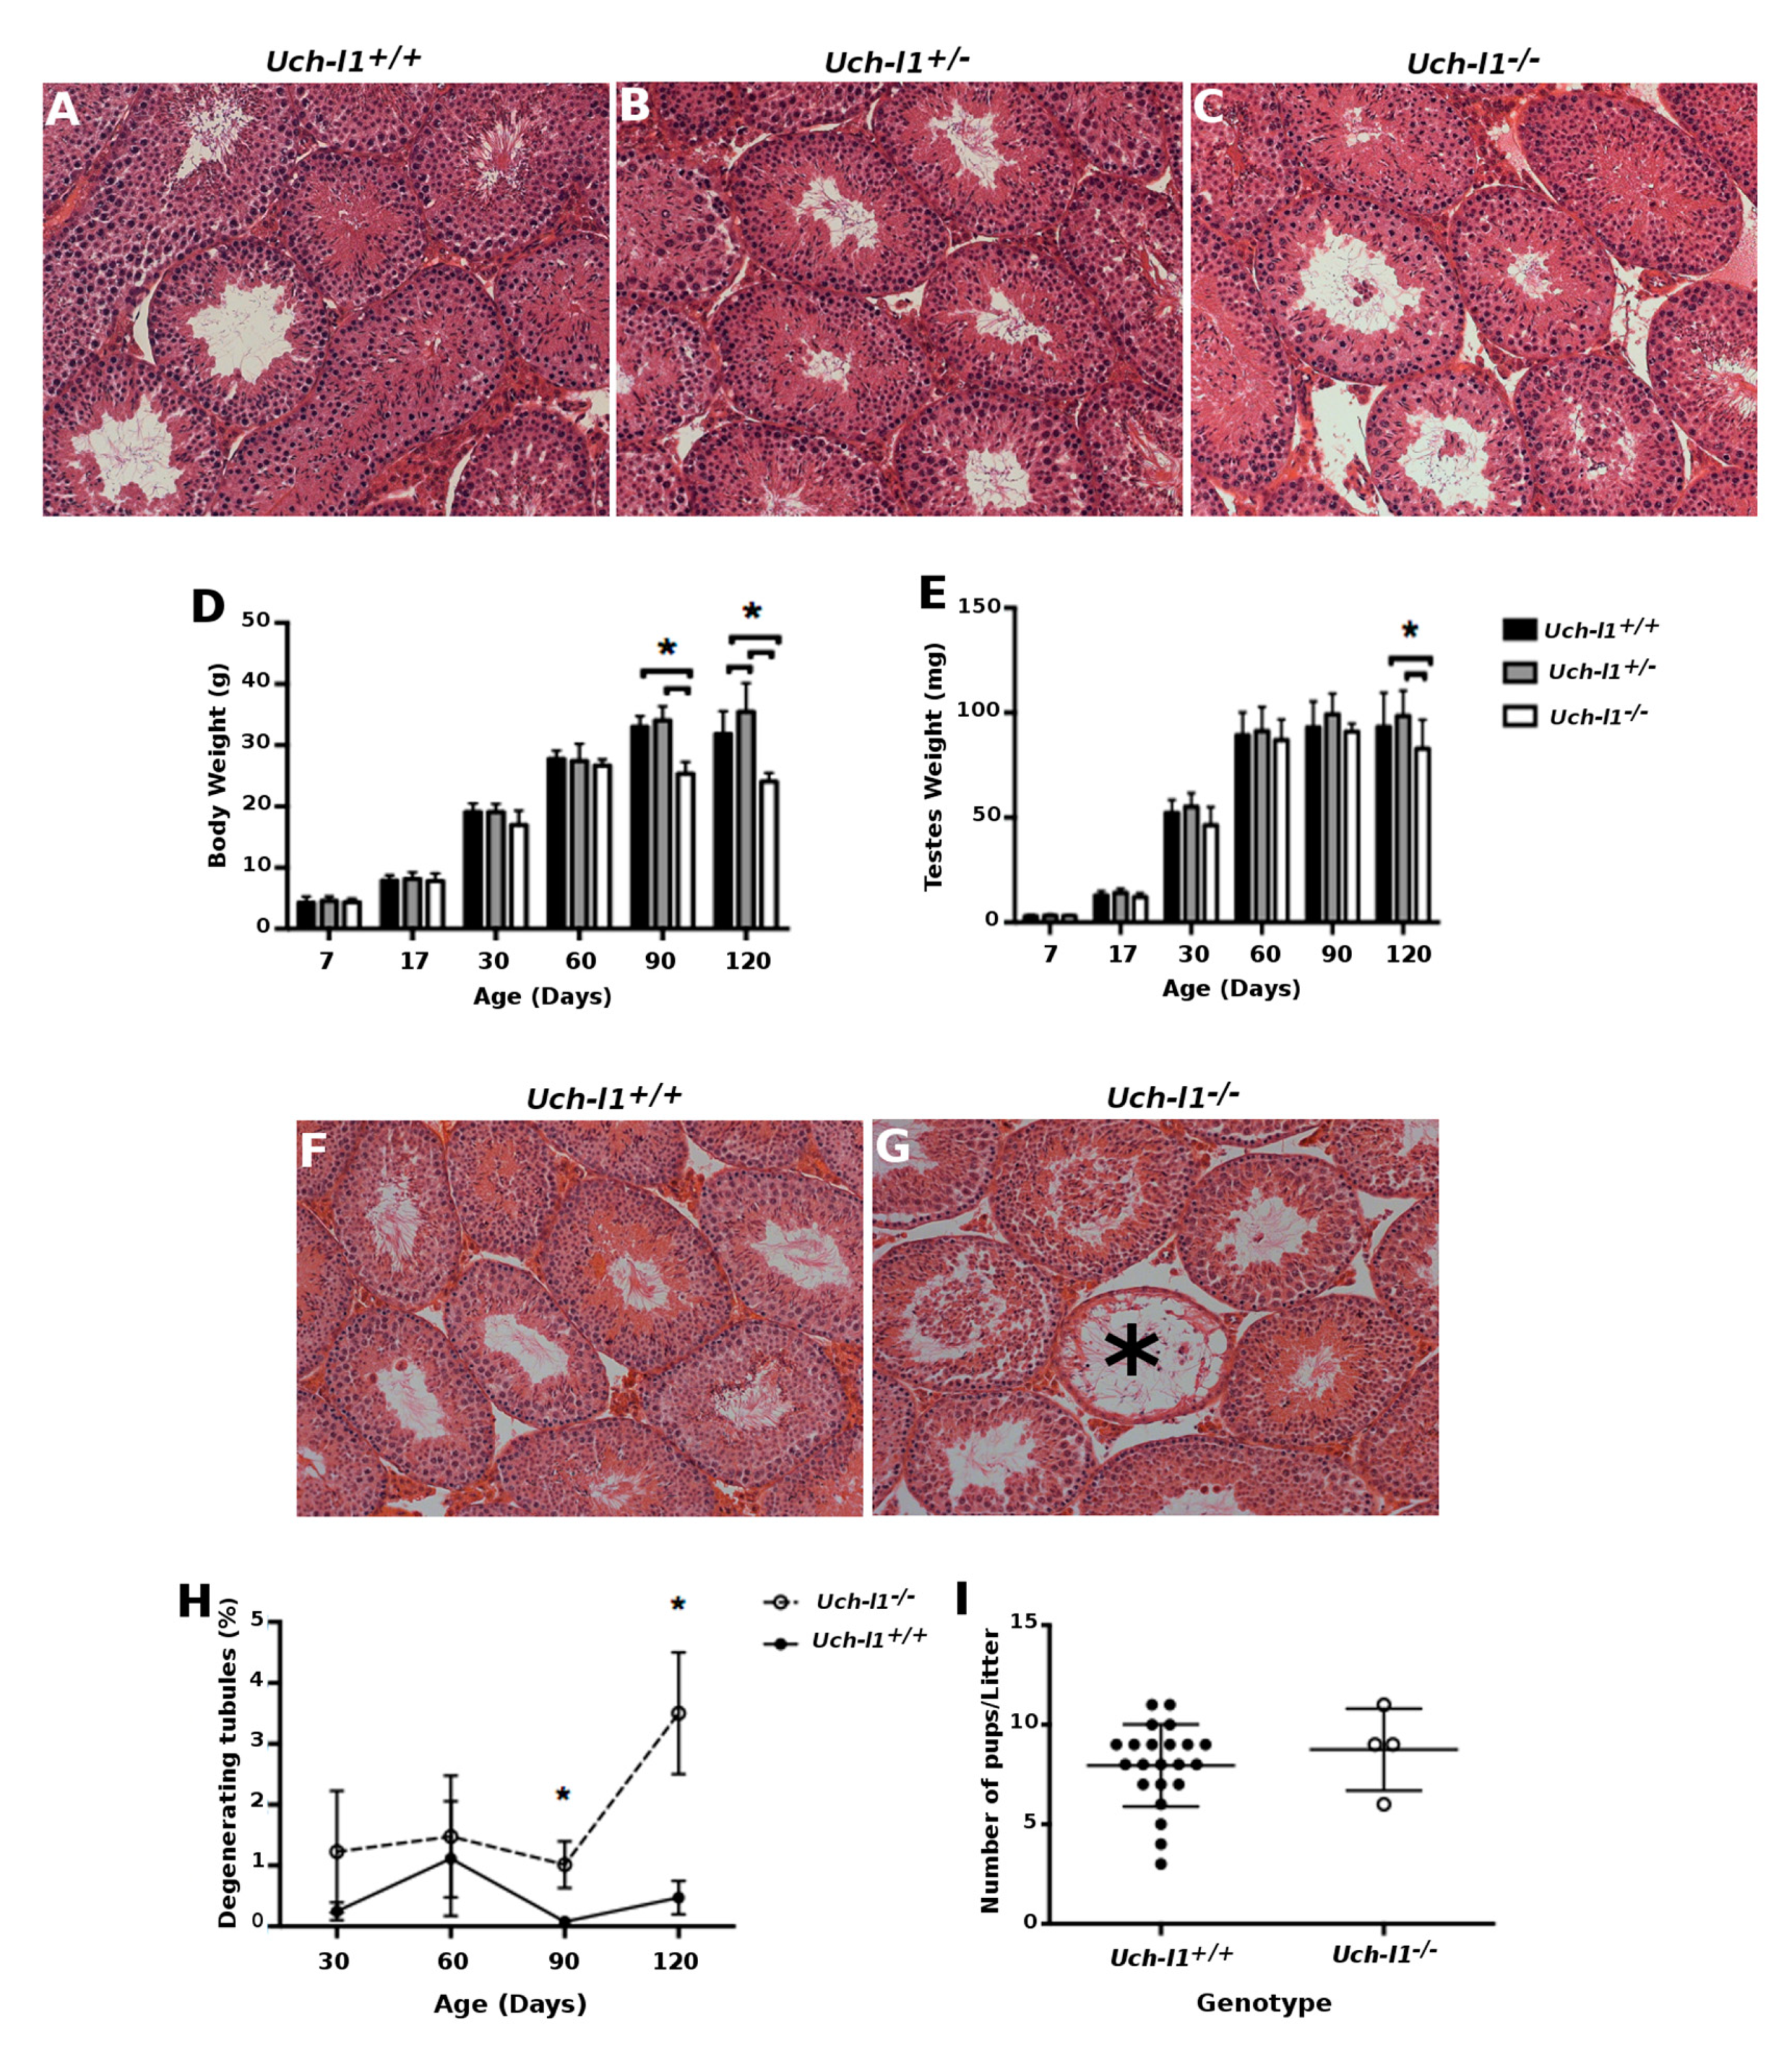
3.2. Uch-l1−/−Mice Have Decreased Testis Weight and Increased Degeneration of Seminiferous Tubules
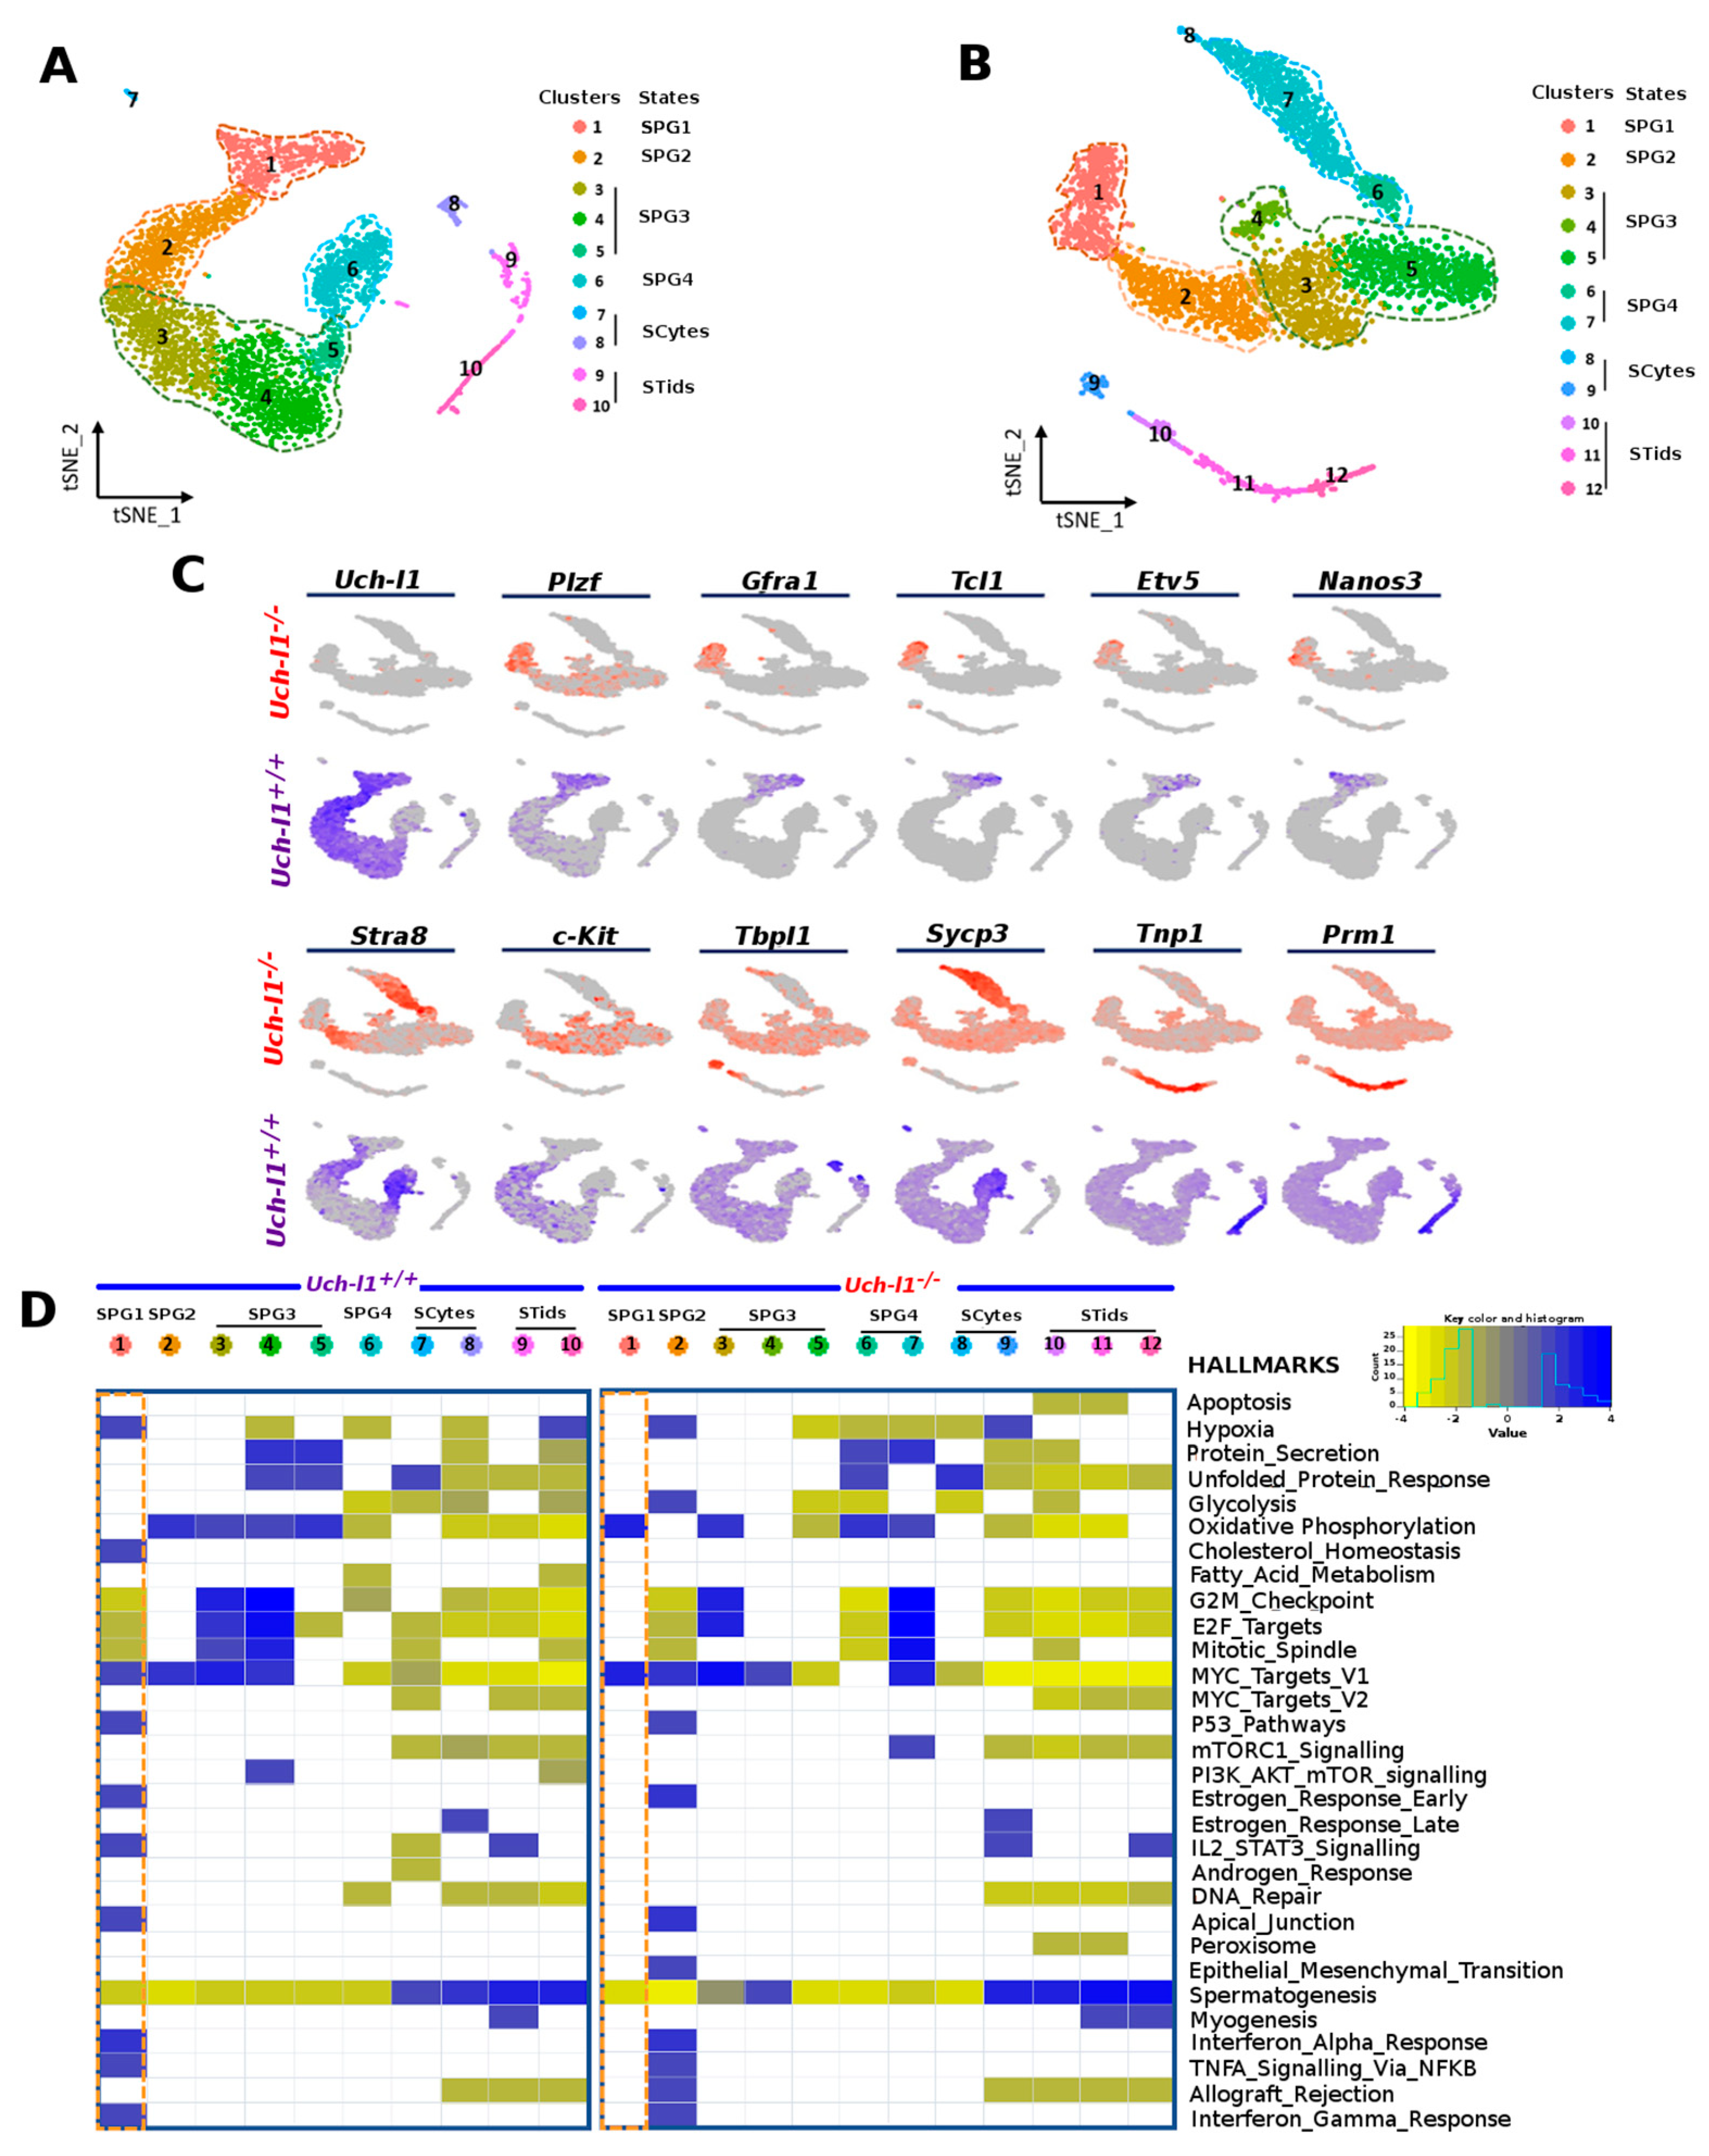
3.3. Single Cell RNA Sequencing Analysis Reveals Similar Path Reflecting Stages of Spermatogenesis in Both Genotypes
3.4. Single-Cell RNA Sequencing Analysis Shows an Altered Profile of Metabolic Transitions in Uch-l1−/− SSC/Progenitors Populations
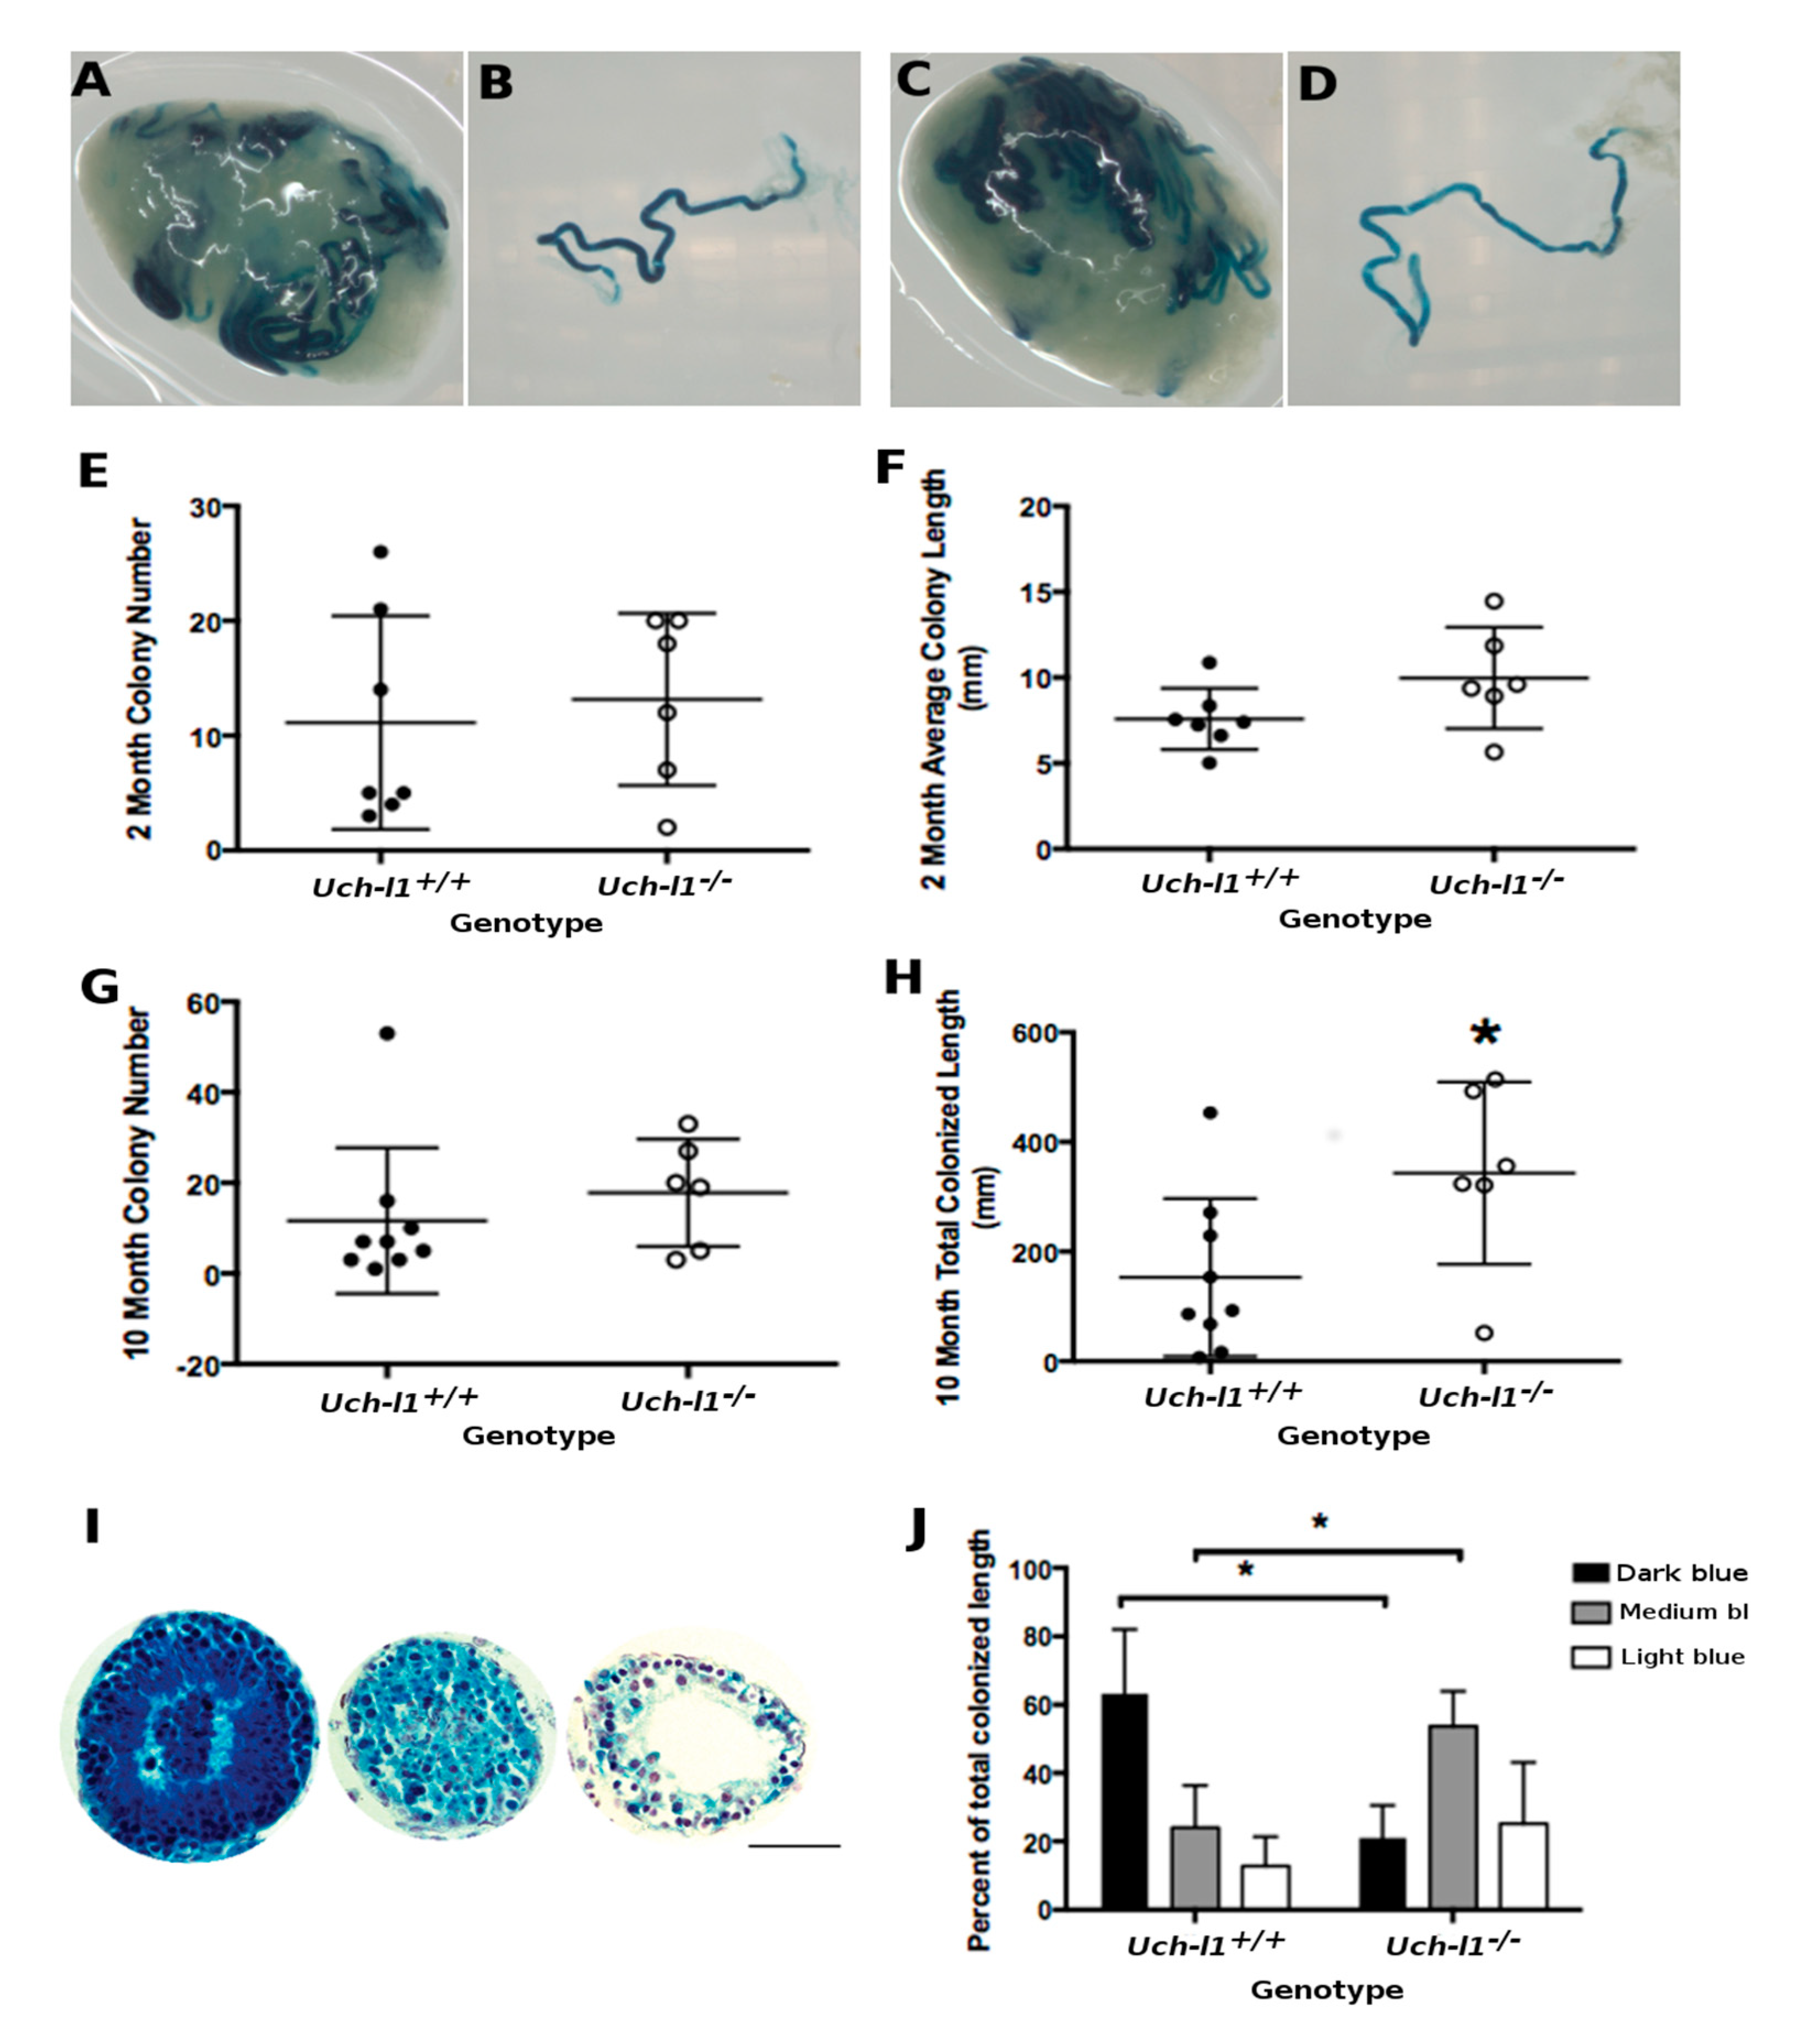
3.5. Cultured Uch-L1−/− SSCs Show a Decreased Capacity for Regeneration of Full Spermatogenesis
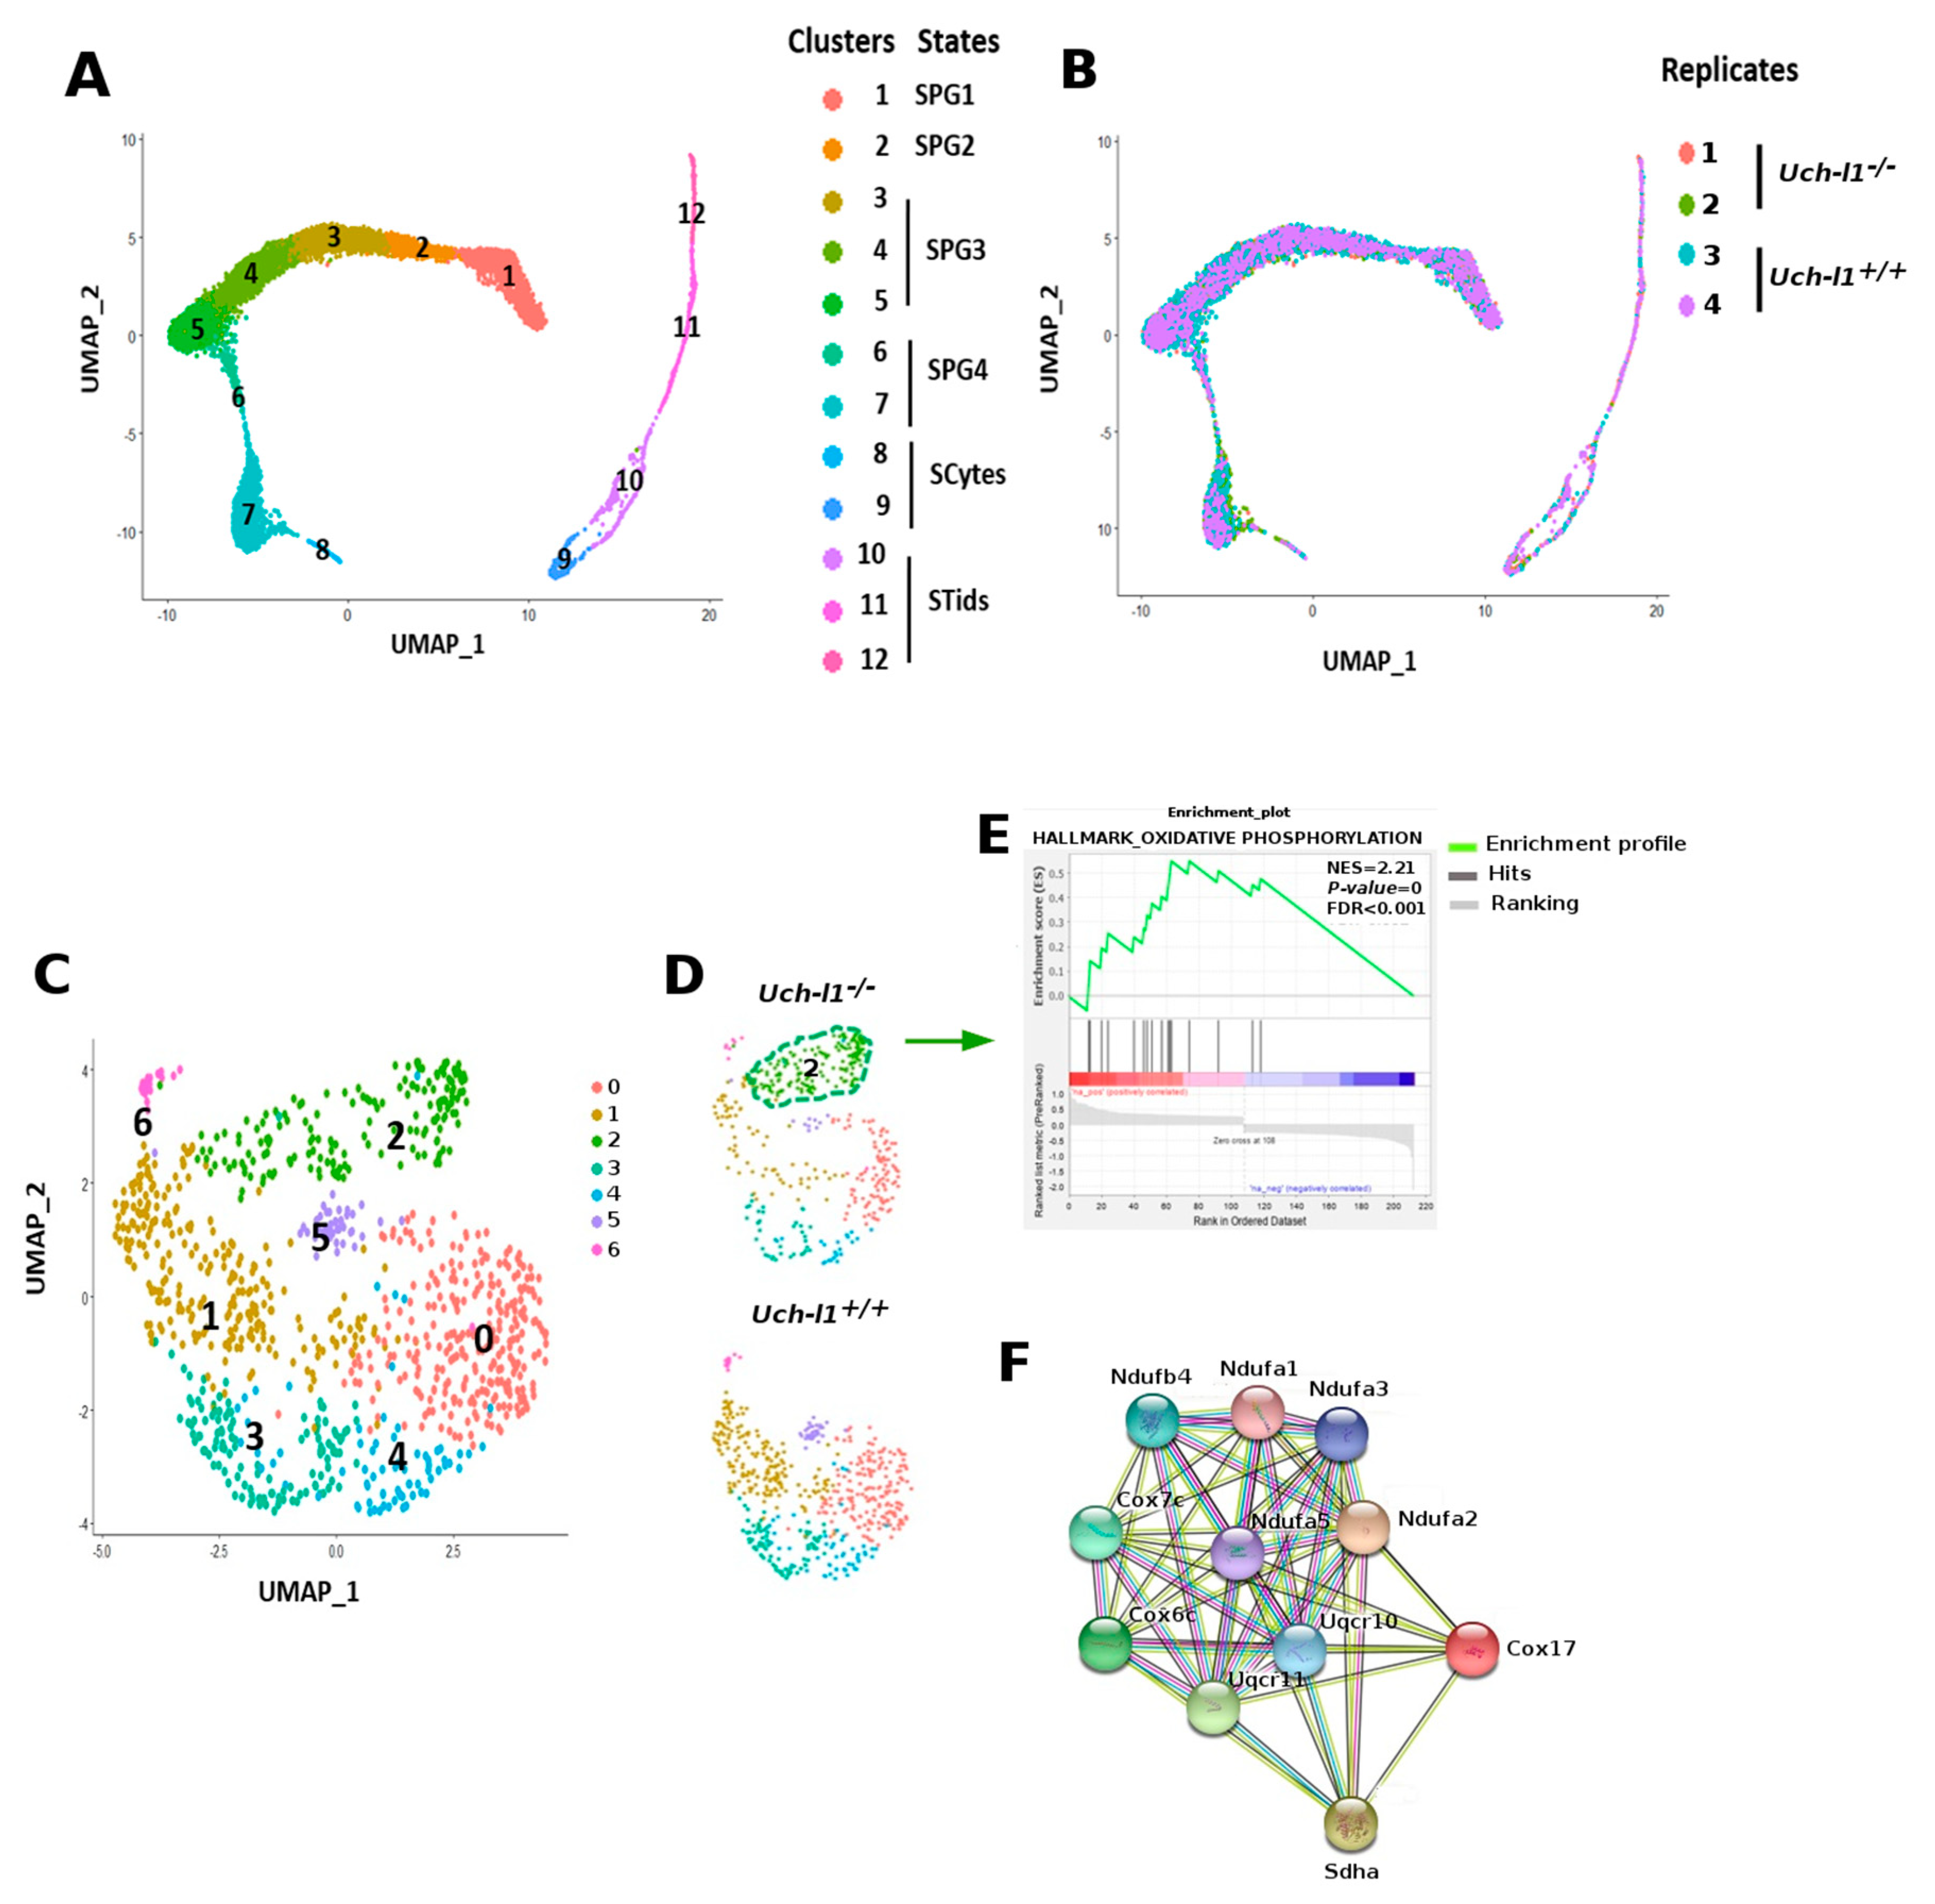
3.6. Loss of Regenerative Capacity Is Accompanied with Decreased Mitochondrial Respiration in Cultured Uch-l1−/− SSCs
4. Discussion
Supplementary Materials
Author Contributions
Funding
Institutional Review Board Statement
Informed Consent Statement
Data Availability Statement
Acknowledgments
Conflicts of Interest
References
- de Rooij, D.G. Spermatogonial multiplication and stem cell renewal. Reproduction 2001, 121, 347–354. [Google Scholar] [CrossRef]
- Barroca, V.; Lassalle, B.; Coureuil, M.; Louis, J.P.; Le Page, F.; Testart, J.; Allemand, I.; Riou, L.; Fouchet, P. Mouse differentiating spermatogonia can generate germinal stem cells in vivo. Nat. Cell Biol. 2009, 11, 190–196. [Google Scholar] [CrossRef]
- Hara, K.; Nakagawa, T.; Enomoto, H.; Suzuki, M.; Yamamoto, M.; Simons, B.D.; Yoshida, S. Mouse spermatogenic stem cells continually interconvert between equipotent singly isolated and syncytial states. Cell Stem Cell 2014, 14, 658–672. [Google Scholar] [CrossRef]
- Costoya, J.A.; Hobbs, R.M.; Barna, M.; Cattoretti, G.; Manova, K.; Sukhwani, M.; Orwig, K.E.; Wolgemuth, D.J.; Pandolfi, P.P. Essential role of Plzf in maintenance of spermatogonial stem cells. Nat. Genet. 2004, 36, 653–659. [Google Scholar] [CrossRef]
- Naughton, C.K.; Jain, S.; Strickland, A.M.; Gupta, A.; Milbrandt, J. Glial Cell-Line Derived Neurotrophic Factor-Mediated RET Signaling Regulates Spermatogonial Stem Cell Fate 1. Biol. Reprod. 2006, 74, 314–321. [Google Scholar] [CrossRef] [PubMed]
- Oatley, M.J.; Kaucher, A.V.; Racicot, K.E.; Oatley, J.M. Inhibitor of DNA Binding 4 Is Expressed Selectively by Single Spermatogonia in the Male Germline and Regulates the Self-Renewal of Spermatogonial Stem Cells in Mice. Biol. Reprod. 2011, 85, 347–356. [Google Scholar] [CrossRef]
- Orth, J.M.; Qiu, J.; Jester, W.F.; Pilder, S. Expression of the c-kit Gene is Critical for Migration of Neonatal Rat Gonocytes In Vitro. Biol. Reprod. 1997, 57, 676–683. [Google Scholar] [CrossRef]
- Morimoto, H.; Kanatsu-Shinohara, M.; Takashima, S.; Chuma, S.; Nakatsuji, N.; Takehashi, M.; Shinohara, T. Phenotypic Plasticity of Mouse Spermatogonial Stem Cells. PLoS ONE 2009, 4, e7909. [Google Scholar] [CrossRef] [PubMed]
- Endo, T.; Romer, K.A.; Anderson, E.L.; Baltus, A.E.; De Rooij, D.G.; Page, D.C. Periodic retinoic acid-STRA8 signaling intersects with periodic germ-cell competencies to regulate spermatogenesis. Proc. Natl. Acad. Sci. USA 2015, 113, E2347–E2356. [Google Scholar] [CrossRef] [PubMed]
- Ma, H.T.; Niu, C.M.; Xia, J.; Shen, X.Y.; Xia, M.M.; Yan-Qiu Hu, Y.Q.; YZheng, Y. Stimulated by retinoic acid gene 8 (Stra8) plays important roles in many stages of spermatogenesis. Asian J. Androl. 2018, 20, 479–487. [Google Scholar] [PubMed]
- Manku, G.; Wing, S.S.; Culty, M. Expression of the Ubiquitin Proteasome System in Neonatal Rat Gonocytes and Spermatogonia: Role in Gonocyte Differentiation 1. Biol. Reprod. 2012, 87, 44–45. [Google Scholar] [CrossRef]
- Xu, Z.; Song, Z.; Li, G.; Tu, H.; Liu, W.; Liu, Y.; Wang, P.; Wang, Y.; Cui, X.; Liu, C.; et al. H2B ubiquitination regulates meiotic recombination by promoting chromatin relaxation. Nucleic Acids Res. 2016, 44, 9681–9697. [Google Scholar] [CrossRef] [PubMed]
- Baarends, W.M.; Wassenaar, E.; van der Laan, R.; Hoogerbrugge, J.; Sleddens-Linkels, E.; Hoeijmakers, J.H.J.; de Boer, P.; Grootegoed, J.A. Silencing of Unpaired Chromatin and Histone H2A Ubiquitination in Mammalian Meiosis. Mol. Cell. Biol. 2005, 25, 1041–1053. [Google Scholar] [CrossRef] [PubMed]
- Kee, Y.; Huang, T.T. Role of Deubiquitinating Enzymes in DNA Repair. Mol. Cell. Biol. 2015, 36, 524–544. [Google Scholar] [CrossRef] [PubMed]
- Clague, M.J.; Urb, S. Integration of cellular ubiquitin and membrane traffic systems: Focus on deubiquitylases. FEBS J. 2017, 284, 1753–1766. [Google Scholar] [CrossRef]
- Heideker, J.; Wertz, I.E. DUBs, the regulation of cell identity and disease. Biochem. J. 2015, 465, 1–26. [Google Scholar] [CrossRef]
- Leznicki, P.; Kulathu, Y. Mechanisms of regulation and diversification of deubiquitylating enzyme function. J. Cell Sci. 2017, 130, 1997–2006. [Google Scholar] [CrossRef]
- Komander, D.; Clague, M.J.; Urbé, S. Breaking the chains: Structure and function of the deubiquitinases. Nature 2009, 10, 550–563. [Google Scholar] [CrossRef]
- Shen, H.; Sikorska, M.; Leblanc, J.; Walker, P.R.; Liu, Q.Y. Oxidative stress regulated expression of Ubiquitin Carboxyl-terminal Hydrolase-L1: Role in cell survival. Apoptosis 2006, 11, 1049–1059. [Google Scholar] [CrossRef]
- Kwon, J.; Kikuchi, T.; Setsuie, R.; Ishii, Y.; Kyuwa, S.; Yoshikawa, Y. Characterization of the Testis in Congenitally Ubiquitin Carboxy-Terminal Hydrolase-1 (Uch-L1) Defective (gad) Mice. Exp. Anim. 2003, 52, 1–9. [Google Scholar] [CrossRef]
- Saigoh, K.; Wang, Y.-L.; Suh, J.-G.; Yamanishi, T.; Sakai, Y.; Kiyosawa, H.; Harada, T.; Ichihara, N.; Wakana, S.; Kikuchi, T.; et al. Intragenic deletion in the gene encoding ubiquitin carboxy-terminal hydrolase in gad mice. Nat. Genet. 1999, 23, 47–51. [Google Scholar] [CrossRef]
- Setsuie, R.; Wada, K. The functions of UCH-L1 and its relation to neurodegenerative diseases. Neurochem. Int. 2007, 51, 105–111. [Google Scholar] [CrossRef] [PubMed]
- Maraganore, D.M.; Lesnick, T.G.; Elbaz, A.; Chartier-Harlin, M.C.; Gasser, T.; Krüger, R.; Hattori, N.; Mellick, G.D.; Quattrone, A.; Satoh, J.I.; et al. UCHL1 is a Parkinson’s Disease Susceptibility Gene. Ann. Neurol. 2004, 55, 512–521. [Google Scholar] [CrossRef] [PubMed]
- Ragland, M.; Hutter, C.; Zabetian, C.; Edwards, K. Association between the Ubiquitin Carboxyl-Terminal Esterase L1 Gene (UCHL1) S18Y Variant and Parkinson’s Disease: A HuGE Review and Meta-Analysis. Am. J. Epidemiol. 2009, 170, 1344–1357. [Google Scholar] [CrossRef]
- Zhang, M.; Cai, F.; Zhang, S.; Zhang, S.; Song, W. Overexpression of ubiquitin carboxyl-terminal hydrolase L1 (UCHL1) delays Alzheimer’s progression in vivo. Sci. Rep. 2014, 4, 7298. [Google Scholar] [CrossRef]
- Hussain, S.; Feldman, A.L.; Das, C.; Ziesmer, S.C.; Ansell, S.M.; Galardy, P.J. Ubiquitin Hydrolase UCH-L1 Destabilizes mTOR Complex 1 by Antagonizing DDB1-CUL4-Mediated Ubiquitination of Raptor. Mol. Cell Biol. 2013, 33, 1188–1197. [Google Scholar] [CrossRef] [PubMed]
- Hussain, S.; Bedekovics, T.; Liu, Q.; Hu, W.; Jeon, H.; Johnson, S.H.; Vasmatzis, G.; May, D.G.; Roux, K.J.; Galardy, P.J. UCH-L1 bypasses mTOR to promote protein biosynthesis and is required for MYC-driven lymphomagenesis in mice. Blood 2018, 132, 2564–2574. [Google Scholar] [CrossRef]
- Reinicke, A.T.; Laban, K.; Sachs, M.; Kraus, V.; Walden, M.; Damme, M.; Sachs, W.; Reichelt, J.; Schweizer, M.; Janiesch, C.; et al. Ubiquitin C-terminal hydrolase L1 (UCH-L1) loss causes neurodegeneration by altering protein turnover in the first postnatal weeks. Proc. Natl. Acad. Sci. USA 2019, 116, 7963–7972. [Google Scholar] [CrossRef]
- Wang, Y.L.; Liu, W.; Sun, Y.J.; Kwon, J.; Setsuie, R.; Osaka, H.; Noda, M.; Aoki, S.; Yoshikawa, Y.; Wada, K. Overexpression of ubiquitin carboxyl-terminal hydrolase L1 arrests spermatogenesis in transgenic mice. Mol. Reprod. Dev. 2006, 73, 40–49. [Google Scholar] [CrossRef] [PubMed]
- Kwon, J.; Mochida, K.; Wang, Y.-L.; Sekiguchi, S.; Sankai, T.; Aoki, S.; Ogura, A.; Yoshikawa, Y.; Wada, K. Ubiquitin C-Terminal Hydrolase L-1 Is Essential for the Early Apoptotic Wave of Germinal Cells and for Sperm Quality Control During Spermatogenesis 1. Biol. Reprod. 2005, 73, 29–35. [Google Scholar] [CrossRef]
- Ogawa, T.; Aréchaga, J.M.; Avarbock, M.R.; Brinster, R.L. Transplantation of testis germinal cells into mouse seminiferous tubules. Int. J. Dev. Biol. 1997, 41, 111–122. [Google Scholar]
- Yeh, J.R.; Zhang, X.; Nagano, M.C. Establishment of a Short-Term In Vitro Assay for Mouse Spermatogonial Stem Cells 1. Biol. Reprod. 2007, 77, 897–904. [Google Scholar] [CrossRef] [PubMed][Green Version]
- Kanatsu-Shinohara, M.; Tanaka, T.; Ogonuki, N.; Ogura, A.; Morimoto, H.; Cheng, P.F.; Eisenman, R.N.; Trumpp, A.; Shinohara, T. Myc/Mycn-mediated glycolysis enhances mouse spermatogonial stem cell self-renewal. Genes Dev. 2016, 30, 2637–2648. [Google Scholar] [CrossRef] [PubMed]
- Stuart, T.; Butler, A.; Hoffman, P.; Hafemeister, C.; Papalexi, E.; Mauck, W.M.; Hao, Y.; Stoeckius, M.; Smibert, P.; Satija, R. Comprehensive Integration of Single-Cell Data. Cell 2019, 177, 1888–1902.e21. [Google Scholar] [CrossRef] [PubMed]
- Subramanian, A.; Tamayo, P.; Mootha, V.K.; Mukherjee, S.; Ebert, B.L.; Gillette, M.A.; Paulovich, A.; Pomeroy, S.L.; Golub, T.R.; Lander, E.S.; et al. Gene set enrichment analysis: A knowledge-based approach for interpreting genome-wide expression profiles. Proc. Natl. Acad. Sci. USA 2005, 102, 15545–15550. [Google Scholar] [CrossRef]
- Liberzon, A.; Subramanian, A.; Pinchback, R.; Thorvaldsdóttir, H.; Tamayo, P.; Mesirov, J.P.; Bateman, A. Databases and ontologies Molecular signatures database (MSigDB) 3.0. Bioinformatics 2011, 27, 1739–1740. [Google Scholar] [CrossRef]
- Jensen, L.J.; Kuhn, M.; Stark, M.; Chaffron, S.; Creevey, C.; Muller, J.; Doerks, T.; Julien, P.; Roth, A.; Simonovic, M.; et al. STRING 8—a global view on proteins and their functional interactions in 630 organisms. Nucleic Acids Res. 2009, 37, D412–D416. [Google Scholar] [CrossRef]
- Kon, Y.; Endoh, D.; Iwanaga, T. Expression of protein gene product 9.5, a neuronal ubiquitin C-terminal hydrolase, and its developing change in Sertoli cells of mouse testis. Mol. Reprod. Dev. 1999, 54, 333–341. [Google Scholar] [CrossRef]
- Chakraborty, P.; William Buaas, F.; Sharma, M.; Snyder, E.; De Rooij, D.G.; Braun, R.E. LIN28A Marks the Spermatogonial Progenitor Population and Regulates Its Cyclic Expansion. Stem Cells 2014, 32, 860–873. [Google Scholar] [CrossRef]
- Guo, J.; Grow, E.J.; Mlcochova, H.; Maher, G.J.; Lindskog, C.; Nie, X.; Guo, Y.; Takei, Y.; Yun, J.; Cai, L.; et al. The adult human testis transcriptional cell atlas. Cell Res. 2018, 28, 1141–1157. [Google Scholar] [CrossRef]
- Sohni, A.; Tan, K.; Song, H.W.; Burow, D.; de Rooij, D.G.; Laurent, L.; Hsieh, T.C.; Rabah, R.; Hammoud, S.S.; Vicini, E.; et al. The Neonatal and Adult Human Testis Defined at the Single-Cell Level. Cell Rep. 2019, 26, 1501–1517.e4. [Google Scholar] [CrossRef]
- Hermann, B.P.; Cheng, K.; Singh, A.; Roa-De La Cruz, L.; Mutoji, K.N.; Chen, I.C.; Gildersleeve, H.; Lehle, J.D.; Mayo, M.; Westernströer, B.; et al. The Mammalian Spermatogenesis Single-Cell Transcriptome, from Spermatogonial Stem Cells to Spermatids. Cell Rep. 2018, 25, 1650–1667. [Google Scholar] [CrossRef]
- Green, C.D.; Ma, Q.; Manske, G.L.; Shami, A.N.; Zheng, X.; Marini, S.; Moritz, L.; Sultan, C.; Gurczynski, S.J.; Moore, B.B.; et al. A Comprehensive Roadmap of Murine Spermatogenesis Defined by Single-Cell RNA-Seq. Dev. Cell 2018, 46, 651–667. [Google Scholar] [CrossRef] [PubMed]
- Shami, A.N.; Zheng, X.; Munyoki, S.K.; Ma, Q.; Manske, G.L.; Green, C.D.; Sukhwani, M.; Orwig, K.E.; Li, J.Z.; Hammoud, S.S. Single-Cell RNA Sequencing of Human, Macaque, and Mouse Testes Uncovers Conserved and Divergent Features of Mammalian Spermatogenesis. Dev. Cell 2020, 54, 529–547. [Google Scholar] [CrossRef]
- Malhotra, J.D.; Kaufman, R.J. The endoplasmic reticulum and the unfolded protein response. Semin. Cell Dev. Biol. 2007, 18, 716–731. [Google Scholar] [CrossRef] [PubMed]
- Martins, A.S.; Alves, I.; Helguero, L.; Domingues, M.R.; Neves, B.M. The Unfolded Protein Response in Homeostasis and Modulation of Mammalian Immune Cells. Int. Rev. Immunol. 2016, 35, 457–476. [Google Scholar] [CrossRef]
- Zhang, T.; Oatley, J.; Bardwell, V.J.; Zarkower, D. DMRT1 is Required for Mouse Spermatogonial Stem Cell Maintenance and Replenishment. PLoS Genet. 2016, 12, e1006293. [Google Scholar] [CrossRef] [PubMed]
- Lord, T.; Nixon, B. Metabolic Changes Accompanying Spermatogonial Stem Cell Differentiation. Dev. Cell 2020, 52, 399–411. [Google Scholar] [CrossRef] [PubMed]
- Helsel, A.R.; Yang, Q.-E.; Oatley, M.J.; Lord, T.; Sablitzky, F.; Oatley, J.M. ID4 levels dictate the stem cell state in mouse spermatogonia. Development 2017, 144, 624–634. [Google Scholar] [CrossRef]
- Lou, J.; Megee, S.; Dobrinski, I. Asymmetric distribution of UCH-L1 in spermatogonia is associated with maintenance and differentiation of spermatogonial stem cells. J. Cell. Physiol. 2009, 220, 460–468. [Google Scholar]
- Valli, H.; Sukhwani, M.; Dovey, S.L.; Peters, K.A.; Donohue, J.; Castro, C.A.; Chu, T.; Marshall, G.R.; Orwig, K.E. Fluorescence- and magnetic-activated cell sorting strategies to isolate and enrich human spermatogonial stem cells. Fertil. Steril. 2014, 102, 566–580. [Google Scholar] [CrossRef]
- Harcourt, A.H.; Harveyt, P.H.; Larson, S.G. Testis weight, body weight and breeding system in primates. Nature 1981, 293, 55–57. [Google Scholar] [CrossRef]
- Le Roy, I.; Tordjman, S.; Migliore-Samour, D.; Degrelle, H.; Roubertoux, P.L. Genetic architecture of testis and seminal vesicle weights in mice. Genetics 2001, 158, 333–340. [Google Scholar] [CrossRef] [PubMed]
- Chen, F.; Sugiura, Y.; Myers, K.G.; Liu, Y.; Lin, W. Ubiquitin carboxyl-terminal hydrolase L1 is required for maintaining the structure and function of the neuromuscular junction. Proc. Natl. Acad. Sci. USA 2010, 107, 1636–1641. [Google Scholar] [CrossRef]
- Bashamboo, A.; Ferraz-De-Souza, B.; Loureno, D.; Lin, L.; Sebire, N.J.; Montjean, D.; Bignon-Topalovic, J.; Mandelbaum, J.; Siffroi, J.P.; Christin-Maitre, S.; et al. Human male infertility associated with mutations in NR5A1 encoding steroidogenic factor 1. Am. J. Hum. Genet. 2010, 87, 505–512. [Google Scholar] [CrossRef] [PubMed]
- Hiort, O.; Holterhus, P.-M.; Horter, T.; Schulze, W.; Kremke, B.; Bals-Pratsch, M.; Sinnecker, G.H.G.; Kruse, K. Significance of Mutations in the Androgen Receptor Gene in Males with Idiopathic Infertility. J. Clin. Endocrinol. Metab. 2000, 85, 2810–2815. [Google Scholar] [CrossRef] [PubMed]
- Kanatsu-Shinohara, M.; Yamamoto, T.; Toh, H.; Kazuki, Y.; Kazuki, K.; Imoto, J.; Ikeo, K.; Oshima, M.; Shirahige, K.; Iwama, A.; et al. Aging of spermatogonial stem cells by Jnk-mediated glycolysis activation. Proc. Natl. Acad. Sci. USA 2019, 116, 16404–16409. [Google Scholar] [CrossRef]
- Chen, W.; Zhang, Z.; Chang, C.; Yang, Z.; Wang, P.; Fu, H.; Wei, X.; Chen, E.; Tan, S.; Huang, W.; et al. A bioenergetic shift is required for spermatogonial differentiation. Cell Discov. 2020, 6, 1–17. [Google Scholar] [CrossRef] [PubMed]
- Coulombe, J.; Gamage, P.; Gray, M.T.; Zhang, M.; Tang, M.Y.; Woulfe, J.; Saffrey, M.J.; Gray, D.A. Loss of UCHL1 promotes age-related degenerative changes in the enteric nervous system. Front. Aging Neurosci. 2014, 6, 129. [Google Scholar] [CrossRef]
- Aquilano, K.; SBaldelli, S.; Ciriolo, M.R. Glutathione: New roles in redox signaling for an old antioxidant. Front. Pharmacol. 2014, 5, 196. [Google Scholar] [CrossRef]
- Cerqueira, F.M.; von Stockum, S.; Giacomello, M.; Goliand, I.; Kakimoto, P.; Marchesan, E.; De Stefani, D.; Kowaltowski, A.J.; Ziviani, E.; Shirihai, O.S. A new target for an old DUB: UCH-L1 regulates mitofusin-2 levels, altering mitochondrial morphology, function and calcium uptake. Redox Biol. 2020, 37, 101676. [Google Scholar] [CrossRef]
- Hobbs, R.M.; Seandel, M.; Falciatori, I.; Rafii, S.; Pandolfi, P.P. Plzf regulates germline progenitor self-renewal by opposing mTORC1. Cell 2010, 142, 468–479. [Google Scholar] [CrossRef] [PubMed]
- Kaluz, S.; Kaluzová, M.; Stanbridge, E.J. Regulation of gene expression by hypoxia: Integration of the HIF-transduced hypoxic signal at the hypoxia-responsive element. Clin. Chim. Acta 2008, 395, 6–13. [Google Scholar] [CrossRef]
- Kim, J.W.; Tchernyshyov, I.; Semenza, G.L.; Dang, C.V. HIF-1-mediated expression of pyruvate dehydrogenase kinase: A metabolic switch required for cellular adaptation to hypoxia. Cell Metab. 2006, 3, 177–185. [Google Scholar] [CrossRef] [PubMed]
- Papandreou, I.; Cairns, R.A.; Fontana, L.; Lim, A.L.; Denko, N.C. HIF-1 mediates adaptation to hypoxia by actively downregulating mitochondrial oxygen consumption. Cell Metab. 2006, 3, 187–197. [Google Scholar] [CrossRef]
- Goto, Y.; Zeng, L.; Yeom, C.J.; Zhu, Y.; Morinibu, A.; Shinomiya, K.; Kobayashi, M.; Hirota, K.; Itasaka, S.; Yoshimura, M.; et al. UCHL1 provides diagnostic and antimetastatic strategies due to its deubiquitinating effect on HIF-1a. Nat. Commun. 2015, 6, 6153. [Google Scholar] [CrossRef] [PubMed]
- Li, X.; Hattori, A.; Takahashi, S.; Goto, Y. Harada, | Hiroshi; Kakeya, H. Ubiquitin carboxyl-terminal hydrolase L1 promotes hypoxia-inducible factor 1-dependent tumor cell malignancy in spheroid models. Cancer Sci. 2020, 111, 239–252. [Google Scholar] [CrossRef]
- Gu, Y.; Lv, F.; Xue, M.; Chen, K.; Cheng, C.; Ding, X.; Jin, M.; Xu, G.; Zhang, Y.; Wu, Z.; et al. The deubiquitinating enzyme UCHL1 is a favorable prognostic marker in neuroblastoma as it promotes neuronal differentiation. J. Exp. Clin. Cancer Res. 2018, 37, 258. [Google Scholar] [CrossRef]
- Kim, S.-M.; Yokoyama, T.; Ng, D.; Ulu, F.I.; Yamazaki, Y.I. Retinoic acid-stimulated ERK1/2 pathway regulates meiotic initiation in cultured fetal germ cells. PLoS ONE 2019, 14, e0224628. [Google Scholar] [CrossRef]


Publisher’s Note: MDPI stays neutral with regard to jurisdictional claims in published maps and institutional affiliations. |
© 2021 by the authors. Licensee MDPI, Basel, Switzerland. This article is an open access article distributed under the terms and conditions of the Creative Commons Attribution (CC BY) license (https://creativecommons.org/licenses/by/4.0/).
Share and Cite
Alpaugh, W.F.; Voigt, A.L.; Dardari, R.; Su, L.; Al Khatib, I.; Shin, W.; Goldsmith, T.M.; Coyle, K.M.; Tang, L.A.; Shutt, T.E.; et al. Loss of Ubiquitin Carboxy-Terminal Hydrolase L1 Impairs Long-Term Differentiation Competence and Metabolic Regulation in Murine Spermatogonial Stem Cells. Cells 2021, 10, 2265. https://doi.org/10.3390/cells10092265
Alpaugh WF, Voigt AL, Dardari R, Su L, Al Khatib I, Shin W, Goldsmith TM, Coyle KM, Tang LA, Shutt TE, et al. Loss of Ubiquitin Carboxy-Terminal Hydrolase L1 Impairs Long-Term Differentiation Competence and Metabolic Regulation in Murine Spermatogonial Stem Cells. Cells. 2021; 10(9):2265. https://doi.org/10.3390/cells10092265
Chicago/Turabian StyleAlpaugh, Whitney F., Anna L. Voigt, Rkia Dardari, Lin Su, Iman Al Khatib, Wisoo Shin, Taylor M. Goldsmith, Krysta M. Coyle, Lin A. Tang, Timothy E. Shutt, and et al. 2021. "Loss of Ubiquitin Carboxy-Terminal Hydrolase L1 Impairs Long-Term Differentiation Competence and Metabolic Regulation in Murine Spermatogonial Stem Cells" Cells 10, no. 9: 2265. https://doi.org/10.3390/cells10092265
APA StyleAlpaugh, W. F., Voigt, A. L., Dardari, R., Su, L., Al Khatib, I., Shin, W., Goldsmith, T. M., Coyle, K. M., Tang, L. A., Shutt, T. E., Klein, C., Biernaskie, J., & Dobrinski, I. (2021). Loss of Ubiquitin Carboxy-Terminal Hydrolase L1 Impairs Long-Term Differentiation Competence and Metabolic Regulation in Murine Spermatogonial Stem Cells. Cells, 10(9), 2265. https://doi.org/10.3390/cells10092265