
Characterisation of Neurospheres-Derived Cells from Human Olfactory Epithelium

 , , , , and
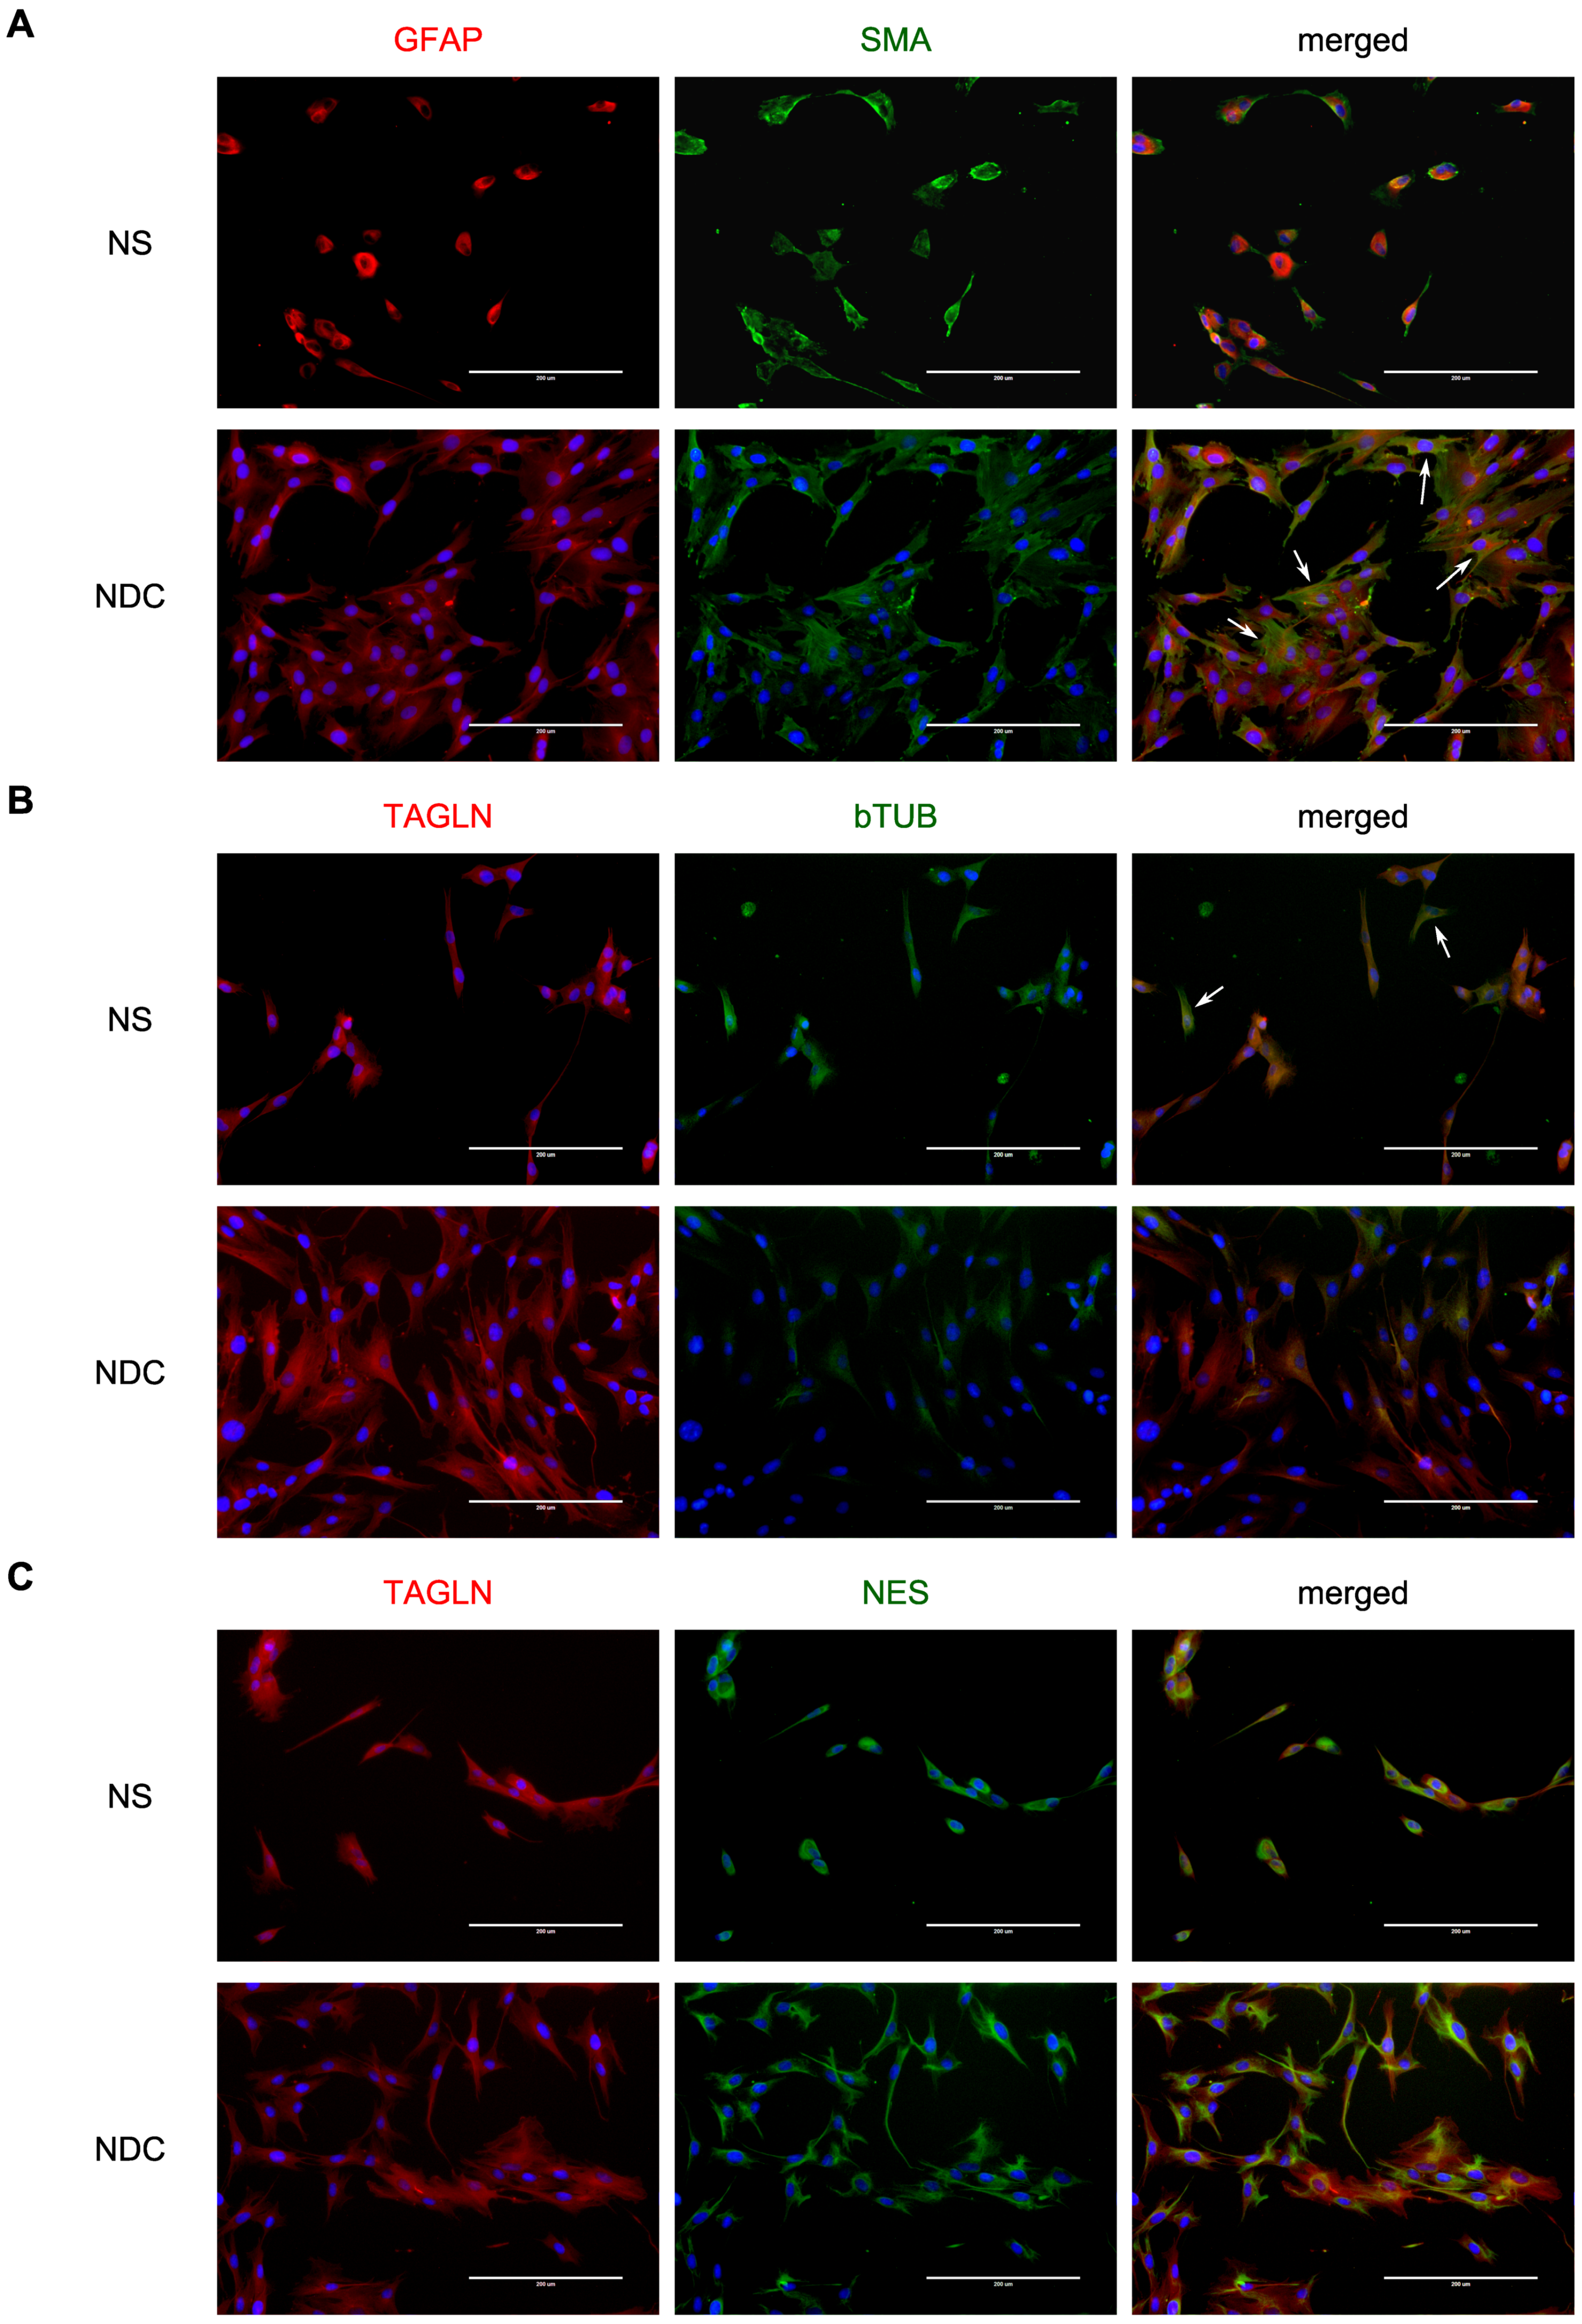
Abstract
1. Introduction
2. Materials and Methods
2.1. Materials and Reagents
2.1.1. Cell Biology
2.1.2. Immunostaining
2.1.3. RNA-seq
2.2. Sample Collection
2.3. NS and NDC
2.4. Fluorescent Microscopy
2.5. RNA-seq and Expression Analysis
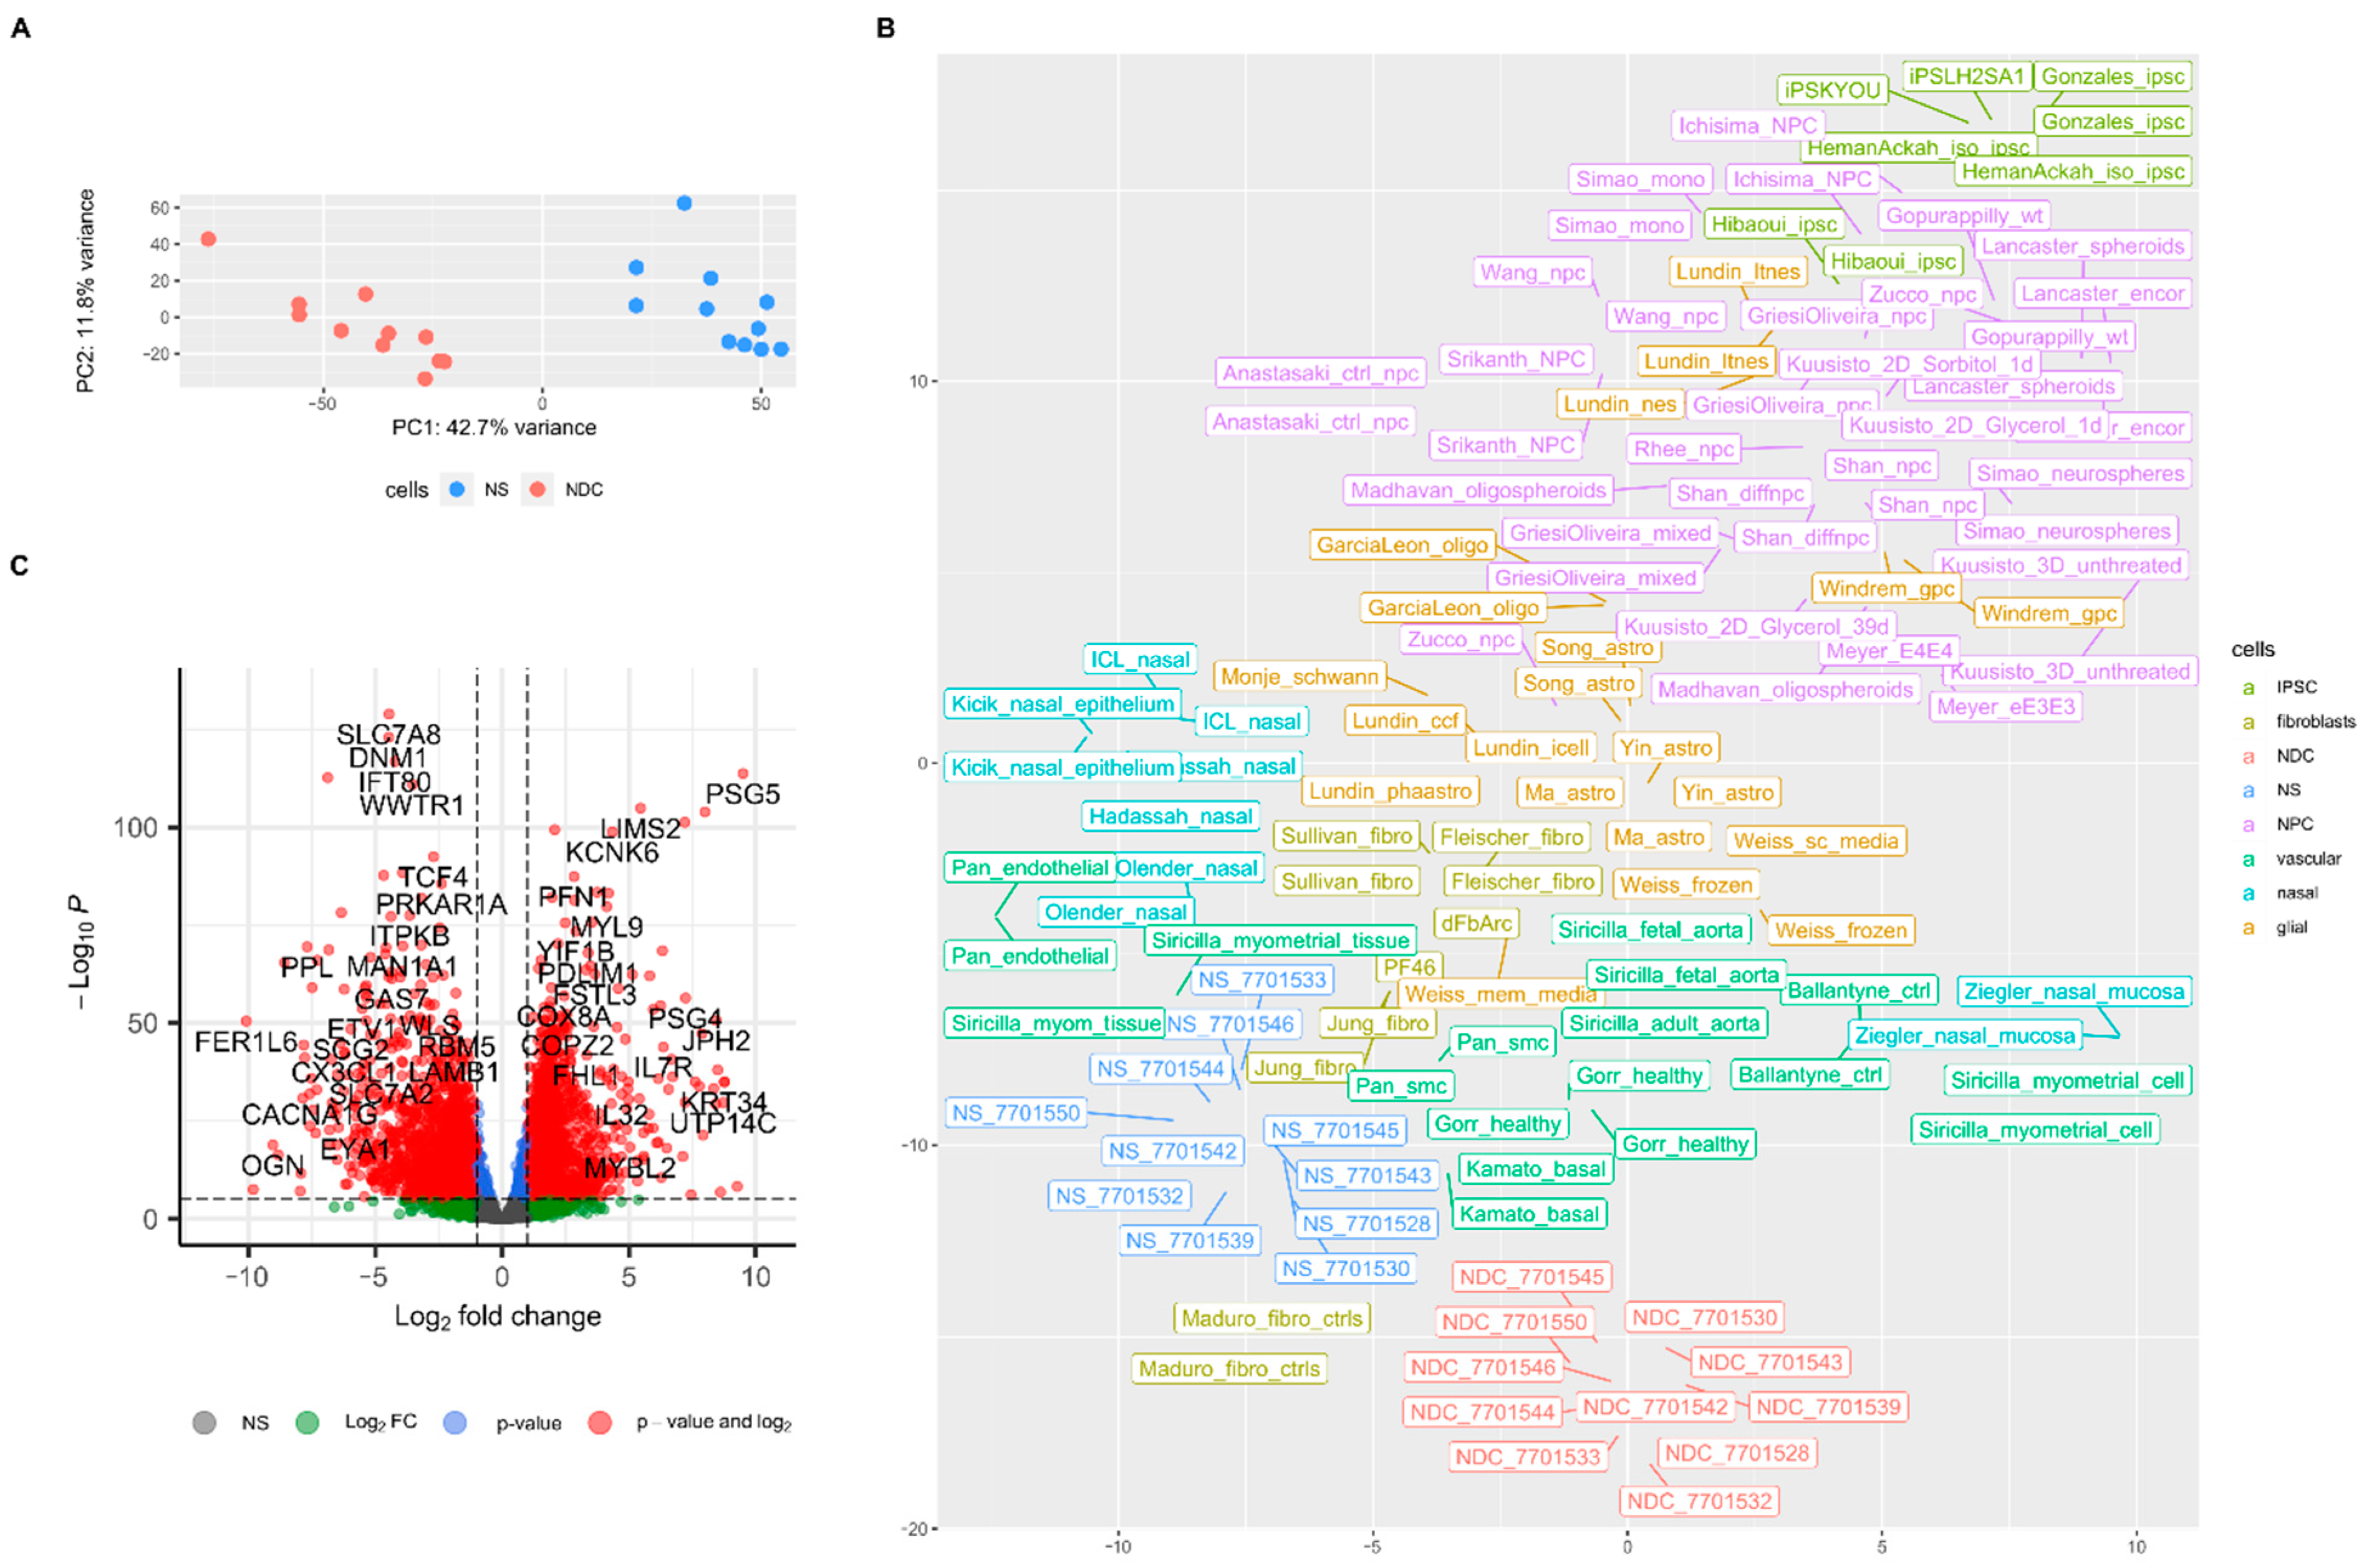
3. Results
4. Discussion
Supplementary Materials
Author Contributions
Funding
Institutional Review Board Statement
Informed Consent Statement
Data Availability Statement
Conflicts of Interest
Abbreviations
| NPC | Neural progenitor cells |
| OEC | Olfactory ensheathing cells |
| NS | Neurospheres |
| NDC | Neurospheres-derived cells |
| ONS | Olfactory neurosphere-derived cells (from Matigian et al. 2010 paper) |
| ROS | Reactive oxygen species |
| SMA | Smooth muscle actin alpha (product of ACTA2 gene) |
| GSEA | Gene set enrichment analysis |
| GO:BP | Biological Process collection of gene ontologies of GO Consortium |
| GO:CC | Cellular Component collection of gene ontologies of GO Consortium |
| TPM | Transcripts per million |
| FC | Fold change in gene expression |
References
- Jaffe, A.E.; Gao, Y.; Deep-Soboslay, A.; Tao, R.; Hyde, T.M.; Weinberger, D.R.; Kleinman, J.E. Mapping DNA methylation across development, genotype and schizophrenia in the human frontal cortex. Nat. Neurosci. 2016, 19, 40–47. [Google Scholar] [CrossRef] [PubMed]
- Amiri, A.; Coppola, G.; Scuderi, S.; Wu, F.; Roychowdhury, T.; Liu, F.; Pochareddy, S.; Shin, Y.; Safi, A.; Song, L.; et al. Transcriptome and epigenome landscape of human cortical development modeled in organoids. Science 2018, 362, 6420. [Google Scholar] [CrossRef] [PubMed]
- Schork, A.J.; Won, H.; Appadurai, V.; Nudel, R.; Gandal, M.; Delaneau, O.; Revsbech Chris-tiansen, M.; Hougaard, D.M.; Bækved-Hansen, M.; Bybjerg-Grauholm, J.; et al. A genome-wide association study of shared risk across psychiatric disorders implicates gene regulation during fetal neurodevelopment. Nat. Neurosci. 2019, 22, 353–361. [Google Scholar] [CrossRef]
- Li, M.; Santpere, G.; Kawasawa, Y.I.; Evgrafov, O.V.; Gulden, F.O.; Pochareddy, S.; Sunkin, S.M.; Li, Z.; Shin, Y.; Zhu, Y.; et al. Integrative functional genomic analysis of human brain development and neuropsychiatric risks. Science 2018, 362, eaat7615. [Google Scholar] [CrossRef] [PubMed]
- Seshadri, M.; Banerjee, D.; Viswanath, B.; Ramakrishnan, K.; Purushottam, M.; Venkatasub-ramanian, G.; Jain, S. Cellular models to study schizophrenia: A systematic review. Asian J. Psychiatr. 2017, 25, 46–53. [Google Scholar] [CrossRef] [PubMed]
- Das, D.; Feuer, K.; Wahbeh, M.; Avramopoulos, D. Modeling Psychiatric Disorder Biology with Stem Cells. Curr. Psychiatry Rep. 2020, 22, 24. [Google Scholar] [CrossRef] [PubMed]
- Shao, Z.; Noh, H.; Bin Kim, W.; Ni, P.; Nguyen, C.; Cote, S.E.; Noyes, E.; Zhao, J.; Parsons, T.; Park, J.M.; et al. Dysregulated protocadherin-pathway activity as an intrinsic defect in induced pluripotent stem cell-derived cortical interneurons from subjects with schizophrenia. Nat. Neurosci. 2019, 22, 229–242. [Google Scholar] [CrossRef]
- Marchetto, M.C.; Belinson, H.; Tian, Y.; Freitas, B.C.; Fu, C.; Vadodaria, K.; Beltrao-Braga, P.; Trujillo, C.A.; Mendes, A.P.D.; Padmanabhan, K.; et al. Altered proliferation and networks in neural cells derived from idiopathic autistic individuals. Mol. Psychiatry 2017, 22, 820–835. [Google Scholar] [CrossRef]
- Mertens, J.; Wang, Q.W.; Kim, Y.; Yu, D.X.; Pham, S.; Yang, B.; Zheng, Y.; Diffenderfer, K.E.; Zhang, J.; Soltani, S.; et al. Differential responses to lithium in hyperexcitable neurons from patients with bipolar disorder. Nature 2015, 527, 95–99. [Google Scholar] [CrossRef]
- Chen, H.M.; DeLong, C.J.; Bame, M.; Rajapakse, I.; Herron, T.J.; McInnis, M.G.; O’Shea, K.S. Transcripts involved in calcium signaling and telencephalic neuronal fate are altered in induced pluripotent stem cells from bipolar disorder patients. Transl. Psychiatry 2014, 4, e375. [Google Scholar] [CrossRef]
- Sullivan, P.F.; Daly, M.J.; O’Donovan, M. Genetic architectures of psychiatric disorders: The emerging picture and its implications. Nat. Rev. Genet. 2012, 13, 537–551. [Google Scholar] [CrossRef] [PubMed]
- Glahn, D.C.; Knowles, E.E.M.; McKay, D.R.; Sprooten, E.; Raventós, H.; Blangero, J.; Gottes-man, I.I.; Almasy, L. Arguments for the sake of endophenotypes: Examining common misconceptions about the use of endophenotypes in psychiatric genetics. Am. J. Med. Genet. B Neuropsychiatr. Genet. 2014, 165B, 122–130. [Google Scholar] [CrossRef] [PubMed]
- Wen, Z.; Nguyen, H.N.; Guo, Z.; Lalli, M.A.; Wang, X.; Su, Y.; Kim, N.S.; Yoon, K.J.; Shin, J.; Zhang, C.; et al. Synaptic dysregulation in a human iPS cell model of mental disorders. Nature 2014, 515, 414–418. [Google Scholar] [CrossRef]
- Pak, C.; Danko, T.; Zhang, Y.; Aoto, J.; Anderson, G.; Maxeiner, S.; Yi, F.; Wernig, M.; Südhof, T.C. Human Neuropsychiatric Disease Modeling using Conditional Deletion Reveals Synaptic Transmission Defects Caused by Heterozygous Mutations in NRXN1. Cell Stem Cell 2015, 17, 316–328. [Google Scholar] [CrossRef] [PubMed]
- Siegert, S.; Seo, J.; Kwon, E.J.; Rudenko, A.; Cho, S.; Wang, W.; Flood, Z.; Martorell, A.J.; Ericsson, M.; Mungenast, A.E.; et al. The schizophrenia risk gene product miR-137 alters presynaptic plasticity. Nat. Neurosci. 2015, 18, 1008–1016. [Google Scholar] [CrossRef] [PubMed]
- Brennand, K.; Savas, J.N.; Kim, Y.; Tran, N.; Simone, A.; Hashimoto-Torii, K.; Beaumont, K.G.; Kim, H.J.; Topol, A.; Ladran, I.; et al. Phenotypic differences in hiPSC NPCs derived from patients with schizophrenia. Mol. Psychiatry 2015, 20, 361–368. [Google Scholar] [CrossRef] [PubMed]
- Hoekstra, S.D.; Stringer, S.; Heine, V.M.; Posthuma, D. Genetically-Informed Patient Selection for iPSC Studies of Complex Diseases May Aid in Reducing Cellular Heterogeneity. Front. Cell. Neurosci. 2017, 11, 164. [Google Scholar] [CrossRef] [PubMed]
- Volpato, V.; Smith, J.; Sandor, C.; Ried, J.S.; Baud, A.; Handel, A.; Newey, S.E.; Wessely, F.; Attar, M.; Whiteley, E.; et al. Reproducibility of Molecular Phenotypes after Long-Term Differentiation to Human iPSC-Derived Neurons: A Multi-Site Omics Study. Stem Cell Rep. 2018, 11, 897–911. [Google Scholar] [CrossRef]
- Calof, A.L.; Mumm, J.S.; Rim, P.C.; Shou, J. The neuronal stem cell of the olfactory epithelium. J. Neurobiol. 1998, 36, 190–205. [Google Scholar] [CrossRef][Green Version]
- Féron, F.; Perry, C.; Girard, S.D.; Mackay-Sim, A. Isolation of adult stem cells from the human olfactory mucosa. Methods Mol. Biol. 2013, 1059, 107–114. [Google Scholar]
- Evgrafov, O.V.; Wrobel, B.B.; Kang, X.; Simpson, G.; Malaspina, D.; Knowles, J.A. Olfactory neuroepithelium-derived neural progenitor cells as a model system for investigating the molecular mechanisms of neuropsychiatric disorders. Psychiatr. Genet. 2011, 21, 217–228. [Google Scholar] [CrossRef] [PubMed]
- Borgmann-Winter, K.; Willard, S.L.; Sinclair, D.; Mirza, N.; Turetsky, B.; Berretta, S.; Hahn, C.G. Translational potential of olfactory mucosa for the study of neuropsychiatric illness. Transl. Psychiatry 2015, 5, e527. [Google Scholar] [CrossRef] [PubMed]
- Brann, D.H.; Tsukahara, T.; Weinreb, C.; Lipovsek, M.; Van den Berge, K.; Gong, B.; Chance, R.; Macaulay, I.C.; Chou, H.J.; Fletcher, R.B.; et al. Non-neuronal expression of SARS-CoV-2 entry genes in the olfactory system suggests mechanisms underlying COVID-19-associated anosmia. Sci. Adv. 2020, 6, eabc5801. [Google Scholar] [CrossRef]
- Gupta, K.; Mohanty, S.K.; Mittal, A.; Kalra, S.; Kumar, S.; Mishra, T.; Ahuja, J.; Sengupta, D.; Ahuja, G. The Cellular basis of the loss of smell in 2019-nCoV-infected individuals. Brief. Bioinform. 2020, 22, 873–881. [Google Scholar] [CrossRef]
- Tabakow, P.; Raisman, G.; Fortuna, W.; Czyz, M.; Huber, J.; Li, D.; Szewczyk, P.; Okurowski, S.; Miedzybrodzki, R.; Czapiga, B.; et al. Functional Regeneration of Supraspinal Connections in a Patient with Transected Spinal Cord following Transplantation of Bulbar Olfactory Ensheathing Cells with Peripheral Nerve Bridging. Cell Transplant. 2014, 23, 1631–1655. [Google Scholar] [CrossRef]
- Gilmour, A.D.; Reshamwala, R.; Wright, A.A.; Ekberg, J.A.K.; St John, J.A. Optimizing Olfactory Ensheathing Cell Transplantation for Spinal Cord Injury Repair. J. Neurotrauma 2020, 37, 817–829. [Google Scholar] [CrossRef]
- Murrell, W.; Wetzig, A.; Donnellan, M.; Féron, F.; Burne, T.; Meedeniya, A.; Kesby, J.; Bianco, J.; Perry, C.; Silburn, P.; et al. Olfactory mucosa is a potential source for autologous stem cell therapy for Parkinson’s disease. Stem Cells 2008, 26, 2183–2192. [Google Scholar] [CrossRef]
- Rhie, S.K.; Schreiner, S.; Witt, H.; Armoskus, C.; Lay, F.D.; Camarena, A.; Spitsyna, V.N.; Guo, Y.; Berman, B.P.; Evgrafov, O.V.; et al. Using 3D epigenomic maps of primary olfactory neuronal cells from living individuals to understand gene regulation. Sci. Adv. 2018, 4, eaav8550. [Google Scholar] [CrossRef]
- Evgrafov, O.V.; Armoskus, C.; Wrobel, B.B.; Spitsyna, V.N.; Souaiaia, T.; Herstein, J.S.; Walker, C.P.; Nguyen, J.D.; Camarena, A.; Weitz, J.R.; et al. Gene Expression in Patient-Derived Neural Progenitors Implicates WNT5A Signaling in the Etiology of Schizophrenia. Biol. Psychiatry 2020, 88, 236–247. [Google Scholar] [CrossRef]
- Matigian, N.; Abrahamsen, G.; Sutharsan, R.; Cook, A.L.; Vitale, A.M.; Nouwens, A.; Bellette, B.; An, J.; Anderson, M.; Beckhouse, A.G.; et al. Disease-specific, neurosphere-derived cells as models for brain disorders. Dis. Models Mech. 2010, 3, 785–798. [Google Scholar] [CrossRef] [PubMed]
- Durante, M.A.; Kurtenbach, S.; Sargi, Z.B.; Harbour, J.W.; Choi, R.; Kurtenbach, S.; Goss, G.M.; Matsunami, H.; Goldstein, B.J. Single-cell analysis of olfactory neurogenesis and differentiation in adult humans. Nat. Neurosci. 2020, 23, 323–326. [Google Scholar] [CrossRef]
- Higginson, J.R.; Barnett, S.C. The culture of olfactory ensheathing cells (OECs)–A distinct glial cell type. Exp. Neurol. 2011, 229, 2–9. [Google Scholar] [CrossRef]
- Wrobel, B.B.; Mazza, J.M.; Evgrafov, O.V.; Knowles, J.A. Assessing the efficacy of endoscopic office olfactory biopsy sites to produce neural progenitor cell cultures for the study of neuropsychiatric disorders. Int. Forum Allergy Rhinol. 2013, 3, 133–138. [Google Scholar] [CrossRef]
- Kryukov, A.I.; Valikhov, M.P.; Tsarapkin, G.Y.; Tovmasyan, A.S.; Arzamazov, S.G.; Kondratiev, N.V.; Kostyuk, G.P.; Golimbet, V.E. Isolation of neurospheres and neural progenitor cells from the olfactory epithelium. Vestn. Otorinolaringol. 2019, 84, 31–35. [Google Scholar] [CrossRef] [PubMed]
- Patro, R.; Duggal, G.; Love, M.I.; Irizarry, R.A.; Kingsford, C. Salmon provides fast and bias-aware quantification of transcript expression. Nat. Methods 2017, 14, 417–419. [Google Scholar] [CrossRef] [PubMed]
- Yu, G. Using Meshes for MeSH Term Enrichment and Semantic Analyses. Bioinformatics 2018, 34, 3766–3767. [Google Scholar] [CrossRef]
- Luo, W.; Brouwer, C. Pathview: An R/Bioconductor package for pathway-based data integration and visualization. Bioinformatics 2013, 29, 1830–1831. [Google Scholar] [CrossRef] [PubMed]
- Siricilla, S.; Knapp, K.M.; Rogers, J.H.; Berger, C.; Shelton, E.L.; Mi, D.; Vinson, P.; Condon, J.; Paria, B.C.; Reese, J.; et al. Comparative analysis of myometrial and vascular smooth muscle cells to determine optimal cells for use in drug discovery. Pharmacol. Res. 2019, 146, 104268. [Google Scholar] [CrossRef]
- Kanehisa, M.; Furumichi, M.; Tanabe, M.; Sato, Y.; Morishima, K. KEGG: New perspectives on genomes, pathways, diseases and drugs. Nucleic Acids Res. 2017, 45, D353–D361. [Google Scholar] [CrossRef] [PubMed]
- Martens, M.; Ammar, A.; Riutta, A.; Waagmeester, A.; Slenter, D.N.; Hanspers, K.A.; Miller, R.; Digles, D.; Lopes, E.N.; Ehrhart, F.; et al. WikiPathways: Connecting communities. Nucleic Acids Res. 2021, 49, D613–D621. [Google Scholar] [CrossRef] [PubMed]
- Liberzon, A.; Birger, C.; Thorvaldsdóttir, H.; Ghandi, M.; Mesirov, J.P.; Tamayo, P. The Molecular Signatures Database (MSigDB) hallmark gene set collection. Cell Syst. 2015, 1, 417–425. [Google Scholar] [CrossRef] [PubMed]
- Kuusisto, F.; Costa, V.S.; Hou, Z.; Thomson, J.; Page, D.; Stewart, R. Machine learning to predict developmental neurotoxicity with high-throughput data from 2D bio-engineered tissues. Proc. Int. Conf. Mach. Learn. Appl. 2019, 2019, 293–298. [Google Scholar]
- Peng, C.; Lu, L.; Li, Y.; Hu, J. Neurospheres Induced from Human Adipose-Derived Stem Cells as a New Source of Neural Progenitor Cells. Cell Transplant. 2019, 28, 66S–75S. [Google Scholar] [CrossRef] [PubMed]
- Begum, A.N.; Guoynes, C.; Cho, J.; Hao, J.; Lutfy, K.; Hong, Y. Rapid generation of sub-type, region-specific neurons and neural networks from human pluripotent stem cell-derived neurospheres. Stem Cell Res. 2015, 15, 731–741. [Google Scholar] [CrossRef]
- Yun, J.; Rocic, P.; Pung, Y.F.; Belmadani, S.; Carrao, A.C.R.; Ohanyan, V.; Chilian, W.M. Redox- dependent mechanisms in coronary collateral growth: The “redox window” hypothesis. Antioxid. Redox Signal. 2009, 11, 1961–1974. [Google Scholar] [CrossRef] [PubMed]
- Kim, Y.W.; Byzova, T.V. Oxidative stress in angiogenesis and vascular disease. Blood 2014, 123, 625–631. [Google Scholar] [CrossRef] [PubMed]
- Song, S.H.; Kim, K.; Park, J.J.; Min, K.H.; Suh, W. Reactive oxygen species regulate the quiescence of CD34-positive cells derived from human embryonic stem cells. Cardiovasc. Res. 2014, 103, 147–155. [Google Scholar] [CrossRef]
- Zhang, J.; Jiang, X.; Zhang, C.; Zhong, J.; Fang, X.; Li, H.; Xie, F.; Huang, X.; Zhang, X.; Hu, Q.; et al. Actin Alpha 2 (ACTA2) Downregulation Inhibits Neural Stem Cell Migration through Rho GTPase Activation. Stem Cells Int. 2020, 2020, 1–12. [Google Scholar] [CrossRef]
- Jahed, A.; Rowland, J.W.; McDonald, T.; Boyd, J.G.; Doucette, R.; Kawaja, M.D. Olfactory ensheathing cells express smooth muscle alpha-actin in vitro and in vivo. J. Comp. Neurol. 2007, 503, 209–223. [Google Scholar] [CrossRef]
- Rawji, K.S.; Zhang, S.X.; Tsai, Y.Y.; Smithson, L.J.; Kawaja, M.D. Olfactory ensheathing cells of hamsters, rabbits, monkeys, and mice express α-smooth muscle actin. Brain Res. 2013, 1521, 31–50. [Google Scholar] [CrossRef]
- Amoh, Y.; Li, L.; Katsuoka, K.; Penman, S.; Hoffman, R.M. Multipotent nestin-positive, keratin-negative hair-follicle bulge stem cells can form neurons. Proc. Natl. Acad. Sci. USA 2005, 102, 5530–5534. [Google Scholar] [CrossRef]
- Srivastava, G.K.; Rodriguez-Crespo, D.; Singh, A.K.; Casado-Coterillo, C.; Fernandez-Bueno, I.; Garcia-Gutierrez, M.T.; Coronas, J.; Pastor, J.C. Chitosan feasibility to retain retinal stem cell phenotype and slow proliferation for retinal transplantation. Biomed Res. Int. 2014, 2014, 287896. [Google Scholar] [CrossRef] [PubMed]
- Mii, S.; Amoh, Y.; Katsuoka, K.; Hoffman, R.M. Comparison of nestin-expressing multipotent stem cells in the tongue fungiform papilla and vibrissa hair follicle. J. Cell. Biochem. 2014, 115, 1070–1076. [Google Scholar] [CrossRef] [PubMed]
- Amoh, Y.; Li, L.; Katsuoka, K.; Hoffman, R.M. Multipotent hair follicle stem cells promote repair of spinal cord injury and recovery of walking function. Cell Cycle 2008, 7, 1865–1869. [Google Scholar] [CrossRef] [PubMed]
- Reshamwala, R.; Shah, M.; St John, J.; Ekberg, J. Survival and Integration of Transplanted Olfactory Ensheathing Cells are Crucial for Spinal Cord Injury Repair: Insights from the Last 10 Years of Animal Model Studies. Cell Transplant. 2019, 28, 132S–159S. [Google Scholar] [CrossRef]
- Raisman, G.; Li, Y. Repair of neural pathways by olfactory ensheathing cells. Nat. Rev. Neurosci. 2007, 8, 312–319. [Google Scholar] [CrossRef]
- Schiffer, D.; Giordana, M.T.; Mauro, A.; Migheli, A. GFAP, FVIII/RAg, Laminin, and fibronectin in gliosarcomas: An immunohistochemical study. Acta Neuropathol. 1984, 63, 108–116. [Google Scholar] [CrossRef]
- Haddad, S.F.; Moore, S.A.; Schelper, R.L.; Goeken, J.A. Smooth muscle can comprise the sarcomatous component of gliosarcomas. J. Neuropathol. Exp. Neurol. 1992, 51, 493–498. [Google Scholar] [CrossRef] [PubMed]
- Khanna, M.; Siraj, F.; Chopra, P.; Bhalla, S.; Roy, S. Gliosarcoma with prominent smooth muscle component (gliomyosarcoma): A report of 10 cases. Indian J. Pathol. Microbiol. 2011, 54, 51–54. [Google Scholar]
- Biernat, W.; Aguzzi, A.; Sure, U.; Grant, J.W.; Kleihues, P.; Hegi, M.E. Identical Mutations of the p53 Tumor Suppressor Gene in the Gliomatous and the Sarcomatous Components of Gliosarcomas Suggest a Common Origin from Glial Cells. J. Neuropathol. Exp. Neurol. 1995, 54, 651–656. [Google Scholar] [CrossRef]
- Reis, R.M.; Martins, A.; Ribeiro, S.A.; Basto, D.; Longatto-Filho, A.; Schmitt, F.C.; Lopes, J.M. Molecular characterization of PDGFR-α/PDGF-A and c-KIT/SCF in gliosarcomas. Anal. Cell. Pathol. 2005, 27, 319–326. [Google Scholar] [CrossRef]
- Thiruchelvam, M.; Brockel, B.J.; Richfield, E.K.; Baggs, R.B.; Cory-Slechta, D.A. Potentiated and preferential effects of combined paraquat and maneb on nigrostriatal dopamine systems: Environmental risk factors for Parkinson’s disease? Brain Res. 2000, 873, 225–234. [Google Scholar] [CrossRef]
- Kluss, J.H.; Mamais, A.; Cookson, M.R. LRRK2 links genetic and sporadic Parkinson’s disease. Biochem. Soc. Trans. 2019, 47, 651–661. [Google Scholar] [CrossRef] [PubMed]
- Cuypers, A.; Plusquin, M.; Remans, T.; Jozefczak, M.; Keunen, E.; Gielen, H.; Opdenakker, K.; Nair, A.R.; Munters, E.; Artois, T.J.; et al. Cadmium stress: An oxidative challenge. Biometals 2010, 23, 927–940. [Google Scholar] [CrossRef] [PubMed]
- Desplats, P.; Patel, P.; Kosberg, K.; Mante, M.; Patrick, C.; Rockenstein, E.; Fujita, M.; Hashimoto, M.; Masliah, E. Combined exposure to Maneb and Paraquat alters transcriptional regulation of neurogenesis-related genes in mice models of Parkinson’s disease. Mol. Neurodegener. 2012, 7, 1–10. [Google Scholar] [CrossRef] [PubMed]
- Colle, D.; Farina, M.; Ceccatelli, S.; Raciti, M. Paraquat and Maneb Exposure Alters Rat Neural Stem Cell Proliferation by Inducing Oxidative Stress: New Insights on Pesticide- Induced Neurodevelopmental Toxicity. Neurotox. Res. 2018, 34, 820–833. [Google Scholar] [CrossRef]
- Zarei, M.H.; Pourahmad, J.; Aghvami, M.; Soodi, M.; Nassireslami, E. Lead acetate toxicity on human lymphocytes at non-cytotoxic concentrations detected in human blood. Main Group Met. Chem. 2017, 40, 105–112. [Google Scholar] [CrossRef]
- Wang, X.; Martínez, M.A.; Dai, M.; Chen, D.; Ares, I.; Romero, A.; Castellano, V.; Martínez, M.; Rodríguez, J.L.; Martínez-Larrañaga, M.R.; et al. Permethrin-induced oxidative stress and toxicity and metabolism. A review. Environ. Res. 2016, 149, 86–104. [Google Scholar] [CrossRef]
- Erturan, İ.; Naziroğlu, M.; Akkaya, V.B. Isotretinoin treatment induces oxidative toxicity in blood of patients with acne vulgaris: A clinical pilot study. Cell Biochem. Funct. 2012, 30, 552–557. [Google Scholar] [CrossRef]
- Roede, J.R.; Hansen, J.M.; Go, Y.M.; Jones, D.P. Maneb and paraquat-mediated neurotoxicity: Involvement of peroxiredoxin/thioredoxin system. Toxicol. Sci. 2011, 121, 368–375. [Google Scholar] [CrossRef]
- Anderson, C.C.; Aivazidis, S.; Kuzyk, C.L.; Jain, A.; Roede, J.R. Acute Maneb Exposure Significantly Alters Both Glycolysis and Mitochondrial Function in Neuroblastoma Cells. Toxicol. Sci. 2018, 165, 61–73. [Google Scholar] [CrossRef] [PubMed]
- Anderson, C.C.; Marentette, J.O.; Rauniyar, A.K.; Prutton, K.M.; Khatri, M.; Matheson, C.; Reisz, J.A.; Reigan, P.; D’Alessandro, A.; Roede, J.R. Maneb alters central carbon metabolism and thiol redox status in a toxicant model of Parkinson’s disease. Free Radic. Biol. Med. 2021, 162, 65–76. [Google Scholar] [CrossRef] [PubMed]


Publisher’s Note: MDPI stays neutral with regard to jurisdictional claims in published maps and institutional affiliations. |
© 2021 by the authors. Licensee MDPI, Basel, Switzerland. This article is an open access article distributed under the terms and conditions of the Creative Commons Attribution (CC BY) license (https://creativecommons.org/licenses/by/4.0/).
Share and Cite
Zelenova, E.A.; Kondratyev, N.V.; Lezheiko, T.V.; Tsarapkin, G.Y.; Kryukov, A.I.; Kishinevsky, A.E.; Tovmasyan, A.S.; Momotyuk, E.D.; Dashinimaev, E.B.; Golimbet, V.E. Characterisation of Neurospheres-Derived Cells from Human Olfactory Epithelium. Cells 2021, 10, 1690. https://doi.org/10.3390/cells10071690
Zelenova EA, Kondratyev NV, Lezheiko TV, Tsarapkin GY, Kryukov AI, Kishinevsky AE, Tovmasyan AS, Momotyuk ED, Dashinimaev EB, Golimbet VE. Characterisation of Neurospheres-Derived Cells from Human Olfactory Epithelium. Cells. 2021; 10(7):1690. https://doi.org/10.3390/cells10071690
Chicago/Turabian StyleZelenova, Elena A., Nikolay V. Kondratyev, Tatyana V. Lezheiko, Grigoriy Y. Tsarapkin, Andrey I. Kryukov, Alexander E. Kishinevsky, Anna S. Tovmasyan, Ekaterina D. Momotyuk, Erdem B. Dashinimaev, and Vera E. Golimbet. 2021. "Characterisation of Neurospheres-Derived Cells from Human Olfactory Epithelium" Cells 10, no. 7: 1690. https://doi.org/10.3390/cells10071690
APA StyleZelenova, E. A., Kondratyev, N. V., Lezheiko, T. V., Tsarapkin, G. Y., Kryukov, A. I., Kishinevsky, A. E., Tovmasyan, A. S., Momotyuk, E. D., Dashinimaev, E. B., & Golimbet, V. E. (2021). Characterisation of Neurospheres-Derived Cells from Human Olfactory Epithelium. Cells, 10(7), 1690. https://doi.org/10.3390/cells10071690