
Gene Expression Profile in Different Age Groups and Its Association with Cognitive Function in Healthy Malay Adults in Malaysia

 , ,
, ,  ,
,
Abstract
1. Introduction
2. Materials and Methods
2.1. Subjects Recruited
2.2. Samples Collection and RNA Preparation
2.3. RNA Amplification and Microarray Chip Hybridization
2.4. Real-Time QRT-PCR Validation
2.5. Statistical Analysis
2.6. Statistical Analysis of Gene Expression Profiling
3. Results
3.1. Demographic and Cognitive Performance of the Subjects
3.2. Sample Characteristics
3.3. Gene Expression Profiling and Differentially Expressed Gene in PBMC
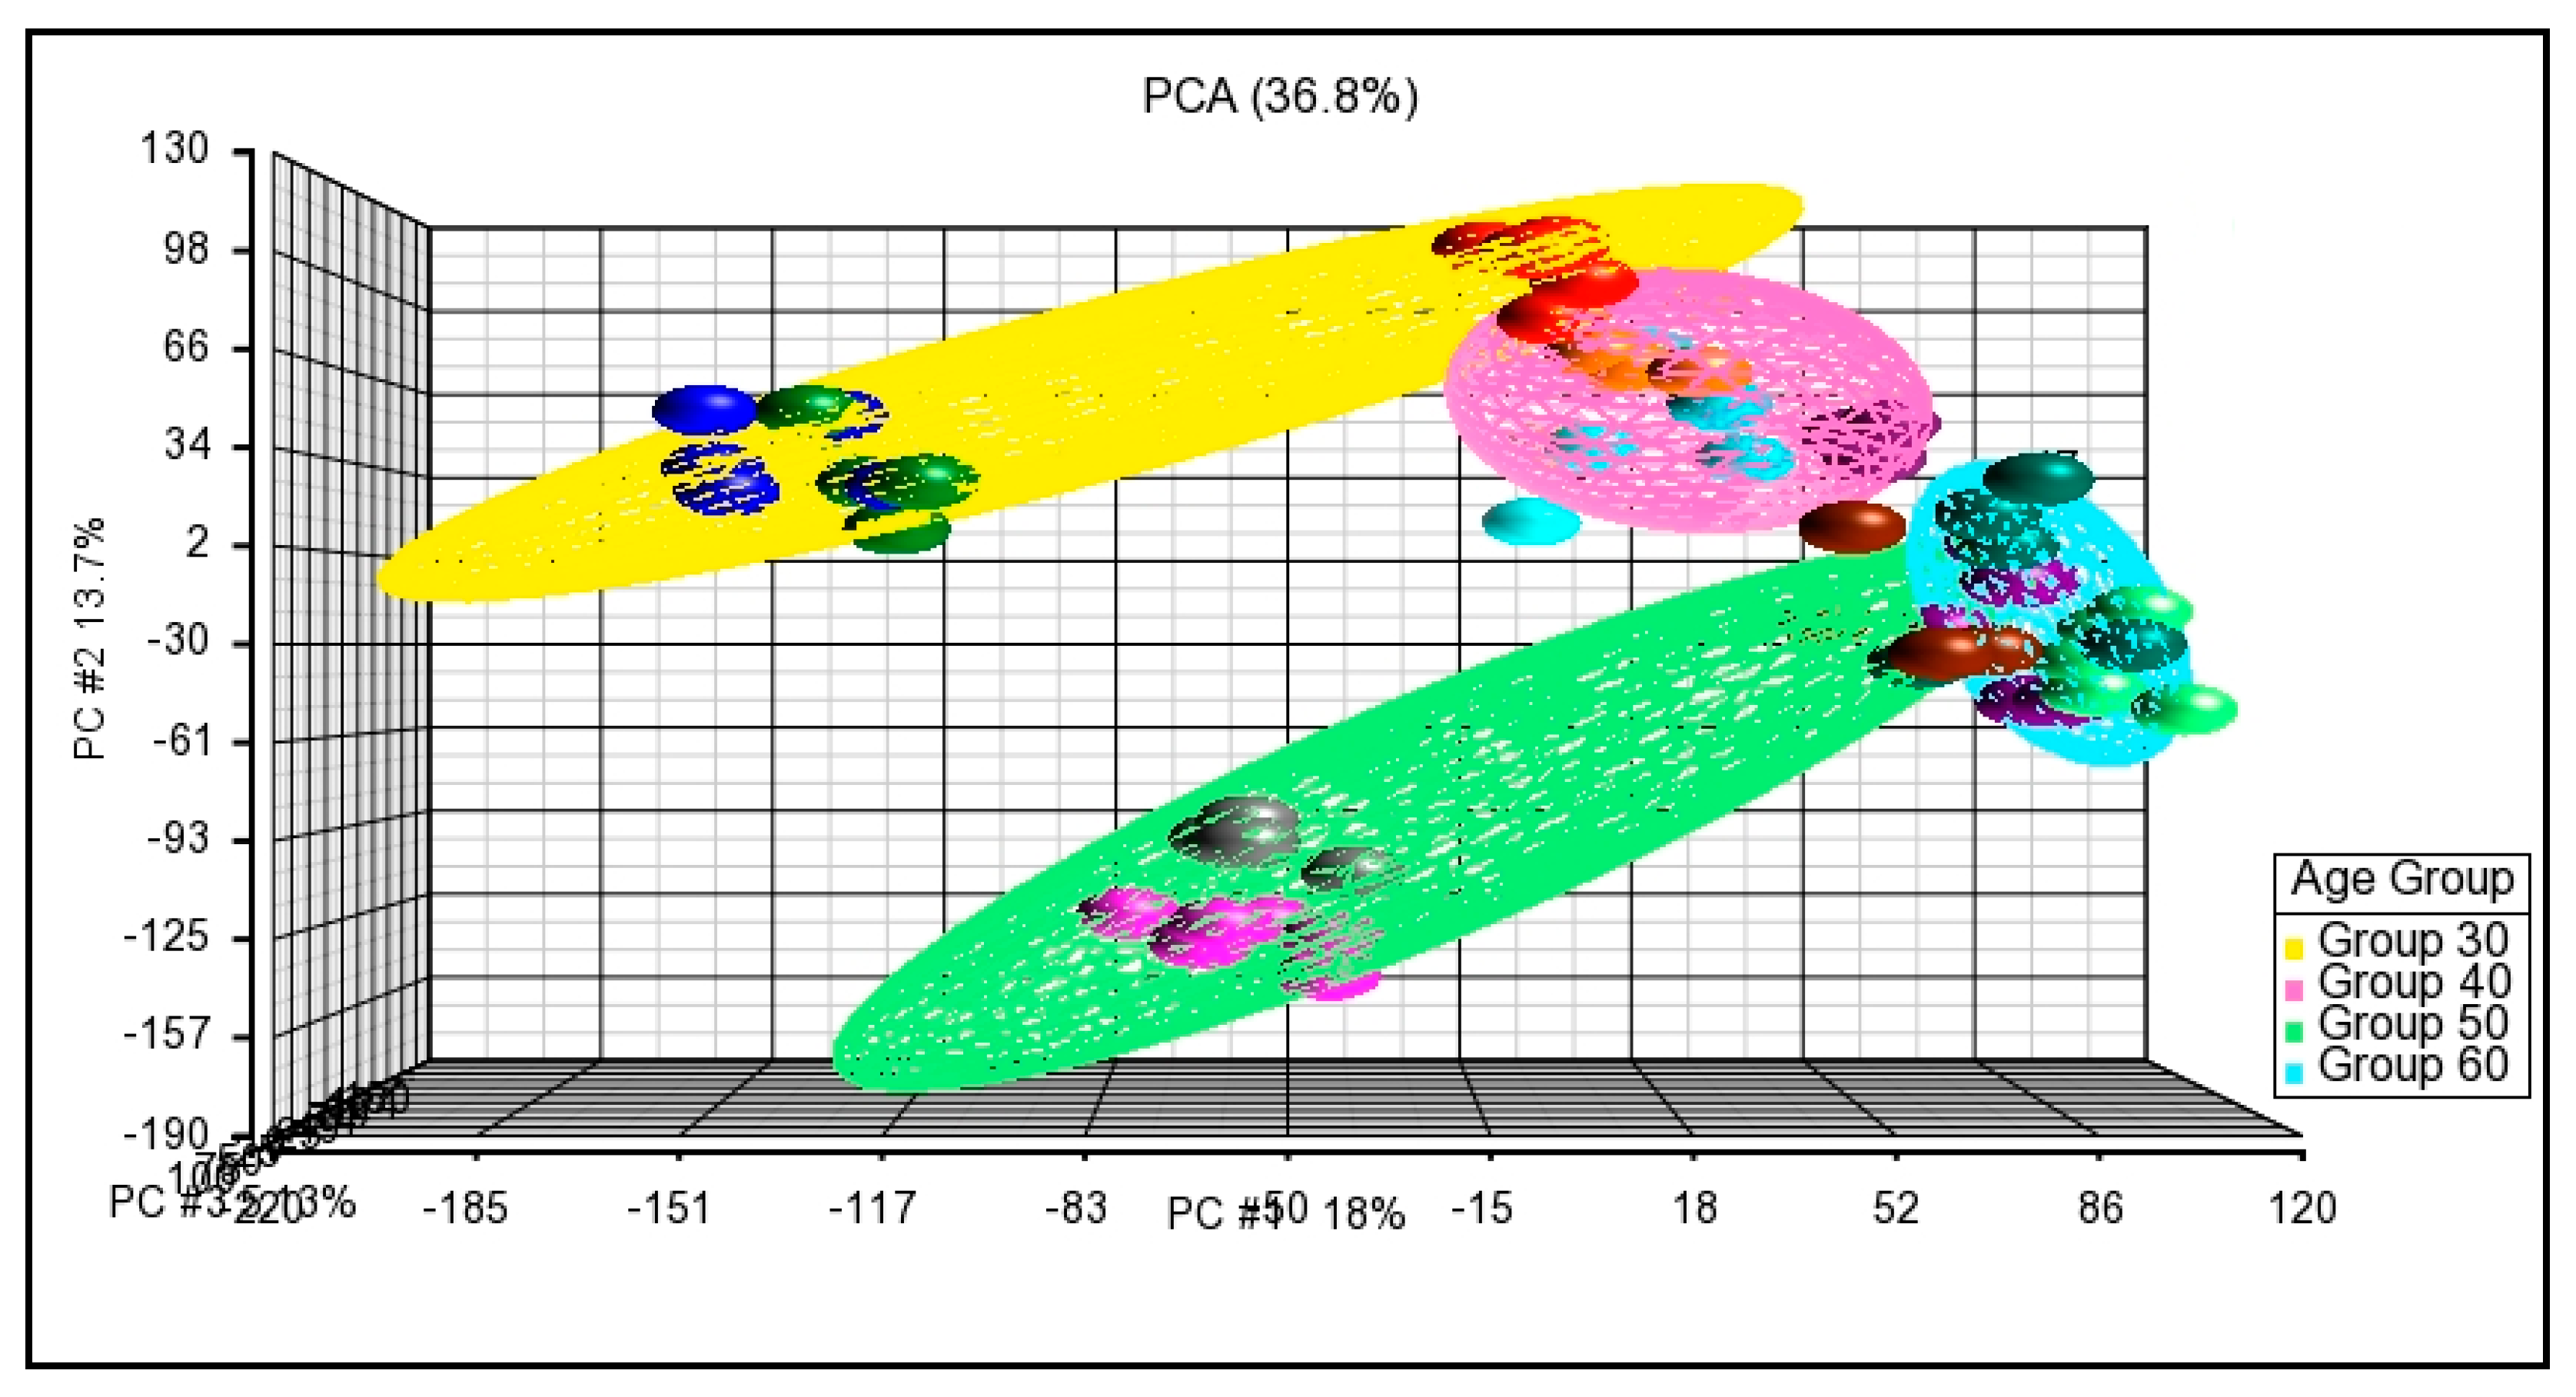
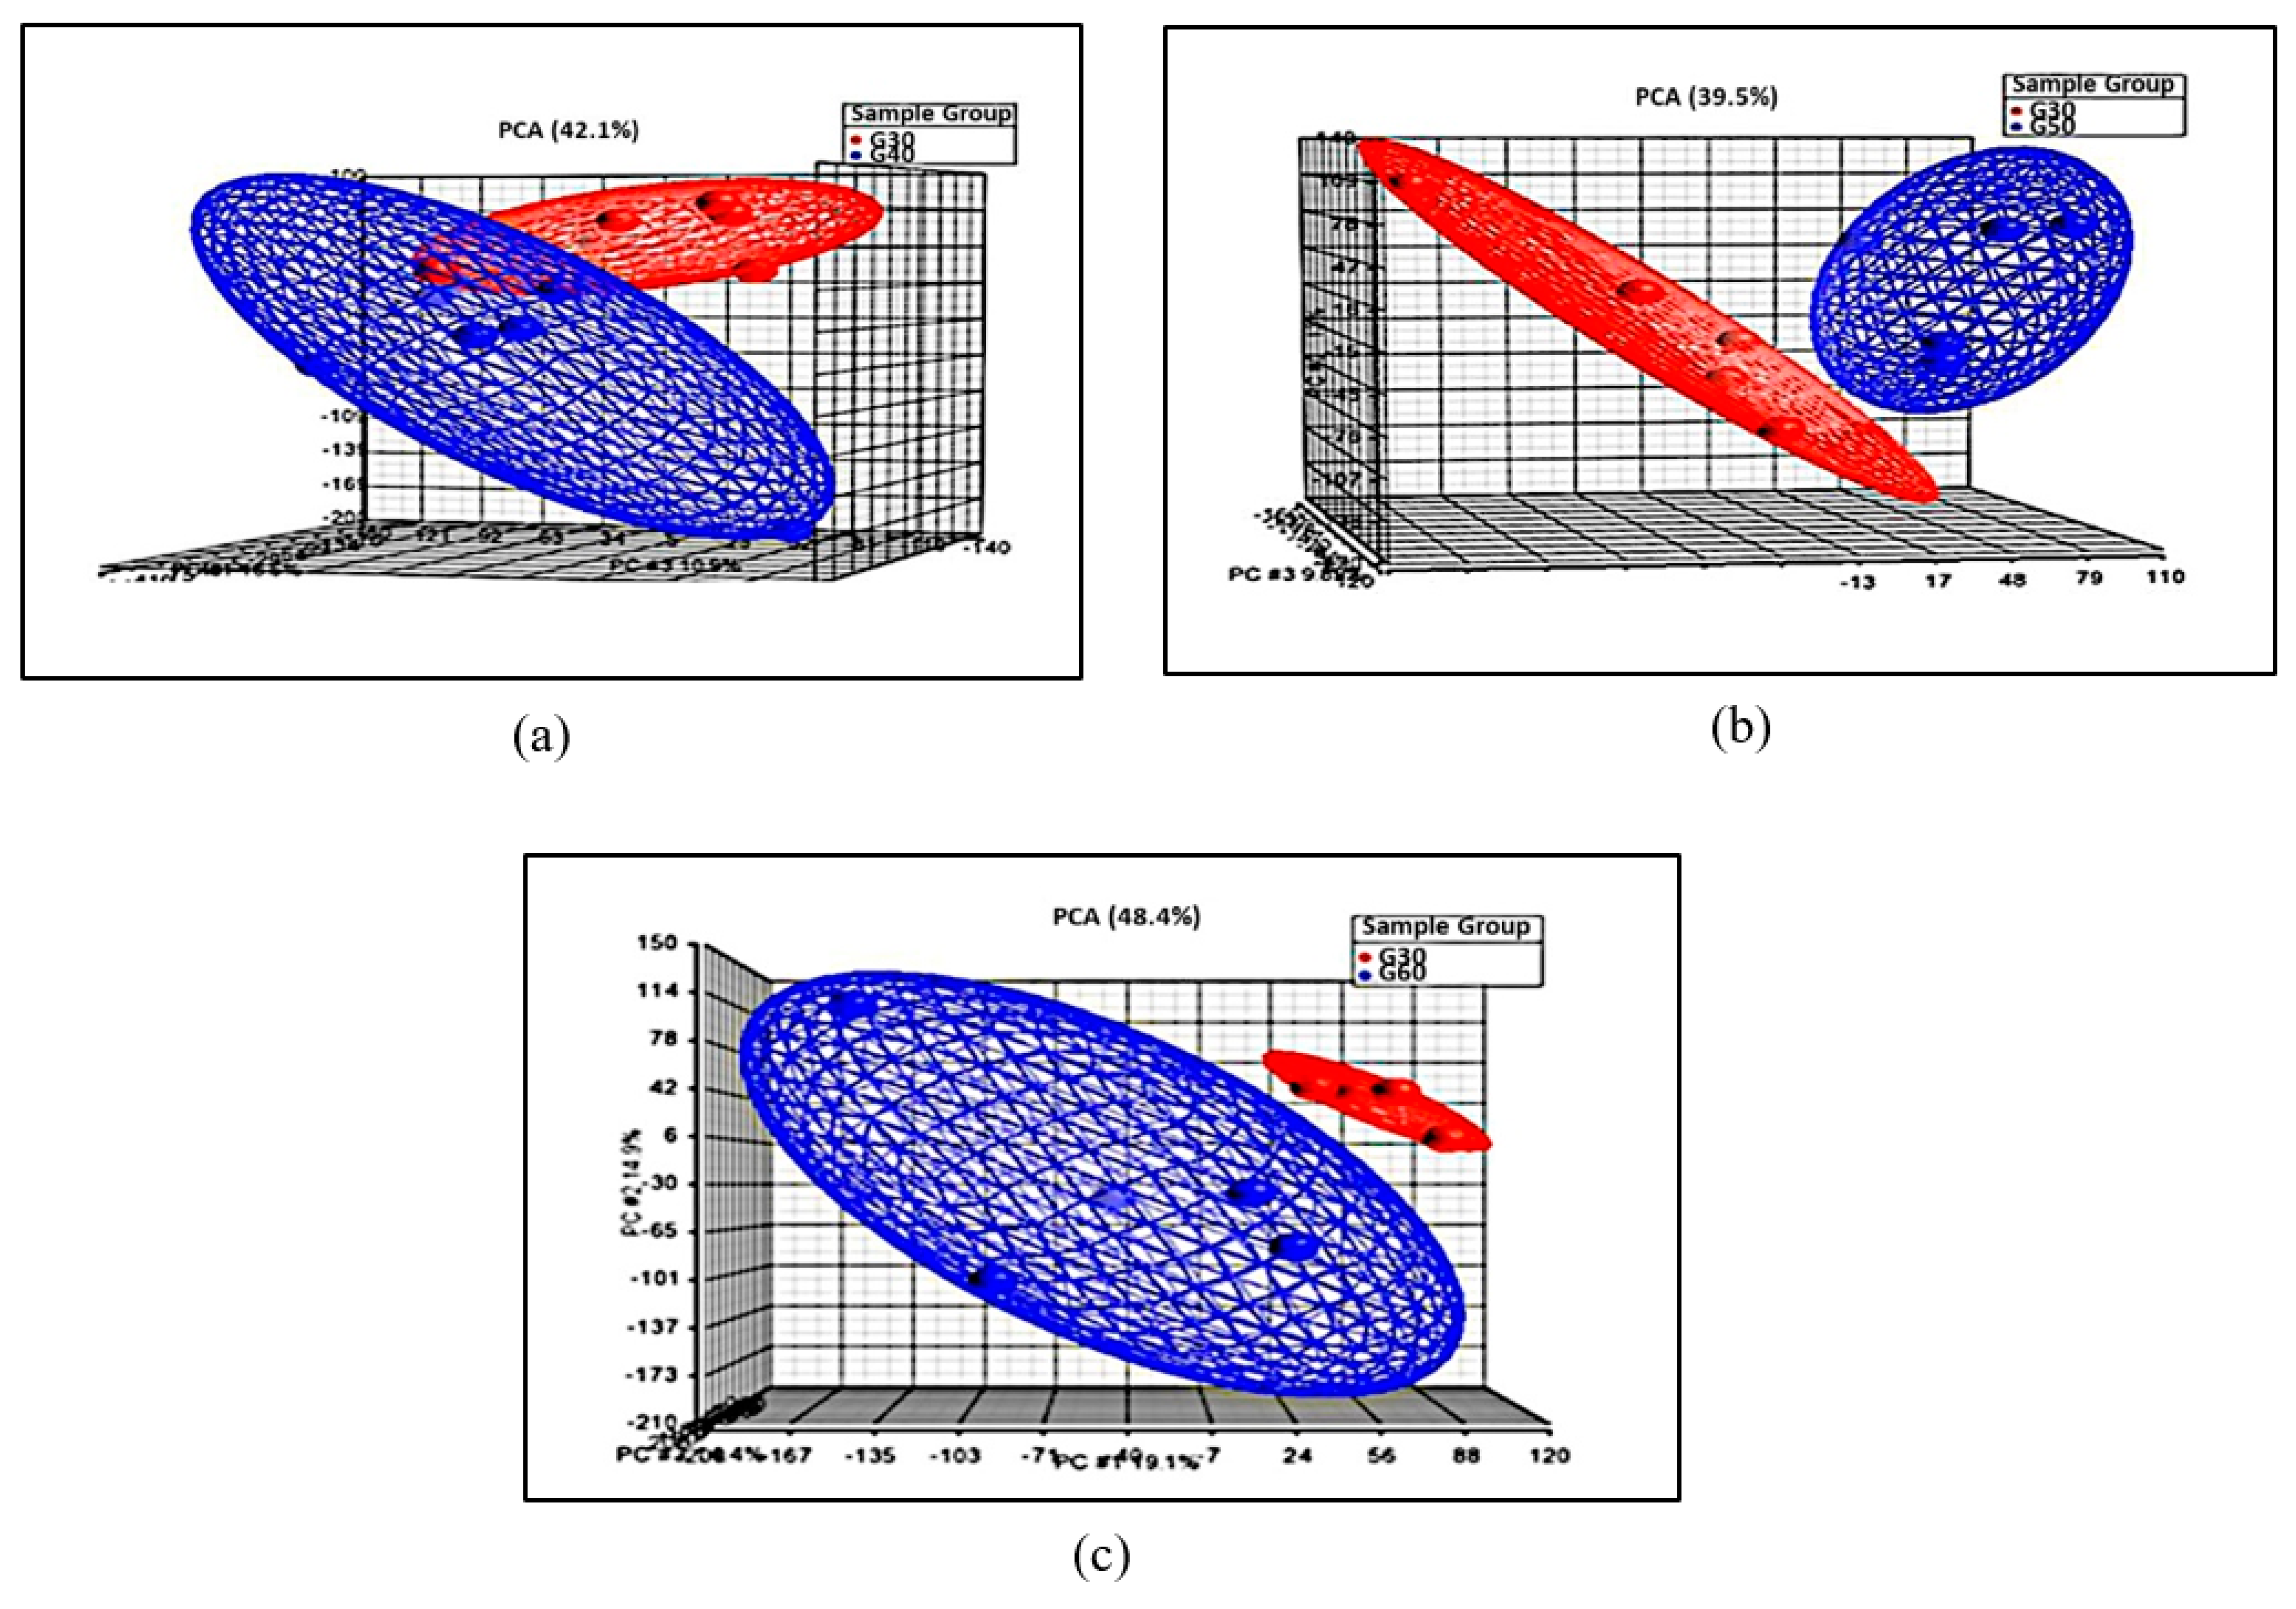
3.3.1. Principal Component Analysis
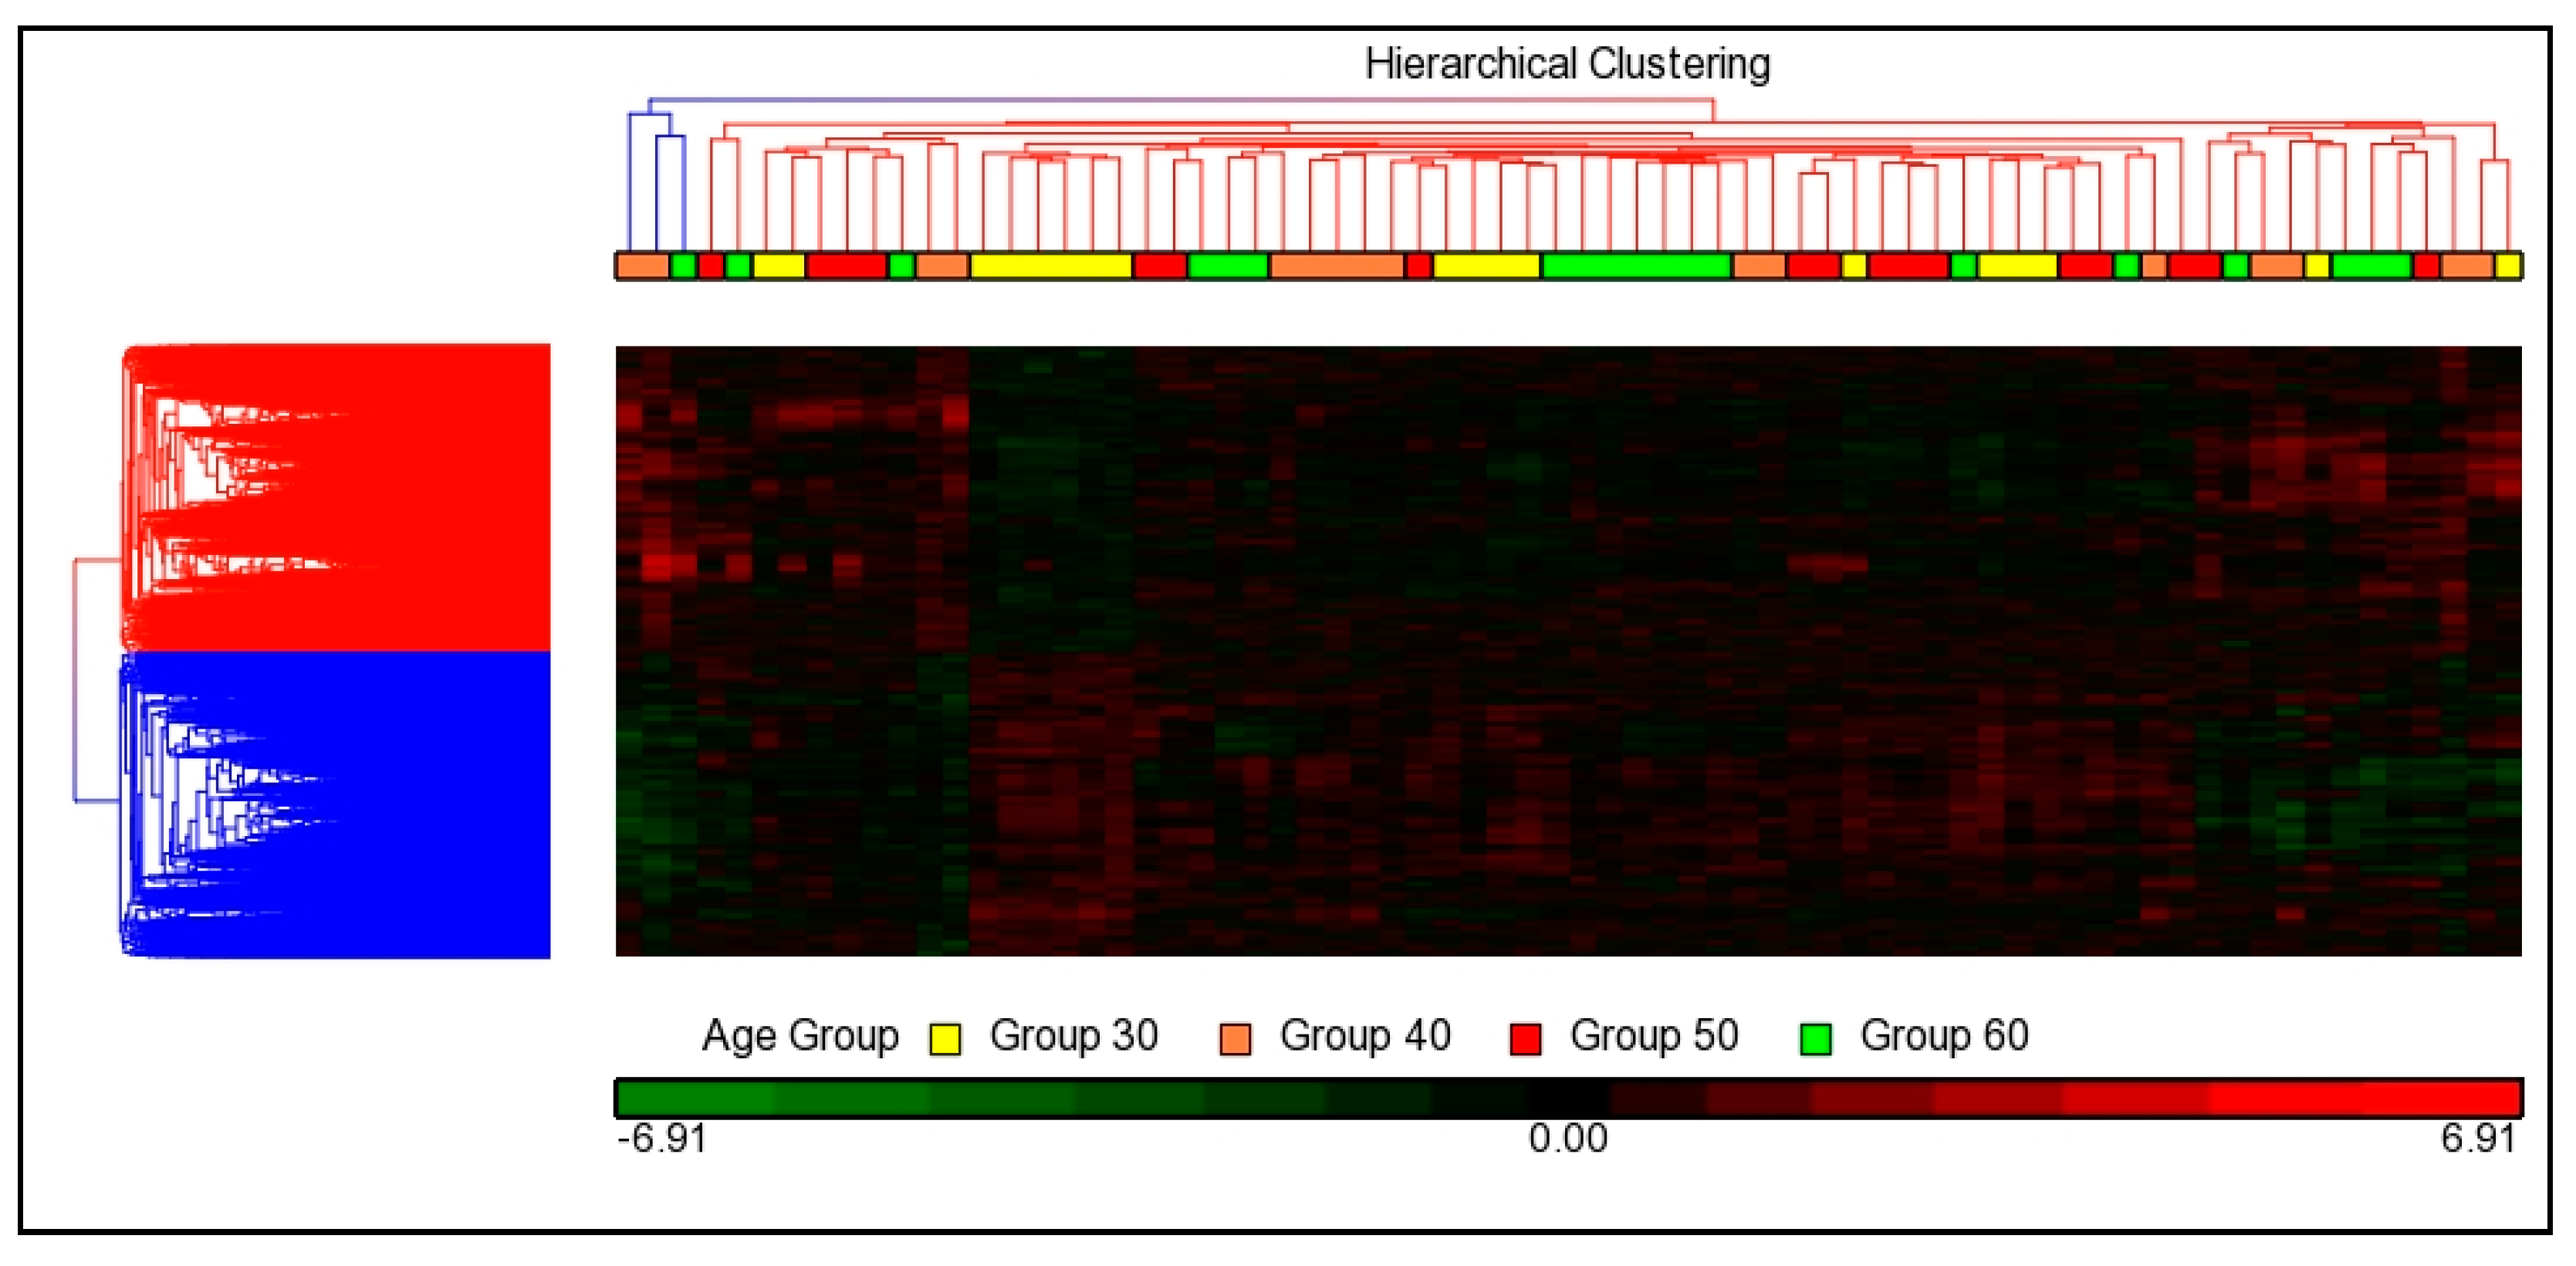
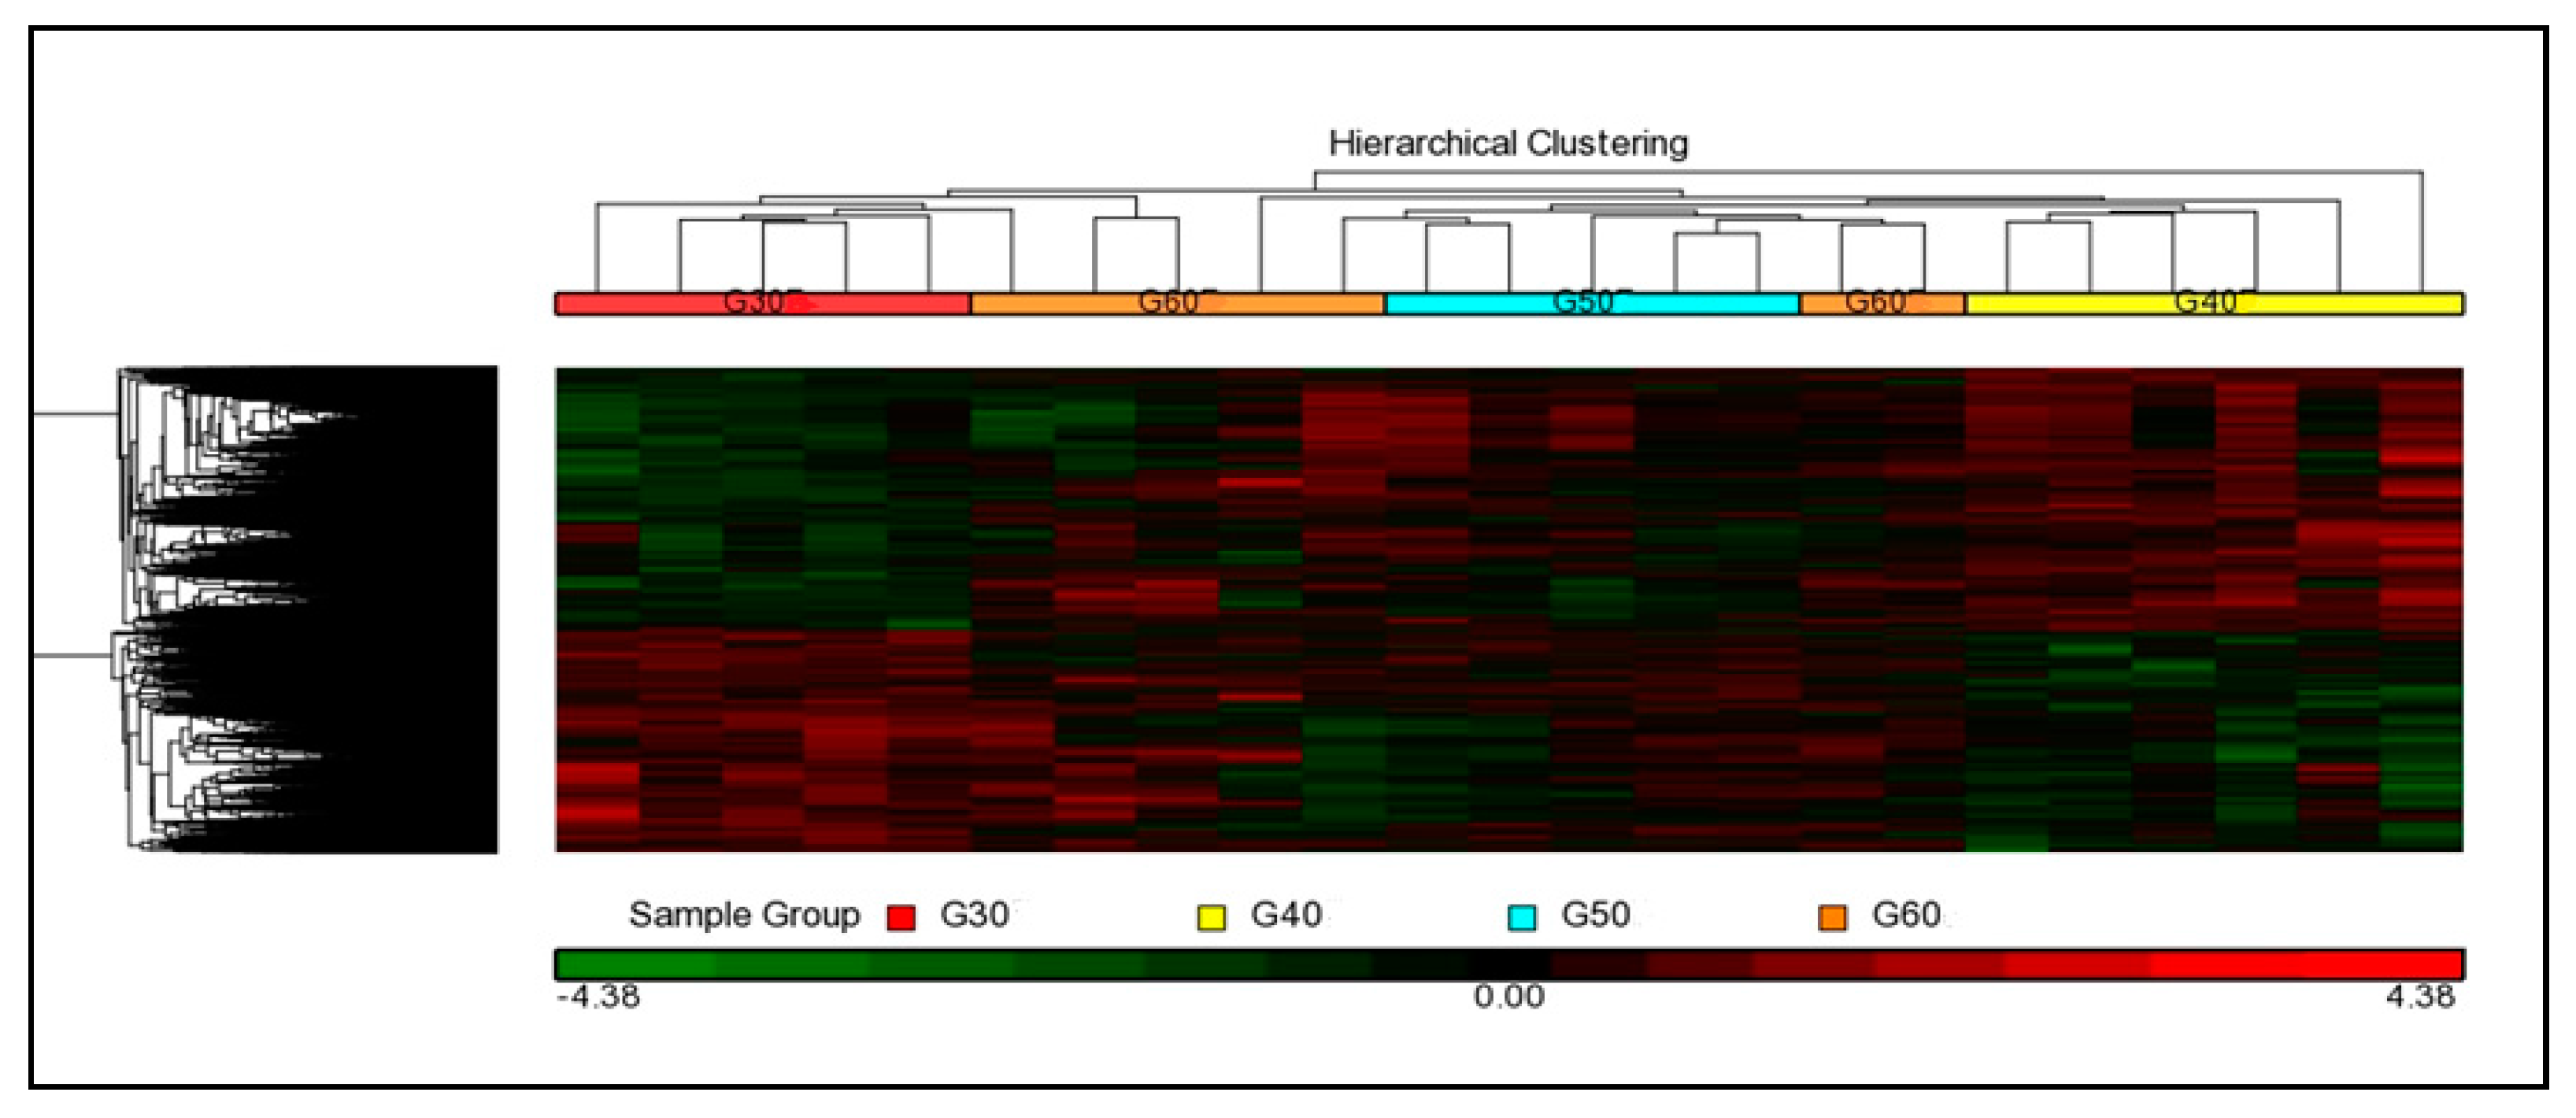
3.3.2. Hierarchical Cluster Analysis
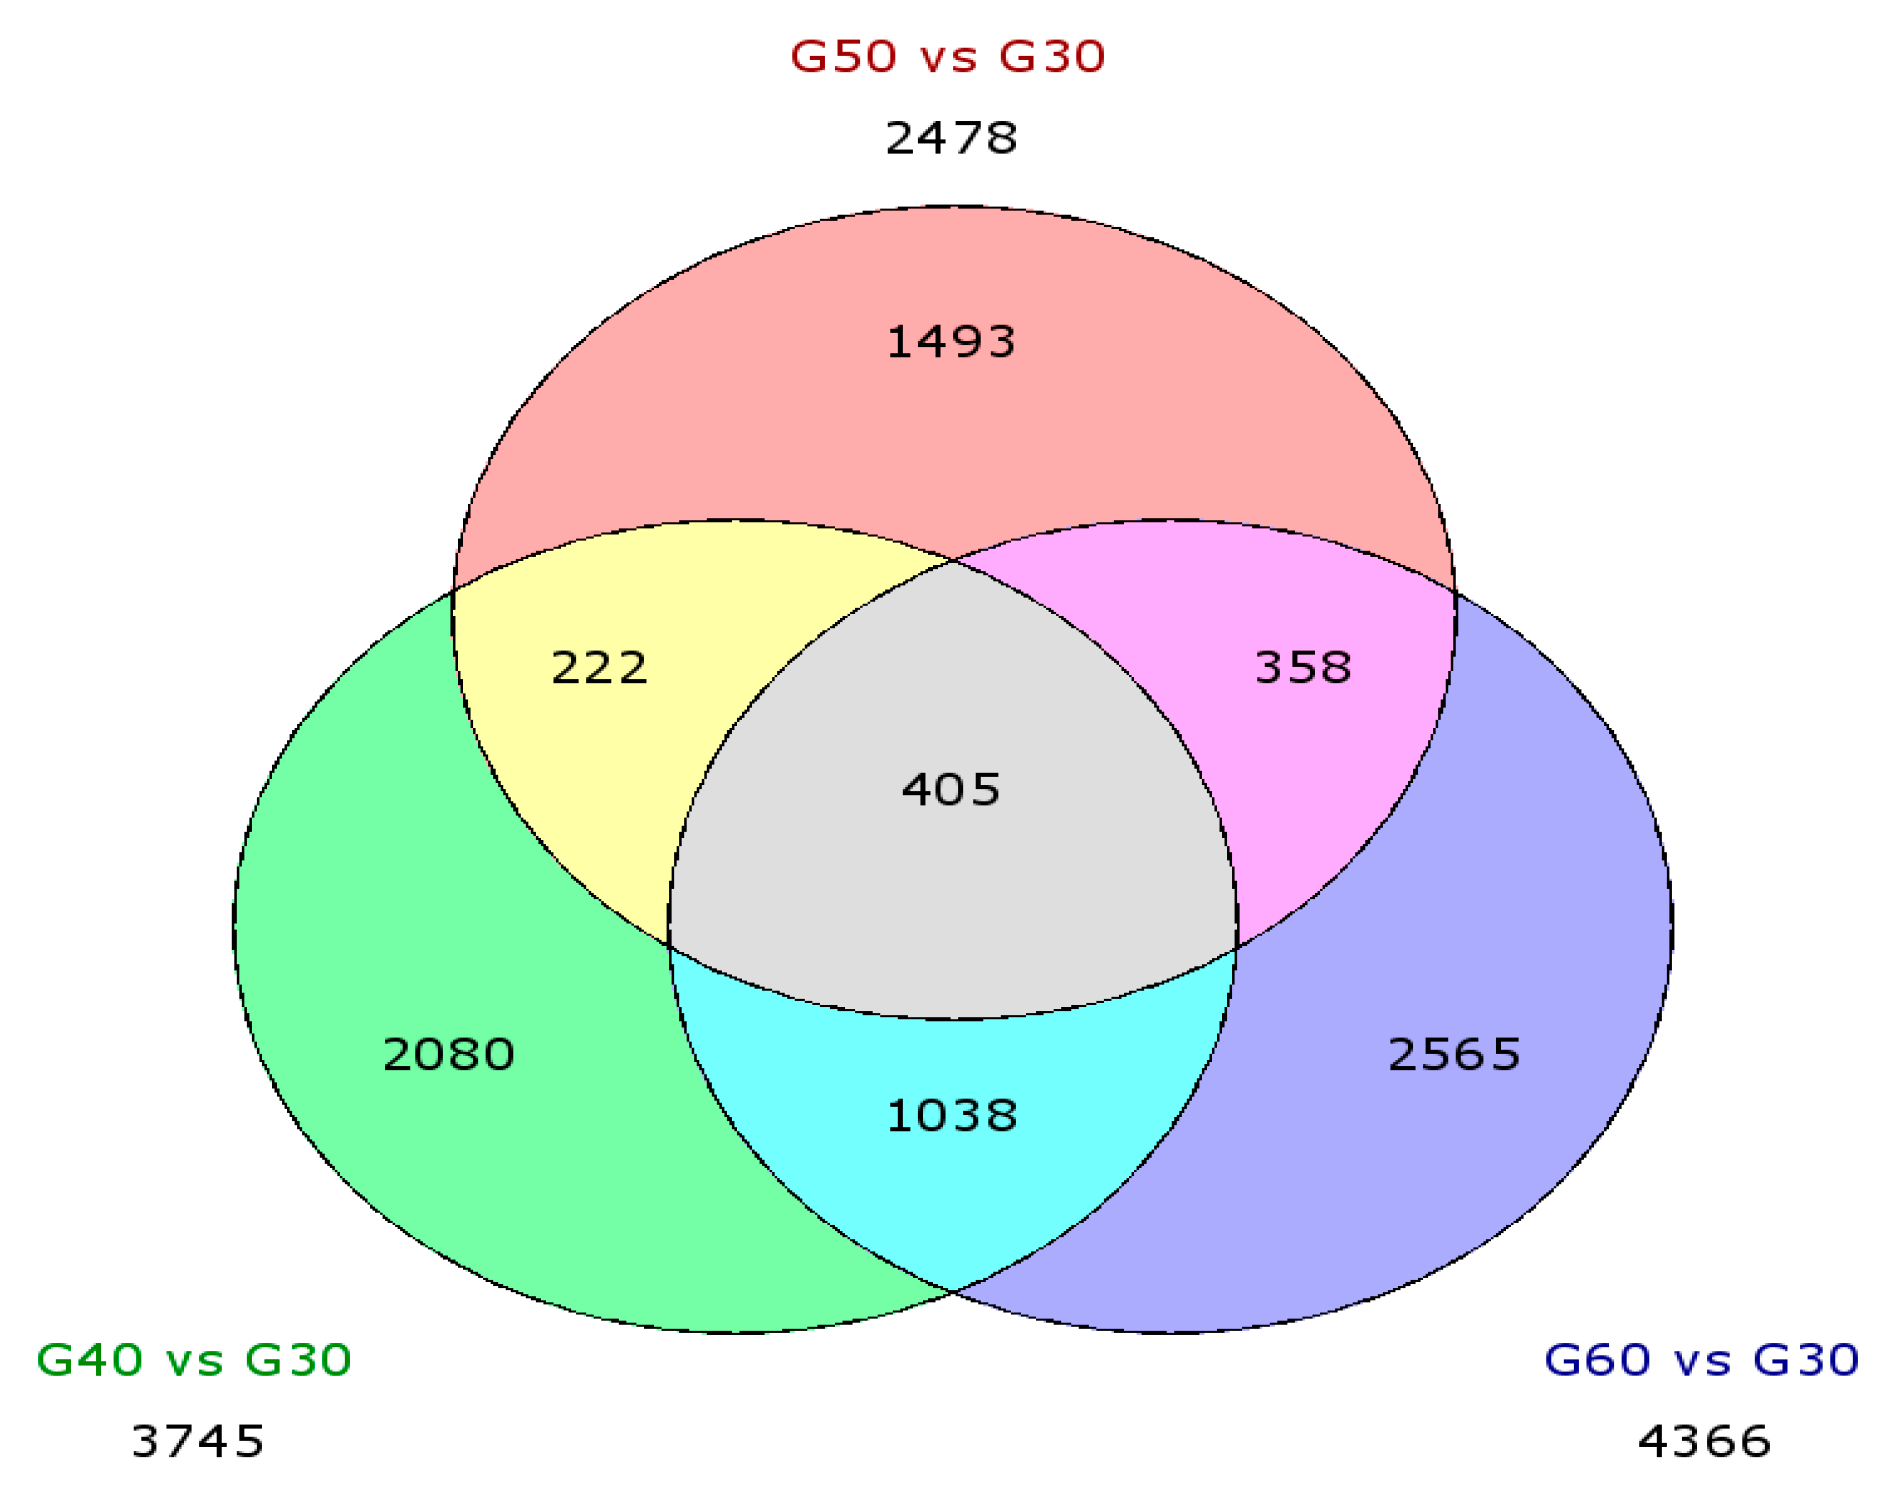
3.3.3. Differential Expression Genes (DEGs)
3.4. Pathway Analysis and Biological Process
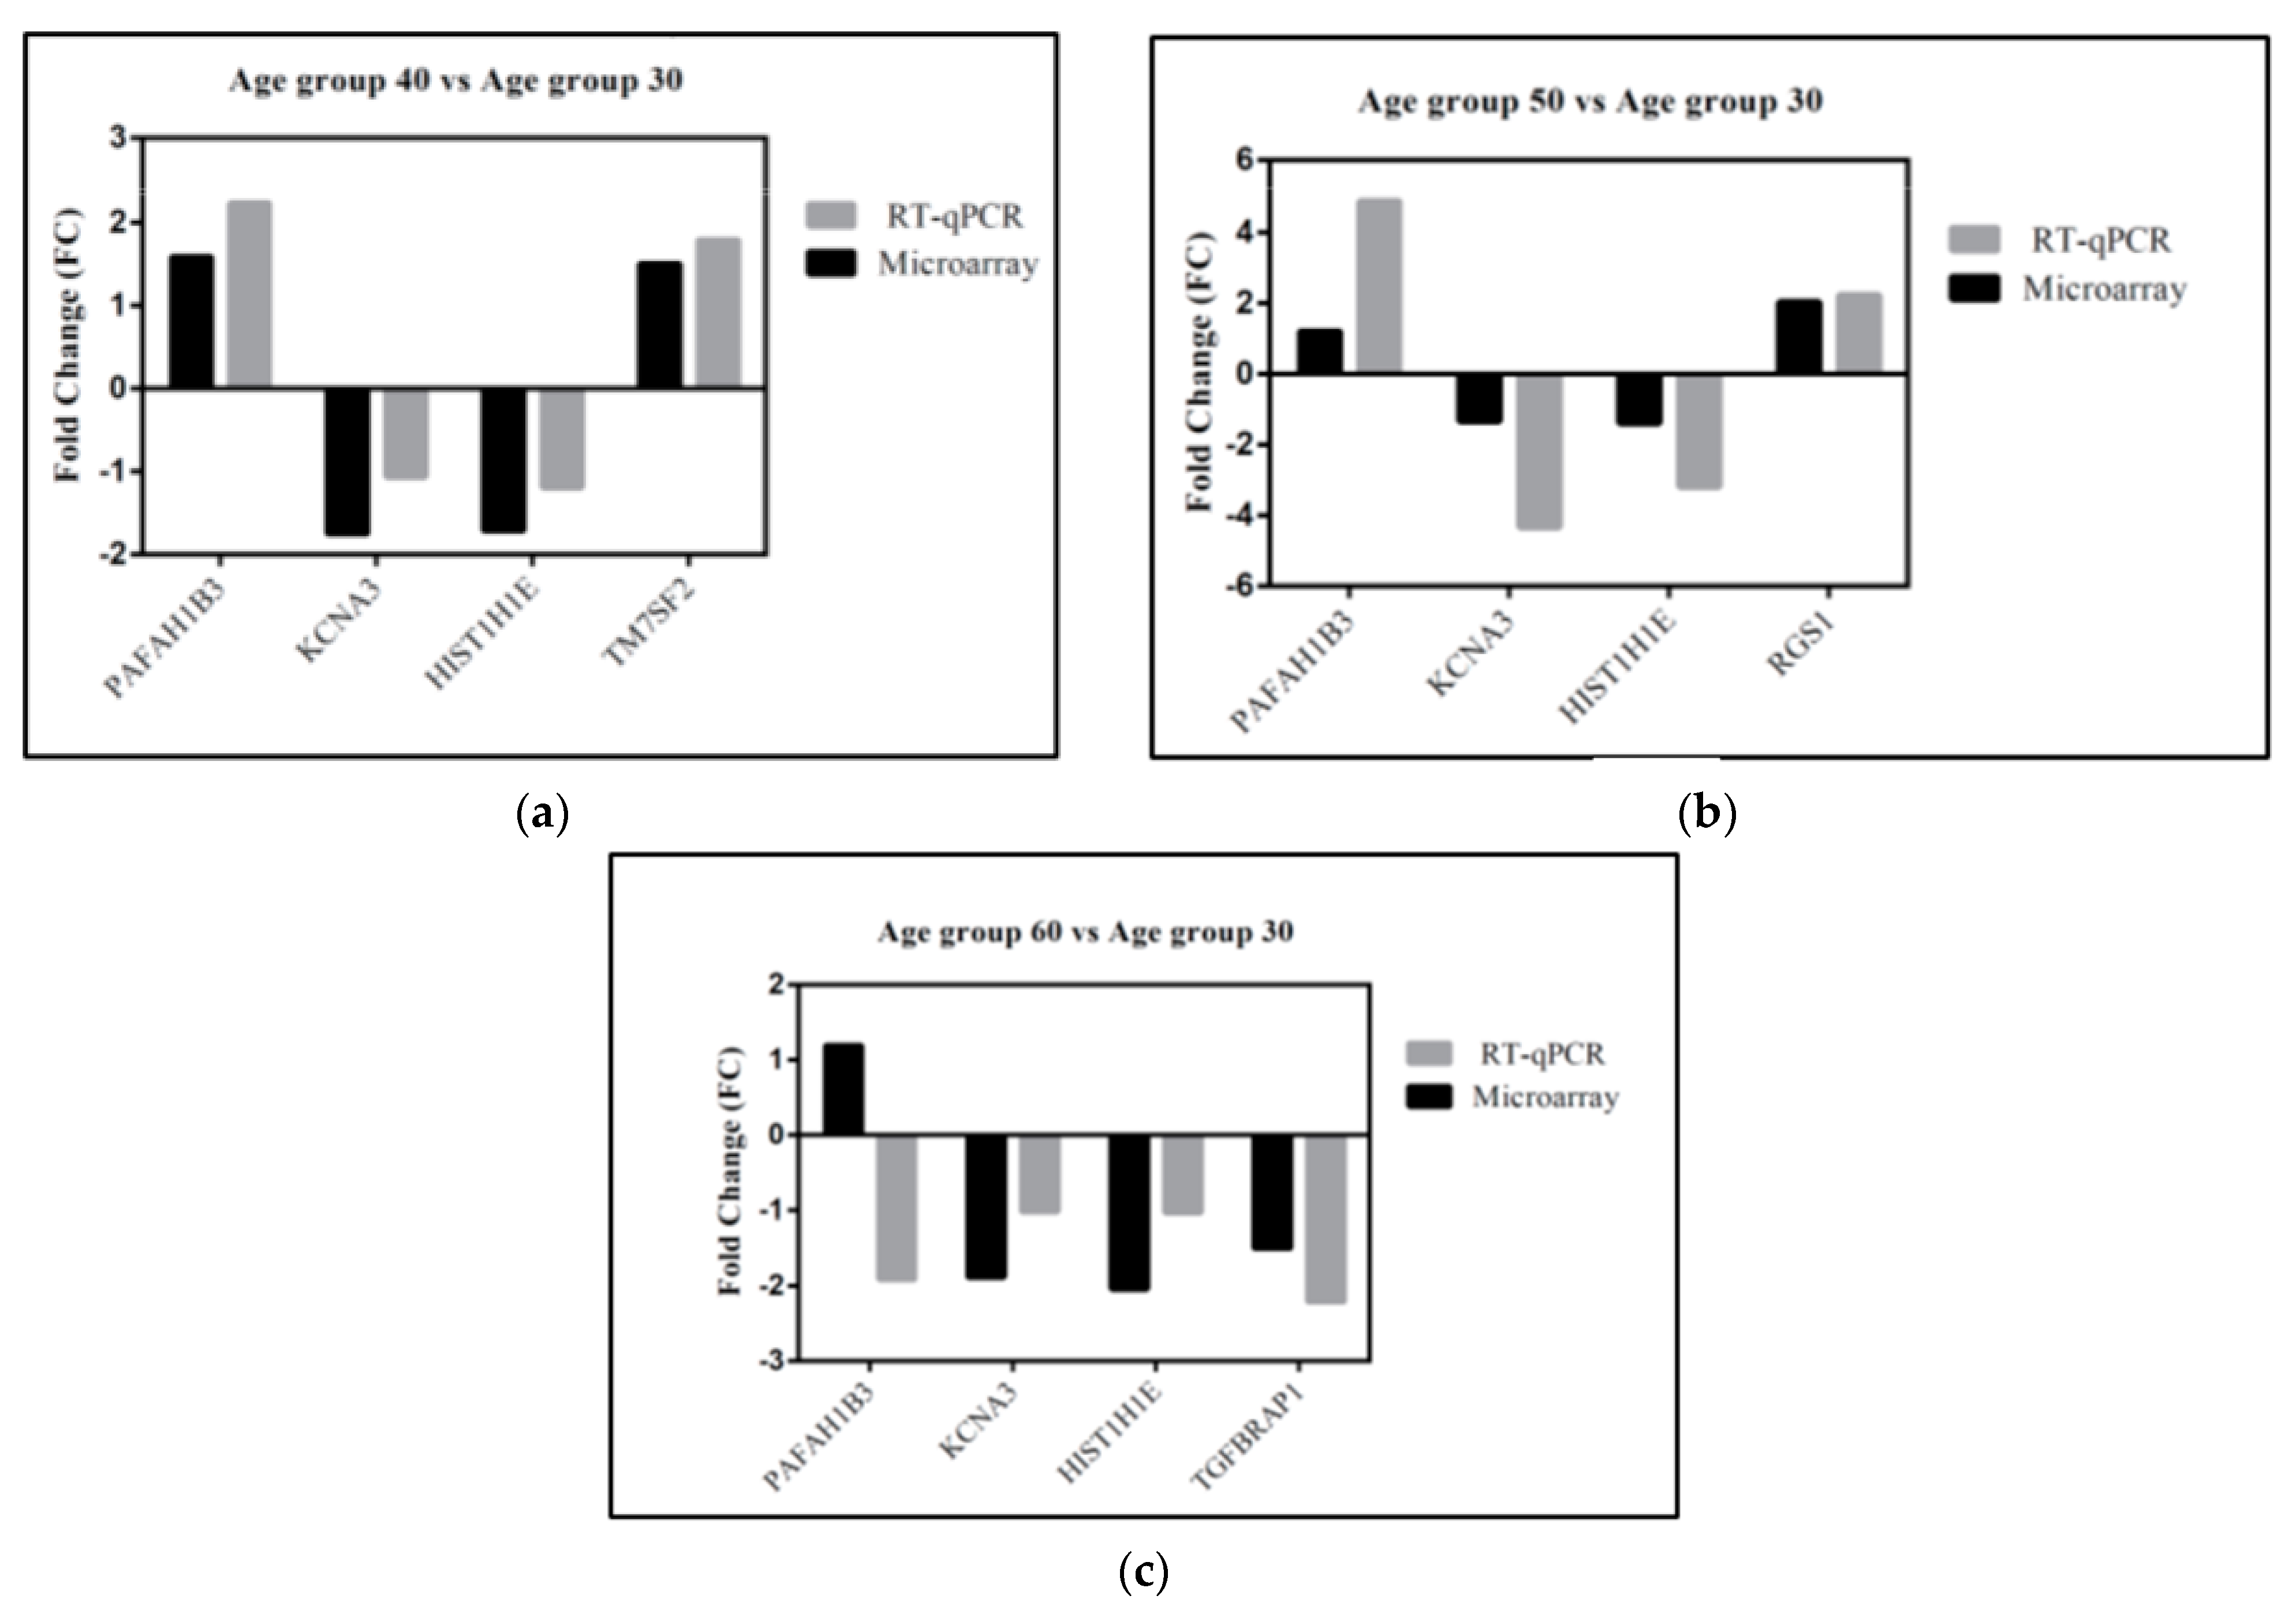
3.5. Gene Validation
4. Discussion
4.1. Alteration Patterns of Gene Expression in Different Age Groups
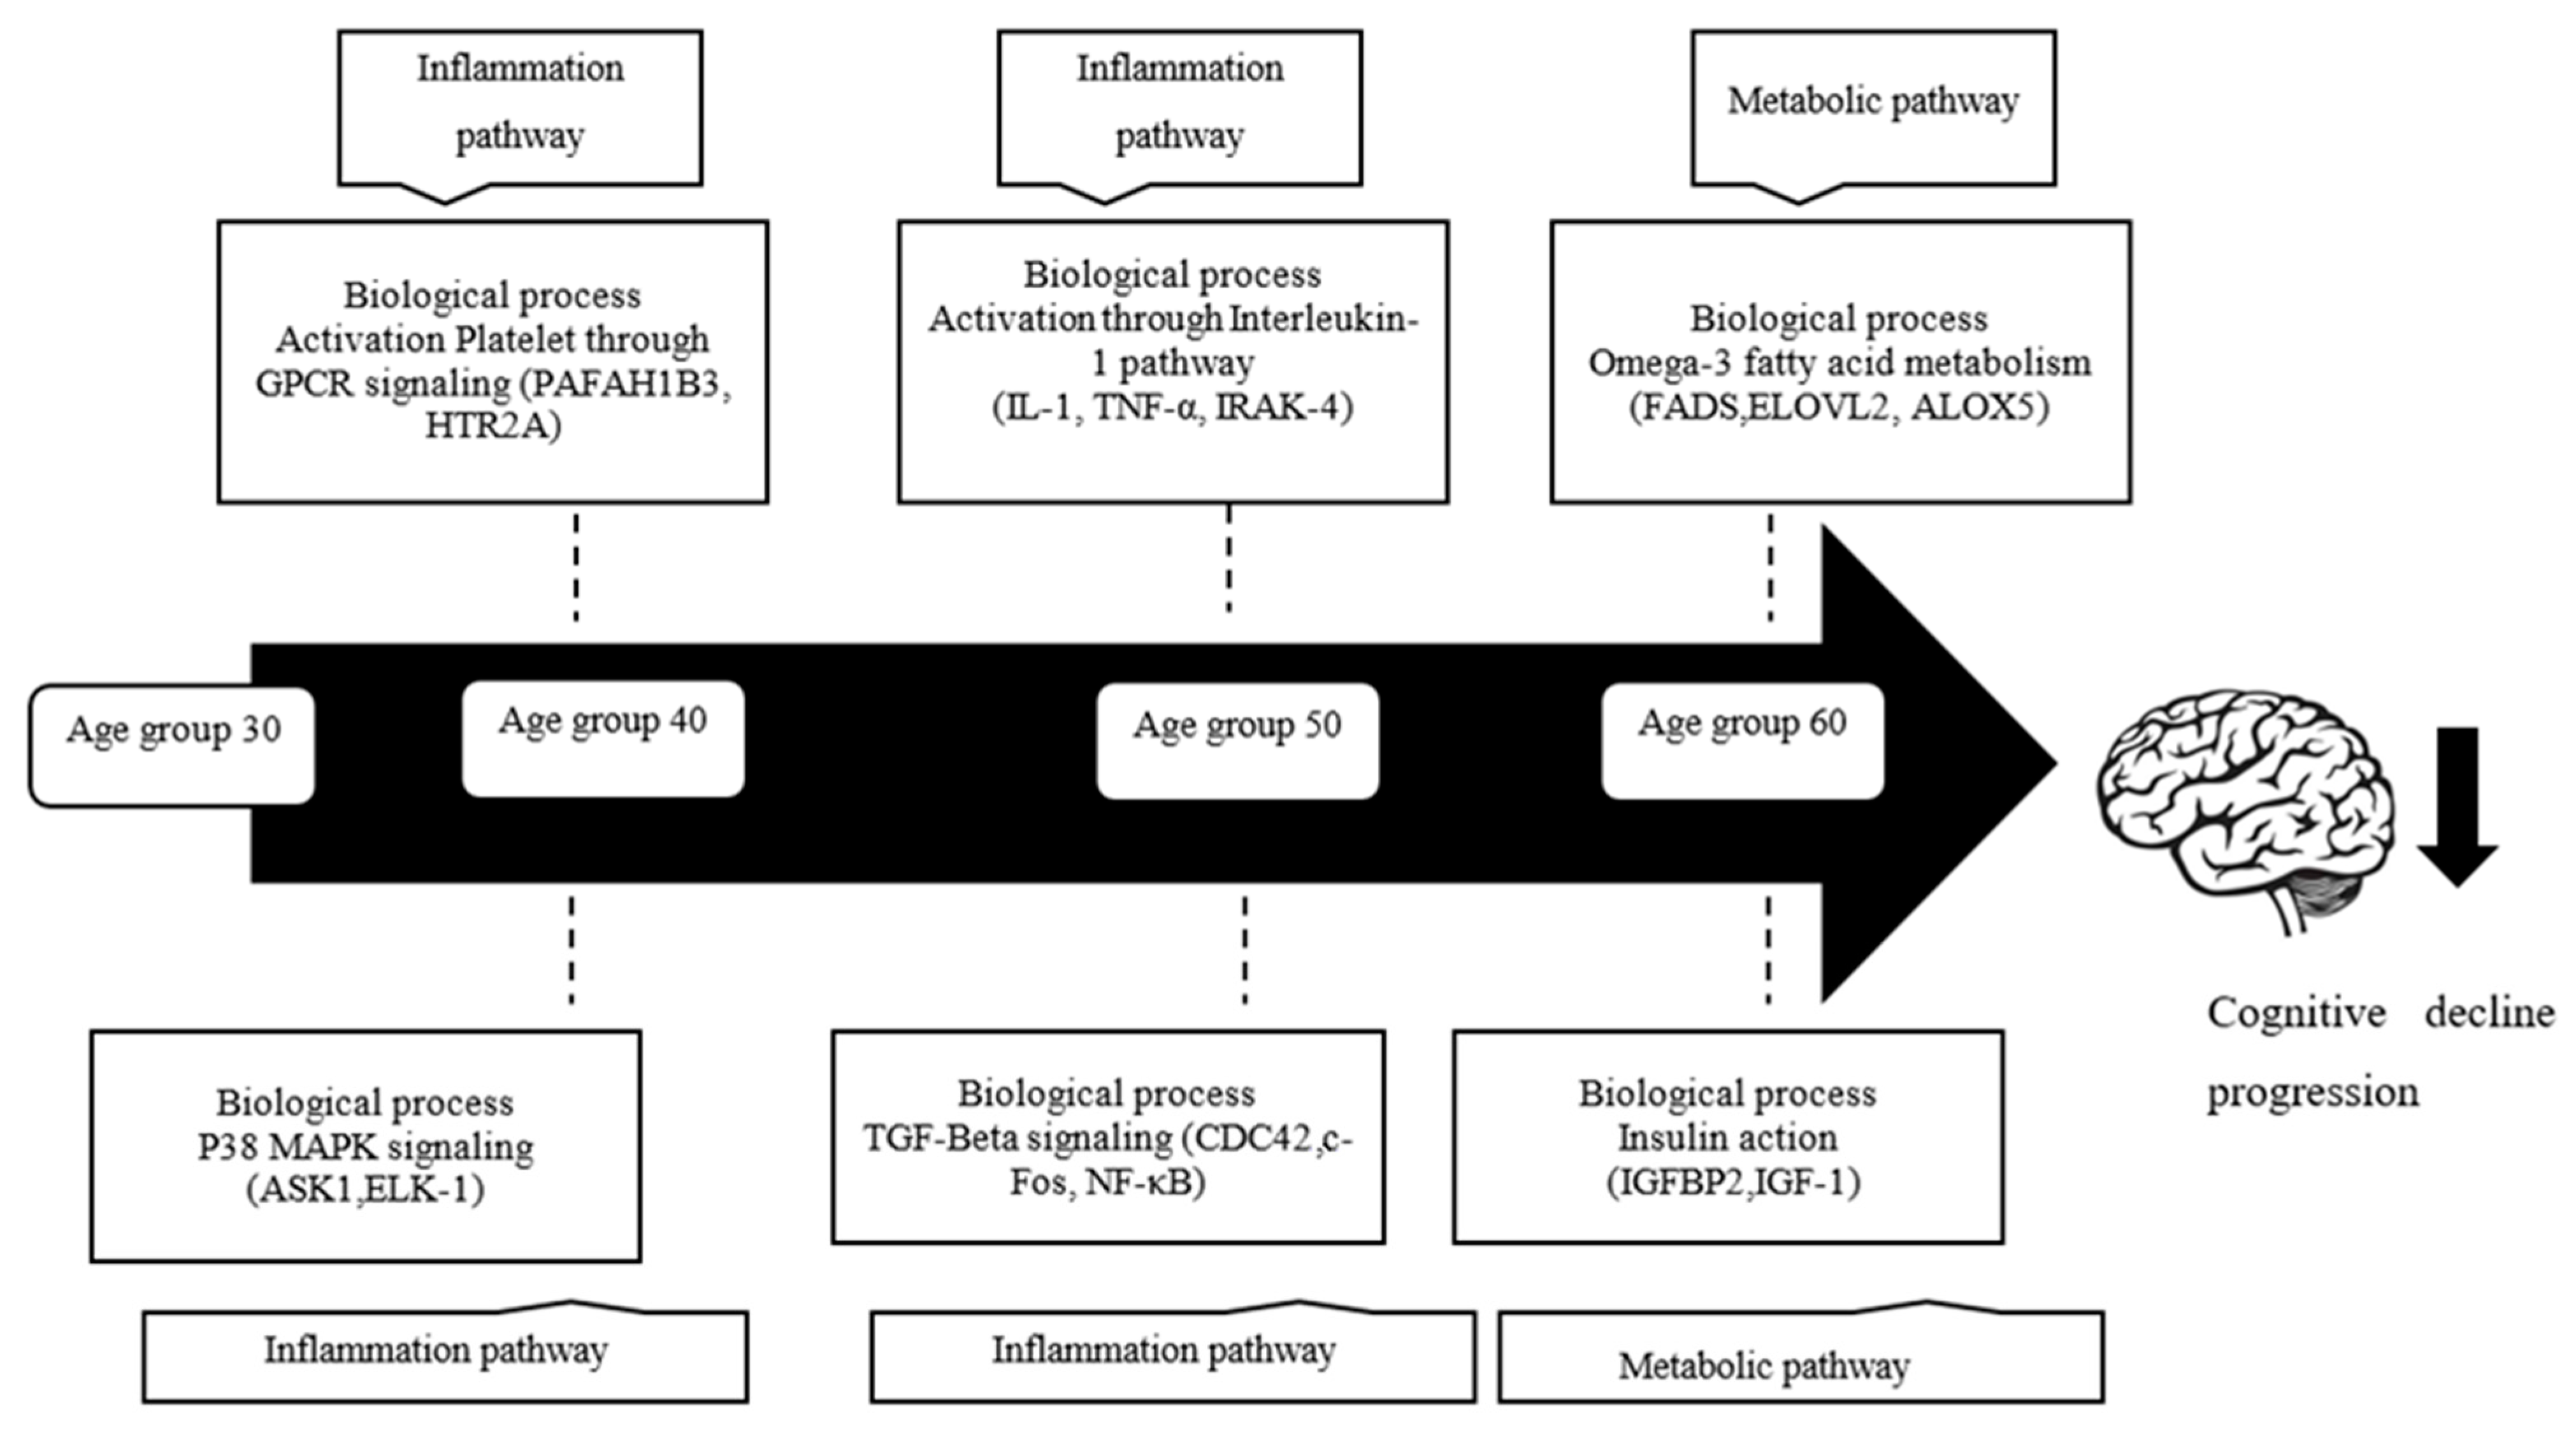
4.2. Biological Processes and Gene Differentially Expressed in Age
4.2.1. Platelet Activation through GPCR Signaling
4.2.2. p38 MAPK/MAPK14 Signaling
4.2.3. Activation through IL-1 Signaling
4.2.4. TGF-β Signaling
4.3. Omega-3-Fatty Acid Metabolism
4.4. Insulin Action
5. Conclusions
Author Contributions
Funding
Institutional Review Board Statement
Informed Consent Statement
Data Availability Statement
Conflicts of Interest
References
- Department of Statistics Malaysia Official Portal. Social Statistics Bulletin, Malaysia; Department of Statistics Malaysia Official Portal: Kuala Lumpur, Malaysia, 2008.
- Mafauzy, M. The problems and challenges of the aging population of Malaysia. Malays. J. Med. Sci. MJMS 2000, 7, 1. [Google Scholar]
- Abdul Sani, N.F.; Ahmad Damanhuri, M.H.; Amir Hamzah, A.I.Z.; Abu Bakar, Z.H.; Tan, J.-K.; Nor Aripin, K.N.; Mohd Rani, M.D.; Noh, N.A.; Shamaan, N.A.; Razali, R. DNA damage and protein oxidation associated with ageing correlate with cognitive dysfunction in a Malaysian population. Free Radic. Res. 2018, 52, 1000–1009. [Google Scholar] [CrossRef]
- Murman, D.L. The impact of age on cognition. Semin. Hear. 2015, 36, 111–121. [Google Scholar] [CrossRef]
- Salthouse, T.A. When does age-related cognitive decline begin? Neurobiol. Aging 2009, 30, 507–514. [Google Scholar] [CrossRef] [PubMed]
- Tramutola, A.; Triplett, J.C.; Di Domenico, F.; Niedowicz, D.M.; Murphy, M.P.; Coccia, R.; Perluigi, M.; Butterfield, D.A. Alteration of mTOR signaling occurs early in the progression of Alzheimer disease (AD): Analysis of brain from subjects with pre-clinical AD, amnestic mild cognitive impairment and late-stage AD. J. Neurochem. 2015, 133, 739–749. [Google Scholar] [CrossRef]
- Aluise, C.D.; Robinson, R.A.S.; Beckett, T.L.; Murphy, M.P.; Cai, J.; Pierce, W.M.; Markesbery, W.R.; Butterfield, D.A. Preclinical Alzheimer disease: Brain oxidative stress, Aβ peptide and proteomics. Neurobiol. Dis. 2010, 39, 221–228. [Google Scholar] [CrossRef] [PubMed]
- Pieperhoff, P.; Hömke, L.; Schneider, F.; Habel, U.; Shah, N.J.; Zilles, K.; Amunts, K. Deformation field morphometry reveals age-related structural differences between the brains of adults up to 51 years. J. Neurosci. 2008, 28, 828–842. [Google Scholar] [CrossRef]
- Goodro, M.; Sameti, M.; Patenaude, B.; Fein, G. Age effect on subcortical structures in healthy adults. Psychiatry Res. Neuroimaging 2012, 203, 38–45. [Google Scholar] [CrossRef]
- Hsu, J.-L.; Leemans, A.; Bai, C.-H.; Lee, C.-H.; Tsai, Y.-F.; Chiu, H.-C.; Chen, W.-H. Gender differences and age-related white matter changes of the human brain: A diffusion tensor imaging study. Neuroimage 2008, 39, 566–577. [Google Scholar] [CrossRef] [PubMed]
- Bennett, I.J.; Madden, D.J.; Vaidya, C.J.; Howard, D.V.; Howard, J.H., Jr. Age-related differences in multiple measures of white matter integrity: A diffusion tensor imaging study of healthy aging. Hum. Brain Mapp. 2010, 31, 378–390. [Google Scholar] [CrossRef]
- Braak, H.; Del Tredici, K. The pathological process underlying Alzheimer’s disease in individuals under thirty. Acta Neuropathol. 2011, 121, 171–181. [Google Scholar] [CrossRef]
- Del Tredici, K.; Braak, H. Neurofibrillary changes of the Alzheimer type in very elderly individuals: Neither inevitable nor benign: Commentary on “No disease in the brain of a 115-year-old woman”. Neurobiol. Aging 2008, 29, 1133–1136. [Google Scholar] [CrossRef]
- Kadota, T.; Horinouchi, T.; Kuroda, C. Development and aging of the cerebrum: Assessment with proton MR spectroscopy. Am. J. Neuroradiol. 2001, 22, 128–135. [Google Scholar]
- Haga, K.K.; Khor, Y.P.; Farrall, A.; Wardlaw, J.M. A systematic review of brain metabolite changes, measured with 1H magnetic resonance spectroscopy, in healthy aging. Neurobiol. Aging 2009, 30, 353–363. [Google Scholar] [CrossRef]
- Mosca, I.; Wright, R.E. Effect of retirement on cognition: Evidence from the Irish marriage bar. Demography 2018, 55, 1317–1341. [Google Scholar] [CrossRef]
- Lee, T.; Thalamuthu, A.; Henry, J.; Trollor, J.; Ames, D.; Wright, M.; Sachdev, P. Genetic and environmental influences on language ability in older adults: Findings from the older Australian Twins Study. Behav. Genet. 2018, 48, 187–197. [Google Scholar] [CrossRef] [PubMed]
- Ericsson, M.; Lundholm, C.; Fors, S.; Aslan, A.K.D.; Zavala, C.; Reynolds, C.A.; Pedersen, N.L. Childhood social class and cognitive aging in the Swedish Adoption/Twin Study of Aging. Proc. Natl. Acad. Sci. USA 2017, 114, 7001–7006. [Google Scholar] [CrossRef] [PubMed]
- Lim, S.C.; Gan, W.Y.; Chan, Y.M. The effects of socio-demographic characteristics, nutritional status, physical activity and physical function on cognitive function of community-dwelling older adults in the Klang Valley, Malaysia. Malays. J. Med. Health Sci. 2020, 16, 163–169. [Google Scholar]
- Rashid, A.; Rahmah, M. Role of family support in older adults defaulting treatment for depression: A case-control study. J. Asian J. Gerontol Geriatr. Malas. 2011, 6, 29–34. [Google Scholar]
- Ng, T.-P.; Niti, M.; Chiam, P.-C.; Kua, E.-H. Ethnic and educational differences in cognitive test performance on mini-mental state examination in Asians. Am. J. Geriatr. Psychiatry 2007, 15, 130–139. [Google Scholar] [CrossRef] [PubMed]
- Tan, C.; Tai, E.S.; Tan, C.; Chia, K.; Lee, J.; Chew, S.; Ordovas, J. APOE polymorphism and lipid profile in three ethnic groups in the Singapore population. Atherosclerosis 2003, 170, 253–260. [Google Scholar] [CrossRef]
- Seet, W.T.; Anne, T.J.A.M.; Yen, T.S. Apolipoprotein E genotyping in the Malay, Chinese and Indian ethnic groups in Malaysia—a study on the distribution of the different apoE alleles and genotypes. Clin. Chim. Acta 2004, 340, 201–205. [Google Scholar] [CrossRef] [PubMed]
- Mahley, R.W. Apolipoprotein E: From cardiovascular disease to neurodegenerative disorders. J. Mol. Med. 2016, 94, 739–746. [Google Scholar] [CrossRef] [PubMed]
- Heng, D.; Lee, J.; Chew, S.; Tan, B.; Hughes, K.; Chia, K. Incidence of ischaemic heart disease and stroke in Chinese, Malays and Indians in Singapore: Singapore Cardiovascular Cohort Study. Ann. Acad. Med. Singap. 2000, 29, 231–236. [Google Scholar]
- Razali, R.; Baharudin, A.; Jaafar, N.R.N.; Sidi, H.; Rosli, A.H.; Hooi, K.B. Factors associated with mild cognitive impairment among elderly patients attending medical clinics in Universiti Kebangsaan Malaysia Medical Centre. Sains Malays. 2012, 41, 641–647. [Google Scholar]
- Pu’un, B.I.; Othman, Z.; Drahman, I. Dementia among elderly Melanau: A community survey of an indigenous people in East Malaysia. Int. Med. J. 2014, 21, 1–4. [Google Scholar]
- Janelidze, S.; Stomrud, E.; Palmqvist, S.; Zetterberg, H.; Van Westen, D.; Jeromin, A.; Song, L.; Hanlon, D.; Hehir, C.A.T.; Baker, D. Plasma β-amyloid in Alzheimer’s disease and vascular disease. Sci. Rep. 2016, 6, 1–11. [Google Scholar] [CrossRef]
- Cosentino, S.A.; Stern, Y.; Sokolov, E.; Scarmeas, N.; Manly, J.J.; Tang, M.X.; Schupf, N.; Mayeux, R.P. Plasma β-amyloid and cognitive decline. Arch. Neurol. 2010, 67, 1485–1490. [Google Scholar] [CrossRef]
- Ray, S.; Britschgi, M.; Herbert, C.; Takeda-Uchimura, Y.; Boxer, A.; Blennow, K.; Friedman, L.F.; Galasko, D.R.; Jutel, M.; Karydas, A. Classification and prediction of clinical Alzheimer’s diagnosis based on plasma signaling proteins. Nat. Med. 2007, 13, 1359–1362. [Google Scholar] [CrossRef]
- Fehlbaum-Beurdeley, P.; Jarrige-Le Prado, A.C.; Pallares, D.; Carrière, J.; Guihal, C.; Soucaille, C.; Rouet, F.; Drouin, D.; Sol, O.; Jordan, H. Toward an Alzheimer’s disease diagnosis via high-resolution blood gene expression. Alzheimer’s Dement. 2010, 6, 25–38. [Google Scholar] [CrossRef]
- Grünblatt, E.; Bartl, J.; Zehetmayer, S.; Ringel, T.M.; Bauer, P.; Riederer, P.; Jacob, C.P. Gene expression as peripheral biomarkers for sporadic Alzheimer’s disease. J. Alzheimer’s Dis. 2009, 16, 627–634. [Google Scholar] [CrossRef]
- Bondar, G.; Cadeiras, M.; Wisniewski, N.; Maque, J.; Chittoor, J.; Chang, E.; Bakir, M.; Starling, C.; Shahzad, K.; Ping, P. Comparison of whole blood and peripheral blood mononuclear cell gene expression for evaluation of the perioperative inflammatory response in patients with advanced heart failure. PLoS ONE 2014, 9, e115097. [Google Scholar] [CrossRef] [PubMed]
- Min, J.L.; Barrett, A.; Watts, T.; Pettersson, F.H.; Lockstone, H.E.; Lindgren, C.M.; Taylor, J.M.; Allen, M.; Zondervan, K.T.; McCarthy, M.I. Variability of gene expression profiles in human blood and lymphoblastoid cell lines. BMC Genom. 2010, 11, 1–14. [Google Scholar] [CrossRef] [PubMed]
- Abu Bakar, Z.H.; Damanhuri, H.A.; Makpol, S.; Wan Kamaruddin, W.M.A.; Abdul Sani, N.F.; Amir Hamzah, A.I.Z.; Nor Aripin, K.N.; Mohd Rani, M.D.; Noh, N.A.; Razali, R. Effect of age on the protein profile of healthy Malay adults and its association with cognitive function competency. J. Alzheimer’s Dis. 2019, 70, S43–S62. [Google Scholar] [CrossRef] [PubMed]
- Morey, J.S.; Ryan, J.C.; Van Dolah, F.M. Microarray validation: Factors influencing correlation between oligonucleotide microarrays and real-time PCR. Biol. Proced. Online 2006, 8, 175–193. [Google Scholar] [CrossRef] [PubMed]
- Lu, T.; Pan, Y.; Kao, S.-Y.; Li, C.; Kohane, I.; Chan, J.; Yankner, B.A. Gene regulation and DNA damage in the ageing human brain. Nature 2004, 429, 883–891. [Google Scholar] [CrossRef]
- Birkner, K.; Wasser, B.; Ruck, T.; Thalman, C.; Luchtman, D.; Pape, K.; Schmaul, S.; Bitar, L.; Krämer-Albers, E.-M.; Stroh, A. β1-Integrin—And K V 1.3 channel—Dependent signaling stimulates glutamate release from Th17 cells. J. Clin. Investig. 2020, 130. [Google Scholar] [CrossRef]
- Choi, B.H.; Hahn, S.J. Kv1. 3: A potential pharmacological target for diabetes. Acta Pharmacol. Sin. 2010, 31, 1031–1035. [Google Scholar] [CrossRef]
- Rasmussen, H.B.; Trimmer, J.S. The voltage-dependent K+ channel family. Oxf. Handb. Neuronal Ion Channels 2019. [Google Scholar] [CrossRef]
- Wang, J.; Xiang, M. Targeting Potassium Channels K v1. 3 and KCa3. 1: Routes to Selective Immunomodulators in Autoimmune Disorder Treatment? Pharmacother. J. Hum. Pharmacol. Drug Ther. 2013, 33, 515–528. [Google Scholar] [CrossRef]
- Leanza, L.; Henry, B.; Sassi, N.; Zoratti, M.; Chandy, K.G.; Gulbins, E.; Szabò, I. Inhibitors of mitochondrial Kv1. 3 channels induce Bax/Bak-independent death of cancer cells. EMBO Mol. Med. 2012, 4, 577–593. [Google Scholar] [CrossRef] [PubMed]
- Comes, N.; Bielanska, J.; Vallejo-Gracia, A.; Serrano-Albarrás, A.; Marruecos, L.; Gómez, D.; Soler, C.; Condom, E.; Ramón y Cajal, S.; Hernández-Losa, J. The voltage-dependent K+ channels Kv1. 3 and Kv1. 5 in human cancer. Front. Physiol. 2013, 4, 283. [Google Scholar] [CrossRef] [PubMed]
- Perez-Verdaguer, M.; Capera, J.; Serrano-Novillo, C.; Estadella, I.; Sastre, D.; Felipe, A. The voltage-gated potassium channel Kv1. 3 is a promising multitherapeutic target against human pathologies. Expert Opin. Ther. Targets 2016, 20, 577–591. [Google Scholar] [CrossRef] [PubMed]
- Pérez-García, M.T.; Cidad, P.; López-López, J.R. The secret life of ion channels: Kv1. 3 potassium channels and proliferation. Am. J. Physiol. Cell Physiol. 2018, 314, C27–C42. [Google Scholar] [CrossRef] [PubMed]
- Dodson, P.D.; Forsythe, I.D. Presynaptic K+ channels: Electrifying regulators of synaptic terminal excitability. Trends Neurosci. 2004, 27, 210–217. [Google Scholar] [CrossRef]
- Song, S.-Y.; Meng, X.-W.; Xia, Z.; Liu, H.; Zhang, J.; Chen, Q.-C.; Liu, H.-Y.; Ji, F.-H.; Peng, K. Cognitive impairment and transcriptomic profile in hippocampus of young mice after multiple neonatal exposures to sevoflurane. Aging 2019, 11, 8386. [Google Scholar] [CrossRef]
- Das, P.; Parsons, A.; Scarborough, J.; Hoffman, J.; Wilson, J.; Thompson, R.; Overton, J.; Fadool, D. Electrophysiological and behavioral phenotype of insulin receptor defective mice. Physiol. Behav. 2005, 86, 287–296. [Google Scholar] [CrossRef]
- Maezawa, I.; Jenkins, D.P.; Jin, B.E.; Wulff, H. Microglial KCa3. 1 channels as a potential therapeutic target for Alzheimer’s disease. Int. J. Alzheimer’s Dis. 2012, 2012. [Google Scholar] [CrossRef]
- Rangaraju, S.; Gearing, M.; Jin, L.-W.; Levey, A. Potassium channel Kv1. 3 is highly expressed by microglia in human Alzheimer’s disease. J. Alzheimer’s Dis. 2015, 44, 797–808. [Google Scholar] [CrossRef]
- Bazan, N.G. The neuromessenger platelet-activating factor in plasticity and neurodegeneration. Prog. Brain Res. 1998, 118, 281–291. [Google Scholar]
- Karasawa, K.; Shirakura, M.; Harada, A.; Satoh, N.; Yokoyama, K.; Setaka, M.; Inoue, K. Red blood cells highly express type I platelet-activating factor-acetylhydrolase (PAF-AH) which consists of the α1/α2 complex. J. Biochem. 2005, 138, 509–517. [Google Scholar] [CrossRef]
- Koizumi, H.; Yamaguchi, N.; Hattori, M.; Ishikawa, T.-O.; Aoki, J.; Taketo, M.M.; Inoue, K.; Arai, H. Targeted disruption of intracellular type I platelet activating factor-acetylhydrolase catalytic subunits causes severe impairment in spermatogenesis. J. Biol. Chem. 2003, 278, 12489–12494. [Google Scholar] [CrossRef] [PubMed]
- Prescott, S.M.; Zimmerman, G.A.; Stafforini, D.M.; McIntyre, T.M. Platelet-activating factor and related lipid mediators. Annu. Rev. Biochem. 2000, 69, 419–445. [Google Scholar] [CrossRef] [PubMed]
- Honda, Z.-I.; Ishii, S.; Shimizu, T. Platelet-activating factor receptor. J. Biochem. 2002, 131, 773–779. [Google Scholar] [CrossRef]
- Tong, N.; Sanchez, J.F.; Maggirwar, S.B.; Ramirez, S.H.; Guo, H.; Dewhurst, S.; Gelbard, H.A. Activation of glycogen synthase kinase 3 beta (GSK-3β) by platelet activating factor mediates migration and cell death in cerebellar granule neurons. Eur. J. Neurosci. 2001, 13, 1913–1922. [Google Scholar] [CrossRef]
- Caricasole, A.; Copani, A.; Caraci, F.; Aronica, E.; Rozemuller, A.J.; Caruso, A.; Storto, M.; Gaviraghi, G.; Terstappen, G.C.; Nicoletti, F. Induction of Dickkopf-1, a negative modulator of the Wnt pathway, is associated with neuronal degeneration in Alzheimer’s brain. J. Neurosci. 2004, 24, 6021–6027. [Google Scholar] [CrossRef]
- Aukrust, P.; Halvorsen, B.; Ueland, T.; Michelsen, A.E.; Skjelland, M.; Gullestad, L.; Yndestad, A.; Otterdal, K. Activated platelets and atherosclerosis. Expert Rev. Cardiovasc. Ther. 2010, 8, 1297–1307. [Google Scholar] [CrossRef]
- Xu, Y.; Tao, Y.-X. Involvement of the NMDA receptor/nitric oxide signal pathway in platelet-activating factor-induced neurotoxicity. Neuroreport 2004, 15, 263–266. [Google Scholar] [CrossRef]
- Chen, C.; Magee, J.C.; Marcheselli, V.; Hardy, M.; Bazan, N.G. Attenuated LTP in hippocampal dentate gyrus neurons of mice deficient in the PAF receptor. J. Neurophysiol. 2001, 85, 384–390. [Google Scholar] [CrossRef]
- Pancoast, M.; Dobyns, W.; Golden, J.A. Interneuron deficits in patients with the Miller-Dieker syndrome. Acta Neuropathol. 2005, 109, 400–404. [Google Scholar] [CrossRef] [PubMed]
- Mazereeuw, G.; Herrmann, N.; Bennett, S.A.; Swardfager, W.; Xu, H.; Valenzuela, N.; Fai, S.; Lanctôt, K.L. Platelet activating factors in depression and coronary artery disease: A potential biomarker related to inflammatory mechanisms and neurodegeneration. Neurosci. Biobehav. Rev. 2013, 37, 1611–1621. [Google Scholar] [CrossRef] [PubMed]
- Satoh, F.; Imaizumi, T.; Kawamura, Y.; Yoshida, H.; Takamatsu, S.; Takamatsu, M. Increased activity of the platelet-activating factor acetylhydrolase in plasma low density lipoprotein from patients with essential hypertension. Prostaglandins 1989, 37, 673–682. [Google Scholar] [CrossRef]
- Ciabattoni, G.; Porreca, E.; Di Febbo, C.; Di Iorio, A.; Paganelli, R.; Bucciarelli, T.; Pescara, L.; Del Re, L.; Giusti, C.; Falco, A. Determinants of platelet activation in Alzheimer’s disease. Neurobiol. Aging 2007, 28, 336–342. [Google Scholar] [CrossRef] [PubMed]
- Bennati, A.M.; Schiavoni, G.; Franken, S.; Piobbico, D.; Della Fazia, M.A.; Caruso, D.; De Fabiani, E.; Benedetti, L.; Cusella De Angelis, M.G.; Gieselmann, V. Disruption of the gene encoding 3β-hydroxysterol Δ14-reductase (Tm7sf2) in mice does not impair cholesterol biosynthesis. FEBS J. 2008, 275, 5034–5047. [Google Scholar] [CrossRef] [PubMed]
- Bellezza, I.; Roberti, R.; Gatticchi, L.; Del Sordo, R.; Rambotti, M.G.; Marchetti, M.C.; Sidoni, A.; Minelli, A. A novel role for Tm7sf2 gene in regulating TNFα expression. PLoS ONE 2013, 8, e68017. [Google Scholar] [CrossRef]
- Graham, R.M.; Chua, A.C.; Carter, K.W.; Delima, R.D.; Johnstone, D.; Herbison, C.E.; Firth, M.J.; O’Leary, R.; Milward, E.A.; Olynyk, J.K. Hepatic iron loading in mice increases cholesterol biosynthesis. Hepatology 2010, 52, 462–471. [Google Scholar] [CrossRef]
- Preman, P.; Alfonso-Triguero, M.; Alberdi, E.; Verkhratsky, A.; Arranz, A.M. Astrocytes in Alzheimer’s Disease: Pathological Significance and Molecular Pathways. Cells 2021, 10, 540. [Google Scholar] [CrossRef] [PubMed]
- Orre, M.; Kamphuis, W.; Osborn, L.M.; Jansen, A.H.; Kooijman, L.; Bossers, K.; Hol, E.M. Isolation of glia from Alzheimer’s mice reveals inflammation and dysfunction. Neurobiol. Aging 2014, 35, 2746–2760. [Google Scholar] [CrossRef] [PubMed]
- De Vries, L.; Zheng, B.; Fischer, T.; Elenko, E.; Farquhar, M.G. The regulator of G protein signaling family. Annu. Rev. Pharmacol. Toxicol. 2000, 40, 235–271. [Google Scholar] [CrossRef] [PubMed]
- Lin, Y.R.; Kim, K.; Yang, Y.; Ivessa, A.; Sadoshima, J.; Park, Y. Regulation of longevity by regulator of G-protein signaling protein, Loco. Aging Cell 2011, 10, 438–447. [Google Scholar] [CrossRef] [PubMed]
- Zmijewski, J.W.; Song, L.; Harkins, L.; Cobbs, C.S.; Jope, R.S. Oxidative stress and heat shock stimulate RGS2 expression in 1321N1 astrocytoma cells. Arch. Biochem. Biophys. 2001, 392, 192–196. [Google Scholar] [CrossRef] [PubMed]
- Shin, K.-S.; Park, H.-S.; Kim, Y.-H.; Yu, J.-H. Comparative proteomic analyses reveal that FlbA down-regulates gliT expression and SOD activity in Aspergillus fumigatus. J. Proteom. 2013, 87, 40–52. [Google Scholar] [CrossRef] [PubMed]
- Wu, M.; Kang, X.; Wang, Q.; Zhou, C.; Mohan, C.; Peng, A. Regulator of G protein signaling-1 modulates paraquat-induced oxidative stress and longevity via the insulin like signaling pathway in Caenorhabditis elegans. Toxicol. Lett. 2017, 273, 97–105. [Google Scholar] [CrossRef] [PubMed]
- Leandro, G.S.; Evangelista, A.F.; Lobo, R.R.; Xavier, D.J.; Moriguti, J.C.; Sakamoto-Hojo, E.T. Changes in expression profiles revealed by transcriptomic analysis in peripheral blood mononuclear cells of Alzheimer’s disease patients. J. Alzheimer’s Dis. 2018, 66, 1483–1495. [Google Scholar] [CrossRef]
- Li, M.O.; Wan, Y.Y.; Sanjabi, S.; Robertson, A.-K.L.; Flavell, R.A. Transforming growth factor-β regulation of immune responses. Annu. Rev. Immunol. 2006, 24, 99–146. [Google Scholar] [CrossRef] [PubMed]
- ten Dijke, P.; Hill, C.S. New insights into TGF-β–Smad signalling. Trends Biochem. Sci. 2004, 29, 265–273. [Google Scholar] [CrossRef]
- Tesseur, I.; Zou, K.; Esposito, L.; Bard, F.; Berber, E.; Van Can, J.; Lin, A.H.; Crews, L.; Tremblay, P.; Mathews, P. Deficiency in neuronal TGF-β signaling promotes neurodegeneration and Alzheimer’s pathology. J. Clin. Investig. 2006, 116, 3060–3069. [Google Scholar] [CrossRef]
- Block, M.; Zecca, L.; Hong, J. Microglia-mediated neurotoxicity: Uncovering the molecular mechanisms. Nat. Rev. Neurosci. 2007, 8, 57–69. [Google Scholar] [CrossRef]
- Caraci, F.; Spampinato, S.; Sortino, M.A.; Bosco, P.; Battaglia, G.; Bruno, V.; Drago, F.; Nicoletti, F.; Copani, A. Dysfunction of TGF-β1 signaling in Alzheimer’s disease: Perspectives for neuroprotection. Cell Tissue Res. 2012, 347, 291–301. [Google Scholar] [CrossRef]
- Tichauer, J.E.; von Bernhardi, R. Transforming growth factor-β stimulates β amyloid uptake by microglia through Smad3-dependent mechanisms. J. Neurosci. Res. 2012, 90, 1970–1980. [Google Scholar] [CrossRef]
- Lesné, S.; Docagne, F.; Gabriel, C.l.; Liot, G.; Lahiri, D.K.; Buée, L.; Plawinski, L.; Delacourte, A.; MacKenzie, E.T.; Buisson, A. Transforming growth factor-β1 potentiates amyloid-β generation in astrocytes and in transgenic mice. J. Biol. Chem. 2003, 278, 18408–18418. [Google Scholar] [CrossRef]
- Wyss-Coray, T.; Lin, C.; Yan, F.; Yu, G.-Q.; Rohde, M.; McConlogue, L.; Masliah, E.; Mucke, L. TGF-β1 promotes microglial amyloid-β clearance and reduces plaque burden in transgenic mice. Nat. Med. 2001, 7, 612–618. [Google Scholar] [CrossRef]
- Caraci, F.; Battaglia, G.; Busceti, C.; Biagioni, F.; Mastroiacovo, F.; Bosco, P.; Drago, F.; Nicoletti, F.; Sortino, M.A.; Copani, A. TGF-β1 protects against Aβ-neurotoxicity via the phosphatidylinositol-3-kinase pathway. Neurobiol. Dis. 2008, 30, 234–242. [Google Scholar] [CrossRef]
- Luterman, J.D.; Haroutunian, V.; Yemul, S.; Ho, L.; Purohit, D.; Aisen, P.S.; Mohs, R.; Pasinetti, G.M. Cytokine gene expression as a function of the clinical progression of Alzheimer disease dementia. Arch. Neurol. 2000, 57, 1153–1160. [Google Scholar] [CrossRef] [PubMed]
- De Servi, B.; La Porta, C.; Bontempelli, M.; Comolli, R. Decrease of TGF-β1 plasma levels and increase of nitric oxide synthase activity in leukocytes as potential biomarkers of Alzheimer’s disease. Exp. Gerontol. 2002, 37, 813–821. [Google Scholar] [CrossRef]
- Juraskova, B.; Andrys, C.; Holmerova, I.; Solichova, D.; Hrnciarikova, D.; Vankova, H.; Vasatko, T.; Krejsek, J. Transforming growth factor beta and soluble endoglin in the healthy senior and in Alzheimer’s disease patients. J. Nutr. Health Aging 2010, 14, 758–761. [Google Scholar] [CrossRef] [PubMed]
- Candore, G.; Bulati, M.; Caruso, C.; Castiglia, L.; Colonna-Romano, G.; Di Bona, D.; Duro, G.; Lio, D.; Matranga, D.; Pellicano, M. Inflammation, cytokines, immune response, apolipoprotein E, cholesterol, and oxidative stress in Alzheimer disease: Therapeutic implications. Rejuvenation Res. 2010, 13, 301–313. [Google Scholar] [CrossRef]
- Baierle, M.; Nascimento, S.N.; Moro, A.M.; Brucker, N.; Freitas, F.; Gauer, B.; Durgante, J.; Bordignon, S.; Zibetti, M.; Trentini, C.M. Relationship between inflammation and oxidative stress and cognitive decline in the institutionalized elderly. Oxidative Med. Cell. Longev. 2015, 2015. [Google Scholar] [CrossRef] [PubMed]
- Di Penta, A.; Moreno, B.; Reix, S.; Fernandez-Diez, B.; Villanueva, M.; Errea, O.; Escala, N.; Vandenbroeck, K.; Comella, J.X.; Villoslada, P. Oxidative stress and proinflammatory cytokines contribute to demyelination and axonal damage in a cerebellar culture model of neuroinflammation. PLoS ONE 2013, 8, e54722. [Google Scholar] [CrossRef] [PubMed]
- Russo, I.; Barlati, S.; Bosetti, F. Effects of neuroinflammation on the regenerative capacity of brain stem cells. J. Neurochem. 2011, 116, 947–956. [Google Scholar] [CrossRef]
- Hajjar, I.; Hayek, S.S.; Goldstein, F.C.; Martin, G.; Jones, D.P.; Quyyumi, A. Oxidative stress predicts cognitive decline with aging in healthy adults: An observational study. J. Neuroinflamm. 2018, 15, 1–7. [Google Scholar] [CrossRef] [PubMed]
- Perez, D.M. From plants to man: The GPCR “tree of life”. Mol. Pharmacol. 2005, 67, 1383–1384. [Google Scholar] [CrossRef] [PubMed]
- Heng, B.C.; Aubel, D.; Fussenegger, M. An overview of the diverse roles of G-protein coupled receptors (GPCRs) in the pathophysiology of various human diseases. Biotechnol. Adv. 2013, 31, 1676–1694. [Google Scholar] [CrossRef] [PubMed]
- De Strooper, B.; Vassar, R.; Golde, T. The secretases: Enzymes with therapeutic potential in Alzheimer disease. Nat. Rev. Neurol. 2010, 6, 99–107. [Google Scholar] [CrossRef]
- Millan, M.; Marin, P.; Bockaert, J.; Mannoury la Cour, C. Signaling at G-protein-coupled serotonin receptors: Recent advances and future research directions. Trends Pharmacol. Sci. 2008, 29, 454–464. [Google Scholar] [CrossRef]
- Zhang, G.; Stackman, R.W., Jr. The role of serotonin 5-HT2A receptors in memory and cognition. Front. Pharmacol. 2015, 6, 225. [Google Scholar] [CrossRef]
- Lai, M.; Tsang, S.; Alder, J.; Keene, J.; Hope, T.; Esiri, M.; Francis, P.; Chen, C. Loss of serotonin 5-HT 2A receptors in the postmortem temporal cortex correlates with rate of cognitive decline in Alzheimer’s disease. Psychopharmacology 2005, 179, 673–677. [Google Scholar] [CrossRef]
- Lorke, D.E.; Lu, G.; Cho, E.; Yew, D.T. Serotonin 5-HT 2A and 5-HT 6 receptors in the prefrontal cortex of Alzheimer and normal aging patients. BMC Neurosci. 2006, 7, 1–8. [Google Scholar] [CrossRef]
- Versijpt, J.; Van Laere, K.; Dumont, F.; Decoo, D.; Vandecapelle, M.; Santens, P.; Goethals, I.; Audenaert, K.; Slegers, G.; Dierckx, R.A. Imaging of the 5-HT2A system: Age-, gender-, and Alzheimer’s disease-related findings. Neurobiol. Aging 2003, 24, 553–561. [Google Scholar] [CrossRef]
- Christensen, R.; Marcussen, A.; Wörtwein, G.; Knudsen, G.; Aznar, S. Aβ (1–42) injection causes memory impairment, lowered cortical and serum BDNF levels, and decreased hippocampal 5-HT2A levels. Exp. Neurol. 2008, 210, 164–171. [Google Scholar] [CrossRef]
- Curcio, C.A.; Kemper, T. Nucleus raphe dorsalis in dementia of the Alzheimer type: Neurofibrillary changes and neuronal packing density. J. Neuropathol. Exp. Neurol. 1984, 43, 359–368. [Google Scholar] [CrossRef]
- de Quervain, D.J.; Henke, K.; Aerni, A.; Coluccia, D.; Wollmer, M.A.; Hock, C.; Nitsch, R.M.; Papassotiropoulos, A. A functional genetic variation of the 5-HT2a receptor affects human memory. Nat. Neurosci. 2003, 6, 1141–1142. [Google Scholar] [CrossRef] [PubMed]
- Cuadrado, A.; Nebreda, A.R. Mechanisms and functions of p38 MAPK signalling. Biochem. J. 2010, 429, 403–417. [Google Scholar] [CrossRef] [PubMed]
- Sun, A.; Liu, M.; Nguyen, X.V.; Bing, G. P38 MAP kinase is activated at early stages in Alzheimer’s disease brain. Exp. Neurol. 2003, 183, 394–405. [Google Scholar] [CrossRef]
- Gourmaud, S.; Paquet, C.; Dumurgier, J.; Pace, C.; Bouras, C.; Gray, F.; Laplanche, J.-L.; Meurs, E.F.; Mouton-Liger, F.; Hugon, J. Increased levels of cerebrospinal fluid JNK3 associated with amyloid pathology: Links to cognitive decline. J. Psychiatry Neurosci. JPN 2015, 40, 151. [Google Scholar] [CrossRef] [PubMed]
- Fang, F.; Yu, Q.; Arancio, O.; Chen, D.; Gore, S.S.; Yan, S.S.; Yan, S.F. RAGE mediates Aβ accumulation in a mouse model of Alzheimer’s disease via modulation of β-and γ-secretase activity. Hum. Mol. Genet. 2018, 27, 1002–1014. [Google Scholar] [CrossRef]
- Savage, M.J.; Lin, Y.-G.; Ciallella, J.R.; Flood, D.G.; Scott, R.W. Activation of c-Jun N-terminal kinase and p38 in an Alzheimer’s disease model is associated with amyloid deposition. J. Neurosci. 2002, 22, 3376–3385. [Google Scholar] [CrossRef]
- Wang, S.; Zhang, C.; Sheng, X.; Zhang, X.; Wang, B.; Zhang, G. Peripheral expression of MAPK pathways in Alzheimer’s and Parkinson’s diseases. J. Clin. Neurosci. 2014, 21, 810–814. [Google Scholar] [CrossRef]
- Yu, Y.; Richardson, D.R. Cellular iron depletion stimulates the JNK and p38 MAPK signaling transduction pathways, dissociation of ASK1-thioredoxin, and activation of ASK1. J. Biol. Chem. 2011, 286, 15413–15427. [Google Scholar] [CrossRef]
- Hattori, K.; Naguro, I.; Runchel, C.; Ichijo, H. The roles of ASK family proteins in stress responses and diseases. Cell Commun. Signal. 2009, 7, 1–10. [Google Scholar] [CrossRef]
- Peel, A.L.; Sorscher, N.; Kim, J.Y.; Galvan, V.; Chen, S.; Bredesen, D.E. Tau phosphorylation in Alzheimer’s disease. Neuromolecular Med. 2004, 5, 205–218. [Google Scholar] [CrossRef]
- Kadowaki, H.; Nishitoh, H.; Urano, F.; Sadamitsu, C.; Matsuzawa, A.; Takeda, K.; Masutani, H.; Yodoi, J.; Urano, Y.; Nagano, T. Amyloid β induces neuronal cell death through ROS-mediated ASK1 activation. Cell Death Differ. 2005, 12, 19–24. [Google Scholar] [CrossRef]
- Toyama, K.; Koibuchi, N.; Hasegawa, Y.; Uekawa, K.; Yasuda, O.; Sueta, D.; Nakagawa, T.; Ma, M.; Kusaka, H.; Lin, B. ASK1 is involved in cognitive impairment caused by long-term high-fat diet feeding in mice. Sci. Rep. 2015, 5, 1–12. [Google Scholar]
- Hommes, D.; Peppelenbosch, M.; Van Deventer, S. Mitogen activated protein (MAP) kinase signal transduction pathways and novel anti-inflammatory targets. Gut 2003, 52, 144–151. [Google Scholar] [CrossRef]
- Karim, S.; Hopkins, S.; Purandare, N.; Crowther, J.; Morris, J.; Tyrrell, P.; Burns, A. Peripheral inflammatory markers in amnestic mild cognitive impairment. Int. J. Geriatr. Psychiatry 2014, 29, 221–226. [Google Scholar] [CrossRef]
- Faria, M.C.; Gonçalves, G.S.; Rocha, N.P.; Moraes, E.N.; Bicalho, M.A.; Cintra, M.T.G.; de Paula, J.J.; de Miranda, L.F.J.R.; de Souza Ferreira, A.C.; Teixeira, A.L. Increased plasma levels of BDNF and inflammatory markers in Alzheimer’s disease. J. Psychiatr. Res. 2014, 53, 166–172. [Google Scholar] [CrossRef]
- Scholz, B.; Doidge, A.N.; Barnes, P.; Hall, J.; Wilkinson, L.S.; Thomas, K.L. The regulation of cytokine networks in hippocampal CA1 differentiates extinction from those required for the maintenance of contextual fear memory after recall. PLoS ONE 2016, 11, e0153102. [Google Scholar] [CrossRef] [PubMed]
- Takemiya, T.; Fumizawa, K.; Yamagata, K.; Iwakura, Y.; Kawakami, M. Brain interleukin-1 facilitates learning of a water maze spatial memory task in young mice. Front. Behav. Neurosci. 2017, 11, 202. [Google Scholar] [CrossRef] [PubMed]
- Tarkowski, E.; Andreasen, N.; Tarkowski, A.; Blennow, K. Intrathecal inflammation precedes development of Alzheimer’s disease. J. Neurol. Neurosurg. Psychiatry 2003, 74, 1200–1205. [Google Scholar] [CrossRef]
- Sudheimer, K.D.; O’Hara, R.; Spiegel, D.; Powers, B.; Kraemer, H.C.; Neri, E.; Weiner, M.; Hardan, A.; Hallmayer, J.; Dhabhar, F.S. Cortisol, cytokines, and hippocampal volume interactions in the elderly. Front. Aging Neurosci. 2014, 6, 153. [Google Scholar] [CrossRef] [PubMed]
- Liu, T.; Zhang, L.; Joo, D.; Sun, S.-C. NF-κB signaling in inflammation. Signal. Transduct. Target Ther. 2017, 2, 1–9. [Google Scholar] [CrossRef] [PubMed]
- Cameron, B.; Tse, W.; Lamb, R.; Li, X.; Lamb, B.T.; Landreth, G.E. Loss of interleukin receptor-associated kinase 4 signaling suppresses amyloid pathology and alters microglial phenotype in a mouse model of Alzheimer’s disease. J. Neurosci. 2012, 32, 15112–15123. [Google Scholar] [CrossRef] [PubMed]
- Vivien, D.; Ali, C. Transforming growth factor-β signalling in brain disorders. Cytokine Growth Factor Rev. 2006, 17, 121–128. [Google Scholar] [CrossRef] [PubMed]
- Graciarena, M.; Depino, A.M.; Pitossi, F.J. Prenatal inflammation impairs adult neurogenesis and memory related behavior through persistent hippocampal TGFβ1 downregulation. Brain Behav. Immun. 2010, 24, 1301–1309. [Google Scholar] [CrossRef] [PubMed]
- Cerione, R.A. Cdc42: New roads to travel. Trends Cell Biol. 2004, 14, 127–132. [Google Scholar] [CrossRef]
- Ito, T.K.; Yokoyama, M.; Yoshida, Y.; Nojima, A.; Kassai, H.; Oishi, K.; Okada, S.; Kinoshita, D.; Kobayashi, Y.; Fruttiger, M. A crucial role for CDC42 in senescence-associated inflammation and atherosclerosis. PLoS ONE 2014, 9, e102186. [Google Scholar] [CrossRef]
- Florian, M.C.; Dörr, K.; Niebel, A.; Daria, D.; Schrezenmeier, H.; Rojewski, M.; Filippi, M.-D.; Hasenberg, A.; Gunzer, M.; Scharffetter-Kochanek, K. Cdc42 activity regulates hematopoietic stem cell aging and rejuvenation. Cell Stem Cell 2012, 10, 520–530. [Google Scholar] [CrossRef]
- Kerber, R.A.; O’Brien, E.; Cawthon, R.M. Gene expression profiles associated with aging and mortality in humans. Aging Cell 2009, 8, 239–250. [Google Scholar] [CrossRef]
- Stankiewicz, T.R.; Linseman, D.A. Rho family GTPases: Key players in neuronal development, neuronal survival, and neurodegeneration. Front. Cell. Neurosci. 2014, 8, 314. [Google Scholar] [CrossRef]
- Mendoza-Naranjo, A.; Gonzalez-Billault, C.; Maccioni, R.B. Aβ1-42 stimulates actin polymerization in hippocampal neurons through Rac1 and Cdc42 Rho GTPases. J. Cell Sci. 2007, 120, 279–288. [Google Scholar] [CrossRef]
- Zhu, X.; Raina, A.K.; Boux, H.; Simmons, Z.L.; Takeda, A.; Smith, M.A. Activation of oncogenic pathways in degenerating neurons in Alzheimer disease. Int. J. Dev. Neurosci. 2000, 18, 433–437. [Google Scholar] [CrossRef]
- Saraceno, C.; Catania, M.; Paterlini, A.; Fostinelli, S.; Ciani, M.; Zanardini, R.; Binetti, G.; Di Fede, G.; Caroppo, P.; Benussi, L. Altered expression of circulating Cdc42 in frontotemporal lobar degeneration. J. Alzheimer’s Dis. 2018, 61, 1477–1483. [Google Scholar] [CrossRef] [PubMed]
- Baker, R.G.; Hayden, M.S.; Ghosh, S. NF-κB, inflammation, and metabolic disease. Cell Metab. 2011, 13, 11–22. [Google Scholar] [CrossRef] [PubMed]
- Bubici, C.; Papa, S.; Dean, K.; Franzoso, G. Mutual cross-talk between reactive oxygen species and nuclear factor-kappa B: Molecular basis and biological significance. Oncogene 2006, 25, 6731–6748. [Google Scholar] [CrossRef] [PubMed]
- Mattson, M.P.; Goodman, Y.; Luo, H.; Fu, W.; Furukawa, K. Activation of NF-κB protects hippocampal neurons against oxidative stress-induced apoptosis: Evidence for induction of manganese superoxide dismutase and suppression of peroxynitrite production and protein tyrosine nitration. J. Neurosci. Res. 1997, 49, 681–697. [Google Scholar] [CrossRef]
- Levenson, J.M.; Choi, S.; Lee, S.-Y.; Cao, Y.A.; Ahn, H.J.; Worley, K.C.; Pizzi, M.; Liou, H.-C.; Sweatt, J.D. A bioinformatics analysis of memory consolidation reveals involvement of the transcription factor c-rel. J. Neurosci. 2004, 24, 3933–3943. [Google Scholar] [CrossRef]
- Lukiw, W.J.; Bazan, N.G. Strong nuclear factor-κB-DNA binding parallels cyclooxygenase-2 gene transcription in aging and in sporadic alzheimer’s disease superior temporal lobe neocortex. J. Neurosci. Res. 1998, 53, 583–592. [Google Scholar] [CrossRef]
- Meffert, M.K.; Chang, J.M.; Wiltgen, B.J.; Fanselow, M.S.; Baltimore, D. NF-κB functions in synaptic signaling and behavior. Nat. Neurosci. 2003, 6, 1072–1078. [Google Scholar] [CrossRef]
- Luchtman, D.W.; Song, C. Cognitive enhancement by omega-3 fatty acids from child-hood to old age: Findings from animal and clinical studies. Neuropharmacology 2013, 64, 550–565. [Google Scholar] [CrossRef]
- Dacks, P.; Shineman, D.; Fillit, H. Current evidence for the clinical use of long-chain polyunsaturated n-3 fatty acids to prevent age-related cognitive decline and Alzheimer’s disease. J. Nutr. Health Aging 2013, 17, 240–251. [Google Scholar] [CrossRef]
- Conquer, J.A.; Tierney, M.C.; Zecevic, J.; Bettger, W.J.; Fisher, R.H. Fatty acid analysis of blood plasma of patients with Alzheimer’s disease, other types of dementia, and cognitive impairment. Lipids 2000, 35, 1305–1312. [Google Scholar] [CrossRef]
- Milte, C.M.; Sinn, N.; Street, S.J.; Buckley, J.D.; Coates, A.M.; Howe, P.R. Erythrocyte polyunsaturated fatty acid status, memory, cognition and mood in older adults with mild cognitive impairment and healthy controls. Prostaglandins Leukot. Essent. Fat. Acids (PLEFA) 2011, 84, 153–161. [Google Scholar] [CrossRef]
- van de Rest, O.; Geleijnse, J.M.; Kok, F.J.; van Staveren, W.A.; Dullemeijer, C.; OldeRikkert, M.G.; Beekman, A.T.; De Groot, C. Effect of fish oil on cognitive performance in older subjects: A randomized, controlled trial. Neurology 2008, 71, 430–438. [Google Scholar] [CrossRef]
- Nakamura, M.T.; Nara, T.Y. Structure, function, and dietary regulation of Δ6, Δ5, and Δ9 desaturases. Annu. Rev. Nutr. 2004, 24, 345–376. [Google Scholar] [CrossRef]
- Aulchenko, Y.S.; Ripatti, S.; Lindqvist, I.; Boomsma, D.; Heid, I.M.; Pramstaller, P.P.; Penninx, B.W.; Janssens, A.C.J.; Wilson, J.F.; Spector, T. Loci influencing lipid levels and coronary heart disease risk in 16 European population cohorts. Nat. Genet. 2009, 41, 47. [Google Scholar]
- Lattka, E.; Illig, T.; Heinrich, J.; Koletzko, B. FADS gene cluster polymorphisms: Important modulators of fatty acid levels and their impact on atopic diseases. Lifestyle Genom. 2009, 2, 119–128. [Google Scholar] [CrossRef] [PubMed]
- Martinelli, N.; Girelli, D.; Malerba, G.; Guarini, P.; Illig, T.; Trabetti, E.; Sandri, M.; Friso, S.; Pizzolo, F.; Schaeffer, L. FADS genotypes and desaturase activity estimated by the ratio of arachidonic acid to linoleic acid are associated with inflammation and coronary artery disease. Am. J. Clin. Nutr. 2008, 88, 941–949. [Google Scholar] [CrossRef] [PubMed]
- Caspi, A.; Williams, B.; Kim-Cohen, J.; Craig, I.W.; Milne, B.J.; Poulton, R.; Schalkwyk, L.C.; Taylor, A.; Werts, H.; Moffitt, T.E. Moderation of breastfeeding effects on the IQ by genetic variation in fatty acid metabolism. Proc. Natl. Acad. Sci. USA 2007, 104, 18860–18865. [Google Scholar] [CrossRef] [PubMed]
- Brookes, K.J.; Chen, W.; Xu, X.; Taylor, E.; Asherson, P. Association of fatty acid desaturase genes with attention-deficit/hyperactivity disorder. Biol. Psychiatry 2006, 60, 1053–1061. [Google Scholar] [CrossRef]
- Wang, G.; Wang, Y.; Sun, H.; Cao, W.; Zhang, J.; Xiao, H.; Zhang, J. Variants of the arachidonate 5-lipoxygenase-activating protein (ALOX5AP) gene and risk of ischemic stroke in Han Chinese of eastern China. J. Biomed. Res. 2011, 25, 319–327. [Google Scholar] [CrossRef][Green Version]
- Demetz, E.; Schroll, A.; Auer, K.; Heim, C.; Patsch, J.R.; Eller, P.; Theurl, M.; Theurl, I.; Theurl, M.; Seifert, M. The arachidonic acid metabolome serves as a conserved regulator of cholesterol metabolism. Cell Metab. 2014, 20, 787–798. [Google Scholar] [CrossRef]
- Ikonomovic, M.D.; Abrahamson, E.E.; Uz, T.; Manev, H.; DeKosky, S.T. Increased 5-lipoxygenase immunoreactivity in the hippocampus of patients with Alzheimer’s disease. J. Histochem. Cytochem. 2008, 56, 1065–1073. [Google Scholar] [CrossRef]
- Giannopoulos, P.F.; Chu, J.; Joshi, Y.B.; Sperow, M.; Li, J.-G.; Kirby, L.G.; Praticò, D. 5-lipoxygenase activating protein reduction ameliorates cognitive deficit, synaptic dysfunction, and neuropathology in a mouse model of Alzheimer’s disease. Biol. Psychiatry 2013, 74, 348–356. [Google Scholar] [CrossRef] [PubMed]
- Bartke, A.; Dominici, F.; Turyn, D.; Kinney, B.; Steger, R.; Kopchick, J. Insulin-like growth factor 1 (IGF-1) and aging: Controversies and new insights. Biogerontology 2003, 4, 1–8. [Google Scholar] [CrossRef] [PubMed]
- Rains, J.L.; Jain, S.K. Oxidative stress, insulin signaling, and diabetes. Free Radic. Biol. Med. 2011, 50, 567–575. [Google Scholar] [CrossRef] [PubMed]
- Houstis, N.; Rosen, E.D.; Lander, E.S. Reactive oxygen species have a causal role in multiple forms of insulin resistance. Nature 2006, 440, 944–948. [Google Scholar] [CrossRef]
- Gockerman, A.; Prevette, T.; Jones, J.; Clemmons, D. Insulin-like growth factor (IGF)-binding proteins inhibit the smooth muscle cell migration responses to IGF-I and IGF-II. Endocrinology 1995, 136, 4168–4173. [Google Scholar] [CrossRef]
- Thissen, J.-P.; Ketelslegers, J.-M.; Underwood, L.E. Nutritional regulation of the insulin-like growth factors. Endocr. Rev. 1994, 15, 80–101. [Google Scholar]
- Morais, J.; Chevalier, S.; Gougeon, R. Protein turnover and requirements in the healthy and frail elderly. J. Nutr. Health Aging 2006, 10, 272. [Google Scholar]
- Papadakis, M.A.; Grady, D.; Tierney, M.J.; Black, D.; Wells, L.; Grunfeld, C. Insulin-like growth factor 1 and functional status in healthy older men. J. Am. Geriatr. Soc. 1995, 43, 1350–1355. [Google Scholar] [CrossRef]
- Aleman, A.; Verhaar, H.J.; de Haan, E.H.; de Vries, W.R.; Samson, M.M.; Drent, M.L.; van der Veen, E.A.; Koppeschaar, H.P. Insulin-like growth factor-I and cognitive function in healthy older men. J. Clin. Endocrinol. Metab. 1999, 84, 471–475. [Google Scholar] [CrossRef] [PubMed]
- Rollero, A.; Murialdo, G.; Fonzi, S.; Garrone, S.; Gianelli, M.V.; Gazzerro, E.; Barreca, A.; Polleri, A. Relationship between cognitive function, growth hormone and insulin-like growth factor I plasma levels in aged subjects. Neuropsychobiology 1998, 38, 73–79. [Google Scholar] [CrossRef] [PubMed]


| Gene Product | Forward Primer | Reverse Primer |
|---|---|---|
| GAPDH | TCCCTGAGCTGAACGGGAAG | GGAGGAGTGGGTGTCGCTGT |
| KCNA3 | AAAACGGGCAATTCCACTGC | AACAAGGGCATAGGCAGACC |
| HIST1H1E | TTCCGGCTCGAATTGCTCTC | CTTCACGGGAGTCTTCTCGG |
| PAFAH1B3 | GAATGGGGAGCTGGAACACA | CGCTCATTCACCAGTTGCAC |
| TM7SF2 | GTCGCCTGCGCTATCCTATT | AGATGAAAGCGGTGAGGGTG |
| RGS1 | TTGACTTCCGCACTCGAGAA | TGTTCACCCAGGGAGCCATA |
| TGFBRAP1 | CTTCAAGAAGCCCGTGAACGA | ACATCTGGATGGTTCTGCGTT |
| Group | Group 30 | Group 40 | Group 50 | Group 60 |
|---|---|---|---|---|
| RNA Integrity Number (RIN) | 8.51 ± 0.58 | 8.33 ± 0.39 | 8.49 ± 0.47 | 7.63 ± 0.84 |
| G40 vs. G30 | G50 vs. G30 | G60 vs. G30 | |
|---|---|---|---|
| Up | 1961 | 1318 | 2264 |
| Down | 1784 | 1160 | 2102 |
| Total | 3745 | 2478 | 4366 |
| No | G40N vs. G30N | G50N vs. G30N | G60N vs. G30N | ||||||
|---|---|---|---|---|---|---|---|---|---|
| Gene Symbol | p-Value | FC | Gene Symbol | p-Value | FC | Gene Symbol | p-Value | FC | |
| 1 | LSM14B | 1.44 × 10⁻⁷ | −1.68672 | LOC652537 | 8.23 × 10⁻⁸ | 1.5223 | VPS13B | 1.19 × 10⁻¹⁰ | −1.56519 |
| 2 | HS.574731 | 1.52 × 10⁻⁷ | −1.64622 | LSM14B | 2.08 × 10⁻⁷ | −1.65683 | LSM14B | 2.55 × 10⁻¹⁰ | −1.90272 |
| 3 | TM7SF2 | 4.93 × 10⁻⁷ | 1.50429 | RNU4ATAC | 4.90 × 10⁻⁷ | −2.66478 | SNRPD3 | 9.60 × 10⁻¹⁰ | −1.65141 |
| 4 | EIF3CL | 1.66 × 10⁻⁶ | −1.5152 | EIF3CL | 1.46 × 10⁻⁶ | −1.50767 | EIF3CL | 2.33 × 10⁻⁸ | −1.62575 |
| 5 | PAFAH1B3 | 1.82 × 10⁻⁶ | 1.5837 | LOC652455 | 5.79 × 10⁻⁶ | −1.56269 | SNORD95 | 2.49 × 10⁻⁸ | −1.77508 |
| 6 | SNORD13 | 2.18 × 10⁻⁶ | −2.2137 | TERC | 1.66 × 10⁻⁵ | 1.97178 | FLJ20309 | 2.73 × 10⁻⁸ | −1.65312 |
| 7 | BDP1 | 3.79 × 10⁻⁶ | −1.55882 | GPR183 | 3.56 × 10⁻⁵ | 1.70917 | SNORD13 | 3.59 × 10⁻⁸ | −2.5244 |
| 8 | AAK1 | 3.91 × 10⁻⁶ | −1.69422 | INPP4B | 7.28 × 10⁻⁵ | 1.68441 | AAK1 | 4.56 × 10⁻⁸ | −1.87268 |
| 9 | TUBB4Q | 4.34 × 10⁻⁶ | 1.60485 | CTLA4 | 8.09 × 10⁻⁴ | 1.69249 | TGFBRAP1 | 1.04 × 10⁻⁷ | −1.50426 |
| 10 | PHACTR2 | 5.68 × 10⁻⁶ | −1.58414 | HS.149244 | 1.69 × 10⁻³ | 1.76622 | PAR5 | 1.13 × 10⁻⁷ | −1.55457 |
| 11 | KCNA3 | 5.68 × 10⁻⁶ | −1.75129 | HNRNPL | 3.47 × 10⁻³ | −2.02885 | HS.438905 | 1.78 × 10⁻⁷ | −1.62903 |
| 12 | RNU4ATAC | 7.31 × 10⁻⁶ | −2.38473 | SNORD13 | 4.18 × 10⁻³ | −1.55632 | KCNA3 | 2.50 × 10⁻⁷ | −1.88146 |
| 13 | DCUN1D1 | 1.37 × 10⁻⁵ | −1.5566 | KCTD12 | 5.77 × 10⁻³ | −1.55619 | BAGE5 | 2.84 × 10⁻⁷ | −1.58421 |
| 14 | FAM55C | 1.39 × 10⁻⁵ | −1.6273 | RGS1 | 6.68 × 10⁻³ | 2.04288 | SCARNA22 | 5.89 × 10⁻⁷ | −1.74235 |
| 15 | CPEB4 | 1.56 × 10⁻⁵ | −1.58899 | SIGLEC16 | 8.41 × 10⁻³ | −1.51751 | PAFAH1B3 | 3.30 × 10⁻⁶ | 1.53754 |
| 16 | FAM82B | 2.28 × 10⁻⁵ | −1.58899 | SNORA12 | 8.41 × 10⁻³ | −1.63572 | RNU4ATAC | 6.85 × 10⁻⁷ | −2.58193 |
| 17 | UHMK1 | 3.64 × 10⁻⁵ | −1.63527 | FOS | 8.51 × 10⁻³ | −1.64007 | HS.574731 | 1.25 × 10⁻⁶ | −1.54638 |
| 18 | RNF125 | 3.72 × 10⁻⁵ | −1.54084 | KIR2DL3 | 9.25 × 10⁻³ | −1.56381 | RNPC2 | 2.43 × 10⁻⁶ | −1.50256 |
| 19 | EP300 | 6.04 × 10⁻⁵ | −1.52404 | VNN1 | 1.16 × 10⁻² | −1.53815 | FAM55C | 2.67 × 10⁻⁶ | −1.67387 |
| 20 | RSBN1L | 7.21 × 10⁻⁵ | −1.52066 | HIST1H2BG | 1.18 × 10⁻² | −1.57278 | ANKRD36B | 3.51 × 10⁻⁶ | −1.55339 |
| Biological Process | Overlapping Entities | p-Value | Hit Types |
|---|---|---|---|
| Platelet activation via GPCR signaling | ARHGEF7; WAS; THPO; OC90; ERAS; ARPC2; HRAS; F2R; GNAI2; RAP1A; HTR2A | 1.63 × 10⁻³ | Inflammation pathways |
| Branched chain amino acids metabolism | PCCA; VARS; HSD17B10; ACAA1; HMGCS1; HADHA; HADHB; ECHS1; HMGCL | 4.62 × 10⁻³ | Metabolic pathways |
| Inositol phosphate metabolism | GDPD2; NUDT3; ITPKA; PI4K2A; PLCH2; ITPK1; ITPKC; IP6K3 | 7.48 × 10⁻³ | Metabolic pathways |
| p38 MAPK/MAPK14 signaling | HIST1H3D; HIST1H3C; MAP3K5; MKNK1; EIF4A1; OC90; MAP3K11; HIST3H3; ELK1 | 1.15 × 10⁻² | Signal transduction pathways |
| Ras-GAP regulation signaling | DPYSL3; CASK; DOK2; HRAS; IL1RAPL1; ERAS; RAP1A; RASA2 | 1.48 × 10⁻² | Signal transduction pathways |
| Respiratory chain and oxidative phosphorylation | COX4I1; SDHB; ATP6V0E1; ATP6V1E1; ATP6V1F | 3.61 × 10⁻² | Metabolic pathways |
| CR3-mediated phagocytosis in neutrophils and macrophages | MYO1G; C3; HRAS; ERAS; ARPC2; DES | 3.88 × 10⁻² | Inflammation pathways |
| Omega-3-fatty acid metabolism | ALOX15; OC90; HSD17B10; ACAA1; HADHA; HADHB; ECHS1; CYP4F12; NACA2; FADS1 | 3.9 × 10⁻² | Metabolic pathways |
| Leukotriene effect on vascular endothelial cell response | PRKCG; MAP3K5; DOCK6; USE1; ADCY9; CDH1; BNIP1 | 4.01 × 10⁻² | Inflammation pathways |
| synaptic endocytosis | CLTA; ARRB1; SYT1; AP2B1; HRAS; ADCY9; ERAS; RAP1A; CALML6 | 4.25 × 10⁻² | Nociception pathways |
| Neutrophil chemotaxis | DOCK6; OC90; ERAS; ARPC2; NCF1; PF4; HRAS; ADCY9; GNAI2 | 4.32 × 10⁻² | Inflammation pathways |
| Activation of complement cascade by pentraxins | CFB; C8G; C8B; C3; C7 | 4.66 × 10⁻² | Inflammation pathways |
| ERK/MAPK canonical signaling | HIST1H3D; HIST1H3C; PRKCG; PLCH2; EIF4A1; OC90; ERAS; HIST3H3; MKNK1; HRAS; ADCY9; RAP1A; SPHK1 | 5.48 × 10⁻² | Signal transduction pathways |
| CC chemokine receptor signaling | CCR4; CCL19; PRKCG; LIMK1; WAS; TIAM1; ERAS; NCF1; HRAS; ADCY9; RAP1A; CCL20 | 5.91 × 10⁻² | Inflammation pathways |
| Fatty acid oxidation | HSD17B10; ACAA1; HADHA; HADHB; ATOX1; ECHS1 | 6.82 × 10⁻² | Metabolic pathways |
| Riboflavin metabolism | RFK; ACP2; DAK | 7.20 × 10⁻² | Metabolic pathways |
| Vascular endothelial cell activation by blood coagulation factors | F10; PRKCG; OC90; ERAS; CALML6; HRAS; F2R; F2RL2 | 7.24 × 10⁻² | Inflammation pathways |
| MC1R-related anti-inflammatory signaling | HRAS; ADCY9; IL10; RAPGEF4; ERAS; RAP1A | 7.38 × 10⁻² | Inflammation pathways |
| Neutrophil recruitment and priming | MAP3K5; OC90; ERAS; PF4; HRAS; GNAI2; CSF2 | 7.73 × 10⁻² | Inflammation pathways |
| Notch signaling | MIB1; NOTCH4; FBXW7; SLC35D2; CTBP1; ADAM17 | 9.01 × 10⁻² | Signal transduction pathways |
| Biological Process | Overlapping Entities | p-Value | Hit Types |
|---|---|---|---|
| Mast cell activation without degranulation through IL33/IL1RL1 signaling | IL1RL1; IRAK4; NFKB1; MAP3K1; MAP3K7 | 2.36 × 10⁻⁴ | Inflammation pathways |
| Vitamin K metabolism | F10; F7; PRRG4; VKORC1; VKORC1L1 | 3.64 × 10⁻⁴ | Metabolic pathways |
| JNK/MAPK signaling | MAP3K1; CDC42; MAP3K7; TP53; DUSP5; MAP3K13; ELK1; FOS | 6.79 × 10⁻⁴ | Signal transduction pathways |
| Overview of mast cell activation without degranulation | IL1RL1; IRAK4; NFKB1; TLR9; MAP3K1; MAP3K7; CXCR4; CD180; FOS | 9.16 × 10⁻⁴ | Inflammation pathways |
| Toll-like receptor-independent sterile inflammation | IL1RL1; IRAK4; MAPK1; NFKB1; MAP3K1; CDC42; MAP3K7; EZR; FOS | 1.63 × 10⁻³ | Inflammation pathways |
| Mast Cell Activation without degranulation through IL1R1 and TLR signaling | IRAK4; NFKB1; TLR9; MAP3K1; MAP3K7; CD180 | 3.49 × 10⁻³ | Inflammation pathways |
| Tight junction regulation | SDC3; CASK; SDC2 | 4.02 × 10⁻³ | Cell signaling |
| Prostaglandin E2 receptor signaling in neurons | NFKB1; MAP3K7; GABRA6; GABRA5; GABRB3; TNFSF11 | 1.20 × 10⁻² | Inflammation pathways |
| Neutrophil recruitment and priming | MAPK1; MAP3K1; FOS; IRAK4; NFKB1; PF4; MAP3K7; TP53 | 1.24 × 10⁻² | Inflammation pathways |
| Plasmin effects in inflammation | MAPK1; MMP3; MAP3K1; CDC42; SERPINE1; FOS; NFKB1; PLCL1; CCL20; PLCE1; SPINK5 | 1.95 × 10⁻² | Inflammation pathways |
| Function of macrophage M1 lineage | IRAK4; MAPK1; NFKB1; TLR9; MAP3K1; MAP3K7; CD180 | 2.16 × 10⁻² | Inflammation pathways |
| Irinotecan metabolism | KL; CES2; CES1 | 2.63 × 10⁻² | Metabolic pathways |
| Neutrophil activation via adherence on endothelial cells | MAPK1; NFKB1; CD34; CDC42; SELPLG; NCF1 | 2.99 × 10⁻² | Inflammation pathways |
| Mast cell activation without degranulation through tnfsf8 signaling | NFKB1; MAP3K1; MAP3K7 | 3.14 × 10⁻² | Inflammation pathways |
| Vascular endothelial cell activation by blood coagulation factors | F10; F7; MAPK1; CTGF; FOS; IRAK4; NFKB1; GNA11 | 3.15 × 10⁻² | Inflammation pathways |
| Inositol phosphate metabolism | INPP4B; PLCL1; PIK3CA; INPP4A; PLCE1 | 3.77 × 10⁻² | Metabolic pathways |
| Mevalonate pathway | HMGCS1; GGPS1; IDI1 | 4.25 × 10⁻² | Metabolic pathways |
| GABA(A) membrane hyperpolarization | GABRA6; GABRA5; GABRB3 | 4.68 × 10⁻² | Nociception pathways |
| TGF-beta signaling | MAPK1; MAP3K1; CDC42; SERPINE1; ELK1; FOS; NFKB1; MAP3K7; ANAPC5; TGFBR1 | 4.83 × 10⁻² | Signal transduction pathways |
| synaptic inhibition | GLRA4; GLRA3 | 4.94 × 10⁻² | Nociception pathways |
| Biological Process | Overlapping Entities | p-Value | Hit Types |
|---|---|---|---|
| Omega-3-fatty acid metabolism | GGT1; CYP3A7; ELOVL2; GGT5; ALOX5; GGT7; TECR; ACOT7; CYP4A22; FADS1; CYP2D6; CYP2C18; CYP2A13 | 2.13 × 10⁻³ | Metabolic pathways |
| Arachidonic acid metabolism | CYP2E1; AKR1C3; GGT1; CYP3A7; PTGDS; GGT5; ALOX5; GGT7; ACOT7; CYP4A11; CYP4A22; CYP2D6; CYP2C18; CYP2A13 | 4.13 × 10⁻³ | Metabolic pathways |
| JNK/MAPK signaling | TRAF6; HSF1; CDC42; MAP3K3; DUSP26; DUSP9; ELK1 | 1.20 × 10⁻² | Signal transduction pathways |
| Proplatelet maturation | RASGRP1; JAK1; FLI1; ADCY10; RASGRF1; KRAS; CSF2RB; PF4; IL11; MKL1; CSF2 | 1.49 × 10⁻² | Inflammation pathways |
| Neutrophil activation via adherence on endothelial cells | SELL; CDC42; SELE; CR1; ACTR3; VAV1; ARPC2; NCF1 | 1.54 × 10⁻² | Inflammation pathways |
| Neutrophil chemotaxis | CXCL5; CDC42; VAV1; MYLPF; ARPC2; NCF1; ADCY10; ITGA4; KRAS; PF4; ACTR3 | 1.95 × 10⁻² | Inflammation pathways |
| ERK5/MAPK7 signaling | TRAF6; PML; MAP3K3; CTF1; NFE2L2 | 2.43 × 10⁻² | Signal transduction pathways |
| Macrophage M2-related phagocytosis | MYO1G; EPS15; KRAS; CDC42; VAV1; PTPRC; MYO1H | 3.05 × 10⁻² | Inflammation pathways |
| Omega-6-fatty acid metabolism | CYP3A7; ELOVL2; TECR; ACOT7; CYP4A22; FADS1; CYP2D6; CYP2C18; CYP2A13 | 6.27 × 10⁻² | Metabolic pathways |
| Insulin action | FOXK1; DUSP22; FOXS1; PTPRF; DUSP9; ADCY10; ETV3; IGFBP2; KRAS; NR2C2; DUSP26; FOXN3; FOXN4; IRS2; FOXE1; FOXD4L3; FOXD4L1; SSH1 | 6.34 × 10⁻² | Cell signaling |
| Glucose metabolism | PFKM; ADPGK; ENO2; ALPL; PCK1; PGM3 | 6.38 × 10⁻² | Metabolic pathways |
| Inositol phosphate metabolism | INPP4B; PIK3CD; ITPKA; INPP4A; PLCB3; MTMR3 | 6.38 × 10⁻² | Metabolic pathways |
| Caffeine metabolism | CYP3A7; CYP4A22; CYP2D6; CYP2C18; CYP2A13 | 6.88 × 10⁻² | Metabolic pathways |
| CR3-mediated phagocytosis in neutrophils and macrophages | MYO1G; RASGRF1; KRAS; ACTR3; ARPC2; MYO1H | 7.23 × 10⁻² | Inflammation pathways |
| Adherens junction regulation | DVL3; TCF7L1; CDC42; PTPRF; ZNF658; ZNF780B; SMAD5; BMP8A; HIPK3; TGFBR2; TEK; ZNF275; ZKSCAN5; NLK; WNT11; MAP3K3; MAPK4; ZNF3; ZNF563; ZNF461; HGF; ZNF418; ZNF550; RBAK; RHOQ; ARHGAP23; ARHGAP6; ARHGAP18; ARHGAP17; CRTAM; ROR2; ZNF274; IGFBP2; GDF1; PVR; ZNF417; ARHGAP22 | 7.23 × 10⁻² | Cell signaling |
| Platelet Activation via GPCR Signaling | CDC42; WAS; RASGRP1; ARPC2; PTGIR; RASGRF1; KRAS; ACTR3 | 8.89 × 10⁻² | Inflammation pathways |
| Toll-like receptor-independent sterile inflammation | TRAF6; BCL10; PRKCE; CDC42; HMGB1; IL1R1; KRAS | 9.07 × 10⁻² | Inflammation pathways |
| Glyoxylate and glycerate metabolism | HAO1; GRHPR; GLYCTK; ENO2 | 0.100737 | Metabolic pathways |
Publisher’s Note: MDPI stays neutral with regard to jurisdictional claims in published maps and institutional affiliations. |
© 2021 by the authors. Licensee MDPI, Basel, Switzerland. This article is an open access article distributed under the terms and conditions of the Creative Commons Attribution (CC BY) license (https://creativecommons.org/licenses/by/4.0/).
Share and Cite
Abdul Sani, N.F.; Amir Hamzah, A.I.Z.; Abu Bakar, Z.H.; Mohd Yusof, Y.A.; Makpol, S.; Wan Ngah, W.Z.; Damanhuri, H.A. Gene Expression Profile in Different Age Groups and Its Association with Cognitive Function in Healthy Malay Adults in Malaysia. Cells 2021, 10, 1611. https://doi.org/10.3390/cells10071611
Abdul Sani NF, Amir Hamzah AIZ, Abu Bakar ZH, Mohd Yusof YA, Makpol S, Wan Ngah WZ, Damanhuri HA. Gene Expression Profile in Different Age Groups and Its Association with Cognitive Function in Healthy Malay Adults in Malaysia. Cells. 2021; 10(7):1611. https://doi.org/10.3390/cells10071611
Chicago/Turabian StyleAbdul Sani, Nur Fathiah, Ahmad Imran Zaydi Amir Hamzah, Zulzikry Hafiz Abu Bakar, Yasmin Anum Mohd Yusof, Suzana Makpol, Wan Zurinah Wan Ngah, and Hanafi Ahmad Damanhuri. 2021. "Gene Expression Profile in Different Age Groups and Its Association with Cognitive Function in Healthy Malay Adults in Malaysia" Cells 10, no. 7: 1611. https://doi.org/10.3390/cells10071611
APA StyleAbdul Sani, N. F., Amir Hamzah, A. I. Z., Abu Bakar, Z. H., Mohd Yusof, Y. A., Makpol, S., Wan Ngah, W. Z., & Damanhuri, H. A. (2021). Gene Expression Profile in Different Age Groups and Its Association with Cognitive Function in Healthy Malay Adults in Malaysia. Cells, 10(7), 1611. https://doi.org/10.3390/cells10071611