
SUN-MKL1 Crosstalk Regulates Nuclear Deformation and Fast Motility of Breast Carcinoma Cells in Fibrillar ECM Microenvironment

 , , and
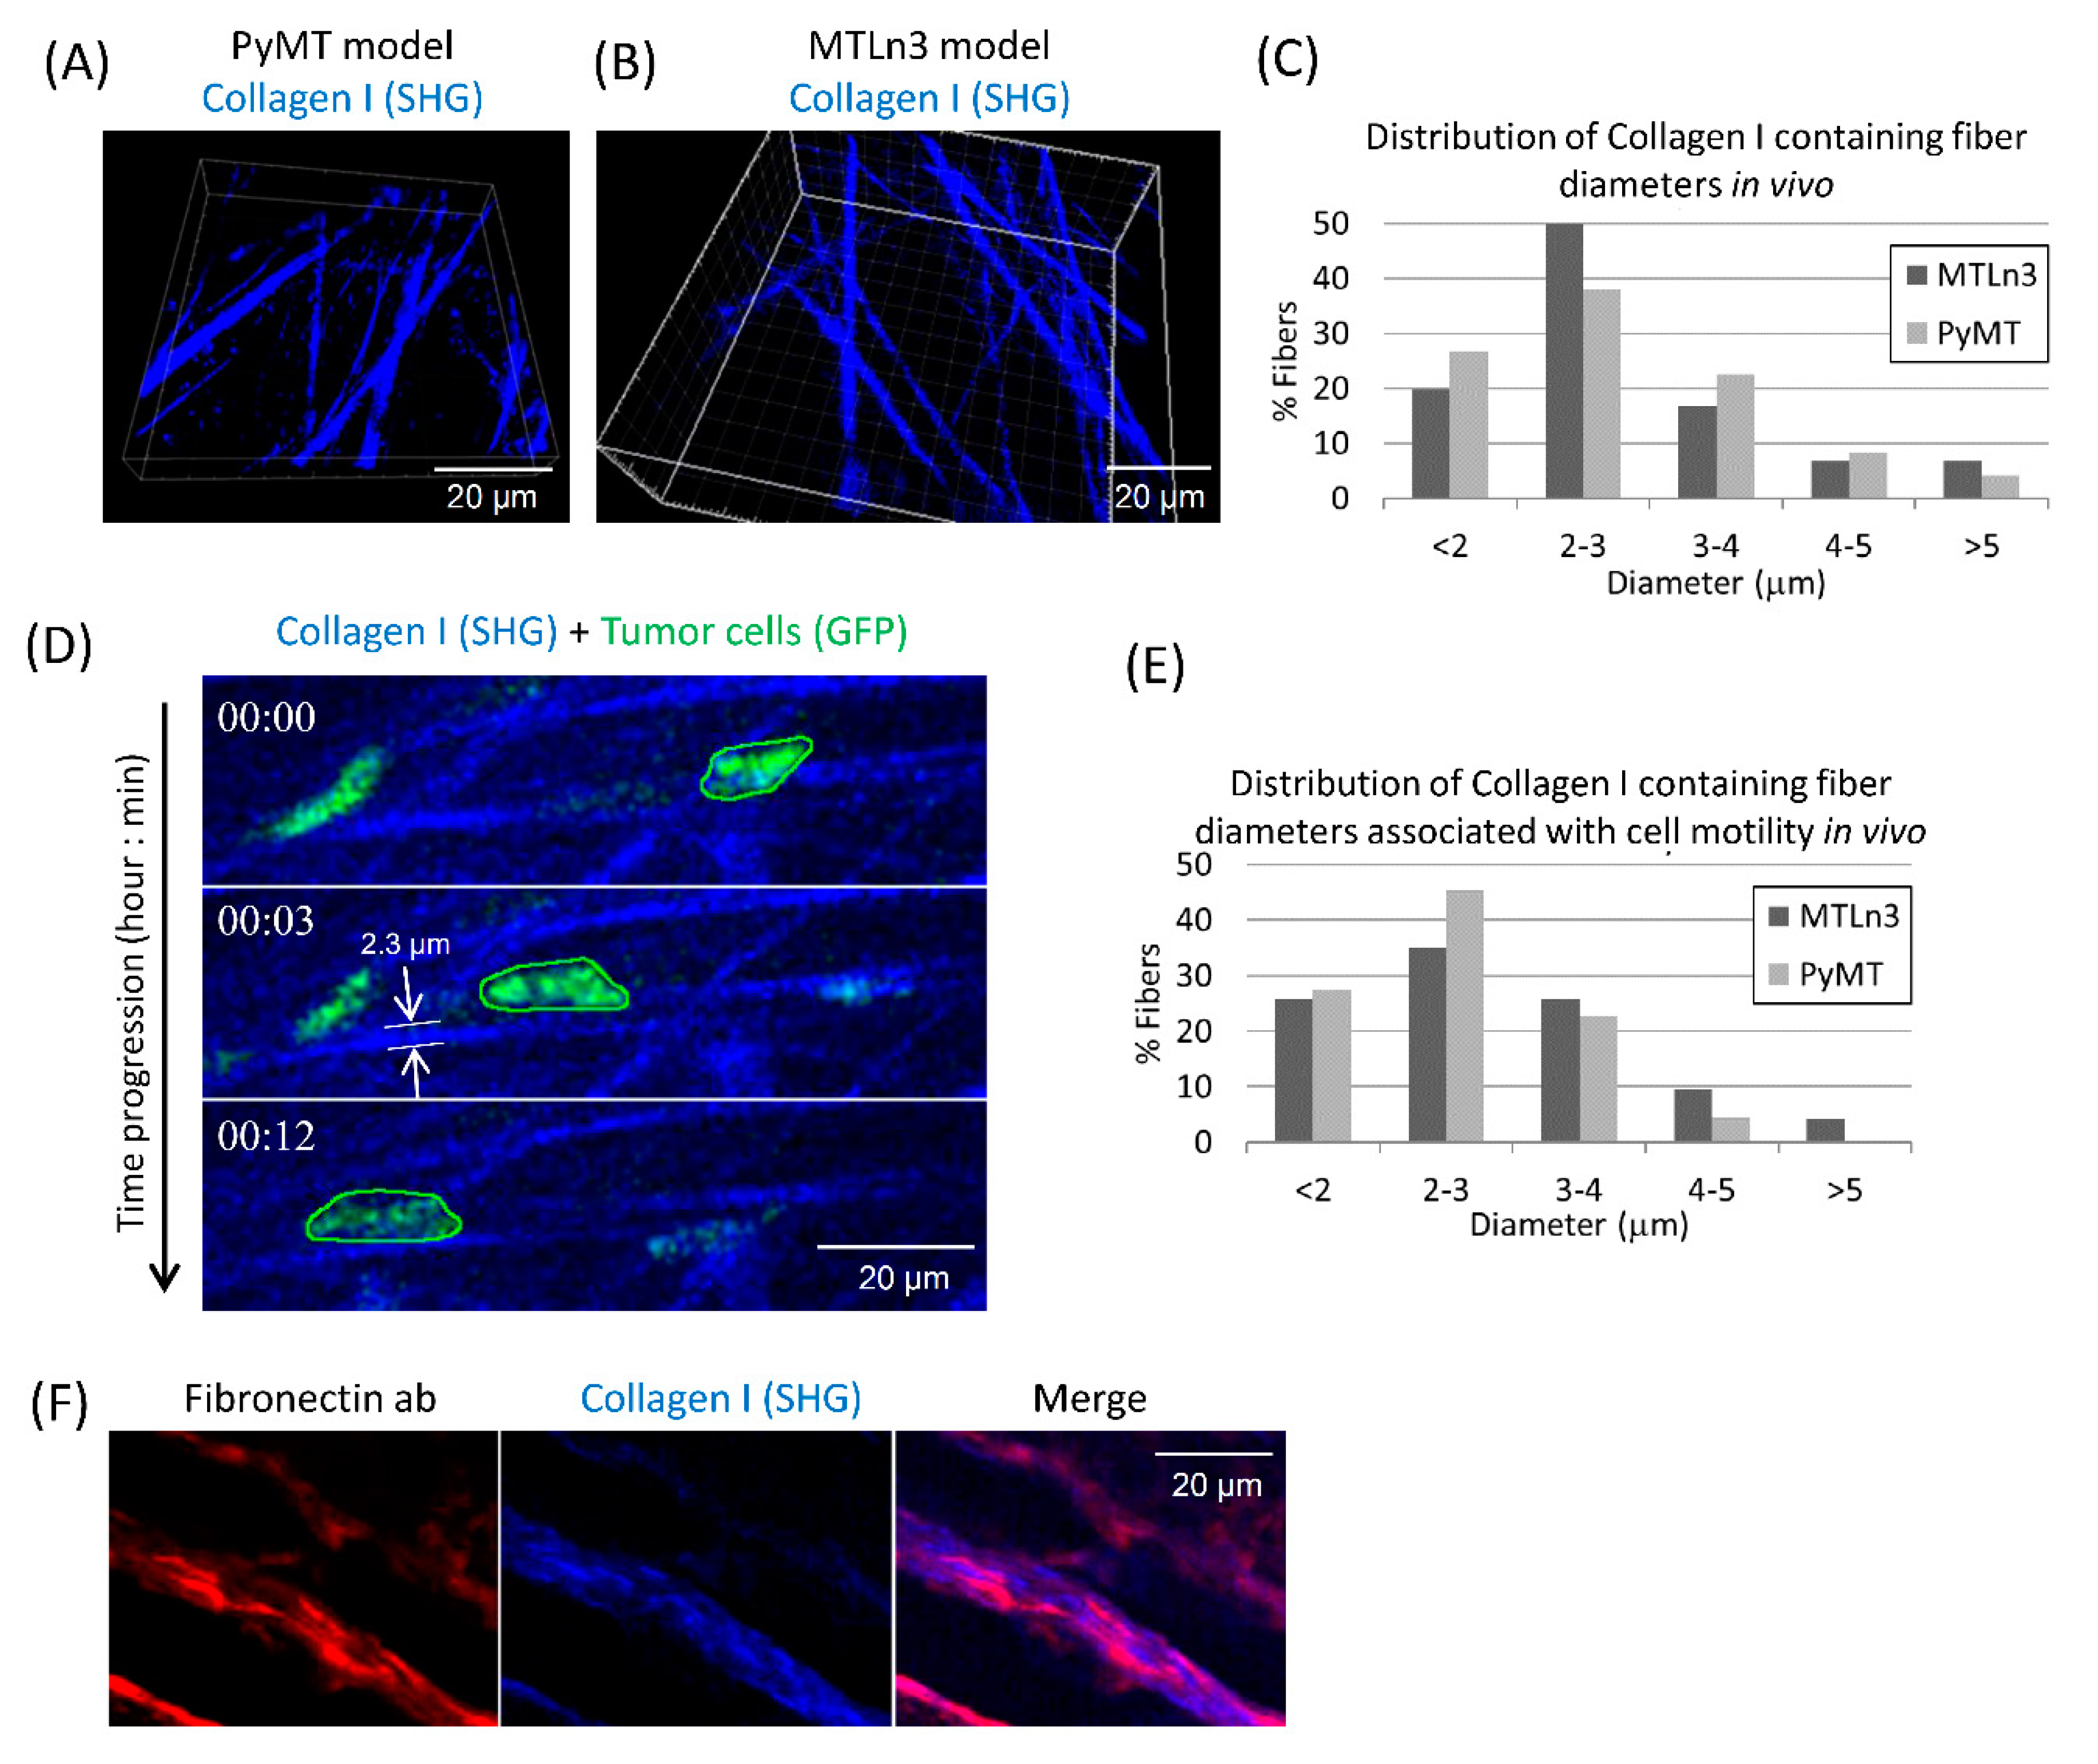
Abstract
1. Introduction
2. Materials and Methods
2.1. Cell Culture, Antibodies, Immunofluorescence
2.2. Animal Models and Intravital Imaging
2.3. In Vivo Fiber Diameter Quantification
2.4. RNAi
2.5. PVA (Polyvinyl Alcohol) Film Coating
2.6. Electrospun Fibers
2.7. ECM Coating of Fibers
2.8. Fibronectin-Coated Micro-Patterned 1D Lines
2.9. Scanning Electron Microscopy
2.10. Fibronectin Staining of ECM in Tumor Sections
2.11. Live-Cell Microscopy
2.12. Single Tumor Cell Tracking in 1D and 2D
2.13. F-Actin Stress Fiber Imaging and Quantification
2.14. Live Imaging and Quantification of Lifeact Cells
2.15. Analysis of SUN1 and SUN2 Expression in Cancer Patients
2.16. Statistical Analysis
3. Results
3.1. Breast Carcinoma Cells Show Fast Motility Primarily on Small Diameter ECM Fibers In Vivo
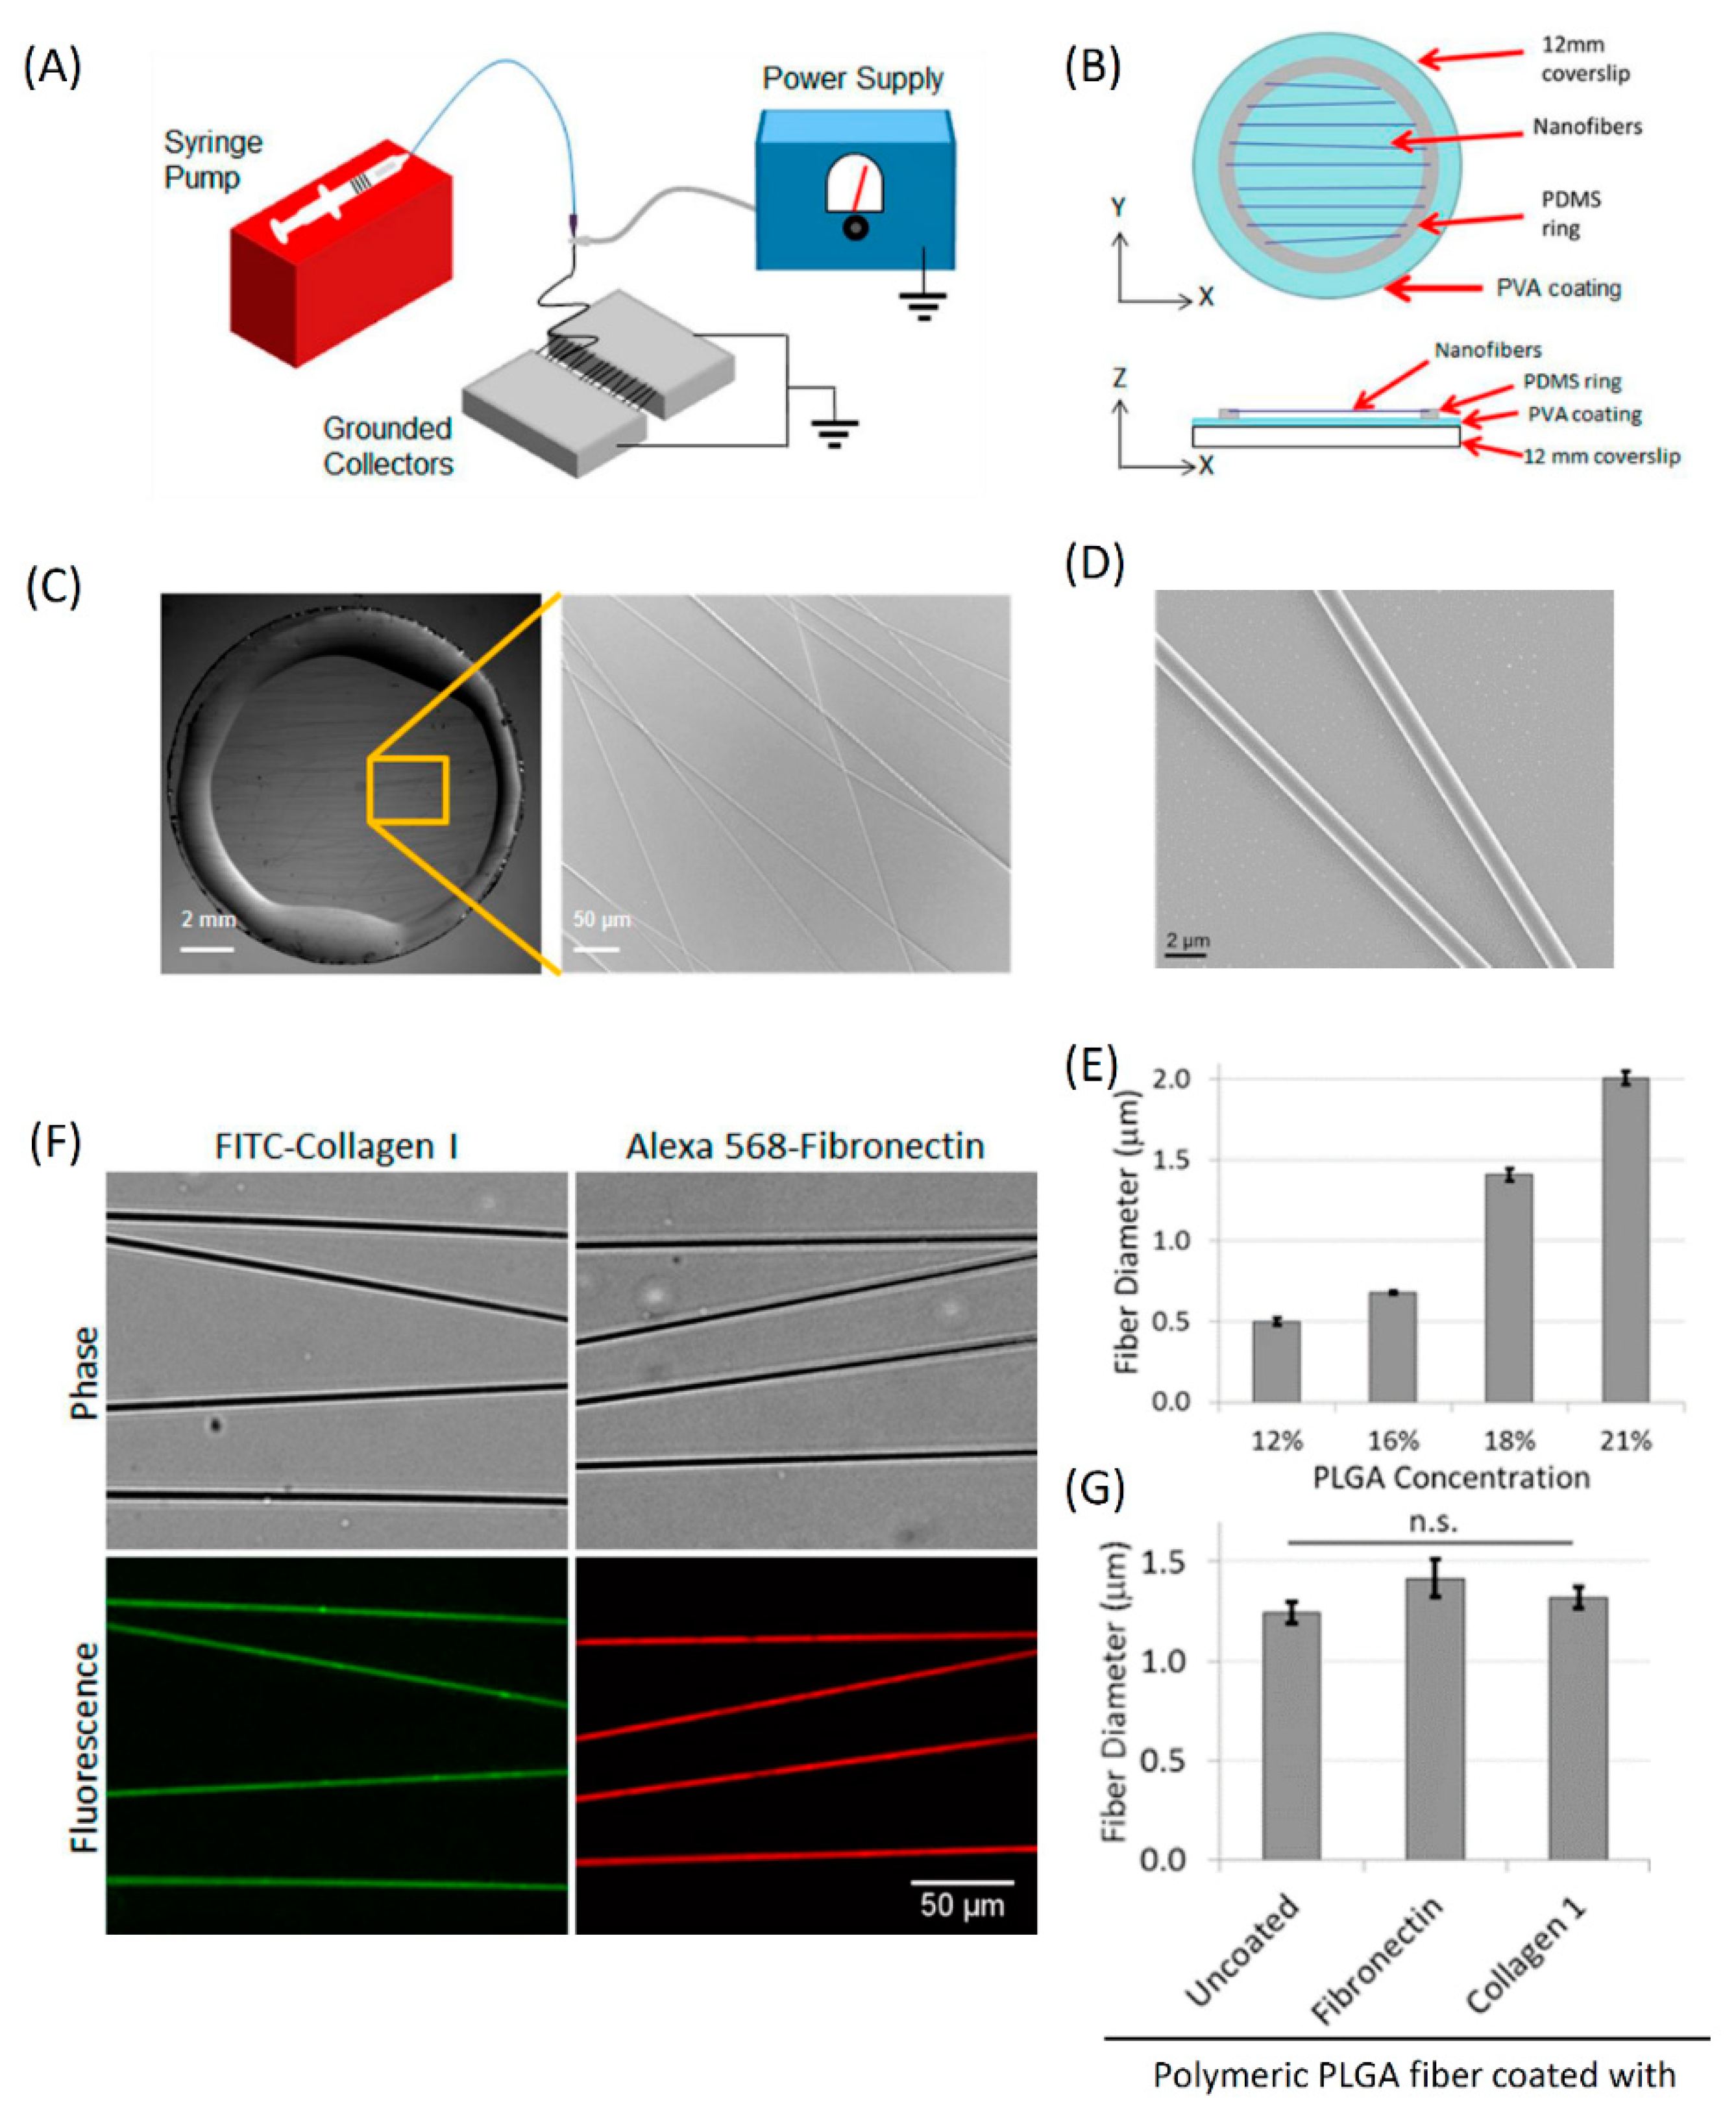
3.2. Fabrication and Characterization of In Vitro 1D Fibers
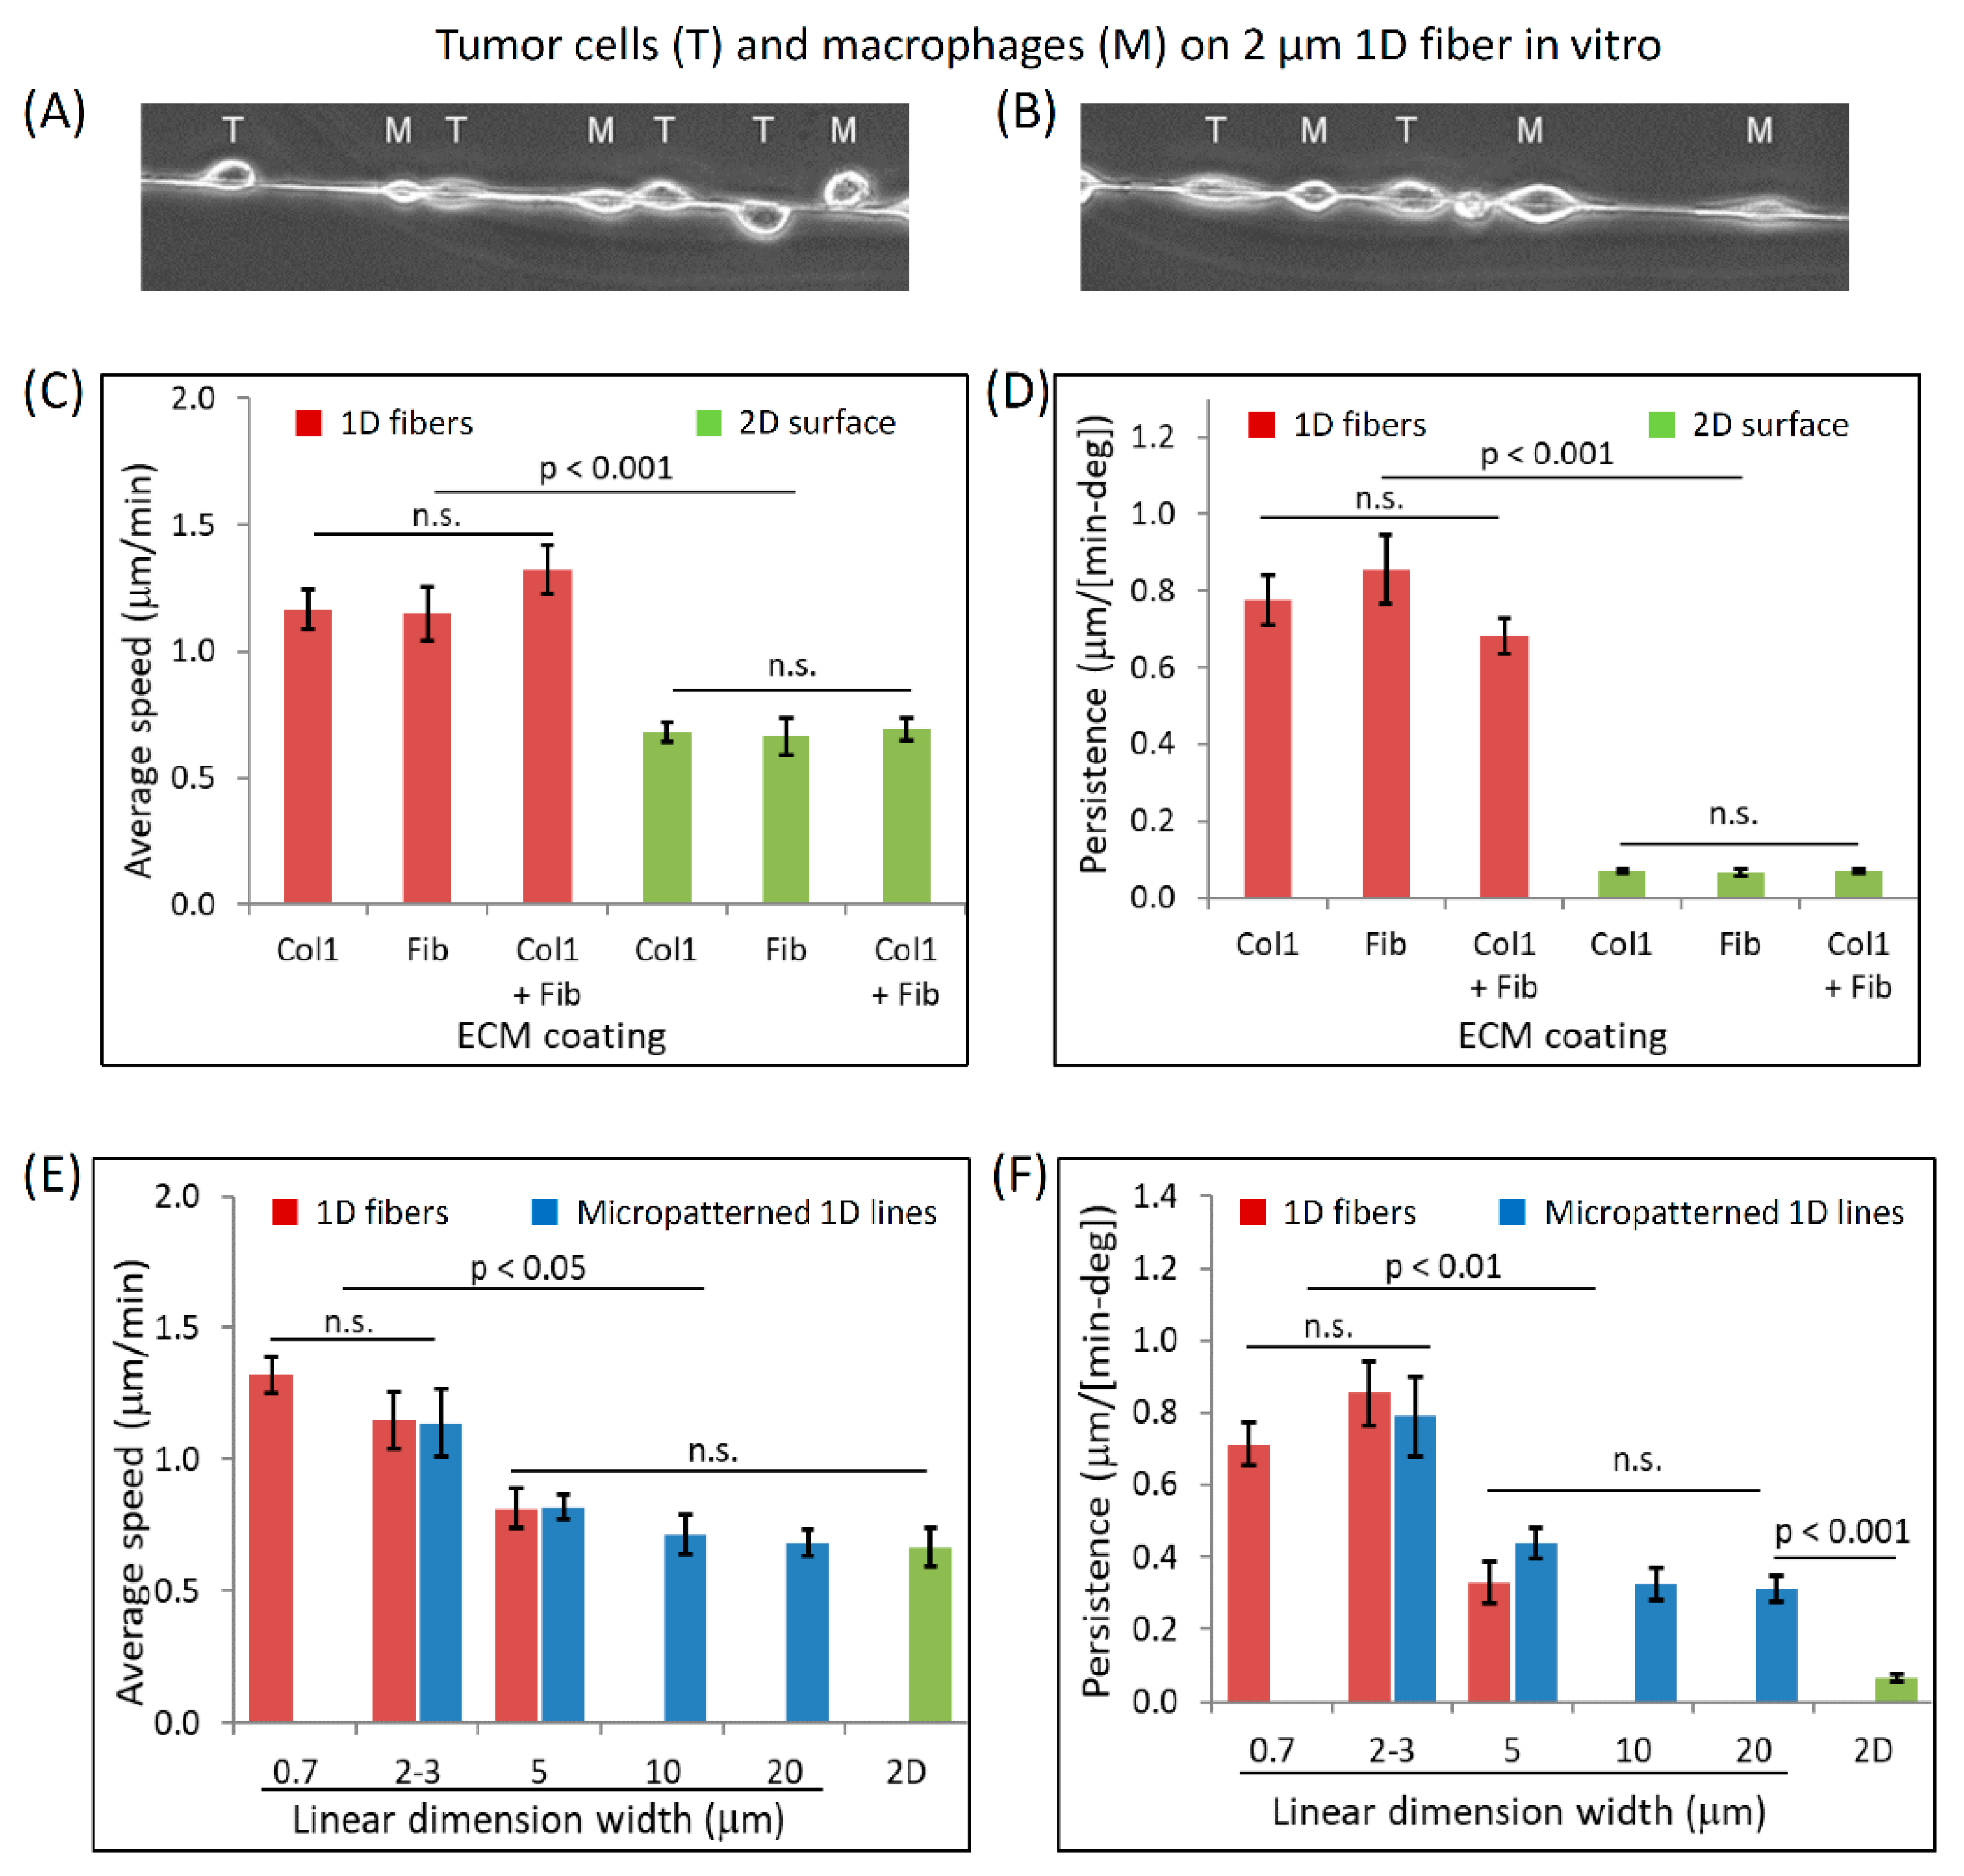
3.3. Dimensionally Matched Physiological 1D Substrates Mimic In Vivo Fast Tumor Cell Motility
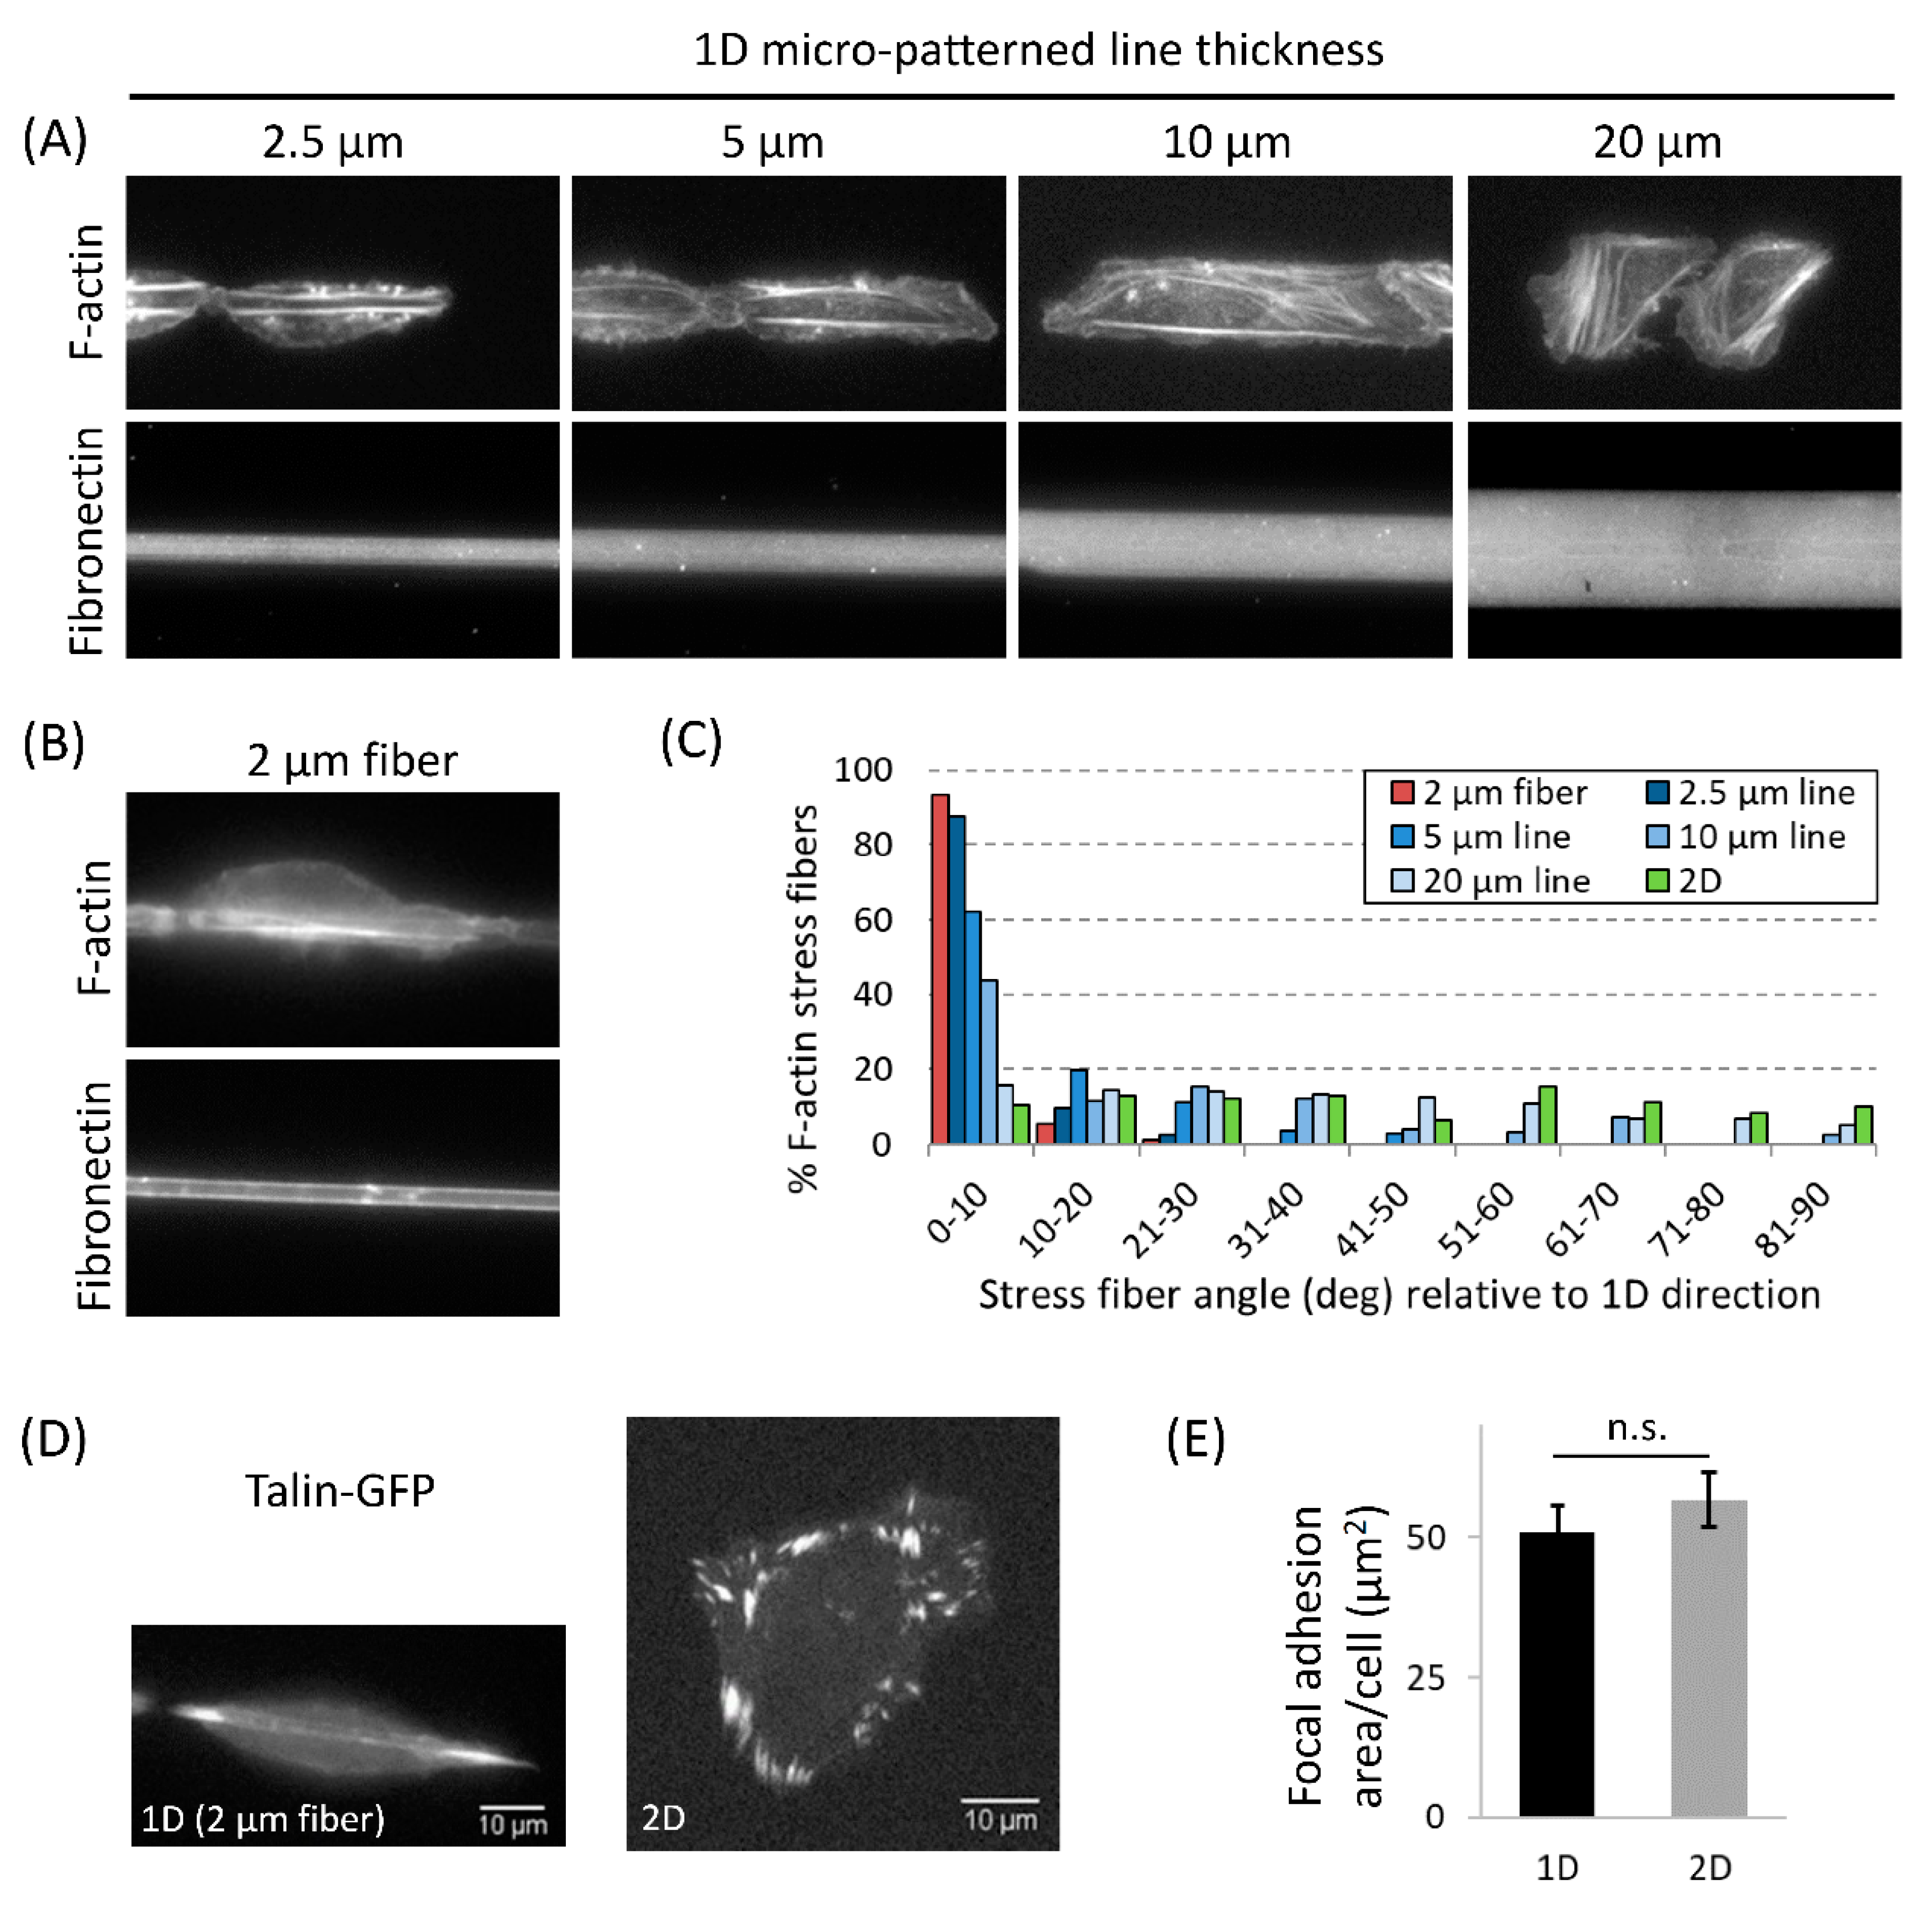
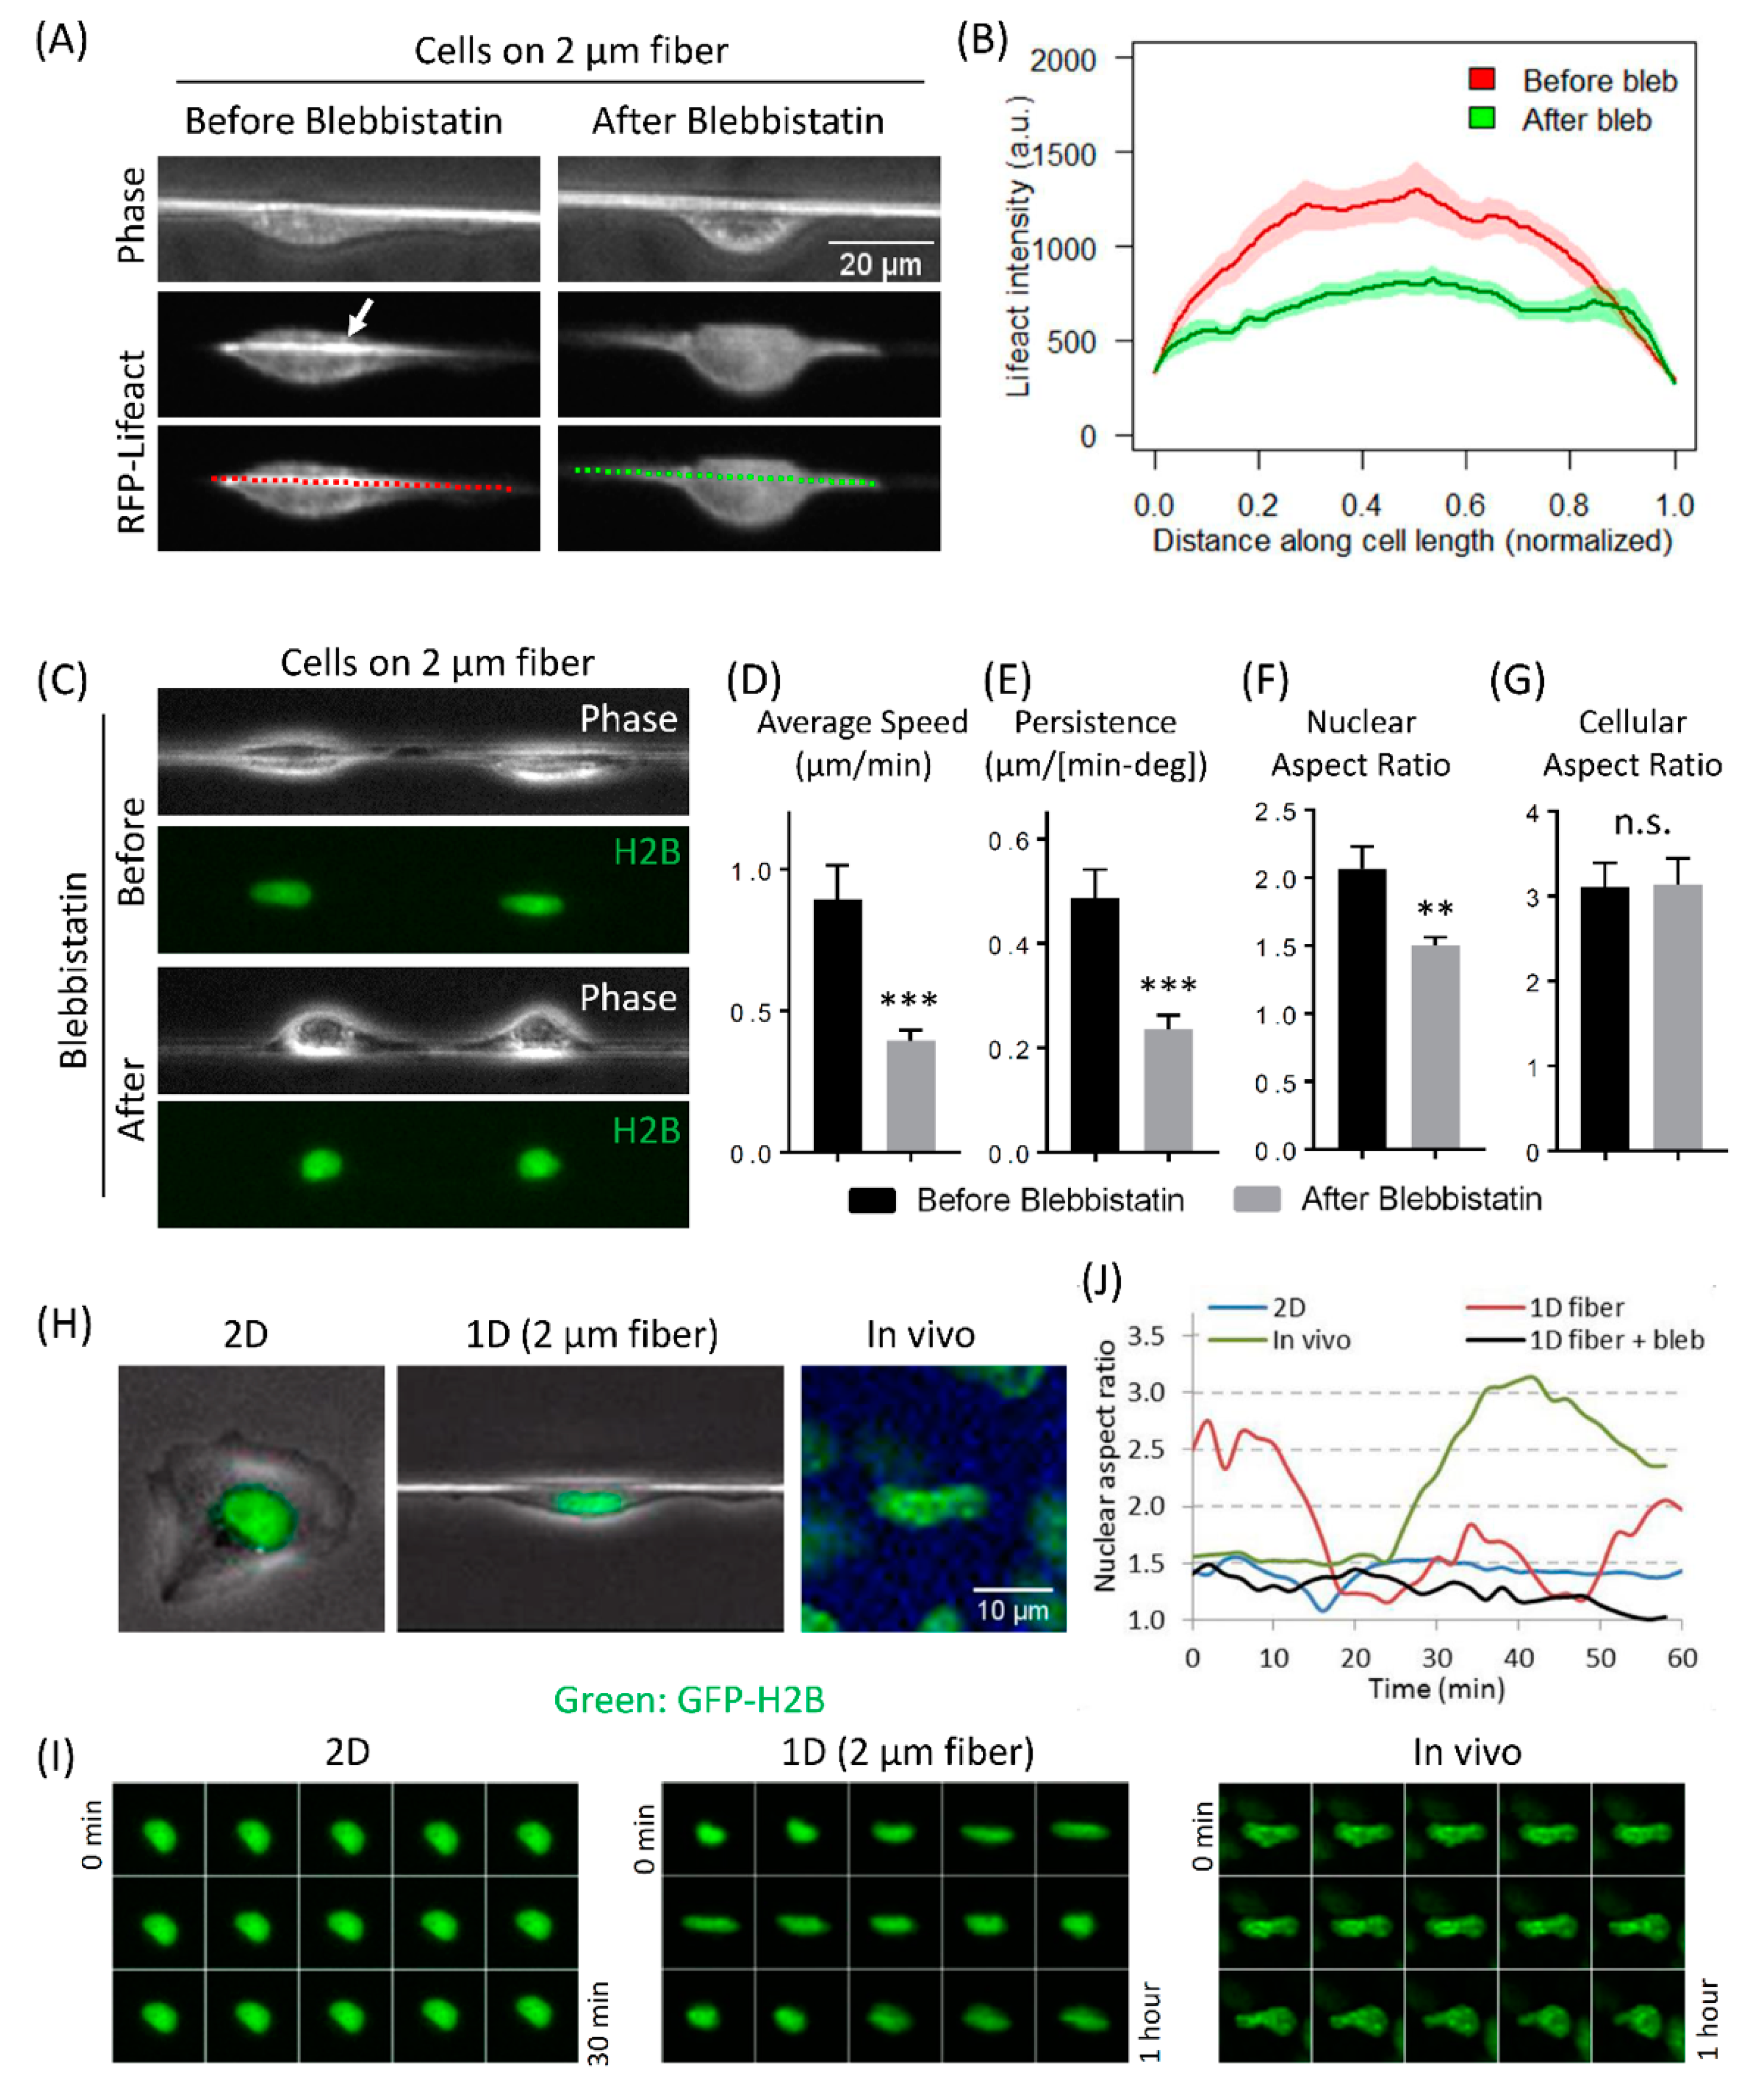
3.4. Actomyosin Contractility Regulates F-Actin Alignment along 1D Axis and High-Speed Tumor Cell Motility in 1D
3.5. Fast Tumor Cell Motility and Nuclear Shape Changes Are Linked Together in 1D and In Vivo, but Not in 2D
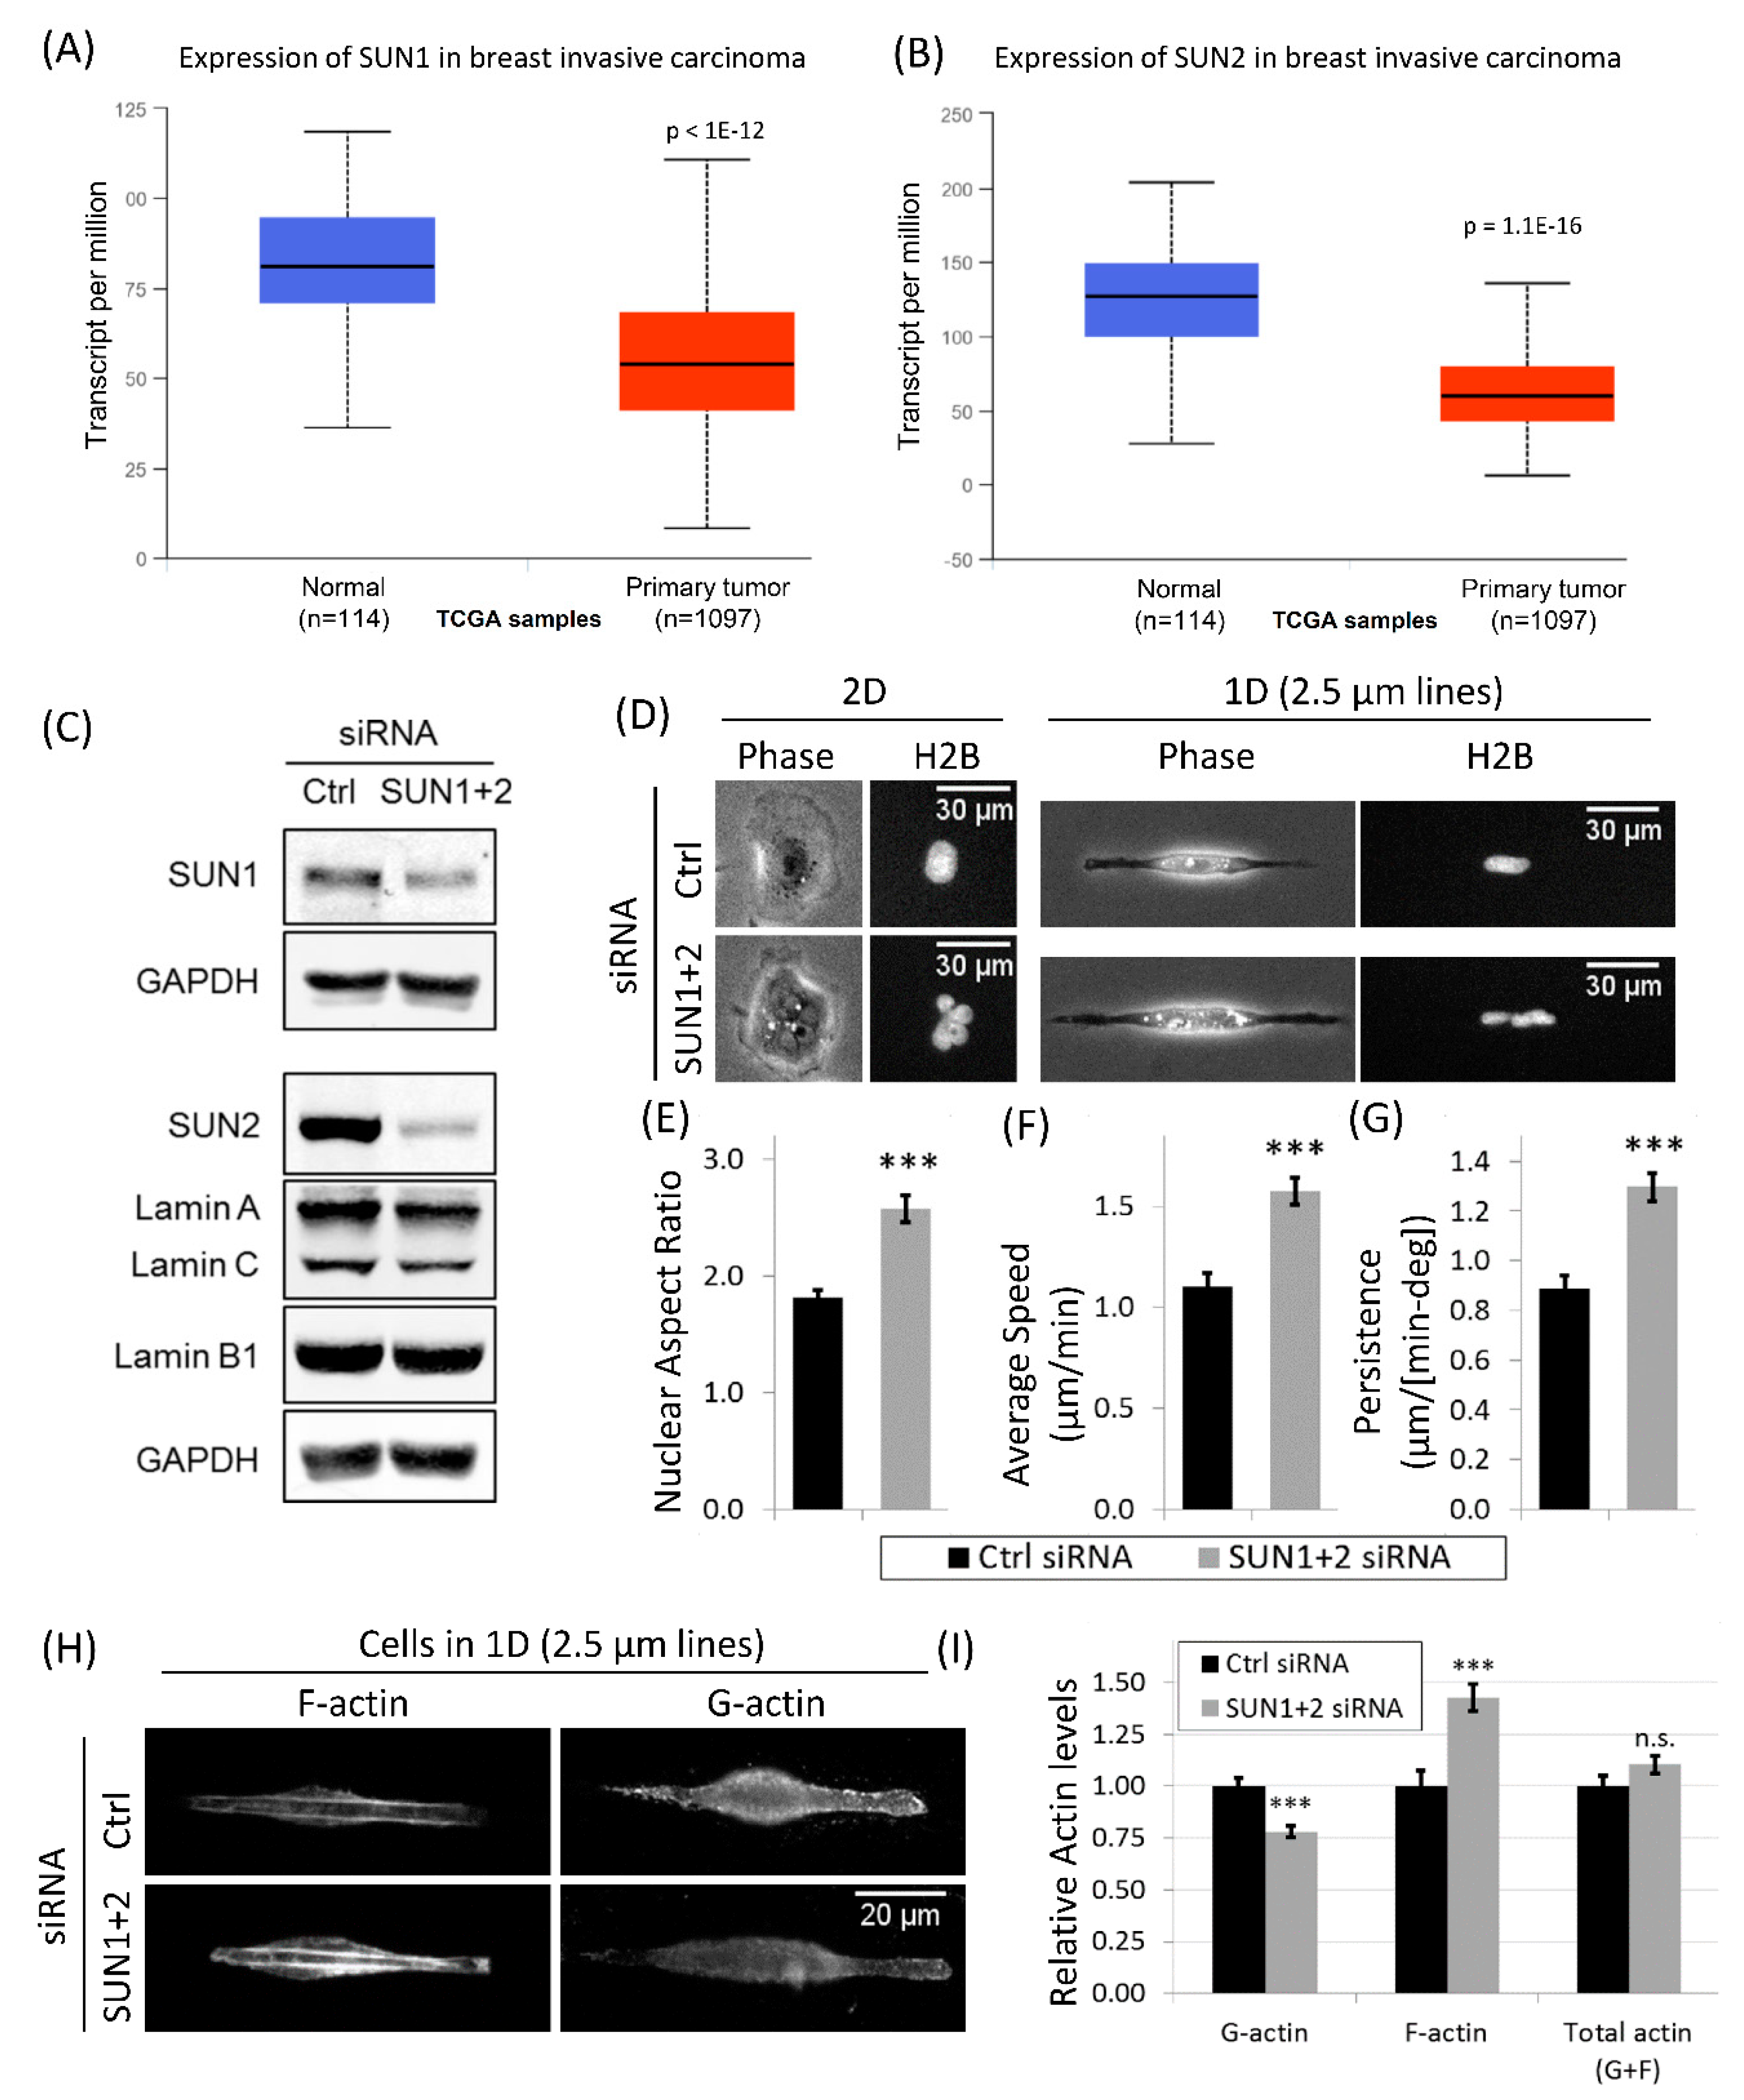
3.6. Downregulation of LINC Complex Proteins, SUN1 and SUN2, in Cancer Patients
3.7. Disruption of LINC Complex Leads to Increased Tumor Cell Migration and Actin Polymerization in 1D
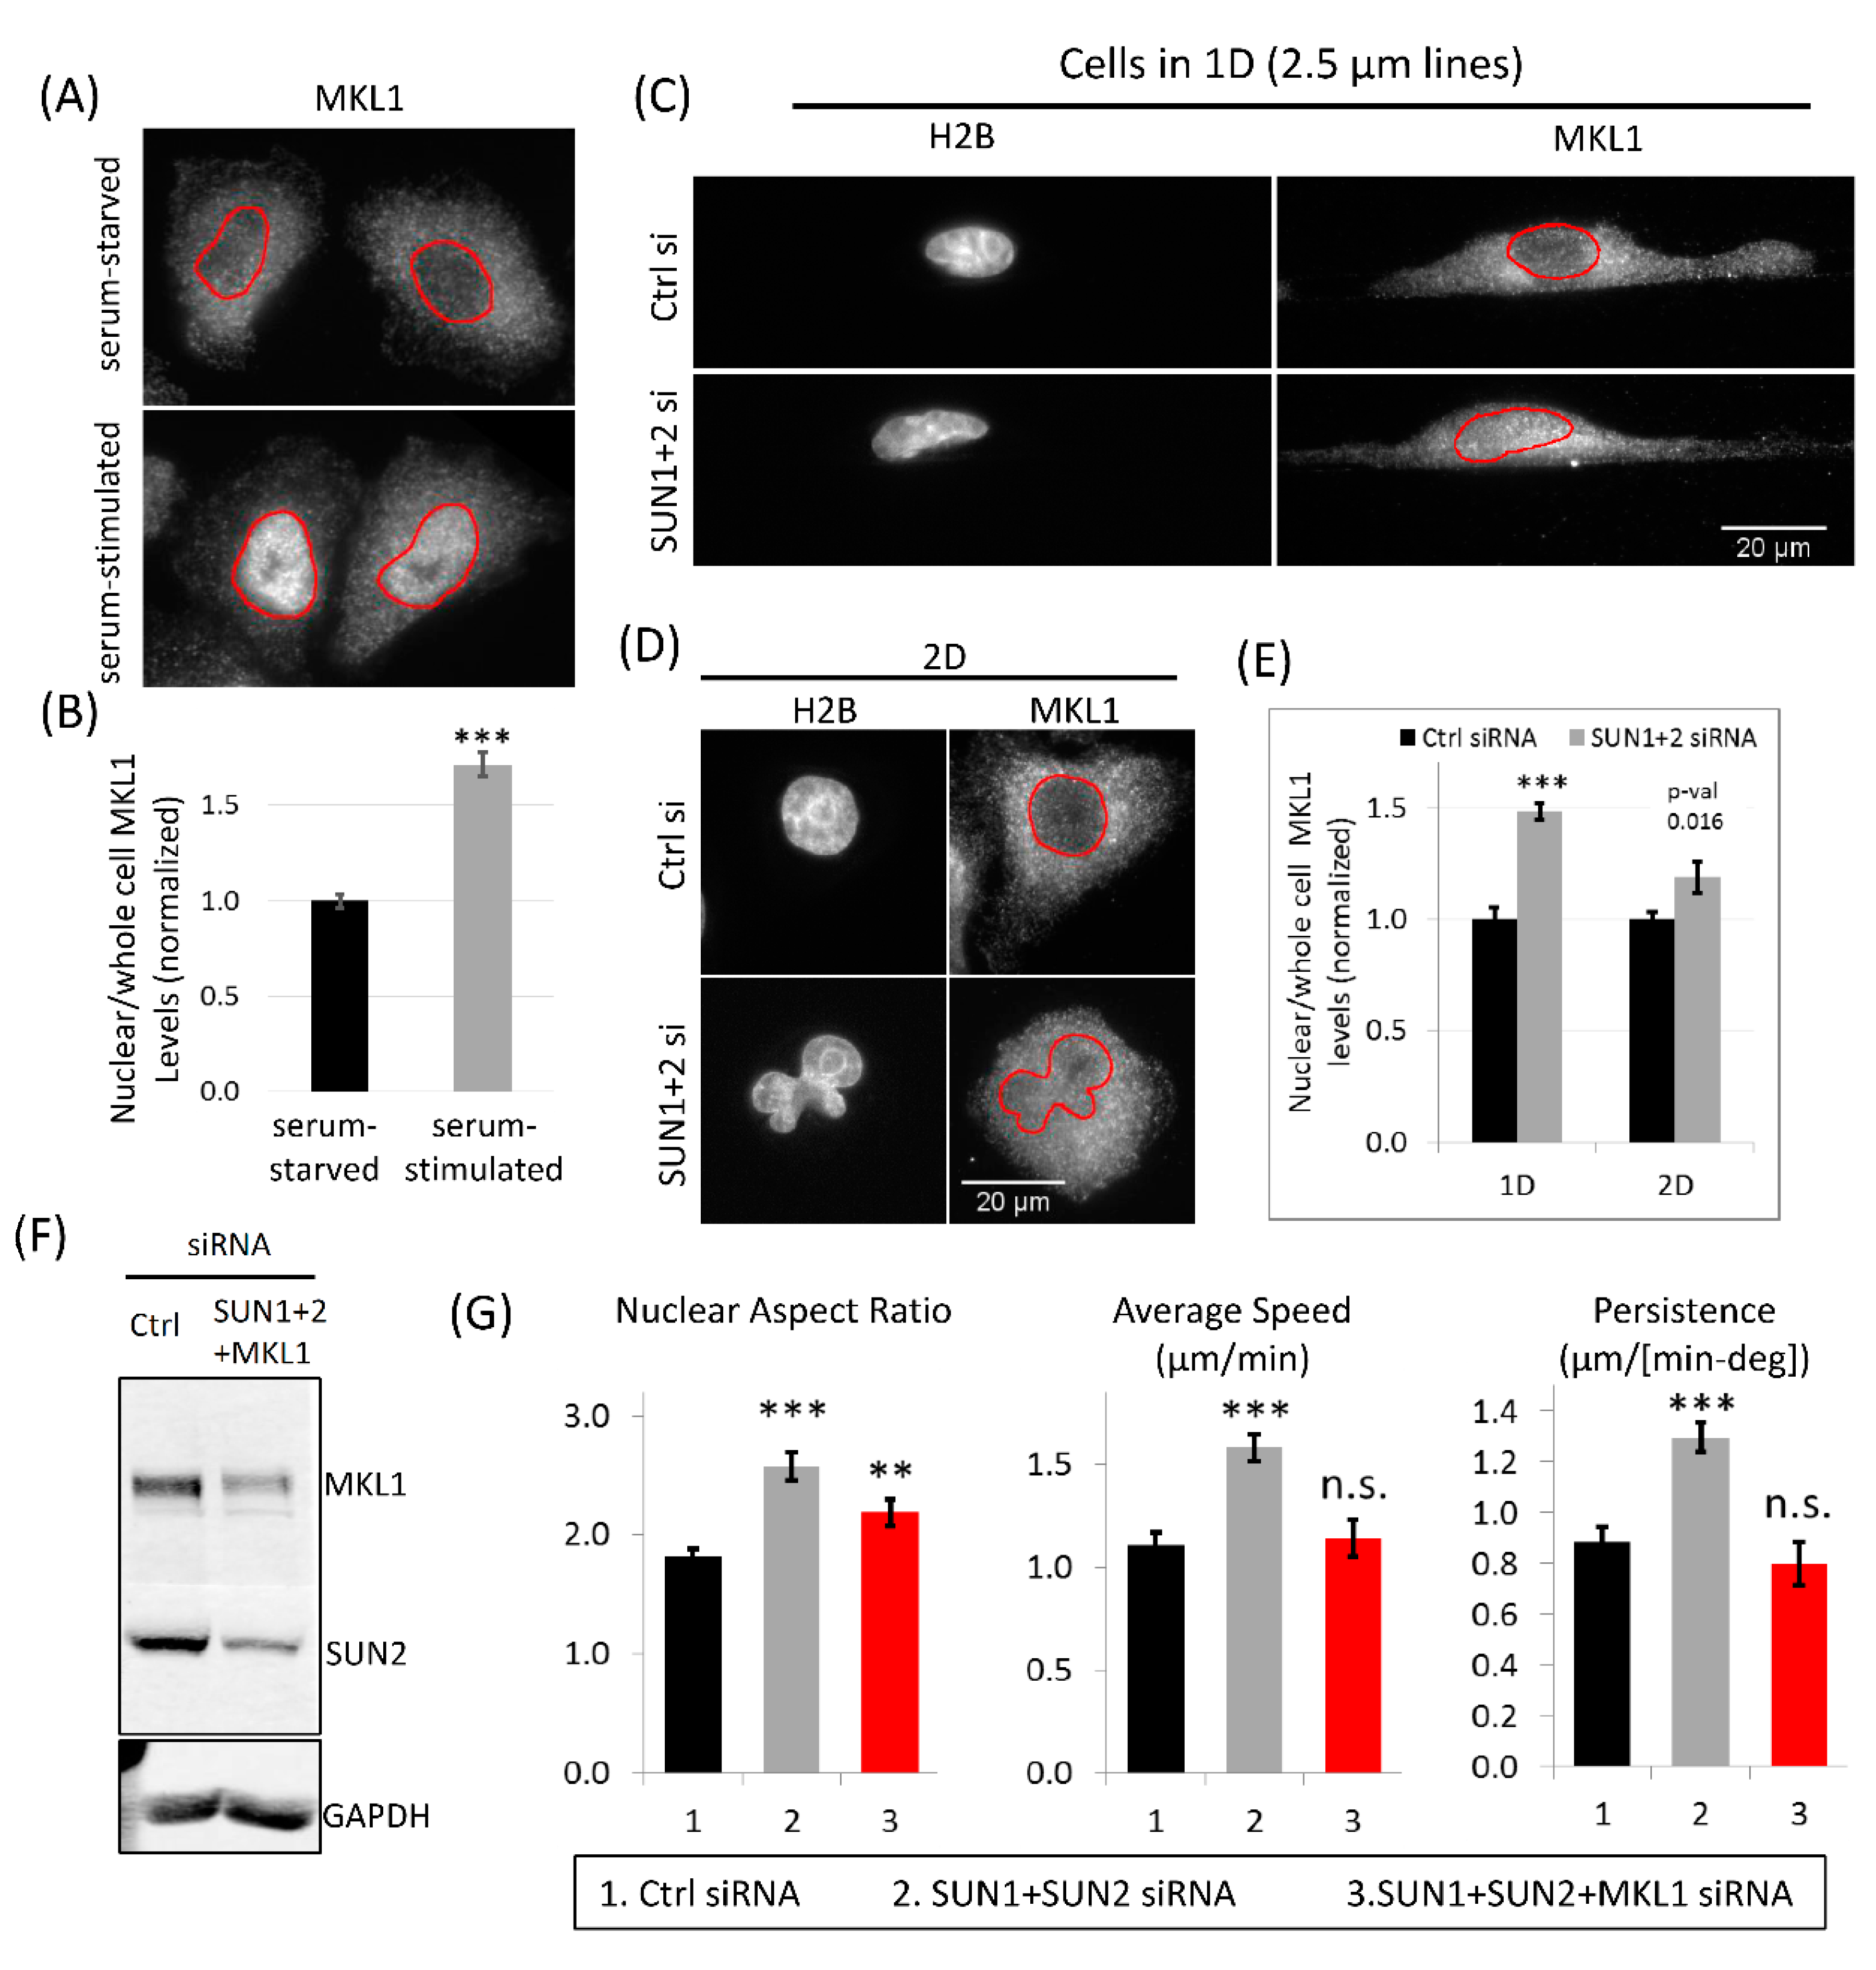
3.8. MKL1 Nuclear Translocation Regulates Increased Tumor Cell 1D Motility in SUN1 + 2 KD Cells
4. Discussion
4.1. Collagen Fiber Diameter Is a Key Regulator of Tumor Cell Motility In Vivo
4.2. Nuclear Shape Changes Are Linked to High-Speed Tumor Cell 1D Motility and Do Not Require ECM Pore Restriction
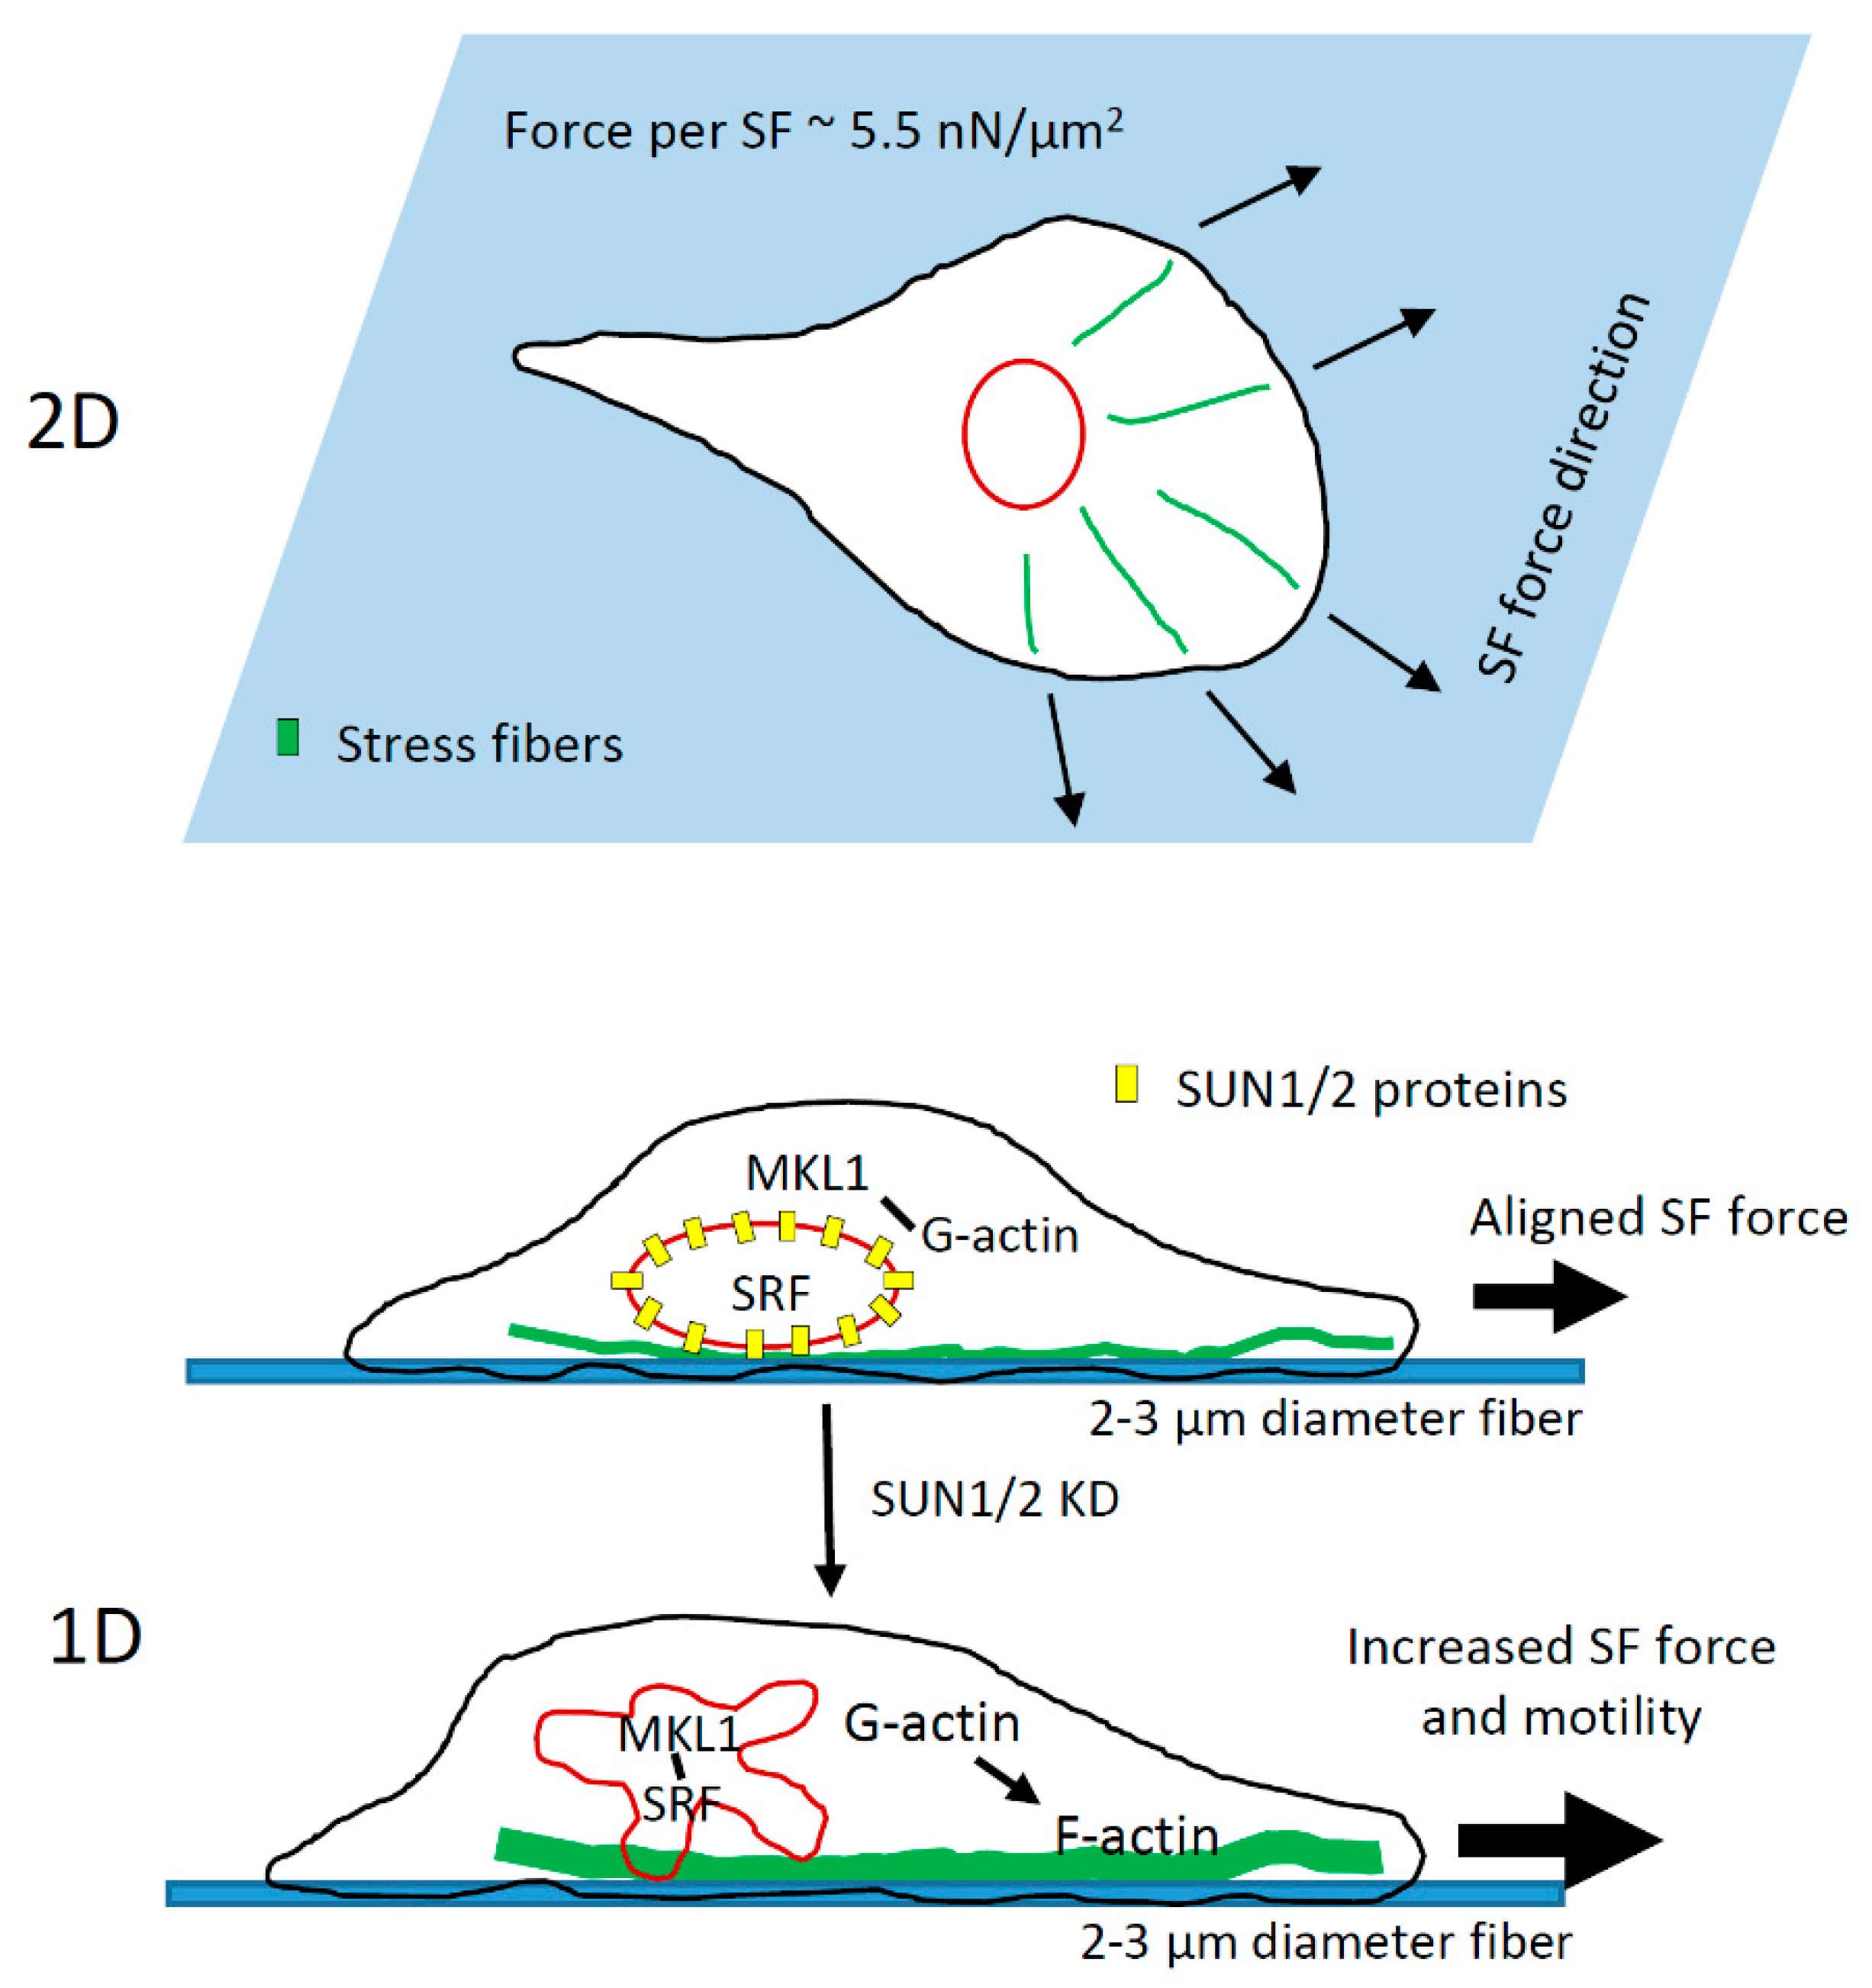
4.3. Role of LINC Complex and MKL1-Driven Gene Transcription in High-Speed Tumor Cell Motility in 1D
Supplementary Materials
Author Contributions
Funding
Institutional Review Board Statement
Informed Consent Statement
Acknowledgments
Conflicts of Interest
References
- Joyce, J.A.; Pollard, J.W. Microenvironmental regulation of metastasis. Nat. Rev. Cancer 2008, 9, 239–252. [Google Scholar] [CrossRef] [PubMed]
- Place, A.E.; Huh, S.J.; Polyak, K. The microenvironment in breast cancer progression: Biology and implications for treatment. Breast Cancer Res. 2011, 13, 1–11. [Google Scholar] [CrossRef] [PubMed]
- Robinson, B.D.; Sica, G.L.; Liu, Y.-F.; Rohan, T.E.; Gertler, F.B.; Condeelis, J.S.; Jones, J.G. Tumor Microenvironment of Metastasis in Human Breast Carcinoma: A Potential Prognostic Marker Linked to Hematogenous Dissemination. Clin. Cancer Res. 2009, 15, 2433–2441. [Google Scholar] [CrossRef] [PubMed]
- Roussos, E.T.; Condeelis, J.S.; Patsialou, A. Chemotaxis in cancer. Nat. Rev. Cancer 2011, 11, 573–587. [Google Scholar] [CrossRef] [PubMed]
- Sidani, M.; Wyckoff, J.; Xue, C.; Segall, J.E.; Condeelis, J. Probing the microenvironment of mammary tumors using mul-tiphoton microscopy. J. Mammary Gland Biol. Neoplasia 2006, 11, 151–163. [Google Scholar] [CrossRef]
- Balkwill, F.R.; Capasso, M.; Hagemann, T. The tumor microenvironment at a glance. J. Cell Sci. 2012, 125, 5591–5596. [Google Scholar] [CrossRef]
- Condeelis, J.; Pollard, J.W. Macrophages: Obligate Partners for Tumor Cell Migration, Invasion, and Metastasis. Cell 2006, 124, 263–266. [Google Scholar] [CrossRef]
- Quail, D.F.; Joyce, J.A. Microenvironmental regulation of tumor progression and metastasis. Nat. Med. 2013, 19, 1423–1437. [Google Scholar] [CrossRef] [PubMed]
- Alowami, S.; Troup, S.; Al-Haddad, S.; Kirkpatrick, I.; Watson, P.H. Mammographic density is related to stroma and stromal proteoglycan expression. Breast Cancer Res. 2003, 5, R129. [Google Scholar] [CrossRef] [PubMed]
- Guo, Y.P.; Martin, L.J.; Hanna, W.; Banerjee, D.; Miller, N.; Fishell, E.; Khokha, R.; Boyd, N.F. Growth factors and stromal matrix proteins associated with mammographic densities. Cancer Epidemiol. Biomark. Prev. 2001, 10, 11303594. [Google Scholar]
- Provenzano, P.P.; Eliceiri, K.W.; Campbell, J.M.; Inman, D.R.; White, J.G.; Keely, P.J. Collagen reorganization at the tu-mor-stromal interface facilitates local invasion. BMC Med. 2006, 4, 38. [Google Scholar] [CrossRef] [PubMed]
- Moreau, V.; Saltel, F. Type I collagen fibrils and discoidin domain receptor 1 set invadosomes straight. Mol. Cell. Oncol. 2015, 2, e1004963. [Google Scholar] [CrossRef] [PubMed]
- Provenzano, P.P.; Inman, D.R.; Eliceiri, K.W.; Knittel, J.G.; Yan, L.; Rueden, C.T.; White, J.G.; Keely, P.J. Collagen density promotes mammary tumor initiation and progression. BMC Med. 2008, 6, 11. [Google Scholar] [CrossRef]
- Ramaswamy, S.; Ross, K.N.; Lander, E.S.; Golub, T.R. A molecular signature of metastasis in primary solid tumors. Nat. Genet. 2002, 33, 49–54. [Google Scholar] [CrossRef] [PubMed]
- Conklin, M.W.; Eickhoff, J.; Riching, K.; Pehlke, C.; Eliceiri, K.; Provenzano, P.; Friedl, A.; Keely, P.J. Abstract A35: Aligned collagen is a prognostic signature for survival in human breast carcinoma. Tumor Microenviron. 2013, 178, 1221–1232. [Google Scholar] [CrossRef]
- Han, W.; Chen, S.; Yuan, W.; Fan, Q.; Tian, J.; Wang, X.; Chen, L.; Zhang, X.; Wei, W.; Liu, R.; et al. Oriented collagen fibers direct tumor cell intravasation. Proc. Natl. Acad. Sci. USA 2016, 113, 11208–11213. [Google Scholar] [CrossRef]
- Nelson, M.T.; Short, A.; Cole, S.L.; Gross, A.C.; Winter, J.; Eubank, T.D.; Lannutti, J.J. Preferential, enhanced breast cancer cell migration on biomimetic electrospun nanofiber ‘cell highways’. BMC Cancer 2014, 14, 825. [Google Scholar] [CrossRef]
- Oudin, M.; Jonas, O.H.; Kosciuk, T.; Broye, L.C.; Guido, B.C.; Wyckoff, J.; Riquelme, D.; Lamar, J.; Asokan, S.B.; Whittaker, C.A.; et al. Tumor Cell–Driven Extracellular Matrix Remodeling Drives Haptotaxis during Metastatic Progression. Cancer Discov. 2016, 6, 516–531. [Google Scholar] [CrossRef] [PubMed]
- Egeblad, M.; Rasch, M.G.; Weaver, V.M. Dynamic interplay between the collagen scaffold and tumor evolution. Curr. Opin. Cell Biol. 2010, 22, 697–706. [Google Scholar] [CrossRef] [PubMed]
- Levental, K.R.; Yu, H.; Kass, L.; Lakins, J.N.; Egeblad, M.; Erler, J.T.; Fong, S.F.; Csiszar, K.; Giaccia, A.; Weninger, W.; et al. Matrix Crosslinking Forces Tumor Progression by Enhancing Integrin Signaling. Cell 2009, 139, 891–906. [Google Scholar] [CrossRef]
- Park, C.C.; Rembert, J.; Chew, K.; Moore, D.; Kerlikowske, K. High Mammographic Breast Density Is Independent Predictor of Local But Not Distant Recurrence After Lumpectomy and Radiotherapy for Invasive Breast Cancer. Int. J. Radiat. Oncol. 2009, 73, 75–79. [Google Scholar] [CrossRef] [PubMed]
- Riching, K.M.; Cox, B.L.; Salick, M.R.; Pehlke, C.; Riching, A.S.; Ponik, S.; Bass, B.R.; Crone, W.C.; Jiang, Y.; Weaver, A.M.; et al. 3D Collagen Alignment Limits Protrusions to Enhance Breast Cancer Cell Persistence. Biophys. J. 2014, 107, 2546–2558. [Google Scholar] [CrossRef] [PubMed]
- Gligorijevic, B.; Bergman, A.; Condeelis, J. Multiparametric Classification Links Tumor Microenvironments with Tumor Cell Phenotype. PLoS Biol. 2014, 12, e1001995. [Google Scholar] [CrossRef] [PubMed]
- Condeelis, J.; Segall, J.E. Intravital imaging of cell movement in tumours. Nat. Rev. Cancer 2003, 3, 921–930. [Google Scholar] [CrossRef]
- Wang, W.; Wyckoff, J.B.; Frohlich, V.C.; Oleynikov, Y.; Hüttelmaier, S.; Zavadil, J.; Cermak, L.; Bottinger, E.P.; Singer, R.H.; White, J.G.; et al. Single cell behavior in metastatic primary mammary tumors correlated with gene expression patterns revealed by molecular profiling. Cancer Res. 2002, 62, 12414658. [Google Scholar]
- Wyckoff, J.B.; Wang, Y.; Lin, E.Y.; Li, J.-F.; Goswami, S.; Stanley, E.R.; Segall, J.E.; Pollard, J.W.; Condeelis, J. Direct Visualization of Macrophage-Assisted Tumor Cell Intravasation in Mammary Tumors. Cancer Res. 2007, 67, 2649–2656. [Google Scholar] [CrossRef] [PubMed]
- Xue, C.; Wyckoff, J.; Liang, F.; Sidani, M.; Violini, S.; Tsai, K.-L.; Zhang, Z.-Y.; Sahai, E.; Condeelis, J.; Segall, J.E. Epidermal Growth Factor Receptor Overexpression Results in Increased Tumor Cell Motility In vivo Coordinately with Enhanced Intravasation and Metastasis. Cancer Res. 2006, 66, 192–197. [Google Scholar] [CrossRef] [PubMed]
- Sharma, V.P.; Beaty, B.T.; Patsialou, A.; Liu, H.; Clarke, M.; Cox, D.; Condeelis, J.S.; Eddy, R.J. Reconstitution of in vivo macro-phage-tumor cell pairing and streaming motility on one-dimensional micro-patterned substrates. Intravital 2012, 1, 77–85. [Google Scholar] [CrossRef]
- Sharma, V.P.; Beaty, B.T.; Cox, D.; Condeelis, J.S.; Eddy, R.J. An In Vitro One-Dimensional Assay to Study Growth Factor-Regulated Tumor Cell–Macrophage Interaction. Methods Mol. Biol. 2014, 1172, 115–123. [Google Scholar] [CrossRef]
- Patsialou, A.; Bravo-Cordero, J.J.; Wang, Y.; Entenberg, D.; Liu, H.; Clarke, M.; Condeelis, J.S. Intravital multiphoton imaging reveals multicellular streaming as a crucial component of in vivo cell migration in human breast tumors. IntraVital 2013, 2, e25294. [Google Scholar] [CrossRef]
- Tong, Z.; Balzer, E.M.; Dallas, M.R.; Hung, W.-C.; Stebe, K.J.; Konstantopoulos, K. Chemotaxis of Cell Populations through Confined Spaces at Single-Cell Resolution. PLoS ONE 2012, 7, e29211. [Google Scholar] [CrossRef] [PubMed]
- Petrie, R.J.; Yamada, K.M. At the leading edge of three-dimensional cell migration. J. Cell Sci. 2012, 125, 5917–5926. [Google Scholar] [CrossRef] [PubMed]
- Friedl, P.; Wolf, K. Plasticity of cell migration: A multiscale tuning model. J. Cell Biol. 2009, 188, 11–19. [Google Scholar] [CrossRef] [PubMed]
- Lin, B.; Yin, T.; Wu, Y.I.; Inoue, T.; Levchenko, A. Interplay between chemotaxis and contact inhibition of locomotion de-termines exploratory cell migration. Nat. Commun. 2015, 6, 6619. [Google Scholar] [CrossRef] [PubMed]
- Martin, K.; Vilela, M.; Jeon, N.L.; Danuser, G.; Pertz, O. A growth factor-induced, spatially organizing cytoskeletal module enables rapid and persistent fibroblast migration. Dev. Cell 2014, 30, 701–716. [Google Scholar] [CrossRef]
- Paul, C.D.; Hung, W.-C.; Wirtz, D.; Konstantopoulos, K. Engineered Models of Confined Cell Migration. Annu. Rev. Biomed. Eng. 2016, 18, 159–180. [Google Scholar] [CrossRef] [PubMed]
- Sheets, K.; Wunsch, S.; Ng, C.; Nain, A.S. Shape-dependent cell migration and focal adhesion organization on suspended and aligned nanofiber scaffolds. Acta Biomater. 2013, 9, 7169–7177. [Google Scholar] [CrossRef]
- Doyle, A.D.; Wang, F.W.; Matsumoto, K.; Yamada, K.M. One-dimensional topography underlies three-dimensional fibrillar cell migration. J. Cell Biol. 2009, 184, 481–490. [Google Scholar] [CrossRef] [PubMed]
- Fraley, S.I.; Wu, P.-H.; He, L.; Feng, Y.; Krisnamurthy, R.; Longmore, G.D.; Wirtz, D. Three-dimensional matrix fiber alignment modulates cell migration and MT1-MMP utility by spatially and temporally directing protrusions. Sci. Rep. 2015, 5, 14580. [Google Scholar] [CrossRef] [PubMed]
- Morgan, C.; Pollard, J.W.; Stanley, E.R. Isolation and characterization of a cloned growth factor dependent macrophage cell line, BAC1.2F5. J. Cell. Physiol. 1987, 130, 420–427. [Google Scholar] [CrossRef]
- Lee, C.W.; Vitriol, E.; Shim, S.; Wise, A.L.; Velayutham, R.P.; Zheng, J.Q. Dynamic Localization of G-Actin during Membrane Protrusion in Neuronal Motility. Curr. Biol. 2013, 23, 1046–1056. [Google Scholar] [CrossRef]
- Harney, A.S.; Arwert, E.N.; Entenberg, D.; Wang, Y.; Guo, P.; Qian, B.Z.; Oktay, M.H.; Pollard, J.W.; Jones, J.G.; Condeelis, J.S. Real-Time Imaging Reveals Local, Transient Vascular Permeability, and Tumor Cell Intravasation Stimulated by TIE2hi Macro-phage-Derived VEGFA. Cancer Discov. 2015, 5, 932–943. [Google Scholar] [CrossRef]
- Entenberg, D.; Pastoriza, J.M.; Oktay, M.H.; Voiculescu, S.; Wang, Y.; Sosa, M.S.; Aguirre-Ghiso, J.; Condeelis, J. Time-lapsed, large-volume, high-resolution intravital imaging for tissue-wide analysis of single cell dynamics. Methods 2017, 128, 65–77. [Google Scholar] [CrossRef]
- Entenberg, D.; Wyckoff, J.; Gligorijevic, B.; Roussos, E.T.; Verkhusha, V.; Pollard, J.W.; Condeelis, J. Setup and use of a two-laser multiphoton microscope for multichannel intravital fluorescence imaging. Nat. Protoc. 2011, 6, 1500–1520. [Google Scholar] [CrossRef]
- Farina, K.L.; Wyckoff, J.B.; Rivera, J.; Lee, H.; Segall, J.E.; Condeelis, J.S.; Jones, J.G. Cell motility of tumor cells visualized in living intact primary tumors using green fluorescent protein. Cancer Res. 1998, 58, 9635573. [Google Scholar]
- Sharma, V.P.; Eddy, R.; Entenberg, D.; Kai, M.; Gertler, F.B.; Condeelis, J. Tks5 and SHIP2 Regulate Invadopodium Maturation, but Not Initiation, in Breast Carcinoma Cells. Curr. Biol. 2013, 23, 2079–2089. [Google Scholar] [CrossRef]
- Chandrashekar, D.S.; Bashel, B.; Balasubramanya, S.A.H.; Creighton, C.J.; Ponce-Rodriguez, I.; Chakravarthi, B.V.; Varambally, S. UALCAN: A Portal for Facilitating Tumor Subgroup Gene Expression and Survival Analyses. Neoplasia 2017, 19, 649–658. [Google Scholar] [CrossRef]
- Tang, Z.; Li, C.; Kang, B.; Gao, G.; Li, C.; Zhang, Z. GEPIA: A web server for cancer and normal gene expression profiling and interactive analyses. Nucleic Acids Res. 2017, 45, W98–W102. [Google Scholar] [CrossRef] [PubMed]
- Roussos, E.T.; Wang, Y.; Wyckoff, J.B.; Sellers, R.S.; Wang, W.; Li, J.; Pollard, J.W.; Gertler, F.B.; Condeelis, J.S. Mena deficiency delays tumor progression and decreases metastasis in polyoma middle-T transgenic mouse mammary tumors. Breast Cancer Res. 2010, 12, R101. [Google Scholar] [CrossRef]
- Roussos, E.T.; Balsamo, M.; Alford, S.K.; Wyckoff, J.B.; Gligorijevic, B.; Wang, Y.; Pozzuto, M.; Stobezki, R.; Goswami, S.; Segall, J.E.; et al. Mena invasive (MenaINV) promotes multicellular streaming motility and transendothelial migration in a mouse model of breast cancer. J. Cell Sci. 2011, 124, 2120–2131. [Google Scholar] [CrossRef] [PubMed]
- Friedl, P.; Wolf, K.; Lammerding, J. Nuclear mechanics during cell migration. Curr. Opin. Cell Biol. 2011, 23, 55–64. [Google Scholar] [CrossRef]
- Khatau, S.B.; Hale, C.M.; Stewart-Hutchinson, P.J.; Patel, M.S.; Stewart, C.L.; Searson, P.C.; Hodzic, D.; Wirtz, D. A perinuclear actin cap regulates nuclear shape. Proc. Natl. Acad. Sci. USA 2009, 106, 19017–19022. [Google Scholar] [CrossRef]
- Kim, D.-H.; Cho, S.; Wirtz, D. Tight coupling between nucleus and cell migration through the perinuclear actin cap. J. Cell Sci. 2014, 127, 2528–2541. [Google Scholar] [CrossRef]
- Skau, C.T.; Fischer, R.S.; Gurel, P.; Thiam, H.R.; Tubbs, A.; Baird, M.A.; Davidson, M.W.; Piel, M.; Alushin, G.M.; Nussenzweig, A.; et al. Retraction Notice to: FMN2 Makes Perinuclear Actin to Protect Nuclei during Confined Migration and Promote Metastasis. Cell 2018, 173, 529. [Google Scholar] [CrossRef]
- Denais, C.; Lammerding, J. Nuclear Mechanics in Cancer. Adv. Exp. Med. Biol. 2014, 773, 435–470. [Google Scholar] [CrossRef] [PubMed]
- Lombardi, M.L.; Jaalouk, D.E.; Shanahan, C.; Burke, B.; Roux, K.J.; Lammerding, J. The Interaction between Nesprins and Sun Proteins at the Nuclear Envelope Is Critical for Force Transmission between the Nucleus and Cytoskeleton. J. Biol. Chem. 2011, 286, 26743–26753. [Google Scholar] [CrossRef]
- King, S.J.; Nowak, K.; Suryavanshi, N.; Holt, I.; Shanahan, C.M.; Ridley, A.J. Nesprin-1 and nesprin-2 regulate endothelial cell shape and migration. Cytoskeleton 2014, 71, 423–434. [Google Scholar] [CrossRef] [PubMed]
- Chancellor, T.; Lee, J.; Thodeti, C.K.; Lele, T. Actomyosin Tension Exerted on the Nucleus through Nesprin-1 Connections Influences Endothelial Cell Adhesion, Migration, and Cyclic Strain-Induced Reorientation. Biophys. J. 2010, 99, 115–123. [Google Scholar] [CrossRef]
- Padmakumar, V.; Libotte, T.; Lu, W.; Zaim, H.; Abraham, S.; Noegel, A.A.; Gotzmann, J.; Foisner, R.; Karakesisoglou, I. The inner nuclear membrane protein Sun1 mediates the anchorage of Nesprin-2 to the nuclear envelope. J. Cell Sci. 2005, 118, 3419–3430. [Google Scholar] [CrossRef] [PubMed]
- Crisp, M.; Liu, Q.; Roux, K.J.; Rattner, J.B.; Shanahan, C.; Burke, B.; Stahl, P.D.; Hodzic, D. Coupling of the nucleus and cytoplasm: Role of the LINC complex. J. Cell Biol. 2005, 172, 41–53. [Google Scholar] [CrossRef]
- Kirby, T.J.; Lammerding, J. Emerging views of the nucleus as a cellular mechanosensor. Nat. Cell Biol. 2018, 20, 373–381. [Google Scholar] [CrossRef]
- Dahl, K.N.; Ribeiro, A.J.; Lammerding, J. Nuclear Shape, Mechanics, and Mechanotransduction. Circ. Res. 2008, 102, 1307–1318. [Google Scholar] [CrossRef] [PubMed]
- Matsumoto, A.; Hieda, M.; Yokoyama, Y.; Nishioka, Y.; Yoshidome, K.; Tsujimoto, M.; Matsuura, N. Global loss of a nuclear lamina component, lamin A/C, and LINC complex components SUN 1, SUN 2, and nesprin-2 in breast cancer. Cancer Med. 2015, 4, 1547–1557. [Google Scholar] [CrossRef]
- Olson, E.N.; Nordheim, A. Linking actin dynamics and gene transcription to drive cellular motile functions. Nat. Rev. Mol. Cell Biol. 2010, 11, 353–365. [Google Scholar] [CrossRef] [PubMed]
- Finch-Edmondson, M.; Sudol, M. Framework to function: Mechanosensitive regulators of gene transcription. Cell. Mol. Biol. Lett. 2016, 21, 28. [Google Scholar] [CrossRef] [PubMed]
- Vartiainen, M.K.; Guettler, S.; Larijani, B.; Treisman, R. Nuclear Actin Regulates Dynamic Subcellular Localization and Activity of the SRF Cofactor MAL. Science 2007, 316, 1749–1752. [Google Scholar] [CrossRef]
- Lu, P.; Takai, K.; Weaver, V.M.; Werb, Z. Extracellular Matrix Degradation and Remodeling in Development and Disease. Cold Spring Harb. Perspect. Biol. 2011, 3, a005058. [Google Scholar] [CrossRef]
- Burridge, K.; Wittchen, E.S. The tension mounts: Stress fibers as force-generating mechanotransducers. J. Cell Biol. 2013, 200, 9–19. [Google Scholar] [CrossRef]
- Balaban, N.Q.; Schwarz, U.; Riveline, D.; Goichberg, P.; Tzur, G.; Sabanay, I.; Mahalu, D.; Safran, S.; Bershadsky, A.; Addadiand, L.; et al. Force and focal adhesion assembly: A close relationship studied using elastic micropatterned substrates. Nat. Cell Biol. 2001, 3, 466–472. [Google Scholar] [CrossRef]
- Hall, G.; Liang, W.; Li, X. Fitting-free algorithm for efficient quantification of collagen fiber alignment in SHG imaging applications. Biomed. Opt. Express 2017, 8, 4609–4620. [Google Scholar] [CrossRef]
- Kakkad, S.; Solaiyappan, M.; Argani, P.; Sukumar, S.; Jacobs, L.K.; Leibfritz, D.; Bhujwalla, Z.M.; Glunde, K. Collagen I fiber density increases in lymph node positive breast cancers: Pilot study. J. Biomed. Opt. 2012, 17, 116017. [Google Scholar] [CrossRef] [PubMed]
- Kakkad, S.; Solaiyappan, M.; O’Rourke, B.; Stasinopoulos, I.; Ackerstaff, E.; Raman, V.; Bhujwalla, Z.M.; Glunde, K. Hypoxic Tumor Microenvironments Reduce Collagen I Fiber Density. Neoplasia 2010, 12, 608–617. [Google Scholar] [CrossRef]
- Hulmes, D. Building Collagen Molecules, Fibrils, and Suprafibrillar Structures. J. Struct. Biol. 2002, 137, 2–10. [Google Scholar] [CrossRef] [PubMed]
- Parry, D.A.D.; Barnes, G.R.G.; Craig, A.S. A comparison of the size distribution of collagen fibrils in connective tissues as a function of age and a possible relation between fibril size distribution and mechanical properties. Proc. R. Soc. London Ser. B Boil. Sci. 1978, 203, 305–321. [Google Scholar] [CrossRef]
- Yevick, H.G.; Duclos, G.; Bonnet, I.; Silberzan, P. Architecture and migration of an epithelium on a cylindrical wire. Proc. Natl. Acad. Sci. USA 2015, 112, 5944–5949. [Google Scholar] [CrossRef]
- Meehan, S.; Nain, A.S. Role of Suspended Fiber Structural Stiffness and Curvature on Single-Cell Migration, Nucleus Shape, and Focal-Adhesion-Cluster Length. Biophys. J. 2014, 107, 2604–2611. [Google Scholar] [CrossRef] [PubMed]
- Qin, S.; Ricotta, V.; Simon, M.; Clark, R.A.F.; Rafailovich, M.H. Continual Cell Deformation Induced via Attachment to Oriented Fibers Enhances Fibroblast Cell Migration. PLoS ONE 2015, 10, e0119094. [Google Scholar] [CrossRef]
- Versaevel, M.; Grevesse, T.; Gabriele, S. Spatial coordination between cell and nuclear shape within micropatterned endothelial cells. Nat. Commun. 2012, 3, 671. [Google Scholar] [CrossRef]
- Wolf, K.; Lindert, M.T.; Krause, M.; Alexander, S.; Riet, J.T.; Willis, A.L.; Hoffman, R.M.; Figdor, C.; Weiss, S.J.; Friedl, P. Physical limits of cell migration: Control by ECM space and nuclear deformation and tuning by proteolysis and traction force. J. Cell Biol. 2013, 201, 1069–1084. [Google Scholar] [CrossRef]
- Thomas, D.G.; Yenepalli, A.; Denais, C.M.; Rape, A.; Beach, J.R.; Wang, Y.L.; Schiemann, W.P.; Baskaran, H.; Lammerding, J.; Egelhoff, T.T. Non-muscle myosin IIB is critical for nuclear translocation during 3D invasion. J. Cell Biol. 2015, 210, 583–594. [Google Scholar] [CrossRef] [PubMed]
- Davidson, P.M.; Denais, C.; Bakshi, M.C.; Lammerding, J. Nuclear Deformability Constitutes a Rate-Limiting Step During Cell Migration in 3-D Environments. Cell. Mol. Bioeng. 2014, 7, 293–306. [Google Scholar] [CrossRef]
- Krause, M.; Yang, F.W.; Te Lindert, M.; Isermann, P.; Schepens, J.; Maas, R.J.A.; Venkataraman, C.; Lammerding, J.; Madzvamuse, A.; Hendriks, W.; et al. Cell migration through three-dimensional confining pores: Speed accelerations by deformation and recoil of the nucleus. Philos. Trans. R. Soc. Lond. B Biol. Sci. 2019, 374, 20180225. [Google Scholar] [CrossRef] [PubMed]
- Yamauchi, K.; Yang, M.; Jiang, P.; Yamamoto, N.; Xu, M.; Amoh, Y.; Tsuji, K.; Bouvet, M.; Tsuchiya, H.; Tomita, K.; et al. Real-time In vivo Dual-color Imaging of Intracapillary Cancer Cell and Nucleus Deformation and Migration. Cancer Res. 2005, 65, 4246–4252. [Google Scholar] [CrossRef]
- Jain, N.; Iyer, K.V.; Kumar, A.; Shivashankar, G.V. Cell geometric constraints induce modular gene-expression patterns via redistribution of HDAC3 regulated by actomyosin contractility. Proc. Natl. Acad. Sci. USA 2013, 110, 11349–11354. [Google Scholar] [CrossRef]
- Harada, T.; Swift, J.; Irianto, J.; Shin, J.-W.; Spinler, K.R.; Athirasala, A.; Diegmiller, R.; Dingal, P.D.P.; Ivanovska, I.L.; Discher, D.E. Nuclear lamin stiffness is a barrier to 3D migration, but softness can limit survival. J. Cell Biol. 2014, 204, 669–682. [Google Scholar] [CrossRef]
- Swaminathan, V.; Mythreye, K.; O’Brien, E.T.; Berchuck, A.; Blobe, G.C.; Superfine, R. Mechanical Stiffness Grades Metastatic Potential in Patient Tumor Cells and in Cancer Cell Lines. Cancer Res. 2011, 71, 5075–5080. [Google Scholar] [CrossRef]
- Suresh, S. Nanomedicine: Elastic clues in cancer detection. Nat. Nanotechnol. 2007, 2, 748–749. [Google Scholar] [CrossRef] [PubMed]
- Guck, J.; Schinkinger, S.; Lincoln, B.; Wottawah, F.; Ebert, S.; Romeyke, M.; Lenz, D.; Erickson, H.M.; Ananthakrishnan, R.; Mitchell, D.; et al. Optical deformability as an inherent cell marker for testing malignant transformation and met-astatic competence. Biophys. J. 2005, 88, 3689–3698. [Google Scholar] [CrossRef] [PubMed]
- Cross, S.E.; Jin, Y.-S.; Rao, J.; Gimzewski, J.K. Nanomechanical analysis of cells from cancer patients. Nat. Nanotechnol. 2007, 2, 780–783. [Google Scholar] [CrossRef]
- Lee, M.H.; Wu, P.H.; Staunton, J.R.; Ros, R.; Longmore, G.D.; Wirtz, D. Mismatch in mechanical and adhesive properties induces pulsating cancer cell migration in epithelial monolayer. Biophys. J. 2012, 102, 2731–2741. [Google Scholar] [CrossRef]
- Zwerger, M.; Ho, C.Y.; Lammerding, J. Nuclear mechanics in disease. Annu. Rev. Biomed. Eng. 2011, 13, 397–428. [Google Scholar] [CrossRef] [PubMed]
- Zink, D.; Fischer, A.H.; Nickerson, J.A. Nuclear structure in cancer cells. Nat. Rev. Cancer 2004, 4, 677–687. [Google Scholar] [CrossRef]
- Lammerding, J.; Fong, L.G.; Ji, J.Y.; Reue, K.; Stewart, C.L.; Young, S.; Lee, R.T. Lamins A and C but Not Lamin B1 Regulate Nuclear Mechanics. J. Biol. Chem. 2006, 281, 25768–25780. [Google Scholar] [CrossRef]
- Neelam, S.; Chancellor, T.J.; Li, Y.; Nickerson, J.A.; Roux, K.J.; Dickinson, R.B.; Lele, T.P. Direct force probe reveals the mechanics of nuclear homeostasis in the mammalian cell. Proc. Natl. Acad. Sci. USA 2015, 112, 5720–5725. [Google Scholar] [CrossRef] [PubMed]
- Gau, D.; Roy, P. SRF’ing and SAP’ing—The role of MRTF proteins in cell migration. J. Cell Sci. 2018, 131. [Google Scholar] [CrossRef]
- Sprenkeler, E.G.G.; Henriet, S.S.V.; Tool, A.T.J.; Kreft, I.C.; Van Der Bijl, I.; Aarts, C.C.; Van Houdt, M.; Verkuijlen, P.J.J.H.; Van Aerde, K.; Jaspers, G.; et al. MKL1 deficiency results in a severe neutrophil motility defect due to impaired actin polymerization. Blood 2020, 135, 2171–2181. [Google Scholar] [CrossRef] [PubMed]
- Medjkane, S.; Perez-Sanchez, C.; Gaggioli, C.; Sahai, E.; Treisman, R. Myocardin-related transcription factors and SRF are required for cytoskeletal dynamics and experimental metastasis. Nat. Cell Biol. 2009, 11, 257–268. [Google Scholar] [CrossRef] [PubMed]


Publisher’s Note: MDPI stays neutral with regard to jurisdictional claims in published maps and institutional affiliations. |
© 2021 by the authors. Licensee MDPI, Basel, Switzerland. This article is an open access article distributed under the terms and conditions of the Creative Commons Attribution (CC BY) license (https://creativecommons.org/licenses/by/4.0/).
Share and Cite
Sharma, V.P.; Williams, J.; Leung, E.; Sanders, J.; Eddy, R.; Castracane, J.; Oktay, M.H.; Entenberg, D.; Condeelis, J.S. SUN-MKL1 Crosstalk Regulates Nuclear Deformation and Fast Motility of Breast Carcinoma Cells in Fibrillar ECM Microenvironment. Cells 2021, 10, 1549. https://doi.org/10.3390/cells10061549
Sharma VP, Williams J, Leung E, Sanders J, Eddy R, Castracane J, Oktay MH, Entenberg D, Condeelis JS. SUN-MKL1 Crosstalk Regulates Nuclear Deformation and Fast Motility of Breast Carcinoma Cells in Fibrillar ECM Microenvironment. Cells. 2021; 10(6):1549. https://doi.org/10.3390/cells10061549
Chicago/Turabian StyleSharma, Ved P., James Williams, Edison Leung, Joe Sanders, Robert Eddy, James Castracane, Maja H. Oktay, David Entenberg, and John S. Condeelis. 2021. "SUN-MKL1 Crosstalk Regulates Nuclear Deformation and Fast Motility of Breast Carcinoma Cells in Fibrillar ECM Microenvironment" Cells 10, no. 6: 1549. https://doi.org/10.3390/cells10061549
APA StyleSharma, V. P., Williams, J., Leung, E., Sanders, J., Eddy, R., Castracane, J., Oktay, M. H., Entenberg, D., & Condeelis, J. S. (2021). SUN-MKL1 Crosstalk Regulates Nuclear Deformation and Fast Motility of Breast Carcinoma Cells in Fibrillar ECM Microenvironment. Cells, 10(6), 1549. https://doi.org/10.3390/cells10061549