Article

Allotetraploidization in Brachypodium May Have Led to the Dominance of One Parent’s Metabolome in Germinating Seeds

1
Plant Cytogenetics and Molecular Biology Group, Institute of Biology, Biotechnology and Environmental Protection, Faculty of Natural Sciences, University of Silesia in Katowice, 40-032 Katowice, Poland
2
Institute of Biological, Environmental and Rural Sciences, Aberystwyth University, Edward Llwyd Building, Aberystwyth SY23 3DA, UK
3
National Plant Phenomics Centre, Institute of Biological, Environmental and Rural Sciences (IBERS), Aberystwyth University, Aberystwyth SY23 3EE, UK
4
College of Agronomy, Shanxi Agricultural University, Taiyuan 030801, China
*
Authors to whom correspondence should be addressed.
All the authors have equally contributed to this work.
Cells 2021, 10(4), 828; https://doi.org/10.3390/cells10040828
Submission received: 28 February 2021 / Revised: 1 April 2021 / Accepted: 2 April 2021 / Published: 7 April 2021
(This article belongs to the Special Issue Metabolomics in Plant Research)

Abstract

:
Seed germination is a complex process during which a mature seed resumes metabolic activity to prepare for seedling growth. In this study, we performed a comparative metabolomic analysis of the embryo and endosperm using the community standard lines of three annual Brachypodium species, i.e., B. distachyon (Bd) and B. stacei (Bs) and their natural allotetraploid B. hybridum (BdBs) that has wider ecological range than the other two species. We explored how far the metabolomic impact of allotetraploidization would be observable as over-lapping changes at 4, 12, and 24 h after imbibition (HAI) with water when germination was initiated. Metabolic changes during germination were more prominent in Brachypodium embryos than in the endosperm. The embryo and endosperm metabolomes of Bs and BdBs were similar, and those of Bd were distinctive. The Bs and BdBs embryos showed increased levels of sugars and the tricarboxylic acid cycle compared to Bd, which could have been indicative of better nutrient mobilization from the endosperm. Bs and BdBs also showed higher oxalate levels that could aid nutrient transfer through altered cellular events. In Brachypodium endosperm, the thick cell wall, in addition to starch, has been suggested to be a source of nutrients to the embryo. Metabolites indicative of sugar metabolism in the endosperm of all three species were not prominent, suggesting that mobilization mostly occurred prior to 4 HAI. Hydroxycinnamic and monolignol changes in Bs and BdBs were consistent with cell wall remodeling that arose following the release of nutrients to the respective embryos. Amino acid changes in both the embryo and endosperm were broadly consistent across the species. Taking our data together, the formation of BdBs may have maintained much of the Bs metabolome in both the embryo and endosperm during the early stages of germination. In the embryo, this conserved Bs metabolome appeared to include an elevated sugar metabolism that played a vital role in germination. If these observations are confirmed in the future with more Brachypodium accessions, it would substantiate the dominance of the Bs metabolome in BdBs allotetraploidization and the use of metabolomics to suggest important adaptive changes.

1. Introduction

Polyploidy is an often observed phenomenon in eukaryotes, resulting in important ecological and evolutionary processes. Many plant lineages show evidence of palaeopolyploidization in their genomes. Polyploid plants usually have larger cell sizes and faster growth, which is very significant from an evolutionary standpoint [1,2]. Polyploidization leads to a series of genomic, metabolomic, cellular, and physiological changes. Arabidopsis thaliana autotetraploids have shown different metabolic profiles, indicating that polyploidization affects metabolite accumulation [3]. Similarly, polyploidization in Hylocereus and Citrus species induced changes in metabolite accumulation patterns [4,5,6]. Thus, polyploidization is a major force in the evolution of both wild and cultivated plants for its ability to confer high environmental adaptability [7].
Brachypodium is one of the most studied genera of monocotyledonous plants, mainly due to Brachypodium distachyon being a model organism for temperate cereals and other economically important grasses [8,9,10,11,12,13,14]. B. distachyon has been used to investigate various aspects of grass biology [15], including cell wall composition [16,17,18,19], host–pathogen interactions [20,21], responses to abiotic stress [22,23,24], the regulation of seed dormancy [25], and seed to seedling transition [26,27]. The genus consists of ~20 species that are distributed worldwide. Two of the diploid annual species, B. distachyon (Bd) and Brachypodium stacei (Bs) have hybridized to produce an allotetraploid, Brachypodium hybridum (BdBs) [28]. BdBs has been proposed as a model system to study polyploidization and grass speciation [29]. It is more widely distributed compared to its progenitors, especially Bs, and tends to have a greater number of seeds per inflorescence and 1000 grain weights. Therefore, allotetraploidization seems to have led to the formation of a species with increased fitness across a range of ecological niches [30,31].
Seed germination is a fundamental step for development, and is accompanied by substantial physiological and biochemical changes that lead to morphological events. Germination is controlled by multiple environmental cues such as light and moisture, and various endogenous factors, including phytohormones. Germination begins with the uptake of water and can be sub-divided into three phases: phase I, where the seed rapidly imbibes water, phase II sees the activation of metabolism, and in phase III, changes occur that lead to hypocotyl emergence [8]. Crucial physiological and biochemical processes such as the hydrolysis of storage compounds, protein biosynthesis, respiration, and cell elongation are activated in the phase II. These metabolic changes are associated with the catabolism of seed storage products into simpler chemical forms, such as sugars and amino acids, that are needed for protein synthesis and bioenergy in the growing seedling [8,9]. Distinct and time-dependent alternations in metabolism have been described for germinating seeds in cereals such as rice [10] and wheat [11], as well as in A. thaliana [12]. In the first hour of imbibition, rapid changes in metabolism, including increases in hexose phosphates and tricarboxylic acid cycle intermediates, occur. This phase is also typified by significant reductions in the majority of different metabolites that had previously accumulated during seed desiccation. For example, proteins are degraded by proteases into amino acids during germination [13]. These primary metabolites are rapidly consumed to support a metabolic switch towards biosynthetic processes that are needed for early germination. Later changes in the metabolome during germination include an increase in levels of compounds such as amino acids, sugars, and organic acids to feed hypocotyl growth [12,14].
Brachypodium species represent a good model system to assess the possible effects of polyploidization on the germinating seed metabolome. Previous metabolic studies on Brachypodium species have focused on different growth stages and different stress conditions, particularly drought [22,32,33] and the genotypic variation for seed metabolite levels [34]. Our initial characterization of a Bd allowed comparison with what is known in wheat [35]. This comparison suggested important differences in the extent of endosperm development. Although similar, key grain development marker genes (histone H4, C13 endopeptidase, pyruvate orthophosphate dikinase (PPDK), α-galactosidase, and globulins 1 and 2) are expressed in both wheat and Bd, their timing appeared to be different [35]. Striking morphological differences include smaller numbers and sizes of starch grains in Bd compared to wheat while endosperm cell walls were approximately twice as thick in Bd as in wheat [35,36]. Additionally, the Bd cell walls become less well-stained by calcofluor white during germination, suggesting a loss of 1-3 β and 1-4 β linked polysaccharides. Thus, the cell wall could be a source of sugars during germination. However, infrared fluorescence imaging suggested that the Bd cell wall was relatively deficient in β-glucans but potentially enriched in hemicelluloses [36].
To provide information on the metabolite profiles during seed germination in Brachypodium, we employed flow-infusion high-resolution electrospray mass spectroscopy (FIE–HRMS) to describe the metabolomes of the embryo and endosperm over a 24-h period over imbibition. We tested the hypothesis that the allotetraploidization process may have led to overlapping metabolomes in the three Brachypodium annuals (Bd, Bs, and BdBs). However, our data indicated that the Bs but not the Bd metabolome had considerable similarities with that of BdBs during germination. Further, these Bs/BdBs overlapping metabolomes indicated elevated sugar metabolism that could represent a source of increased fitness during the germination process.

2. Materials and Methods

2.1. Plant Material and Seed Germination

Seeds of B. distachyon Bd21 (Bd), B. stacei ABR114 (Bs) and B. hybridum ABR113 (BdBs) were obtained from the US Department of Agriculture, National Plant Germplasm System and the Institute of Biological, Environmental and Rural Sciences, Aberystwyth University, UK. The lemma was removed from the seeds to exclude its impact on the germination rate. The general features of the seeds from the different species are shown in Figure 1.
Approximately 500 grains of each Brachypodium species were placed on three layers of filter paper that had been soaked with distilled water in Petri dishes and germinated at 22–24 °C in the dark. The grains were collected at 4, 12, and 24 h after imbibition (HAI) with five biological replicates. The embryos were isolated, separated from the endosperm, and frozen in the liquid nitrogen.

2.2. Sample Preparation and Metabolite Extraction

For metabolomic analyses, frozen embryos and endosperm were extracted using a single-phase extraction solution (chloroform/methanol/water, 1/2.5/1, v/v/v). The collected samples (40 mg each) of frozen embryos and endosperm were homogenized and mixed with 1 mL of extraction solution for 20 min at 4 °C. Samples were centrifuged for 30 min at 4 °C, and the supernatant was transferred to new tubes, from which 200 μL were taken for further analyses. Metabolite fingerprinting was performed using flow-infusion high-resolution electrospray mass spectroscopy (FIE–HRMS) using a Q Exactive Plus mass analyzer instrument with a Dionex U300 Ultra High Performance Liquid Chromatography (UHPLC) system (Thermo Fisher Scientific, Bremen, Germany). Mass-ions (m/z) were generated in positive and negative ionization modes in a single run, as described by Baptista et al. [37]. The data are provided in Supplementary Materials Table S1.

2.3. Metabolomic Data Analysis

Multivariate analyses were performed with MetaboAnalyst (https://www.metaboanalyst.ca/, accessed on 28 February 2021). Differences in the metabolomic profiles of samples were analyzed with unsupervised principal component analysis (PCA) and supervised partial least squares-discriminant analysis (PLS-DA). The significance of the cross-validated p-values were based on one-way ANOVA with Bonferroni correction for false discovery rates (FDR). Multiple comparison and post hoc analyses used Tukey’s honestly significant difference (Tukey’s HSD). The relative contributions of experimental variations (“effects estimates”—in this case, genotype and time) to the total variation used ANOVA–simultaneous component analysis (ASCA), a form of multivariate ANOVA. For each m/z, annotation was made using a 5 ppm tolerance on their accurate mass. Metabolomic annotation was made using DIMEdb (https://dimedb.ibers.aber.ac.uk, accessed on 28 February 2021). Identification was based on the MS peaks to pathway algorithm [37] (tolerance = 5 ppm, reference library; Oryza sativa). This involved metabolites being annotated using the Kyoto Encyclopedia of Genes and Genomes (KEGG) database, considering the following possible adducts: [M+]+, [M+H]+, [M+NH4]+, [M+Na]+, [M+K]+, [M-NH2+H]+, [M-CO2H+H]+, [M-H2O+H]+; [M−], [M−H], [M+Na−2H], [M+Cl], and [M+K−2H]. Correlations between multiple adducts of a metabolite were used in the identification process.
Metabolite Set Enrichment Analysis (MSEA) and pathway analysis were performed to identify biologically meaningful patterns in the metabolome data using the R-based MetaboAnalyst platform [38]. For pathway analysis algorithms, the Fisher’s exact test was used with a KEGG pathway library for Oryza sativa as a model reference. These analyses considered the number of detected metabolites in individual pathways and any alternations between samples and model reference. Pathway significance was based on whether metabolites from a given sample were overrepresented in a given metabolite set, while pathway impact reflected the role of a given metabolite in particular pathway.

3. Results

3.1. Metabolic Profiling of the Embryo and Endosperm

We performed the metabolic profiling of the embryo and endosperm in Bd, Bs, and BdBs after 4, 12, and 24 HAI. PCA indicated that the major sources of variation were linked to organ type, with separation between embryo and endosperm seen across principal component (PC) 1 (Figure 2). The variation between the embryo samples was higher than that between endosperm samples, as indicated by the extent of variation across PC 2, but species-specific differences were not readily identifiable.

3.2. Assessments of Embryo and Endosperm Metabolomes

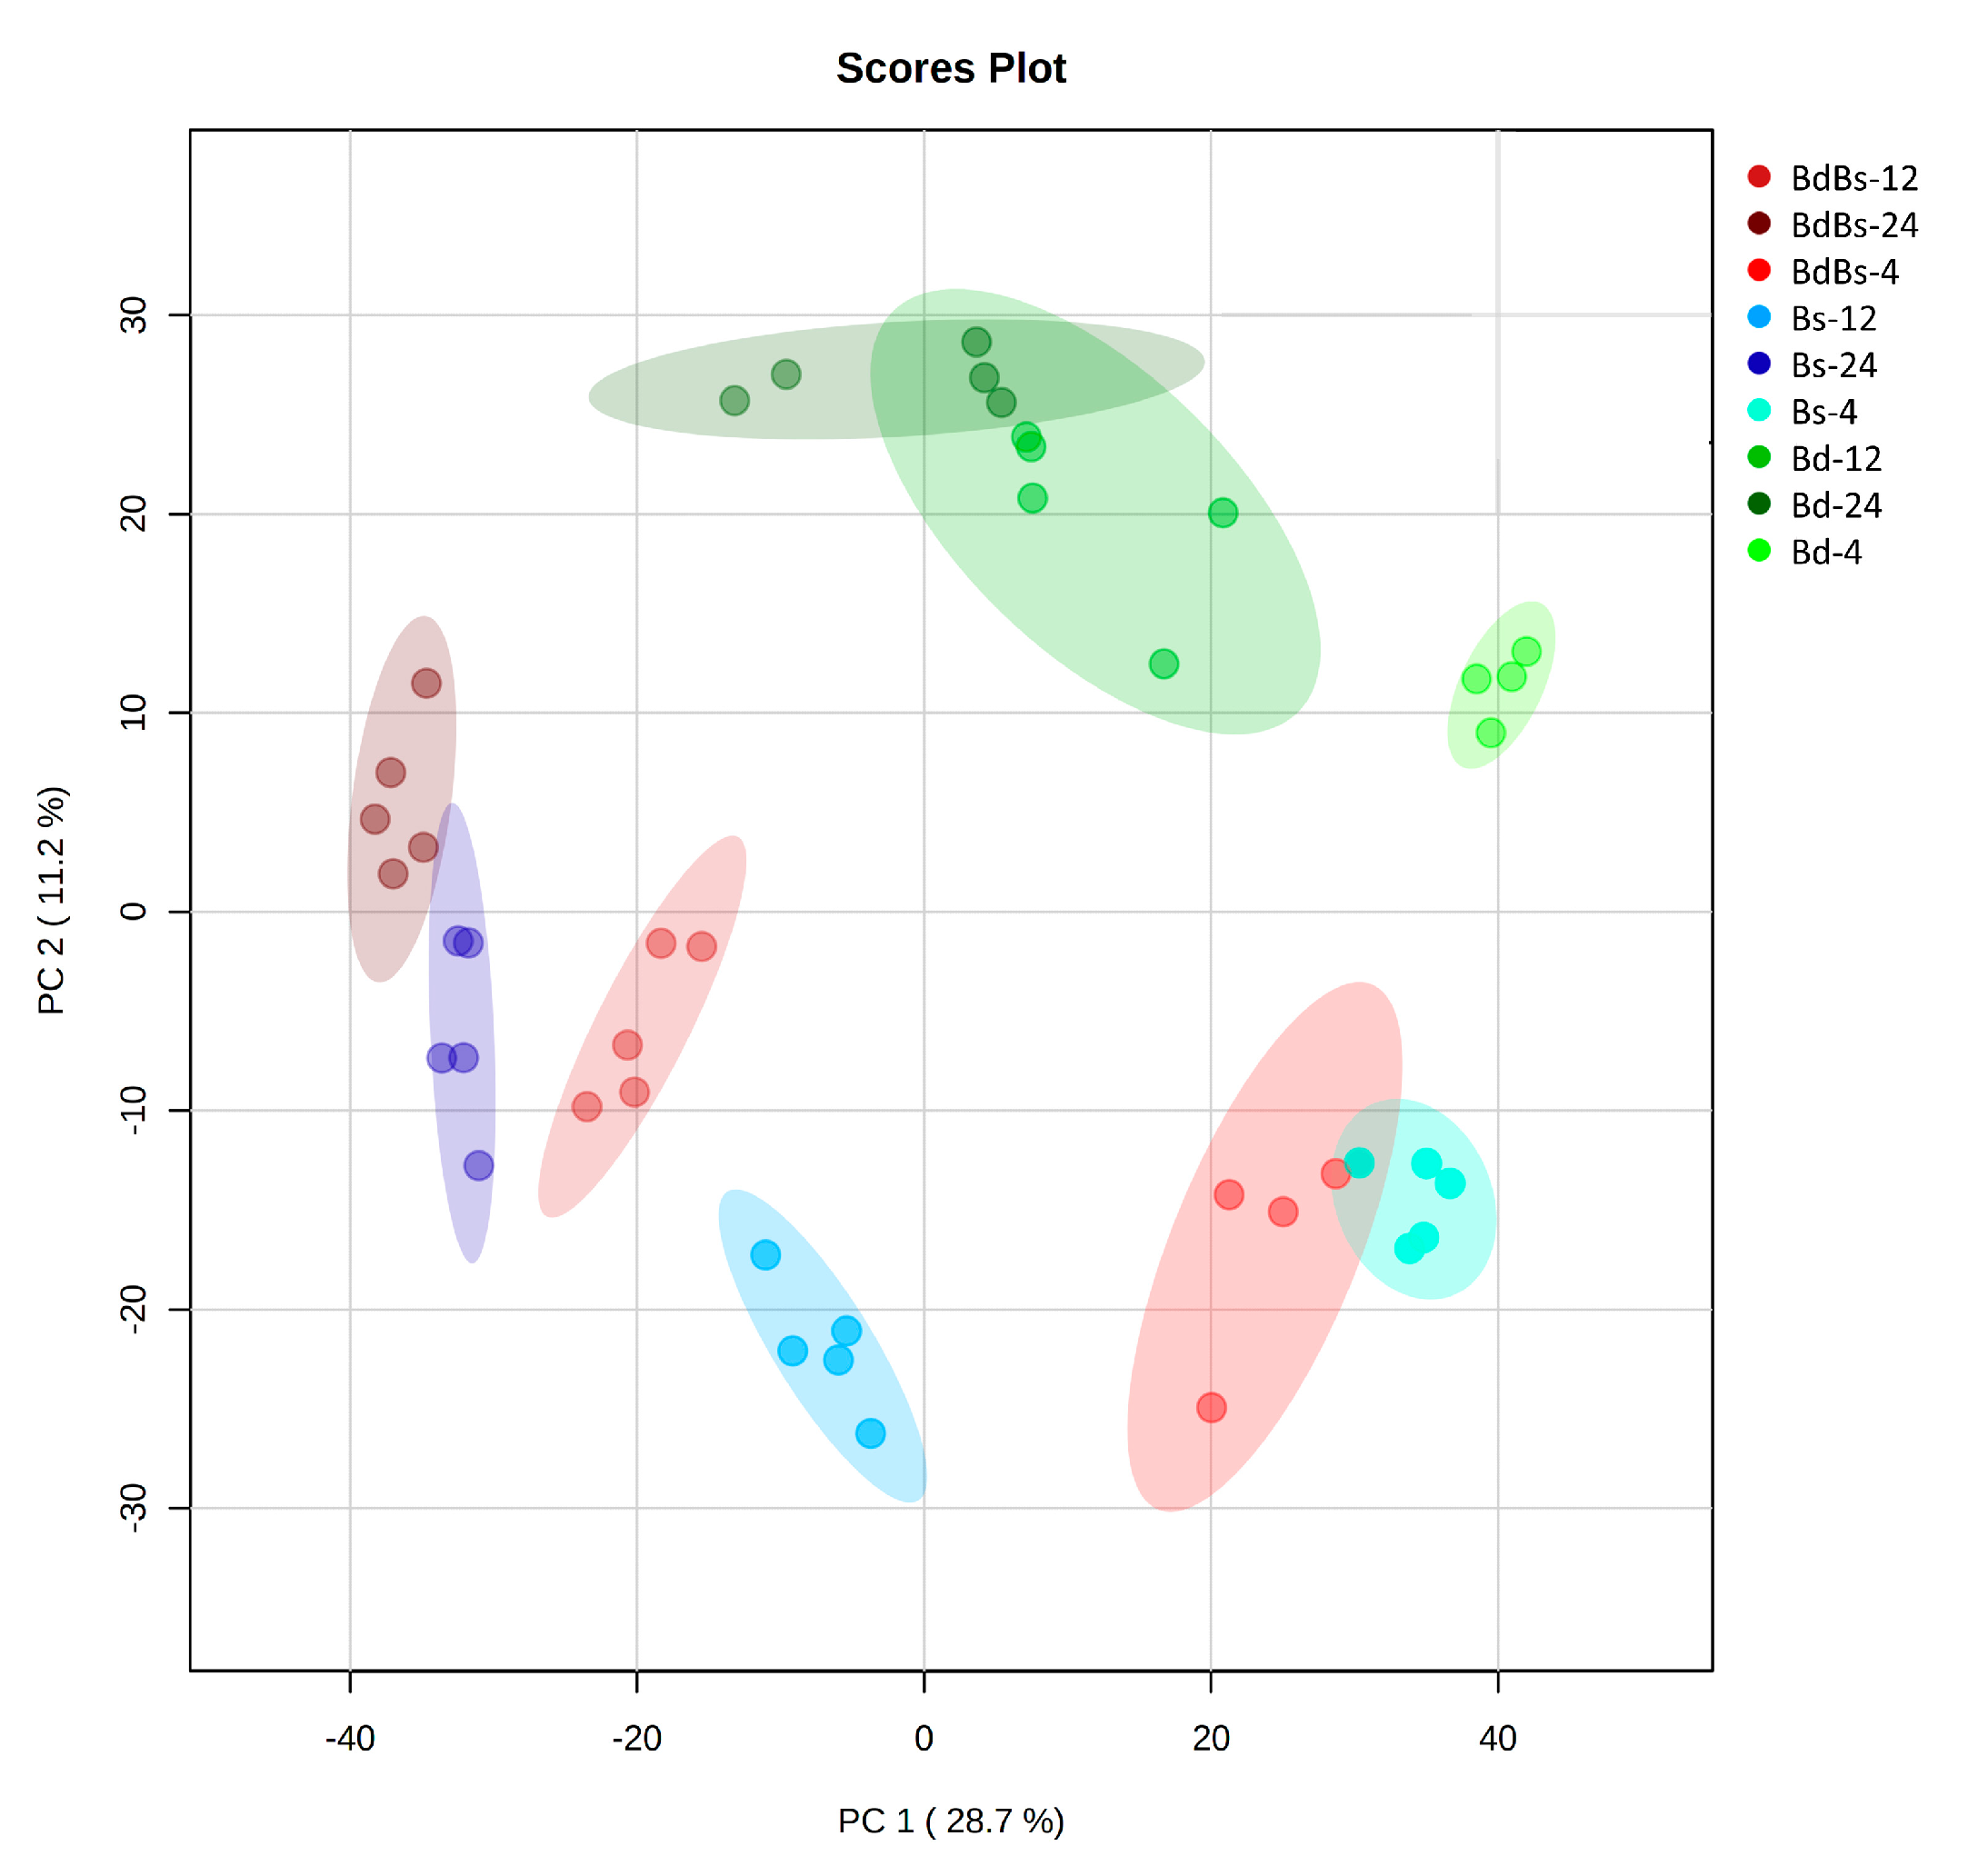
To investigate variation within the two different tissue types during imbibition, each was separately assessed. In the embryo samples, the main differences in metabolic profiles were seen with over time (PC 1 = 28.7%), but genotypic differences were also seen (Figure 3). In the case of Bd, the overlap between the 12 and 24 HAI groups suggested that metabolomic changes at these time points were not as pronounced as in Bs and BdBs. Across the axis showing the lesser source of variation (PC 2 = 11.2%), Bd formed a distinct group from the other species.
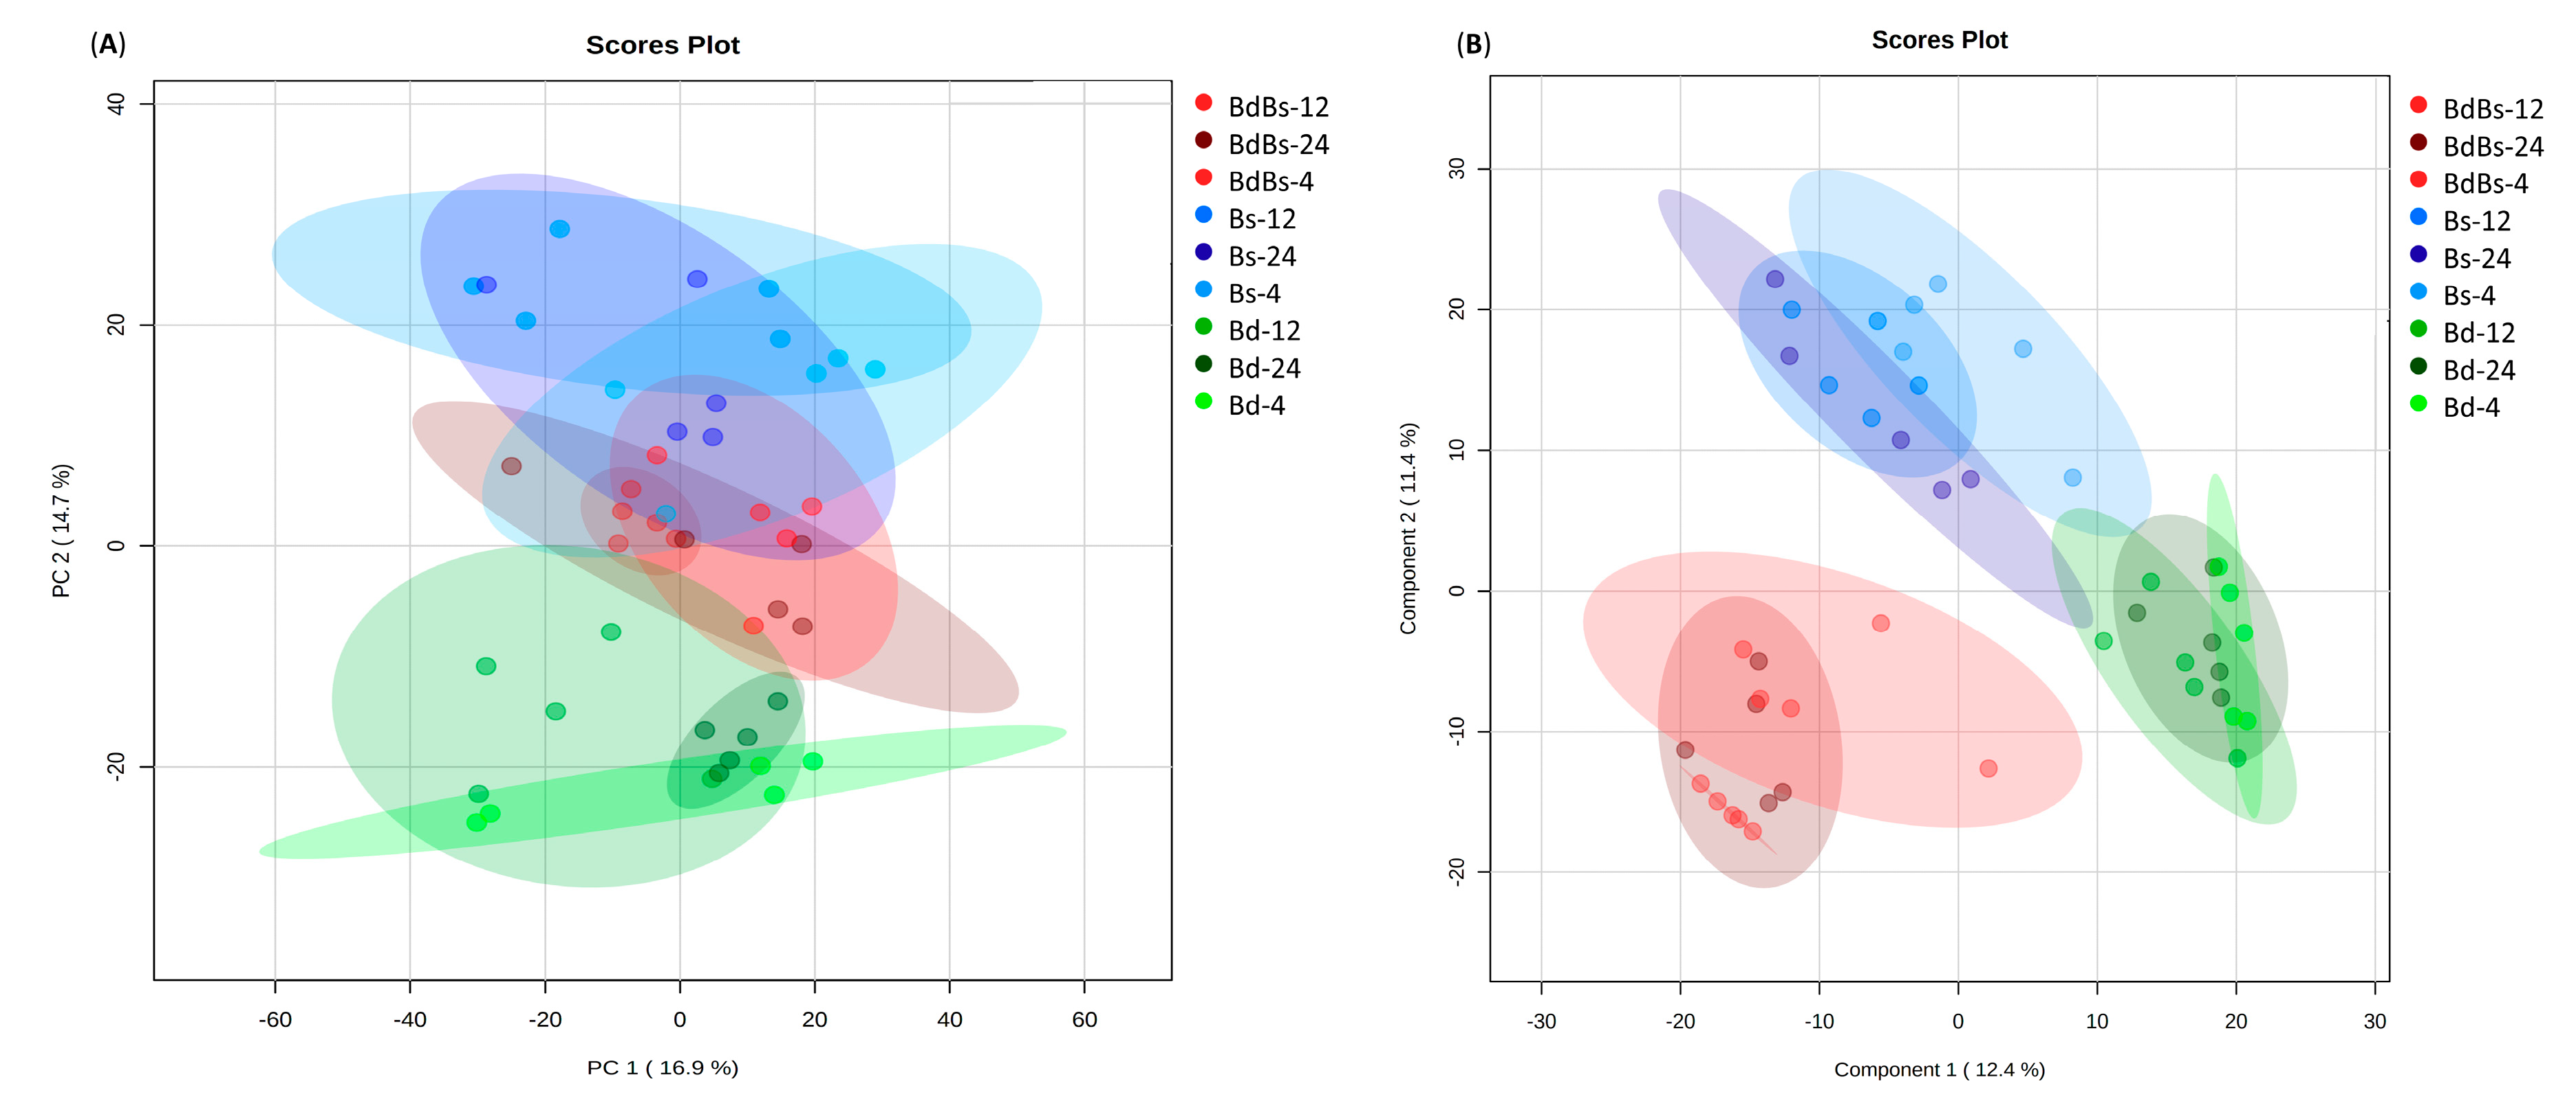
Considering the endosperm, no species-specific variation was seen across PC 1, which was instead linked to within experimental class variation. However, some variation that could be linked to species was apparent across PC 2 (PC 2 = 14.7%) (Figure 4A). This suggested that Bd and Bs had distinctive metabolomes but BdBs had some overlap with the Bs group. The use of the supervised PLS-DA allowed for the greater species-specific variation. However, considering only component 1, there was again overlap with Bs and BdBs, with Bd again being the most separate group (Figure 4B). Although the endosperm was being mobilized during this phase, strong metabolomic changes linked to time were not clearly seen. This may reflect the inability of our metabolomic approach to assess changes in starch polymers. Taking all our observations together indicated that the metabolomes of all three species were distinctive but Bs makes the greater metabolic contribution to the allotetraploid BdBs.

3.3. Species Specific Metabolite Variation

Next, we considered species-specific changes in each of the Brachypodium species in each tissue type occurring over time. These changes were identified based on ANOVA. These species-specific changes were compiled into a single data matrix and compared using a heat map (Figure 5). The dendrogram with the heatmap indicated two major clades, which are labelled “I” and “II” in Figure 5A. In II, the metabolite changes were broadly similar in each species over the 24 HAI, but with I, the changes appeared to be more distinctive in Bd compared to Bs and BdBs. The use of ASCA indicated that within the “genotype” effect, Bd-linked metabolites were the major source of variation, with Bs and BdBs being more similar (Figure 5B). For “time” effects, 4 HAI was the greater source of metabolite variation.
To provide potential functional differences between the Brachypodium embryo metabolomes, pathway enrichment analyses were carried based on the key sources of variation within each species (Figure S1). Bd showed a predominance of changes in galactose metabolism that was not so prominent in the other two species. In both Bs and BdBs, the top pathways were dominated by amino acid and glyoxylate metabolism. Some pathways were seen in each species but at differing ranks. These included those linked to bioenergy, starch/sucrose, and nucleotide metabolism, as would be expected during the germination process. To provide some detail of these metabolomic differences, key variables were compared across the species. Considering sugar metabolism leading to glycolysis (Figure 6), raffinose catabolism and increase in imported sucrose-6-phosphate were similar in all species. However, sucrose catabolism appeared to be greater in Bs and BdBs, leading to increases in the detected hexose sugar and hexose sugar phosphates that feed into bioenergetic metabolism. This was reflected in higher levels of pyruvate and TCA metabolites, malate, fumarate and oxaloacetate in Bs and BdBs (Figure S2). Lactate levels tended to be higher in Bd, suggesting relatively less efficient ATP/NADH generation during germination. Bd also saw the greater fall in glutathione and the ratios of chemically reduced glutathione (GSH) vs oxidized glutathione (GSSG) were consistent with the more chemically reducing conditions in Bs and BdBs (Figure S3).
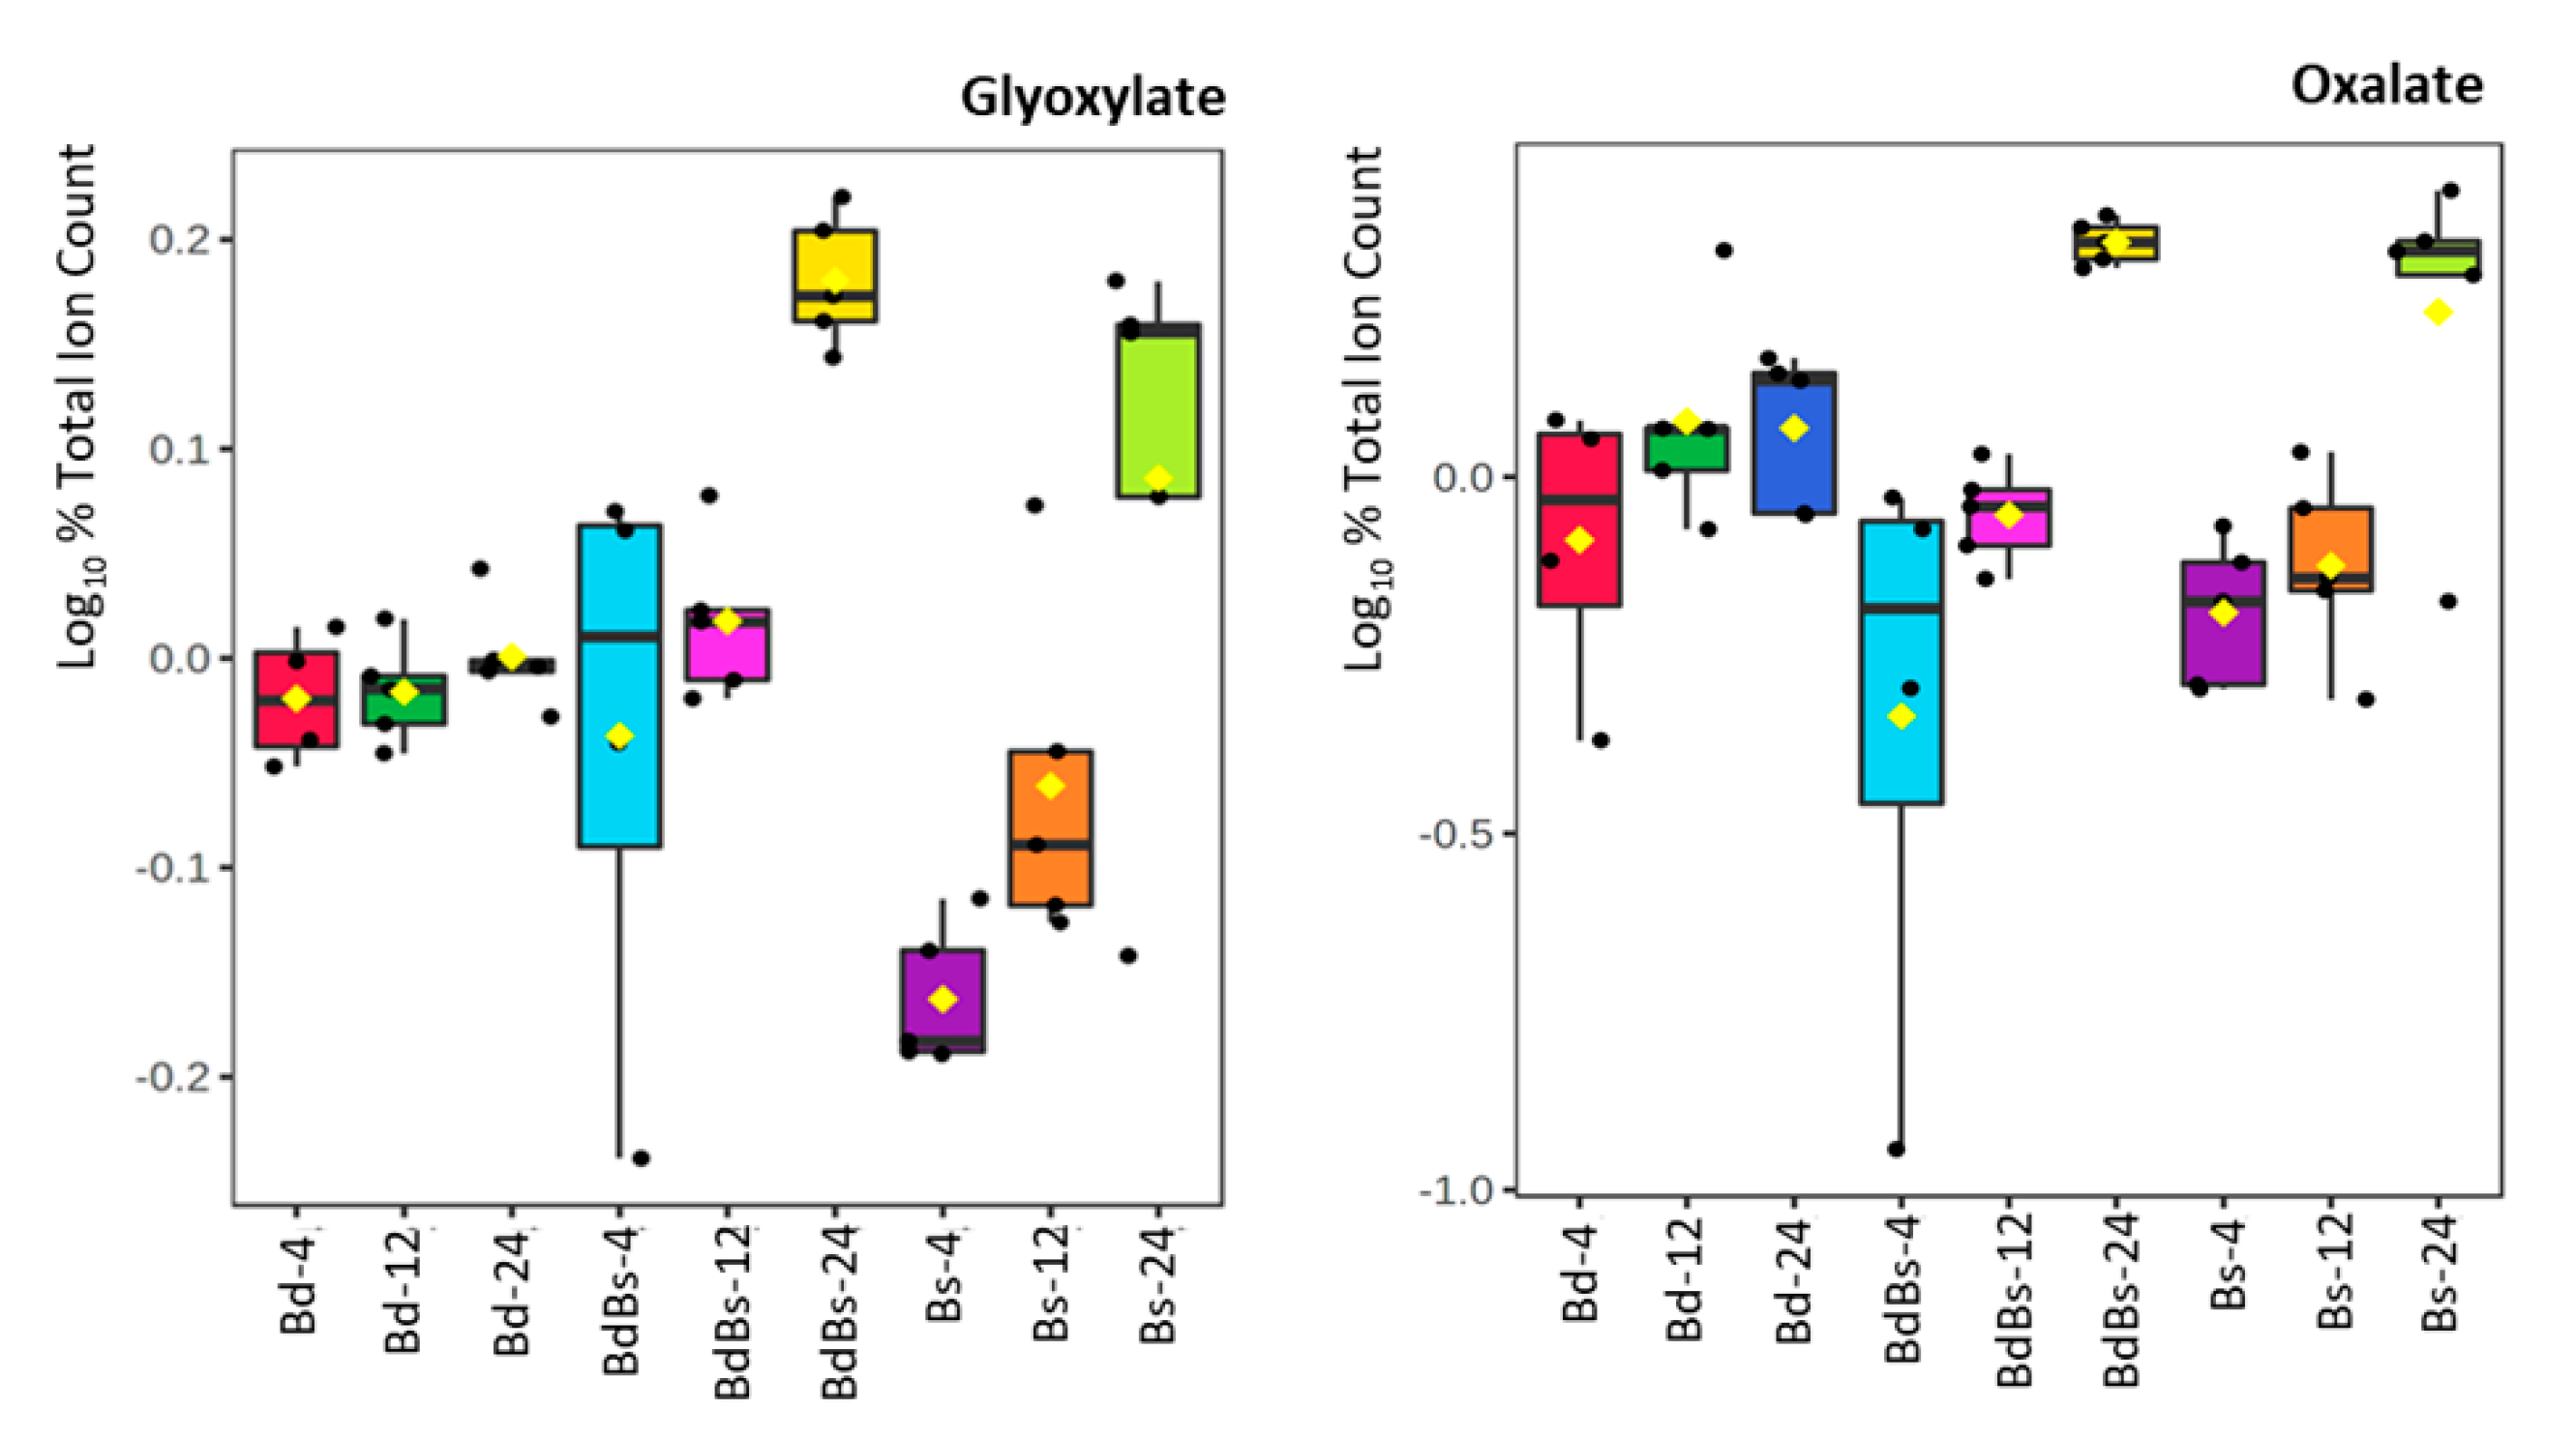
As amino acid metabolism appeared to differ between the species (Figure S1), this was also examined (Figure S4). As expected, the levels of most amino acids appeared to increase with HAI. However, although the changing levels of some amino acids were broadly similar amongst the species (valine, iso/leucine, glycine; Figure S4A), the contents tended to be greater in Bd for most (Figure S4B). Glyoxylate/oxalate metabolism was also ranked highly on the Bs and BdBs enhanced pathway list, and the box and whisker plots of some key metabolites showed that these were increased in those species compared to Bd (Figure 7).
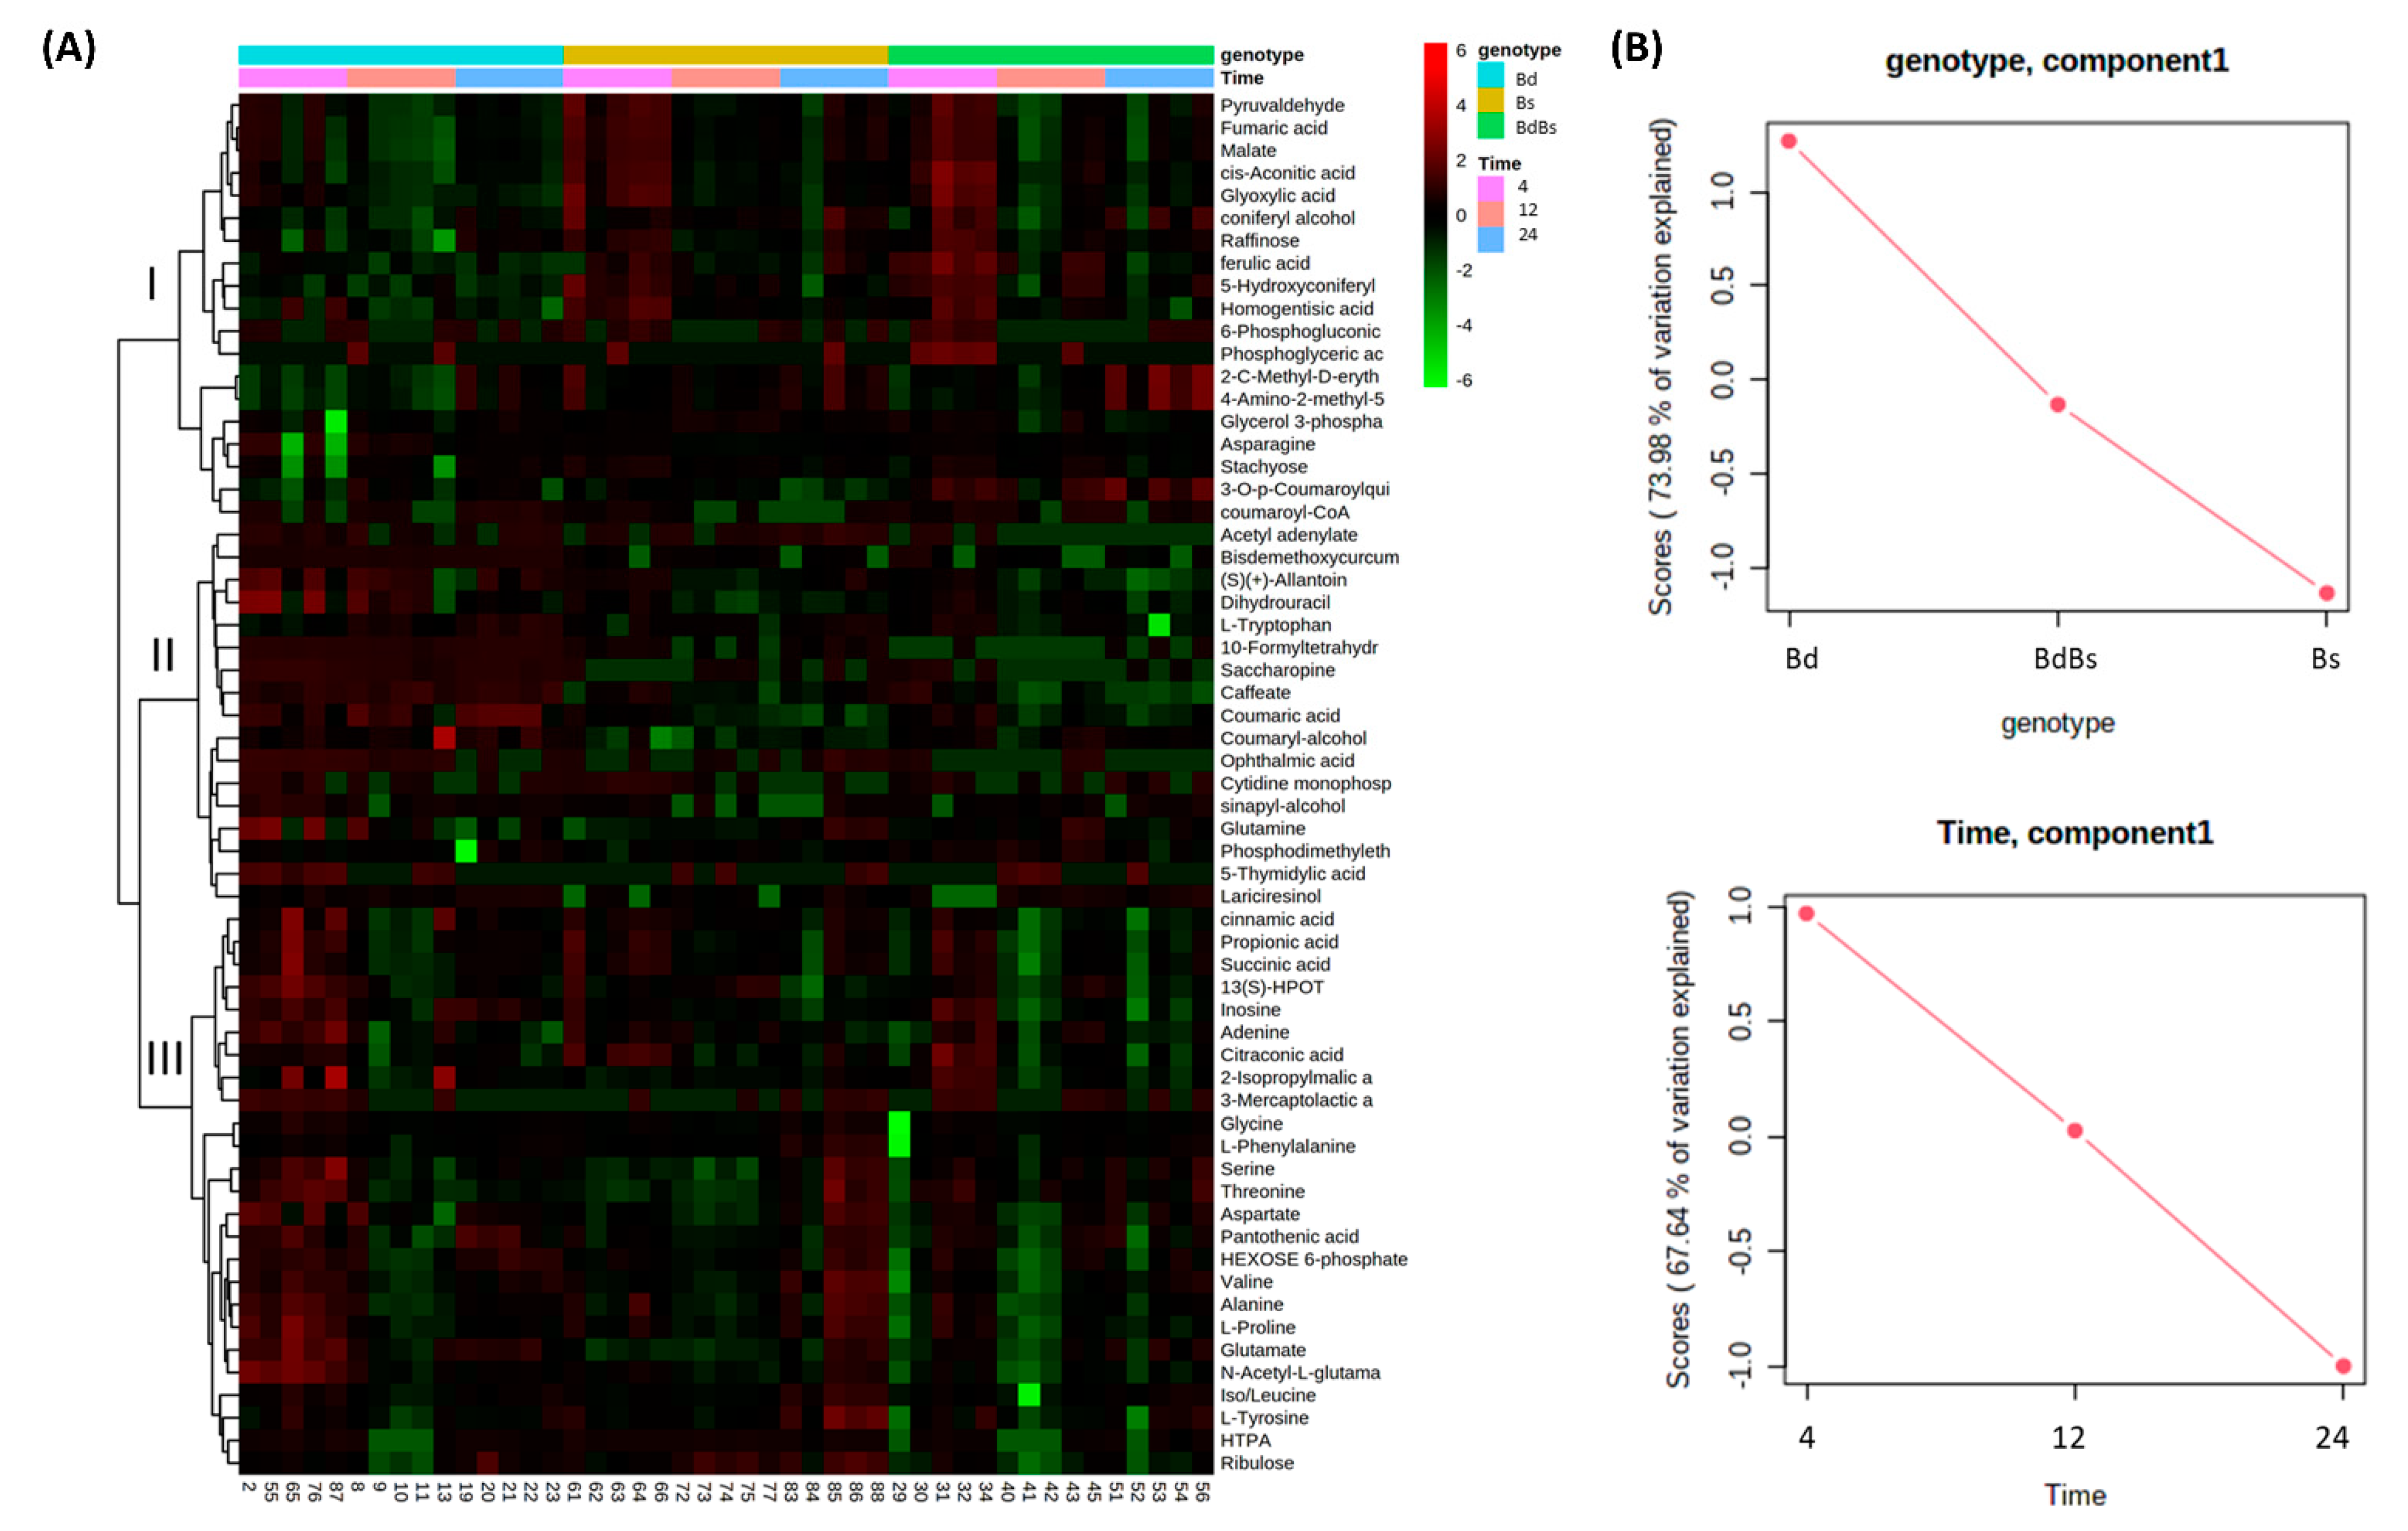
Metabolite changes over time in endosperm for each of the Brachypodium species were also identified. These changes were compiled and compared in a heat map (Figure 8A). The dendrogram with the heatmap indicated three major clades, labelled “I,” “II,” and “III” in Figure 8. Clade I contained metabolites that were generally at low levels in Bd during the imbibition period but in Bs and BdBs, after initially high levels at 4 HAI, were reduced with time. In clade II, metabolites were higher in Bd, but they tended not to increase at any time in the other species. In clade III, metabolites were at very high levels in Bd at 4 HAI but were at variable levels in Bs and BdBs. This was consistent with Bd being a major source of variation, as also suggested by ASCA (Figure 8B).
To provide functional information, pathway enrichment assessments were undertaken for each species (Figure S5). In each species, metabolites that contributed to the variation were associated with a range of pathways. To ease interpretation, some sources of variation are presented as box and whisker plots. In examining bioenergetic changes compared to embryo, there were fewer sources of variation in the endosperm (Figure S6). Raffinose levels proved to vary over the imbibition period, with each species showing that levels at 4 HAI tended to fall over time. Similarly, pyruvate and the TCA metabolites reduced from high levels at 4 HAI over time. This was consistent with a rapid mobilization of bioenergy-associated metabolites to the embryo. Amino acid metabolism was prominent in the pathway enrichment assessment from each metabolism. Plotting changes in individual amino acids overtime showed various patterns of change (Figure S7). Generally, patterns revealed a reduction in amino acid levels from at 12 HAI from those at 4 HAI, with a recovery in levels at 24 HAI. In Figure 8, we note changes in hydroxycinnamates (caffeate and ferulate) and monolignol metabolites. These were plotted because they could reflect cell wall changes through processing as a source of nutrients [35] (Figure 9). Over time, Bd showed increases in coumarate, caffeate, and (marginally) coumaryl and coniferyl alcohols, which were likely to reflect changes occurring at the cell wall. However, in the cases of ferulate, coniferyl, and 5-hydroxyconferyl alcohol, the changes in cell wall-associated metabolites were greater in Bs and BdBs.

4. Discussion

Seed imbibition and germination represents a key initial stage in plant development, the relative success of which will govern whether a plant will thrive in a given environment. A key aspect of the germination process is the mobilization of stored nutrients from the endosperm to the embryo and include amino acids, lipids, and sugars. As a result, this process particularly lends itself to metabolomic analyses. Our studies of germinating B. distachyon seeds have focused on the changes in metabolites that occur phases of active cell cycle [26], global histone modifications, and DNA methylation changes during embryonic and post-embryonic growth [27,39]. Future studies may link the metabolomic changes we describe in this paper with epigenetic and transcriptional changes during germination.
The germination metabolomes have been described in barley and wheat [40] or, in a more focused study, in wheat seeds exhibiting different levels of dormancy [41]. In tomato, metabolomics was used to define biochemical quantitative trait loci (QTL) in Solanum lycopersicum and Solanum pimpinellifolium recombinant inbreed lines (RIL population linked to germination [42]. A more practical application involved metabolomic approaches to detect the early stages of sprouting in cereal seeds, which is relevant to the grain industry [43].
Brachypodium distachyon has been exploited in temperate grass-seed research. For example, like the Triticeae, it displays a gene duplication in high-molecular-weight (HMW) glutenin genes that are important in conferring bread-making properties [44]. Considering its distinct features, some key studies have compared B. distachyon seeds versus other grasses and cereals [15,35,36,45]. Briefly, B. distachyon seeds are relatively large compared to the size of the entire plant, and the endosperm represents around 75% of the dehulled grain weight, which is nearly equivalent to domesticated grasses (~80%). The aleurone layer appears to lack major transfer tissues, which are used in endosperm filling in major temperate cereals but appears to be similar to rice. The grain has a very high level of proteins—amongst the highest detected in grasses. Most striking are the thick cell walls in the endosperm, and, correspondingly, only 10% of the seed is starch as opposed to 35–40% in non-domesticated wheat species [35]. Instead of starch, it appears that the storage polymers in B. distachyon are primarily (1,3; 1,4)-β-glucans, with glucose being the main saccharide monomer with lesser contributions from arabinose and xylose. These have been suggested to be mobilized to provide the nutrients during germination in B. distachyon [36].
In this study, we explored the metabolic differences of three Brachypodium species at three stages of seed germination by using a comparative metabolomics approach. We focused on the use of community standard lines for each species, namely Bd21 (Bd), ABR114 (Bs), and ABR113 (BdBs). These three species comprise a valuable model to investigate the impact of polyploidization on the organization and evolution of plant genomes, as well as grass biology. Polyploidy has a significant influence on the morphology and physiology of newly formed offspring. Compared with the corresponding diploids, autopolyploids tend to have larger cells, which may result in the enlargement of single organs, such as leaves, flowers, and seeds. Physiological traits such as plant height, growth rate, flowering time, and fertility also can be altered by polyploidization [46,47]. Polyploidization might significantly increase stress tolerance [48,49]. Studies on metabolic changes caused by polyploidization have indicated its role in the induction of considerable changes in primary and secondary metabolite accumulation in induced tetraploids compared to their diploid parents [4,5,6]. Similarly, metabolite changes were found in intergeneric hybrids between Brassica rapa and Raphanus sativus [50]. However, the effect of polyploidization on metabolic changes during seed germination needs to be more fully characterized. A comparative investigation of seed germination, metabolism, and seedling growth between tetraploid, Triticum durum (AABB), and the hexaploid, T. aestivum (AABBDD), suggested that each species was distinctive [51].
We separated metabolomic assessments of the endosperm from that of the embryo to discriminate source and sink tissue during germination. Metabolomic changes after imbibition appeared to be greater in the embryo than in the endosperm (Figure 3 vs. Figure 4). This should not be taken to indicate that the endosperm is less metabolically active, as these data could reflect the metabolomic approach that we employed. FIE-HRMS is biased towards small metabolites (<1500 m/z) so that changes in large polymers may not be readily captured. It may also be that the breakdown products are rapidly transported out of the endosperm and so were below our detection limits.
Results from both embryo and endosperm suggest that the Bs and BdBs metabolomes were similar to each other, but that Bd was distinctive. Therefore, in defining the actual metabolite changes occurring on imbibition, it was relevant to consider what features were common to the Brachypodium and what elements of the Bs metabolome were conserved in the allotetraploid BdBs.
Sugar metabolism was detected in the embryos of all three species. Each showed that from 4 HAI, the trisaccharide raffinose and sucrose levels were reduced with increasing imbibition time. This was complemented by increases in monosaccharide hexose sugars (“hexose-sugars”; Figure 6) and sugar phosphates, all of which feed into glycolysis/gluconeogenesis. As photosynthesis does not occur during seed germination, the energy for physiological processes and seedling development depends on glycolysis [52], and the availability of phosphorylated sugars play a key role in this process [12]. FIE-HRMS cannot easily distinguish between glucose, fructose, and (for instance) galactose, so the “hexose-sugar” designation was used in this study. However, the literature suggests that the hexose sugar changing during germination is primarily glucose [35]. Correspondingly, sugar-phosphates feed into increases in pyruvate. The central metabolic pathway that is known to provide the energy for the cells and anabolic precursors for proliferation and survival is the TCA cycle [6]. However, examination of the embryo TCA cycle metabolite highlighted differences between the species. These differences were seen in elevated levels of hexose sugars and hexose sugar phosphates in Bs and BdBs compared to Bd, and this was also seen in the important TCA intermediates (fumarate, malate, and oxaloacetate). Indeed, TCA metabolites did not greatly change in Bd, and it may be that pyruvate was being diverted to lactate (which was significantly higher in Bd compared to Bs and BdBs). If the less-bioenergetic lactate pathway is more utilized during Bd germination, this could have consequences in terms of relative germinative fitness. This may also be reflected in the slightly more oxidized conditions seen in Bd, as indicated by the ratios of reduced/oxidized glutathione ratios (Figure S3). Many studies have suggested that doubling of the genome size may be associated with the increased accumulation of primary metabolites [4,5,6], especially the intermediates of TCA cycle—malate, fumarate, citrate, and succinate. This would align with our observations for BdBs, but because it was also seen in Bs (234 Mb [29], compared with that of 272 Mb for Bd [53]), it could suggest that this property was inherited from Bs in the formation of the allopolyploid. Yi et al. [50] demonstrated altered sugar metabolism alteration in Brassicoraphanus hybrids. There were higher levels of sugars and utilization in hybrids compared to the parental lines. These results supported similar changes observed in A. thaliana and rice, which shown the shift in sugar metabolism in hybrids [54,55,56] which could also be relevant to polyploidization.
In addition to bioenergetic metabolism, amino acid processing is a key aspect of germination and the expected progressive increases in their levels were seen in Brachypodium. The changes were similar in each species with only minor differences, e.g., glutamate levels tended to be higher in Bd. In amide processing, aminotransferases transfer the amino group from glutamate to catalyze the formation of amino acids, a notable example being asparagine synthetase which forms asparagine [57]. It is therefore of interest that asparagine is also elevated in Bd. Whatever the potential selective advantages this could represent in terms of improved amide processing, this is not a metabolomic feature of the allotetraploid embryo.
Oxalates that accumulate to high levels in wheat embryos are substrates for oxalate oxidase (a member of the germin family of proteins) to generate H2O2. Within the context of a germinating seed, the generated H2O2 could initiate programmed cell death to compromise cellular permeability barriers, and/or the peroxidative cross-linking of the cell wall. The latter would increase cell wall rigidity and counter the release of nutrients that could be important for germination in Brachypodium [35]. In the case of Bs and BdBs, both were shown to exhibit increased levels of oxalate and its precursor, glyoxylate, compared to Bd at 24 HAI. These increased oxalate levels were features of the embryo rather than endosperm where one might expect to detect oxalate released from the degradation of thickened cell walls (Figure 8). Thus, the increased H2O2 generation may be involved in nutrient acquisition, as seen most obviously in the increased levels of hexose sugars in Bs and BdBs.
Comparing the patterns seen with the embryo with those in endosperm, metabolites linked to sugar mobilization did not give a clear trend. Monosaccharide hexose sugars were not found to be amongst the major sources of variation between genotypes or timepoints. Furthermore, changes seen in raffinose content did not appear to have a time or genotype specific pattern (Figure S6). It may be that the limited starch in the Brachypodium endosperm was mobilized within 4 HAI, and this was not captured by our experimental design. Having said that, the levels of raffinose tended to be greater in Bs and BdBs. Pyruvate and the TCA metabolites—cis-acontiate, malate, and fumarate—were also elevated in BdBs at 4 HAI but not in Bs (Figure S6). If the cell wall is a major source of sugars, we may have seen changes in such as xylans and mannans, as well as glucose, arising from cellulose and hemicellulose polymer processing. These sugars were also not amongst the major sources of variation. However, hydroxycinnamic acids and monolignol metabolites, which are linked with cell wall modification, were prominent (Figure 9). As noted by Gullion et al. [36], the major hydroxy cinnamic acids detected were ferulic acid and para-coumarate, whilst sinapic acid was not detected. Compared to Bd, the coumarate and caffeate in Bs and BdBs were reduced whilst ferulate and 5-hydroxy/coniferyl alcohols were increased. Such alterations could be consistent with changes aiming to reinforce the cell wall after a possible rapid (i.e., <4 HAI) processing of associated sugars. Such rapid processing correlated with increased levels of, e.g., hexose sugars in the embryo (Figure 6). Therefore, this monolignol processing in Bs and BdBs may be an echo of more efficient cell wall sugar mobilization to the embryo compared to Bd. Such a feature could be an important trait of Bs that was selected for in the ancestral allotetraploidization to form BdBs. By way of comparison, whilst amino acid changes were seen within each species, which would indicate protein processing, no clear difference between the species was observed (Figure S7). Therefore, amino acid processing patterns from either Bd or Bs do not dominate that seen in BdBs.

5. Conclusions

The processes underlying seed germination are fundamental to plant fitness and in driving agricultural yield. These have been understandably extensively characterized in cereals but not to the same degree in other grasses. The Brachypodium seed is distinctive from those of domesticated temperate cereals, with thick cell walls likely to be the source of sugars as opposed to starch in the endosperm. Our metabolomic approach sought to characterize how metabolites were mobilized out of the endosperm to embryo. The results were consistent with a rapid mobilization for sugars out of the endosperm, with evidence for cell wall remodeling based on hydroxycinnamic acid and monolignol changes. More importantly, our comparative metabolomic approach allowed us to compare these changes in the seeds of Bd and Bs, the parents of the allotetraploid BdBs. In the Mediterranean basin, Bs is comparatively rare compared to Bd and BdBs, so the importance of Bs as a parent is unclear. In our metabolomic studies, the Bs metabolome was most similar to that of BdBs, suggesting that the Bs metabolome was retained during the allotetraploidization process. The conserved Bs metabolome is likely to reflect more efficient mobilization of sugars out of the endosperm than occurs in Bd, and this could have been instrumental in driving an environmentally fit BdBs species. As our observations were based on single examples of each species (albeit established community standards), they require confirmation by more expansive studies involving more genotypes including de novo hybrids. Finally, a logical extension of our approach is to consider what the metabolomic contributions of Bd are in deriving BdBs. If not in germination, it may be that Bd is important in conferring other traits, such as stress tolerance, to BdBs.

Supplementary Materials

The following are available online at https://www.mdpi.com/article/10.3390/cells10040828/s1. Table S1: Metabolomic matrices for the Brachypodium species embryo and endosperm. Figure S1: Pathway enrichment metabolic pathway analysis of major sources of metabolite variation in (A) Brachypodium distachyon (Bd), (B) B. stacei (Bs), and (C) B. hybridum (BdBs) embryos. Figure S2: Discriminatory bioenergy metabolites detected in Brachypodium embryos during germination. Figure S3: Reduced (GSH) and oxidized (GSSG) glutathione levels in Brachypodium embryos during germination. Figure S4: Discriminatory amino acid metabolites detected in Brachypodium embryos during germination. Figure S5: Pathway enrichment metabolic pathway analysis of major sources of metabolite variation in (A) Brachypodium distachyon (Bd), (B) B. stacei (Bs), and (C) B. hybridum (BdBs) endosperms. Figure S6: Discriminatory bioenergy metabolites detected in Brachypodium endosperm during germination. Figure S7: Discriminatory amino acid metabolites detected in Brachypodium embryos during germination.

Author Contributions

Conceptualization, E.W. and L.A.J.M.; data curation, A.S. and L.A.J.M.; Formal analysis, A.S., E.W., M.B., J.H.D., R.H. and L.A.J.M.; funding acquisition, R.H. and L.A.J.M.; investigation, A.S., E.W. and L.A.J.M.; methodology, M.B. and L.A.J.M.; project administration, R.H.; resources, M.B., J.H.D., R.H. and L.A.J.M.; software, M.B., J.H.D. and L.A.J.M.; supervision, R.H. and L.A.J.M.; validation, A.S., E.W., M.B., R.H. and L.A.J.M.; visualization, A.S. and L.A.J.M.; writing—original draft, A.S., E.W. and L.A.J.M.; writing—review and editing, A.S., E.W., R.H. and L.A.J.M. All authors have read and agreed to the published version of the manuscript.

Funding

This research was funded by the National Science Centre, Poland (grant no. 2015/18/M/NZ2/00394). J.H.D. and L.A.J.M. acknowledge funding from the BBSRC. The publication was co-financed by the funds granted under the Research Excellence Initiative of the University of Silesia in Katowice.

Institutional Review Board Statement

Not applicable.

Informed Consent Statement

Not applicable.

Data Availability Statement

The data presented in this study are available as supplementary files.

Conflicts of Interest

Aleksandra Skalska is an employee of MDPI, but she is not working for the journal Cells at the time of submission and publication.

References

  1. Cheng, S.; Zong, Y.; Wang, X. Sub-genome polyploidization Effects on metabolomic signatures in triploid hybrids of Populus. Forests 2019, 10, 1091. [Google Scholar] [CrossRef] [Green Version]
  2. Liu, Z.; Wang, R.; Wang, J. Comprehensive transcriptomic analysis for developing seeds of a synthetic Brassica hexaploid. Plants 2020, 9, 1141. [Google Scholar] [CrossRef]
  3. Vergara, F.; Rymen, B.; Kuwahara, A.; Sawada, Y.; Sato, M.; Hirai, M.Y. Autopolyploidization, geographic origin, and metabolome evolution in Arabidopsis thaliana. Am. J. Bot 2017, 104, 905–914. [Google Scholar] [CrossRef]
  4. Cohen, H.; Fait, A.; Tel-Zur, N. Morphological, cytological and metabolic consequences of autopolyploidization in Hylocereus (Cactaceae) species. BMC Plant Biol. 2013, 13, 173. [Google Scholar] [CrossRef] [Green Version]
  5. Tan, F.Q.; Tu, H.; Liang, W.J.; Long, J.M.; Wu, X.M.; Zhang, H.Y.; Guo, W.W. Comparative metabolic and transcriptional analysis of a doubled diploid and its diploid citrus rootstock (C. junos cv. Ziyang xiangcheng) suggests its potential value for stress resistance improvement. BMC Plant Biol. 2015, 15, 89. [Google Scholar] [CrossRef] [Green Version]
  6. Tan, F.Q.; Tu, H.; Wang, R.; Wu, X.M.; Xie, K.D.; Chen, J.J.; Zhang, H.Y.; Xu, J.; Guo, W.W. Metabolic adaptation following genome doubling in citrus doubled diploids revealed by non-targeted metabolomics. Metabolomics 2017, 13, 1–12. [Google Scholar] [CrossRef]
  7. Sattler, M.C.; Carvalho, C.R.; Clarindo, W.R. The polyploidy and its key role in plant breeding. Planta 2016, 243, 281–296. [Google Scholar] [CrossRef] [PubMed]
  8. Bewley, J.D. Seed germination and dormancy. Plant Cell 1997, 9, 1055–1066. [Google Scholar] [CrossRef] [PubMed] [Green Version]
  9. Feenstra, A.D.; Alexander, L.E.; Song, Z.; Korte, A.R.; Yandeau-Nelson, M.D.; Nikolau, B.J.; Lee, Y.J. Spatial mapping and profiling of metabolite distributions during germination. Plant Physiol. 2017, 174, 2532–2548. [Google Scholar] [CrossRef] [Green Version]
  10. Shu, X.L.; Frank, T.; Shu, Q.Y.; Engel, K.H. Metabolite profiling of germinating rice seeds. J. Agric. Food Chem. 2008, 56, 11612–11620. [Google Scholar] [CrossRef]
  11. Han, C.; Zhen, S.; Zhu, G.; Bian, Y.; Yan, Y. Comparative metabolome analysis of wheat embryo and endosperm reveals the dynamic changes of metabolites during seed germination. Plant Physiol. Biochem. 2017, 115, 320–327. [Google Scholar] [CrossRef]
  12. Fait, A.; Angelovici, R.; Less, H.; Ohad, I.; Urbanczyk-Wochniak, E.; Fernie, A.R.; Galili, G. Arabidopsis seed development and germination is associated with temporally distinct metabolic switches. Plant Physiol. 2006, 142, 839–854. [Google Scholar] [CrossRef] [Green Version]
  13. Palmiano, E.P.; Juliano, B.O. Biochemical Changes in the Rice Grain during Germination. Plant Physiol. 1972, 49, 751–756. [Google Scholar] [CrossRef] [PubMed] [Green Version]
  14. Howell, K.A.; Narsai, R.; Carroll, A.; Ivanova, A.; Lohse, M.; Usadel, B.; Millar, A.H.; Whelan, J. Mapping metabolic and transcript temporal switches during germination in rice highlights specific transcription factors and the role of RNA instability in the germination process. Plant Physiol. 2009, 149, 961–980. [Google Scholar] [CrossRef] [PubMed] [Green Version]
  15. Opanowicz, M.; Vain, P.; Draper, J.; Parker, D.; Doonan, J.H. Brachypodium distachyon: Making hay with a wild grass. Trends Plant Sci. 2008, 13, 172–177. [Google Scholar] [CrossRef]
  16. Betekhtin, A.; Milewska-Hendel, A.; Lusinska, J.; Chajec, L.; Kurczynska, E.; Hasterok, R. Organ and tissue-specific localisation of selected cell wall epitopes in the zygotic embryo of Brachypodium distachyon. Int. J. Mol. Sci. 2018, 19. [Google Scholar] [CrossRef] [PubMed] [Green Version]
  17. Bouvier d’Yvoire, M.; Bouchabke-Coussa, O.; Voorend, W.; Antelme, S.; Cezard, L.; Legee, F.; Lebris, P.; Legay, S.; Whitehead, C.; McQueen-Mason, S.J.; et al. Disrupting the cinnamyl alcohol dehydrogenase 1 gene (BdCAD1) leads to altered lignification and improved saccharification in Brachypodium Distachyon. Plant J. 2013, 73, 496–508. [Google Scholar] [CrossRef] [PubMed]
  18. Christensen, U.; Alonso-Simon, A.; Scheller, H.V.; Willats, W.G.; Harholt, J. Characterization of the primary cell walls of seedlings of Brachypodium distachyon—A potential model plant for temperate grasses. Phytochemistry 2010, 71, 62–69. [Google Scholar] [CrossRef] [PubMed]
  19. Wang, T.; Salazar, A.; Zabotina, O.A.; Hong, M. Structure and dynamics of Brachypodium primary cell wall polysaccharides from two-dimensional (13)C solid-state nuclear magnetic resonance spectroscopy. Biochemistry 2014, 53, 2840–2854. [Google Scholar] [CrossRef]
  20. Fitzgerald, T.L.; Powell, J.J.; Schneebeli, K.; Hsia, M.M.; Gardiner, D.M.; Bragg, J.N.; McIntyre, C.L.; Manners, J.M.; Ayliffe, M.; Watt, M.; et al. Brachypodium as an emerging model for cereal-pathogen interactions. Ann. Bot. 2015, 115, 717–731. [Google Scholar] [CrossRef]
  21. Routledge, A.P.; Shelley, G.; Smith, J.V.; Talbot, N.J.; Draper, J.; Mur, L.A. Magnaporthe grisea interactions with the model grass Brachypodium distachyon closely resemble those with rice (Oryza sativa). Mol. Plant Pathol. 2004, 5, 253–265. [Google Scholar] [CrossRef]
  22. Lenk, I.; Fisher, L.H.C.; Vickers, M.; Akinyemi, A.; Didion, T.; Swain, M.; Jensen, C.S.; Mur, L.A.J.; Bosch, M. Transcriptional and metabolomic analyses indicate that cell wall properties are associated with drought tolerance in Brachypodium distachyon. Int. J. Mol. Sci. 2019, 20, 1758. [Google Scholar] [CrossRef] [Green Version]
  23. Priest, H.D.; Fox, S.E.; Rowley, E.R.; Murray, J.R.; Michael, T.P.; Mockler, T.C. Analysis of global gene expression in Brachypodium distachyon reveals extensive network plasticity in response to abiotic stress. PLoS ONE 2014, 9, e87499. [Google Scholar] [CrossRef]
  24. Ruíz, M.; Quemada, M.; García, R.M.; Carrillo, J.M.; Benavente, E. Use of thermographic imaging to screen for drought-tolerant genotypes in Brachypodium distachyon. Crop. Pasture Sci. 2016, 67, 99–108. [Google Scholar] [CrossRef] [Green Version]
  25. Barrero, J.M.; Jacobsen, J.V.; Talbot, M.J.; White, R.G.; Swain, S.M.; Garvin, D.F.; Gubler, F. Grain dormancy and light quality effects on germination in the model grass Brachypodium distachyon. New Phytol. 2012, 193, 376–386. [Google Scholar] [CrossRef]
  26. Wolny, E.; Betekhtin, A.; Rojek, M.; Braszewska-Zalewska, A.; Lusinska, J.; Hasterok, R. Germination and the early stages of seedling development in Brachypodium distachyon. Int. J. Mol. Sci. 2018, 19, 2916. [Google Scholar] [CrossRef] [PubMed] [Green Version]
  27. Wolny, E.; Braszewska-Zalewska, A.; Kroczek, D.; Hasterok, R. Histone H3 and H4 acetylation patterns are more dynamic than those of DNA methylation in Brachypodium distachyon embryos during seed maturation and germination. Protoplasma 2017, 254, 2045–2052. [Google Scholar] [CrossRef] [PubMed] [Green Version]
  28. Catalan, P.; Muller, J.; Hasterok, R.; Jenkins, G.; Mur, L.A.; Langdon, T.; Betekhtin, A.; Siwinska, D.; Pimentel, M.; Lopez-Alvarez, D. Evolution and taxonomic split of the model grass Brachypodium distachyon. Ann. Bot. 2012, 109, 385–405. [Google Scholar] [CrossRef] [Green Version]
  29. Gordon, S.P.; Contreras-Moreira, B.; Levy, J.J.; Djamei, A.; Czedik-Eysenberg, A.; Tartaglio, V.S.; Session, A.; Martin, J.; Cartwright, A.; Katz, A.; et al. Gradual polyploid genome evolution revealed by pan-genomic analysis of Brachypodium hybridum and its diploid progenitors. Nat. Commun. 2020, 11, 3670. [Google Scholar] [CrossRef]
  30. Brkljacic, J.; Grotewold, E.; Scholl, R.; Mockler, T.; Garvin, D.F.; Vain, P.; Brutnell, T.; Sibout, R.; Bevan, M.; Budak, H.; et al. Brachypodium as a model for the grasses: Today and the future. Plant Physiol. 2011, 157, 3–13. [Google Scholar] [CrossRef] [Green Version]
  31. Dinh Thi, V.H.; Coriton, O.; Le Clainche, I.; Arnaud, D.; Gordon, S.P.; Linc, G.; Catalan, P.; Hasterok, R.; Vogel, J.P.; Jahier, J.; et al. Recreating stable Brachypodium hybridum allotetraploids by uniting the divergent genomes of B. distachyon and B. stacei. PLoS ONE 2016, 11, e0167171. [Google Scholar] [CrossRef] [PubMed] [Green Version]
  32. Fisher, L.H.; Han, J.; Corke, F.M.; Akinyemi, A.; Didion, T.; Nielsen, K.K.; Doonan, J.H.; Mur, L.A.; Bosch, M. Linking dynamic phenotyping with metabolite analysis to study natural variation in drought responses of Brachypodium distachyon. Front. Plant Sci. 2016, 7, 1751. [Google Scholar] [CrossRef] [PubMed] [Green Version]
  33. Onda, Y.; Hashimoto, K.; Yoshida, T.; Sakurai, T.; Sawada, Y.; Hirai, M.Y.; Toyooka, K.; Mochida, K.; Shinozaki, K. Determination of growth stages and metabolic profiles in Brachypodium distachyon for comparison of developmental context with Triticeae crops. Proc. Biol. Sci. 2015, 282, 20150964. [Google Scholar] [CrossRef] [Green Version]
  34. Onda, Y.; Inoue, K.; Sawada, Y.; Shimizu, M.; Takahagi, K.; Uehara-Yamaguchi, Y.; Hirai, M.Y.; Garvin, D.F.; Mochida, K. Genetic variation for seed metabolite levels in Brachypodium distachyon. Int. J. Mol. Sci. 2019, 20, 2348. [Google Scholar] [CrossRef] [Green Version]
  35. Opanowicz, M.; Hands, P.; Betts, D.; Parker, M.L.; Toole, G.A.; Mills, E.N.; Doonan, J.H.; Drea, S. Endosperm development in Brachypodium distachyon. J. Exp. Bot. 2011, 62, 735–748. [Google Scholar] [CrossRef] [Green Version]
  36. Guillon, F.; Bouchet, B.; Jamme, F.; Robert, P.; Quemener, B.; Barron, C.; Larre, C.; Dumas, P.; Saulnier, L. Brachypodium distachyon grain: Characterization of endosperm cell walls. J. Exp. Bot. 2011, 62, 1001–1015. [Google Scholar] [CrossRef] [Green Version]
  37. Baptista, R.; Fazakerley, D.M.; Beckmann, M.; Baillie, L.; Mur, L.A.J. Untargeted metabolomics reveals a new mode of action of pretomanid (PA-824). Sci. Rep. 2018, 8, 5084. [Google Scholar] [CrossRef]
  38. Chong, J.; Wishart, D.S.; Xia, J. Using MetaboAnalyst 4.0 for Comprehensive and Integrative Metabolomics Data Analysis. Curr. Protoc. Bioinform. 2019, 68, e86. [Google Scholar] [CrossRef]
  39. Wolny, E.; Braszewska-Zalewska, A.; Hasterok, R. Spatial distribution of epigenetic modifications in Brachypodium distachyon embryos during seed maturation and germination. PLoS ONE 2014, 9, e101246. [Google Scholar] [CrossRef] [Green Version]
  40. Burke, M.; Small, D.M.; Antolasic, F.; Hughes, J.G.; Spencer, M.J.S.; Blanch, E.W.; Jones, O.A.H. Infrared Spectroscopy-Based Metabolomic Analysis for the Detection of Preharvest Sprouting in Grain. Cereal Chem. 2016, 93, 444–449. [Google Scholar] [CrossRef]
  41. Das, A.; Kim, D.W.; Khadka, P.; Rakwal, R.; Rohila, J.S. Unraveling Key Metabolomic Alterations in Wheat Embryos Derived from Freshly Harvested and Water-Imbibed Seeds of Two Wheat Cultivars with Contrasting Dormancy Status. Front. Plant Sci. 2017, 8, 1203. [Google Scholar] [CrossRef] [Green Version]
  42. Kazmi, R.H.; Willems, L.A.J.; Joosen, R.V.L.; Khan, N.; Ligterink, W.; Hilhorst, H.W.M. Metabolomic analysis of tomato seed germination. Metabolomics 2017, 13, 145. [Google Scholar] [CrossRef] [Green Version]
  43. Jones, O.A. Assessing pre-harvest sprouting in cereals using near-infrared spectroscopy-based metabolomics. NIR News 2017, 28, 15–19. [Google Scholar] [CrossRef]
  44. Gu, Y.Q.; Wanjugi, H.; Coleman-Derr, D.; Kong, X.; Anderson, O.D. Conserved globulin gene across eight grass genomes identify fundamental units of the loci encoding seed storage proteins. Funct. Integr. Genom. 2010, 10, 111–122. [Google Scholar] [CrossRef]
  45. Hands, P.; Drea, S. A comparative view of grain development in Brachypodium distachyon. J. Cereal Sci. 2012, 56, 2–8. [Google Scholar] [CrossRef] [Green Version]
  46. Martin, S.L.; Husband, B.C. Whole genome duplication affects evolvability of flowering time in an autotetraploid plant. PLoS ONE 2012, 7, e44784. [Google Scholar] [CrossRef] [Green Version]
  47. Yao, H.; Kato, A.; Mooney, B.; Birchler, J.A. Phenotypic and gene expression analyses of a ploidy series of maize inbred Oh43. Plant Mol. Biol. 2011, 75, 237–251. [Google Scholar] [CrossRef]
  48. Chao, D.Y.; Dilkes, B.; Luo, H.; Douglas, A.; Yakubova, E.; Lahner, B.; Salt, D.E. Polyploids exhibit higher potassium uptake and salinity tolerance in Arabidopsis. Science 2013, 341, 658–659. [Google Scholar] [CrossRef] [PubMed] [Green Version]
  49. Del Pozo, J.C.; Ramirez-Parra, E. Deciphering the molecular bases for drought tolerance in Arabidopsis autotetraploids. Plant Cell Environ. 2014, 37, 2722–2737. [Google Scholar] [CrossRef]
  50. Yi, G.; Shin, H.; Park, H.R.; Park, J.E.; Ahn, J.H.; Lim, S.; Lee, J.G.; Lee, E.J.; Huh, J.H. Revealing biomass heterosis in the allodiploid xBrassicoraphanus, a hybrid between Brassica rapa and Raphanus sativus, through integrated transcriptome and metabolites analysis. BMC Plant Biol. 2020, 20, 252. [Google Scholar] [CrossRef] [PubMed]
  51. Von Well, E.; Fossey, A. A comparative investigation of seed germination, metabolism and seedling growth between two polyploid Triticum species. Euphytica 1998, 101, 83–89. [Google Scholar] [CrossRef]
  52. Yan, D.; Duermeyer, L.; Leoveanu, C.; Nambara, E. The functions of the endosperm during seed germination. Plant Cell Physiol. 2014, 55, 1521–1533. [Google Scholar] [CrossRef]
  53. The International Brachypodium Initiative. Genome sequencing and analysis of the model grass Brachypodium distachyon. Nature 2010, 463, 763–768. [Google Scholar] [CrossRef]
  54. Fujimoto, R.; Taylor, J.M.; Shirasawa, S.; Peacock, W.J.; Dennis, E.S. Heterosis of Arabidopsis hybrids between C24 and Col is associated with increased photosynthesis capacity. Proc. Natl. Acad. Sci. USA 2012, 109, 7109–7114. [Google Scholar] [CrossRef] [Green Version]
  55. Korn, M.; Peterek, S.; Mock, H.P.; Heyer, A.G.; Hincha, D.K. Heterosis in the freezing tolerance, and sugar and flavonoid contents of crosses between Arabidopsis thaliana accessions of widely varying freezing tolerance. Plant Cell Environ. 2008, 31, 813–827. [Google Scholar] [CrossRef] [Green Version]
  56. Song, G.S.; Zhai, H.L.; Peng, Y.G.; Zhang, L.; Wei, G.; Chen, X.Y.; Xiao, Y.G.; Wang, L.; Chen, Y.J.; Wu, B.; et al. Comparative transcriptional profiling and preliminary study on heterosis mechanism of super-hybrid rice. Mol. Plant 2010, 3, 1012–1025. [Google Scholar] [CrossRef]
  57. Bernard, S.M.; Habash, D.Z. The importance of cytosolic glutamine synthetase in nitrogen assimilation and recycling. New Phytol. 2009, 182, 608–620. [Google Scholar] [CrossRef]
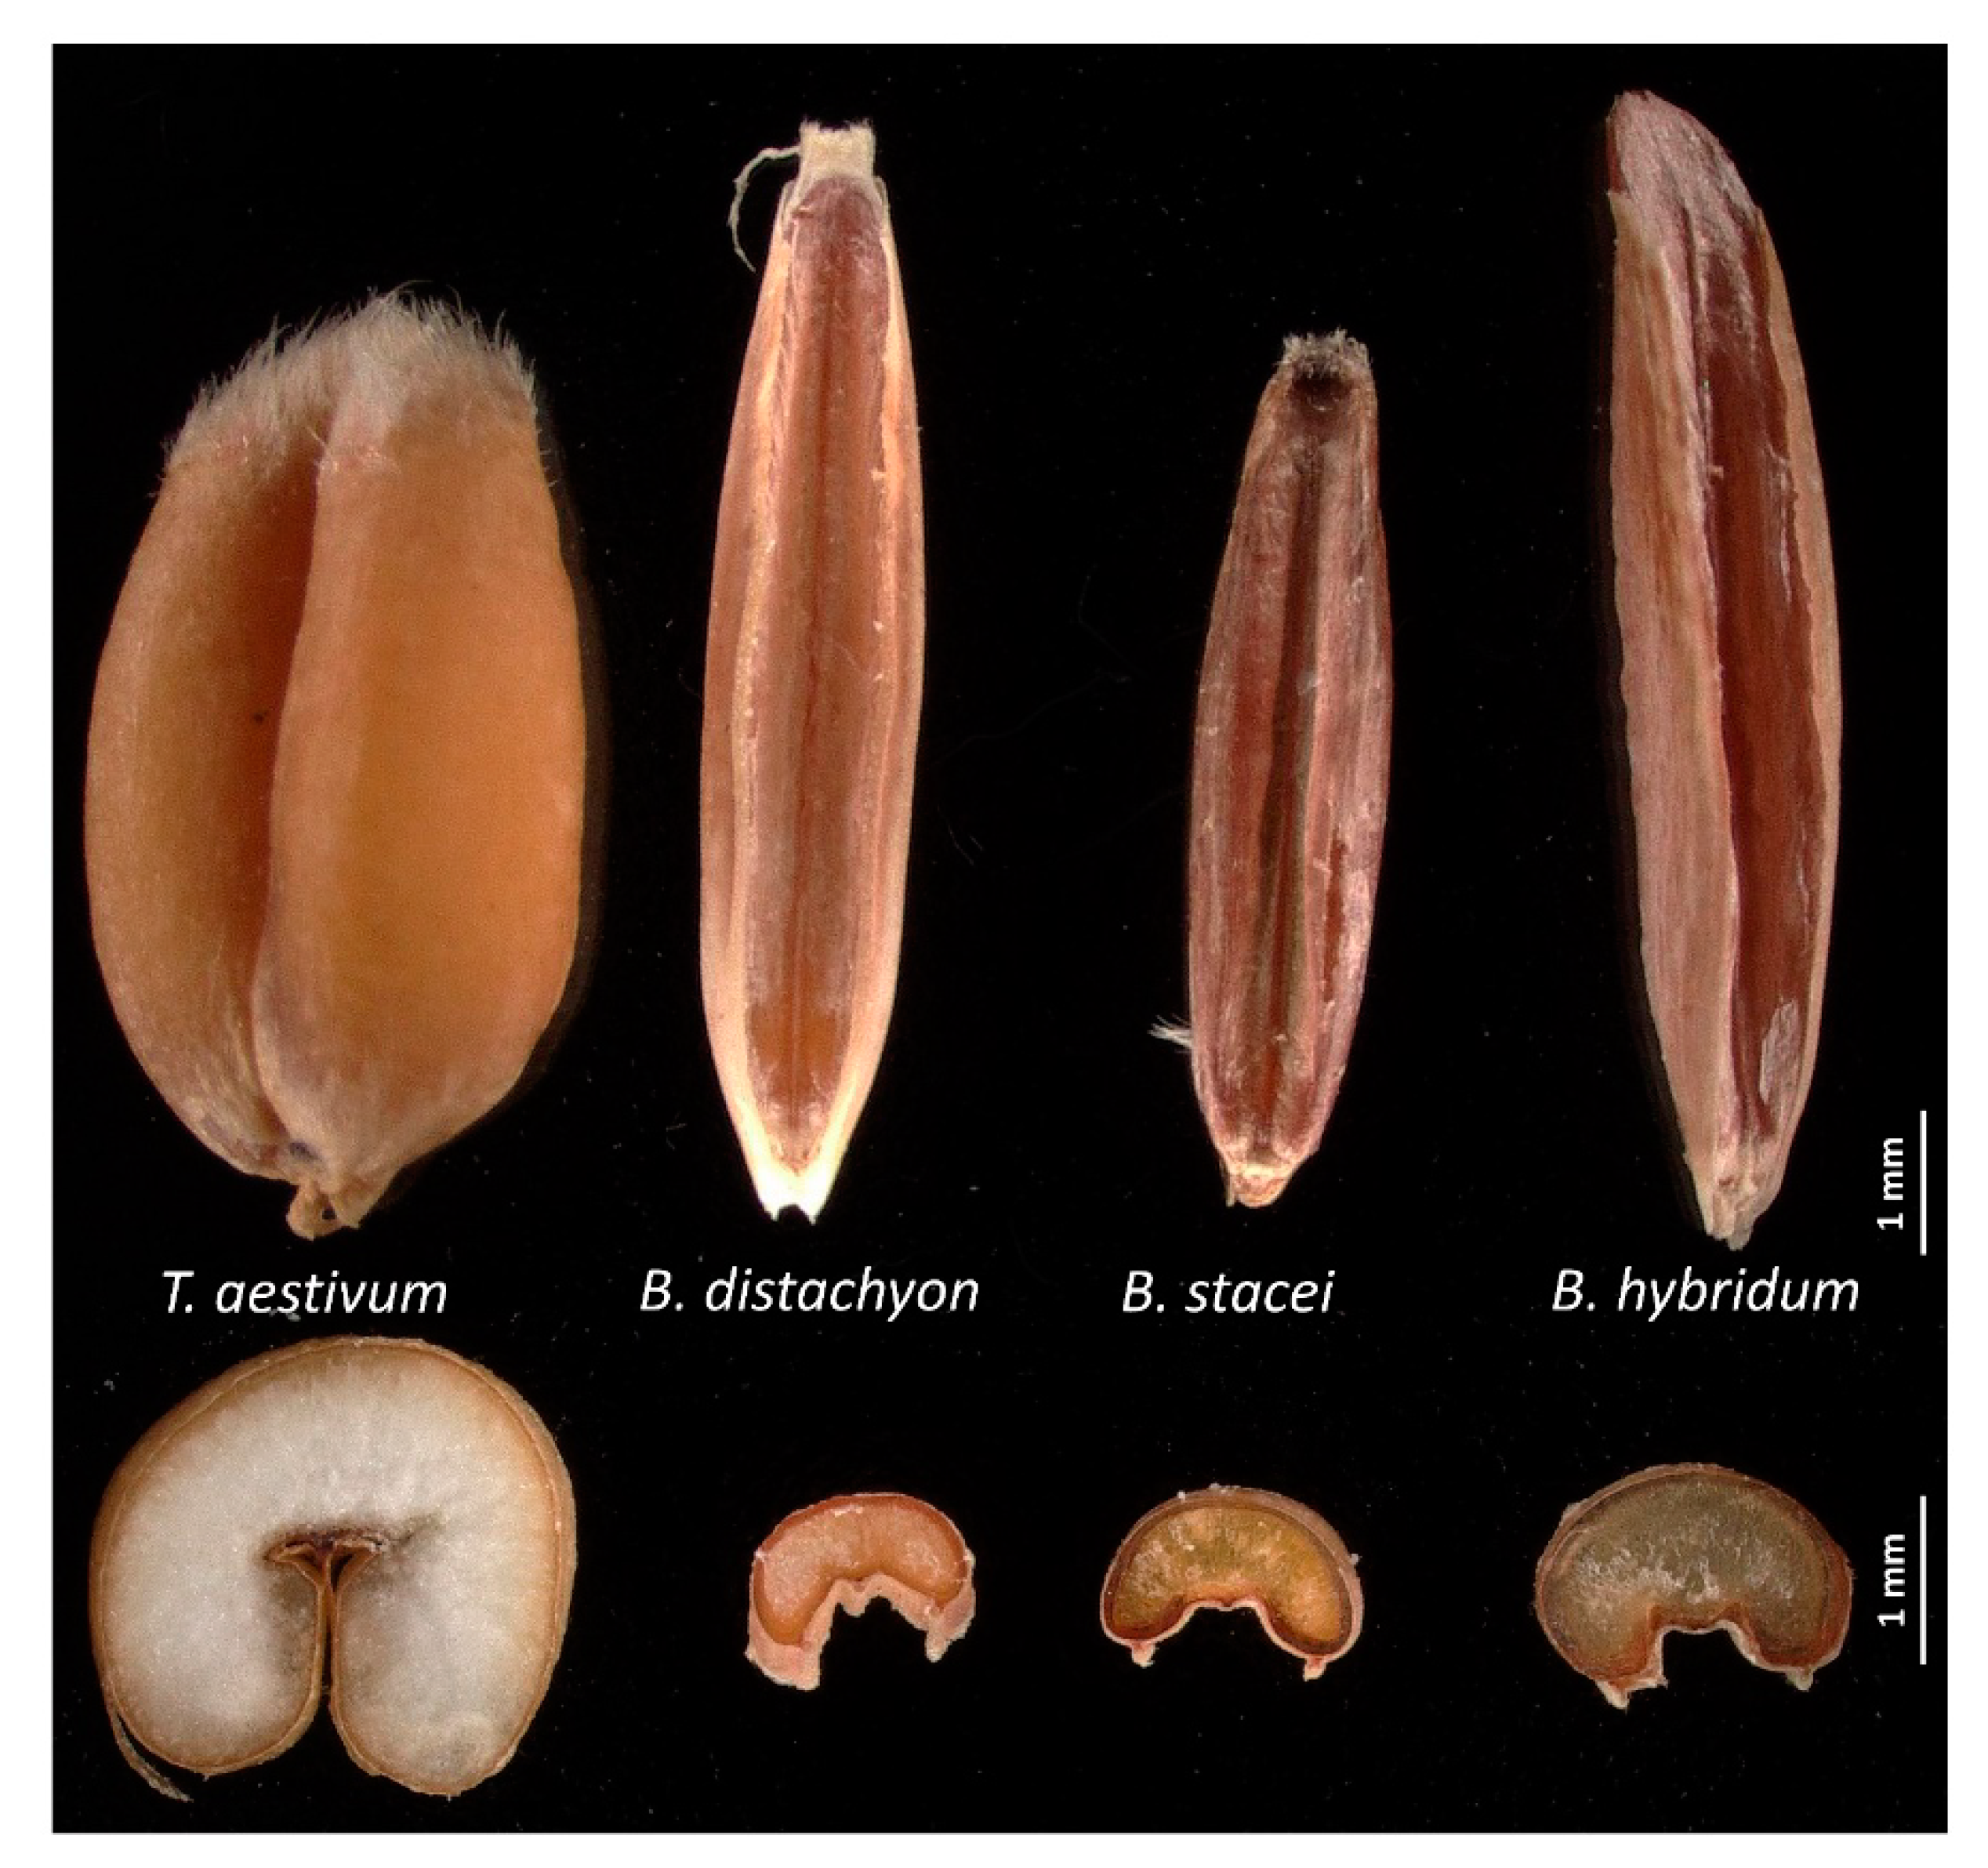
Figure 1. Grains of Brachypodium species Brachypodium distachyon Bd21 (Bd), Brachypodium stacei ABR114 (Bs) and Brachypodium hybridum ABR113 (BdBs) compared to wheat (Triticum aestivum). Images were from (top) grains where the lemma had been removed and (bottom) transversely sections from seeds. Note the large starchy endosperm in wheat that is greatly diminished in each Brachypodium species. Scale bars represent 1 mm.
Cells 10 00828 g001
Figure 2. PCA (principal component analysis) of embryo (Em) and endosperm (Es) metabolites in B. distachyon Bd21 (Bd), B. stacei ABR114 (Bs), and B. hybridum ABR113 (BdBs) at 4, 12, and 24 h after imbibition (HAI). PC 1: the first principal component; PC 2: the second principal component.
Cells 10 00828 g002
Figure 3. PCA of embryo metabolites in B. distachyon Bd21 (Bd), B. stacei ABR114 (Bs), and B. hybridum ABR113 (BdBs) at 4, 12, and 24 HAI.
Cells 10 00828 g003
Figure 4. (A) PCA and (B) partial least squares-discriminant analysis (PLS-DA) of endosperm metabolites in B. distachyon Bd21 (Bd), B. stacei ABR114 (Bs), and B. hybridum ABR113 (BdBs) at 4, 12 and 24 HAI.
Cells 10 00828 g004
Figure 5. Metabolomic variation in Brachypodium embryos during germination. (A) Heatmap of major sources of metabolite variation and (B) ANOVA–simultaneous component analysis showing effect estimates (genotype and time) in B. distachyon Bd21 (Bd), B. stacei ABR114 (Bs), and B. hybridum ABR113 (BdBs) at 4, 12, and 24 HAI.
Cells 10 00828 g005
Figure 6. Discriminatory sugar metabolites detected in Brachypodium embryos during germination. Metabolites are arranged in accordance with the Kyoto Encyclopedia of Genes and Genomes (KEGG) starch metabolism map (https://www.genome.jp/kegg-bin/show_pathway?map00052+C00492, accessed on 28 February 2021). Data show box and whisker comparison of B. distachyon Bd21 (Bd), B. stacei ABR114 (Bs), and B. hybridum ABR113 (BdBs) at 4, 12, and 24 HAI.
Cells 10 00828 g006
Figure 7. Oxalate metabolites in Brachypodium embryos during germination. Data show box and whisker comparison of B. distachyon Bd21 (Bd), B. stacei ABR114 (Bs), and B. hybridum ABR113 (BdBs) at 4, 12, and 24 HAI.
Cells 10 00828 g007
Figure 8. Metabolomic variation in Brachypodium endosperm during germination. (A) Heatmap of major sources of metabolite variation and (B) ANOVA–simultaneous component analysis showing effect estimates (genotype and time) in B. distachyon Bd21 (Bd), B. stacei ABR114 (Bs), and B. hybridum ABR113 (BdBs) at 4, 12, and 24 HAI.
Cells 10 00828 g008
Figure 9. Monolignol metabolites, which are significant sources of variation, in Brachypodium endosperm during germination. Data show box and whisker comparison of B. distachyon Bd21 (Bd), B. stacei ABR114 (Bs), and B. hybridum ABR113 (BdBs) at 4, 12, and 24 HAI. The arrangement of the plots reflect the associated between the metabolites, as indicated in https://www.genome.jp/kegg-bin/show_module?M00039 (accessed on 28 February 2021).
Cells 10 00828 g009
Publisher’s Note: MDPI stays neutral with regard to jurisdictional claims in published maps and institutional affiliations.