Article

The Uncovered Function of the Drosophila GBA1a-Encoded Protein

1
Shmunis School of Biomedicine and Cancer Research, Faculty of Life Sciences, Tel Aviv University, 69978 Ramat Aviv, Israel
2
Bioinformatics Unit, Faculty of life Science, Tel Aviv University, 69978 Ramat Aviv, Israel
3
Medical Biochemistry, Leiden Institute of Chemistry, Faculty of Science, Leiden University, 2333 CC Leiden, The Netherlands
*
Author to whom correspondence should be addressed.
Current Address: Department of Chemistry, Imperial College London, 82 Wood Lane, London W12 0BZ, UK.
Cells 2021, 10(3), 630; https://doi.org/10.3390/cells10030630
Submission received: 5 January 2021 / Revised: 8 March 2021 / Accepted: 9 March 2021 / Published: 12 March 2021
(This article belongs to the Special Issue Lysosomal Storage Disorders)

Abstract

:
Human GBA1 encodes lysosomal acid β-glucocerebrosidase (GCase), which hydrolyzes cleavage of the beta-glucosidic linkage of glucosylceramide (GlcCer). Mutations in this gene lead to reduced GCase activity, accumulation of glucosylceramide and glucosylsphingosine, and development of Gaucher disease (GD). Drosophila melanogaster has two GBA1 orthologs. Thus far, GBA1b was documented as a bone fide GCase-encoding gene, while the role of GBA1a encoded protein remained unclear. In the present study, we characterized a mutant variant of the fly GBA1a, which underwent ERAD and mildly activated the UPR machinery. RNA-seq analyses of homozygous mutant flies revealed upregulation of inflammation-associated as well as of cell-cycle related genes and reduction in programmed cell death (PCD)-associated genes, which was confirmed by qRT-PCR. We also observed compromised cell death in the midgut of homozygous larvae and a reduction in pupation. Our results strongly indicated that GBA1a-encoded protein plays a role in midgut maturation during larvae development.

1. Introduction

Human acid β-glucocerebrosidase (GCase) is encoded by the GBA1 gene, mutations in which lead to reduced GCase activity, accumulation of glucosylceramide (GlcCer) and glucosylsphingosine (GlcSph), and development of Gaucher disease (GD). GD is the most common lysosomal storage disorder (LSD), with more than 700 GBA1 associated mutations (300 mutations were published [1]), and 739 mutations appear in the gnomAD browser (gnomad.broadinstitute.org).
In Drosophila, there are two GBA1 orthologs, GBA1a (CG31148) and GBA1b (CG31414); both are located on chromosome 3. They are ~2 Kb (3R: 23,700,621–23,702,605) and ~4 Kb in size (3R: 23,704,804–23,708,512), respectively, and are separated by a non-relevant gene (CG31413) (FlyBase.org). The sequences of GBA1a and GBA1b encoded proteins share ~50% similarity with the human GCase, and the two catalytic amino acids, which determine GCase activity, are identical between human GCase and fly GBA1a and GBA1b proteins (E235 and E340 in human GCase [2], E298 and E405 in both fly GBA1-encoded proteins). The same is true for five of the six amino acids that stabilize the substrate in the active pocket of GCase (Table 1). While expression of GBA1a is mostly restricted to bodies, GBA1b mRNA is the major species expressed in heads (FlyBase.org) [3,4,5].
Several publications have already described the consequences of mutations in the GBA1b gene, which ultimately indicated that it encodes a bona-fide lysosomal GCase [3,4,5,6,7].
Despite the high similarity between the sequences of the two Drosophila GBA1 proteins, it is still unclear whether GBA1a protein has any GCase-like activity. Kinghorn et al. [3] found that deletion of GBA1a did not affect GCase activity nor substrate accumulation. Additionally, in GBA1a RNAi knock-down (KD), no change was observed in climbing abilities or in lifespan of the flies [6]. In a previous study, we documented that flies, expressing a GBA1a protein lacking 33 C-terminal amino acids, showed no reduction in GCase activity and no substrate accumulation in either bodies or heads [5]. On the other hand, other publications documented GCase activity, encoded by the GBA1a ortholog. Thus, Suzuki et al. [7] observed 91% reduction in GCase activity in brains of flies expressing RNAi against GBA1a. Davis et al. [4] noted almost normal GBA1a-encoded-GCase activity in bodies of flies, which had no GBA1b expression and a 33 C-terminal amino acids deletion of their GBA1a encoded GCase.
Interestingly, KD of GBA1a led to a delay in midgut development due to delayed autophagy-mediated cell death (autosis), indicating a role for GBA1a in midgut development [8].
To further unravel the role of GBA1a in Drosophila, and to test whether it has a function in development progression, we used a GBA1a mutant line that carries a Minos transposable element in this gene, such that the mutant protein lacks 33 C-terminal amino acids (Figure 1A,B).
Our results indicated that mutant GBA1a-encoded protein mildly activated UPR, upregulated inflammation, and downregulated PCD-related genes, which culminated in retarded midgut maturation during early pupation.

2. Materials and Methods

2.1. Antibodies

The following primary antibodies were used in this study: mouse monoclonal anti-myc antibody (1:1000 for WB; Cell Signaling Technology, Inc., Denver, MA, USA); rabbit polyclonal anti-Erk antibodies (Santa Cruz Biotechnology, Santa Cruz, CA, USA). The secondary antibodies used were: Horseradish peroxidase-conjugated goat anti-mouse antibodies (1:5000 for WB; Jackson ImmunoResearch Laboratories, West Grove, PA, USA) and horseradish peroxidase-conjugated goat anti-rabbit antibodies (1:10,000 for WB; Jackson ImmunoResearch Laboratories, West Grove, PA, USA).

2.2. Construction of Plasmids

To create plasmids expressing myc-tagged, normal or mutant Drosophila GBA1a variants in mycHispcDNA4 plasmid (Invitrogen Life-Technologies, Carlsbad, CA, USA), pUASTmycHis-GBA1a and pUASTmycHis-GBA1am [9] plasmids were digested with EcoRI and XhoI and the myc-His containing inserts were cloned between the EcoRI and the XhoI sites of pcDNA4, as previously described [5].

2.3. Cells and Transfections

HEK293T cells (ATCC® CRL-11268™) were grown in Dulbecco’s Modified Eagle’s Medium (DMEM; Gibco BRL, Waltham, CA, USA), supplemented with 10% FCS (Biological Industries, Beit-Haemek, Israel) at 37 °C, in the presence of 5% CO2. Cells were transfected using calcium phosphate solutions, as described elsewhere [10].

2.4. Fly Strains

Fly Strains were maintained on standard cornmeal-molasses medium and kept at 25 °C. All experiments were performed in isogenic w1118 background (which was also used as a control) (Bloomington Drosophila Stock Center, Indiana University, Bloomington, IN, USA). Strains harboring a Minos transposable element in GBA1a (Mi{ET1}CG31148) or GBA1b (Mi{ET1}CG31414) were obtained from Bloomington Stock Center (Bloomington, IN, USA) (Nos. 23602 and 23435, respectively). The balanced lines used in this study were: w1118;Sco/Cyo;GBA1am/TM6b,Sb (GBA1am/+) or w1118;Sco/Cyo;GBA1am/GBA1am (GBA1am/m).

2.5. MG132 (Carbobenzoxy-L-Leucyl-L-Leucyl-L-Leucinal) Treatment

HEK293T cells were treated with 15 mM of MG132 (Calbiochem, San Diego, CA, USA) for 20 h.

2.6. RNA Preparation

For RNA extraction from flies, adult flies were frozen in liquid nitrogen and then homogenized in TRIzol® Reagent (Life Technologies, Carlsbad, CA, USA), according to the manufacturer’s instructions.
For RNA extraction from larval midgut, animals were collected at the beginning of puparium formation. Four hours later (+4 h RPF), guts were dissected in cold PBS and transferred into 200 µL TRIzol® Reagent containing tubes.

2.7. RT-PCR

One microgram of RNA was reverse-transcribed with MMLV reverse transcriptase (Promega Corporation, Madison, CA, USA), using oligo-dT primer (Integrated DNA Technologies, Coralville, Iowa, USA) in a total volume of 25 µL, at 42 °C for 60 min. Reactions were stopped by incubation at 70 °C for 15 min.

2.8. Quantitative Real Time PCR (qRT-PCR)

Two microliters of cDNA were used for real time PCR. PCR was performed using the “power SYBR green QPCR mix reagent” kit (Applied Biosystems, Foster City, CA, USA), by Rotor-Gene 6000. The reaction mixture contained 5 µL of SYBR green mix, 300 nM of forward primer, and 300 nM of reverse primer, in a final volume of 10 µL. Thermal cycling conditions were: 95 °C (10 min), and 40 cycles of: 95 °C (10 s), 60 °C (20 s), and 72 °C (20 s). Relative gene expression was determined by Ct value and normalized to that of rp49 gene. All primers used for the analyses are detailed in Table 2.

2.9. Transcriptomic Sequencing and Analysis

The Illumina RNA sequencing was performed at the Crown Institute for Genomics, the Weizmann Institute of Science, Rehovot, Israel. Briefly, cDNAs were prepared from RNA samples, extracted from bodies and heads of 12-day-old flies using in house protocol. For each line (w1118, GBA1am/+, GBA1am/m), triplicates of fifty flies each were used. Samples were sequenced on two lanes of Illumina HiSeq 2500 machine, using the Single-Read 60 protocol. The output was ~15 million reads per sample. Reads were trimmed using cutadapt (https://cutadapt.readthedocs.io/en/stable/) and mapped to Drosophila melanogaster BDGP6 genome (downloaded from Ensembl genomes) using STAR v2.4.2a [11] [(https://code.google.com/archive/p/rna-star/) default parameters]. Counting proceeded over genes annotated in Ensembl release 31 (http://metazoa.ensembl.org/Drosophila_melanogaster/Info/Index) using htseq-count (https://htseq.readthedocs.io/en/release_0.11.1/) (intersection-strict mode). Differential expression analysis was performed using DESeq2 [12] (doi:10.1186/s13059-014-0550-8) with the betaPrior, cooksCutoff and independentFiltering parameters set to False. Raw P values were adjusted for multiple testing using the procedure of Benjamini and Hochberg [13]. Pipeline was constructed using Snakemake (https://snakemake.readthedocs.io/en/v3.9.1/). Gene lists were created by filtering the genes based on an absolute linear fold change ≥ 2, p ≤ 0.05, and reads ≥ 30. To view gene lists as a heat map, the Morpheos tool was used (https://software.broadinstitute.org/morpheus/). Gene lists were analyzed for enriched pathways using the GO enrichment analysis tool (http://geneontology.org) (The Gene Ontology Consortium, CC-BY 4.0). All programs were accessed between: March 2017–September 2020.

2.10. Labeling with Activity-Based Probes (ABPs)

Fifty micrograms of protein, extracted from bodies or heads of flies, were incubated with ME569 epoxide (0.5 µM for identification of GCase activity), β-aziridine JJB367 (0.5 µM for identification of GBA1, GBA2, GBA3 activity), TB474 (1 µM for identification of α-galactosidase activity), TB652 (1 µM for identification of β-galactosidase activity), TB482 (3 µM for identification of α-mannosidase activity), TB434 (1 µM for identification of β-mannosidase activity), JJB383 (0.5 µM for identification of α-glucosidase activity) or JJB392 (0.5 µM for identification of β-glucuronidase activity), synthesized at the Department of Bio-Organic Synthesis at Leiden University, as described elsewhere [14,15,16,17,18,19,20], in McIlvaine’s buffer at pH 5.0 (150 mM citric acid−Na2HPO4, pH 5.0) for 30 min at 37 °C. The samples were electrophoresed through 10% SDS-PAGE. Gels were developed by Typhoon FLA 9500 scanner (GE Healthcare, Little Chalfont, UK), capturing Alexa647/Cy5, using PMT 750 V and 100 μm pixel size or by Amersham imager 600 (Amersham, Buckinghamshire, UK).

2.11. Measurement of Body Fluid Volume

To measure the body fluid volume, 100 adult females were anesthetized, decapitated, and perforated at their thorax, using insect pins (0.15 mm, Fine Sciences Tools, Heidelberg, Germany). The flies were collected in 0.2 mL PCR tubes. Each PCR tube contained no more than 50 flies. A small aperture was made at the bottom of the PCR tube with a needle, after which it was placed in a 1.5 mL Eppendorf tube and centrifuged at 10,000× g for 10 min at 4 °C. The fluid was collected in 1.5 mL Eppendorf tubes and the volume was measured with a Hamilton syringe (Hamilton Company, Reno, NV, USA).

2.12. Midgut Morphology and Quantification

Animals were staged and collected at the beginning of puparium formation (0 h relative puparium formation; RPF) and four hours later (+4 h RPF). Midguts were dissected in PBS, fixed in 4% paraformaldehyde in PBS, mounted onto glass slides using Fluorescent mounting medium (GBI labs, Bothell, WA, USA) and imaged using a fluorescent Olympus IX53 microscope (Olympus, Tokyo, Japan) with no filters. Digital images were obtained using cellSens Entry software (Olympus, Tokyo, Japan). Measurements of gastric caeca size were performed using ImageJ software for 10–12 midguts per genotype. Gastric caeca edges were traced and pixel densities were determined using the histogram tool.

2.13. Developmental Regulation

For assessing survival rate during development, ten, third instar larvae from each line, were collected into a new cornmeal-molasses medium containing tube, held at 25 °C or at 29 °C. For calculating the percentage of pupae formation, the number of pupae from each line was counted at day four after the initial collection and their number was divided with that of larvae in each tube. For calculating the percentage of enclosed adult flies, their number from each line was counted at day eight after the initial collection and was divided by that of the pupae in each tube. For each line, 10–15 tubes were analyzed at 25 °C and at 29 °C.

2.14. Climbing Assay

Climbing behavior of adult flies was measured using a countercurrent apparatus, essentially as described elsewhere [21]. Briefly, groups of approximately 30 flies (both males and females) were given 10 min to adapt in the starting tube, which can slide along the apparatus and then 20 s to move upwards against gravity to the upper frame’s tube. The top frame of tubes was then shifted to the right so that the start tube comes into register with a second bottom tube and flies, which successfully climbed up, were tapped down again, falling into tube 2. The upper frame was then returned to the left and the flies were once again allowed to climb into the upper tube. After five runs, the number of flies in each tube was counted. For each time point, at least four cohorts from each genotype were scored. The Climbing Index (CI) was calculated using the following formula: CI (the weighted mean) =  Σ(mnm)/N. CI ranges from 1 (min) to 6 (max).

2.15. Survival Assay

For each fly strain, ten vials, each containing five males and five females, were maintained on food from day one post-eclosion. Fresh food was supplied every other day and deaths were recorded. Kaplan-Meier analyses were performed.

2.16. Egg-Laying Experiment

Virgins and males were collected and kept on standard molasses-cornmeal media at 25 °C. Each vial contained females and males from the same genotype (i.e., males and females of GBA1am/m and w1118). Four to five days later, ten males and ten females of each genotype were transferred to five mm, 4% sucrose agar plates with additional sprinkled yeast paste. Plates were cupped by perforated plastic chamber for two hours, followed by eggs counting and transferred to new five mm agar plates. 24 h later, the number of hatching larvae was counted.

2.17. Statistical Analysis

Data are expressed as mean ± standard error of the mean (SEM). Unpaired t-test (two-tailed p value) was used for comparisons of means between the two groups (control versus GBA1am/m or control versus GBA1am/+). Microsoft Office Excel 2016 was used for all statistical calculations. Values with p < 0.05 were considered significant. Kaplan-Meier analysis was performed using XLSTAT software (Addinsoft, NY, USA, 2020.4).

3. Results

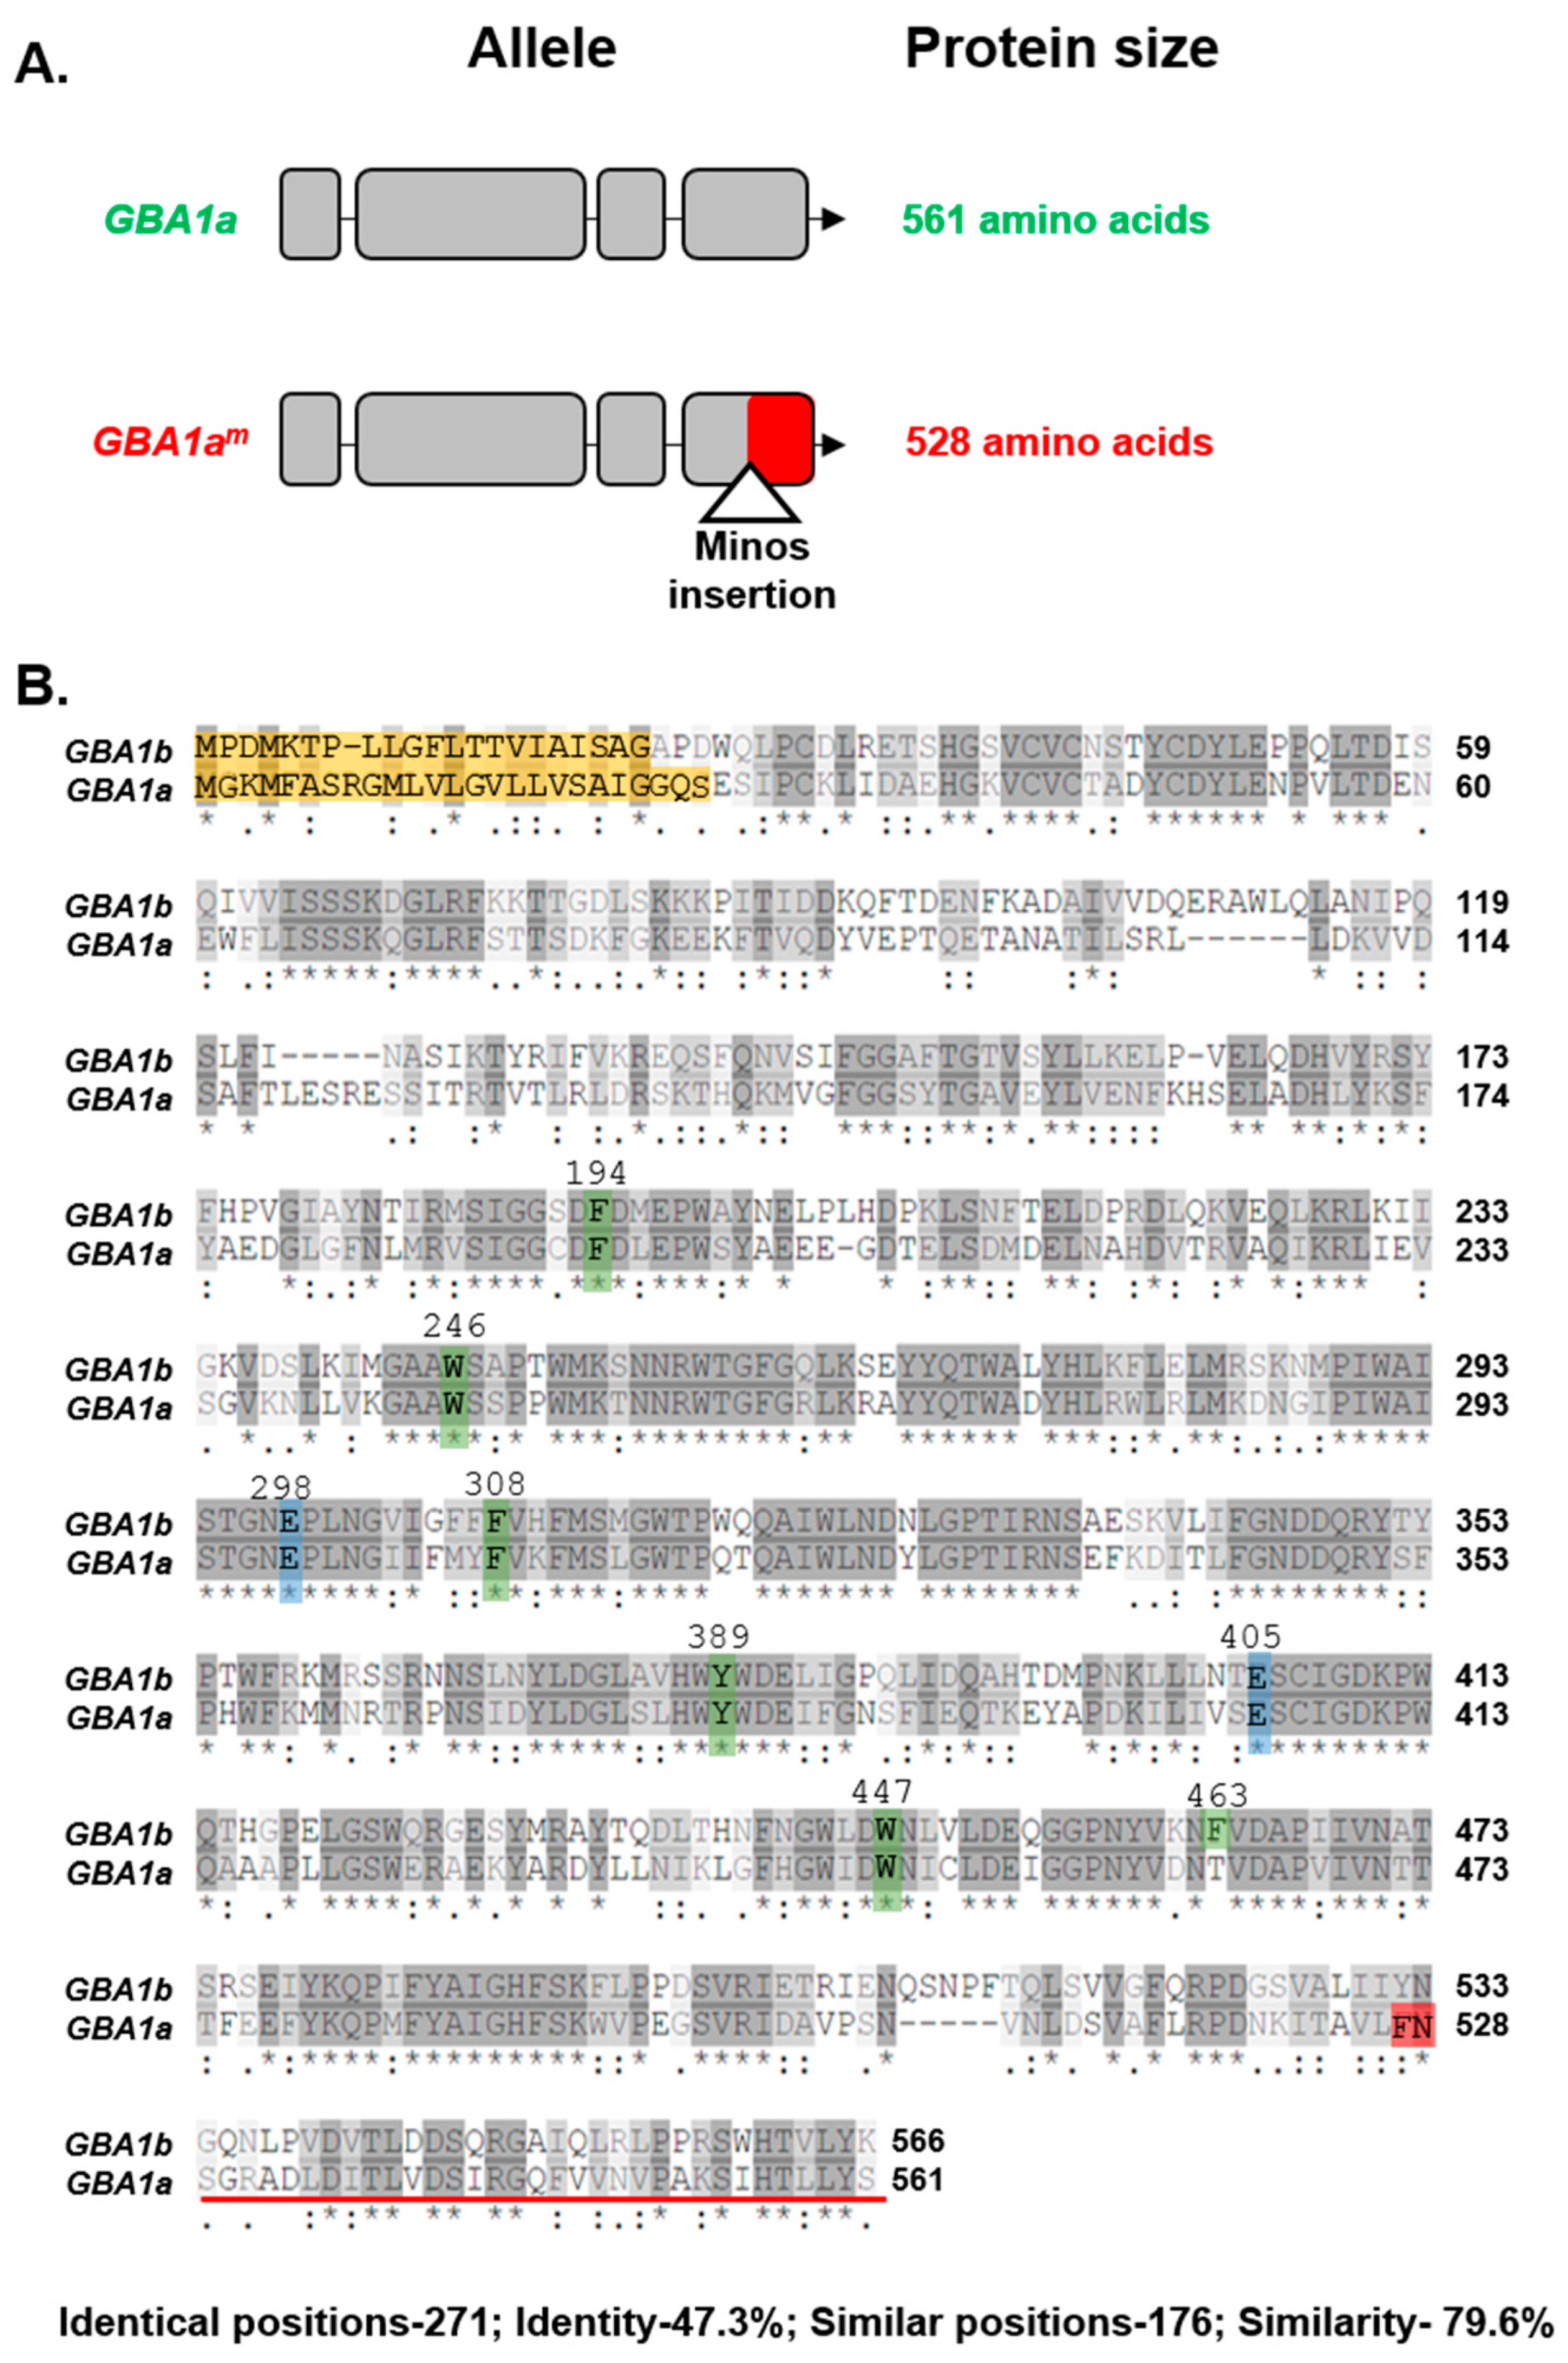
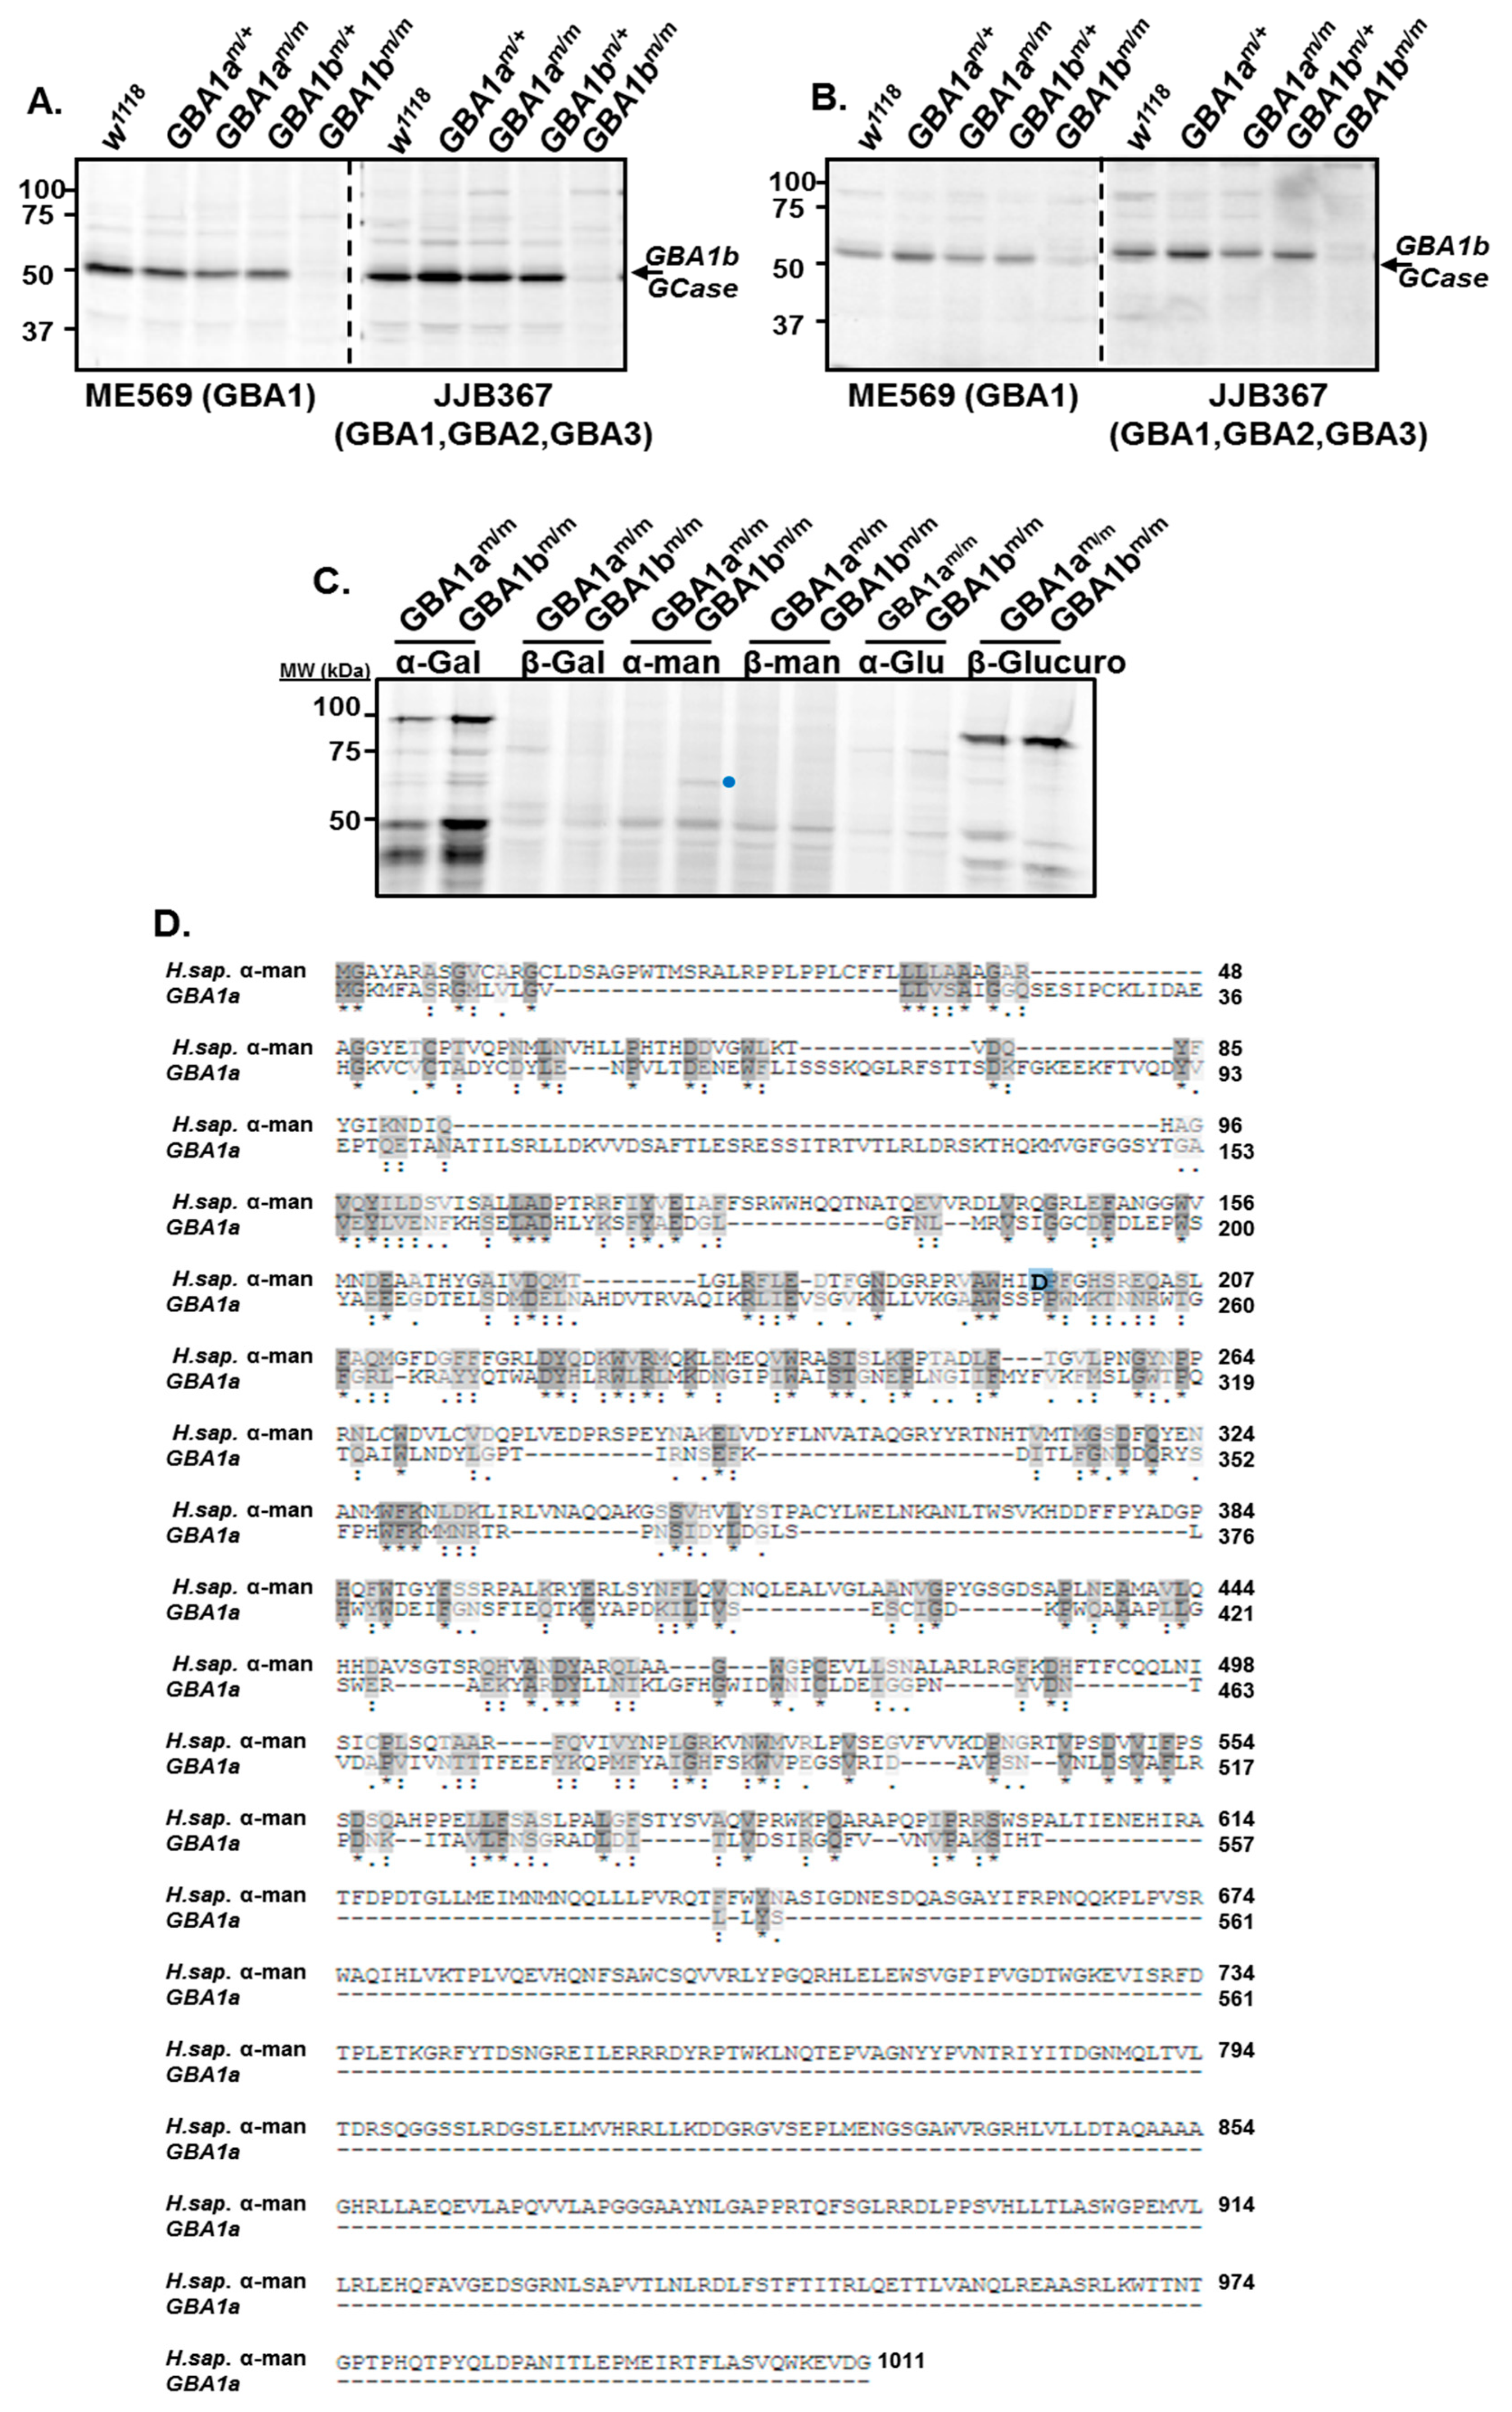
3.1. Activity of GBA1a-Encoded Protein

Multiple sequence alignment of Drosophila GBA1a and GBA1b proteins revealed 47% identity and 80% similarity between them, with a 100% identity between the amino acids constituting their active site (Table 1, Figure 1B). Nevertheless, we could not detect a GBA1a-encoded GCase activity using a GCase specific substrate or GCase-specific fluorescently labeled ABP [5] that covalently and irreversibly interacts with GBA1-encoded β-glucosidase and can be followed on SDS–PAGE [15]. GBA1a-encoded protein did not present any beta glucosidase activity (GBA1, GBA2, GBA3), analyzed using β-aziridine JJB367 [14] as a general probe to detect GBA-encoded protein (Figure 2A,B). To test the possibility that GBA1a-encoded protein has another activity, we used fluorescently labeled ABPs specific for different active glycosidases. Lysates prepared from GBA1am/m and GBA1bm/m flies (GBA1bm/m flies have no GBA1b-encoded GCase activity, therefore only GBA1a-encoded activity can be tested in them), were incubated with ABPs specific for: α-galactosidase (TB474) [16], β-galactosidase (TB652) [20], α-mannosidase (TB482) [17], β-mannosidase (TB434) [20], α-glucosidase (JJB383) [18], and β-glucuronidase (JJB392) [19] (Figure 2C). The results indicated a possible interaction of a 61 kDa protein in the GBA1bm/m derived lysate but not in the GBA1am/m derived lysate with the α-mannosidase specific ABP. The molecular weight coincided with the predicted molecular weight of GBA1a-encoded mature protein (http://www.bioinformatics.org/sms/prot_mw.html). BLAST analysis (https://www.uniprot.org/blast/) (EMBL-EBI, Cambridge, UK, May 2018) disclosed 25% similarity between GBA1a and α-mannosidase encoded proteins (Figure 2D). Therefore, we concluded that the band observed in the GBA1bm/m derived lysate is not α-mannosidase. Taken together, the results argued that the GBA1a derived protein does not have any of the tested glycosidase activity.

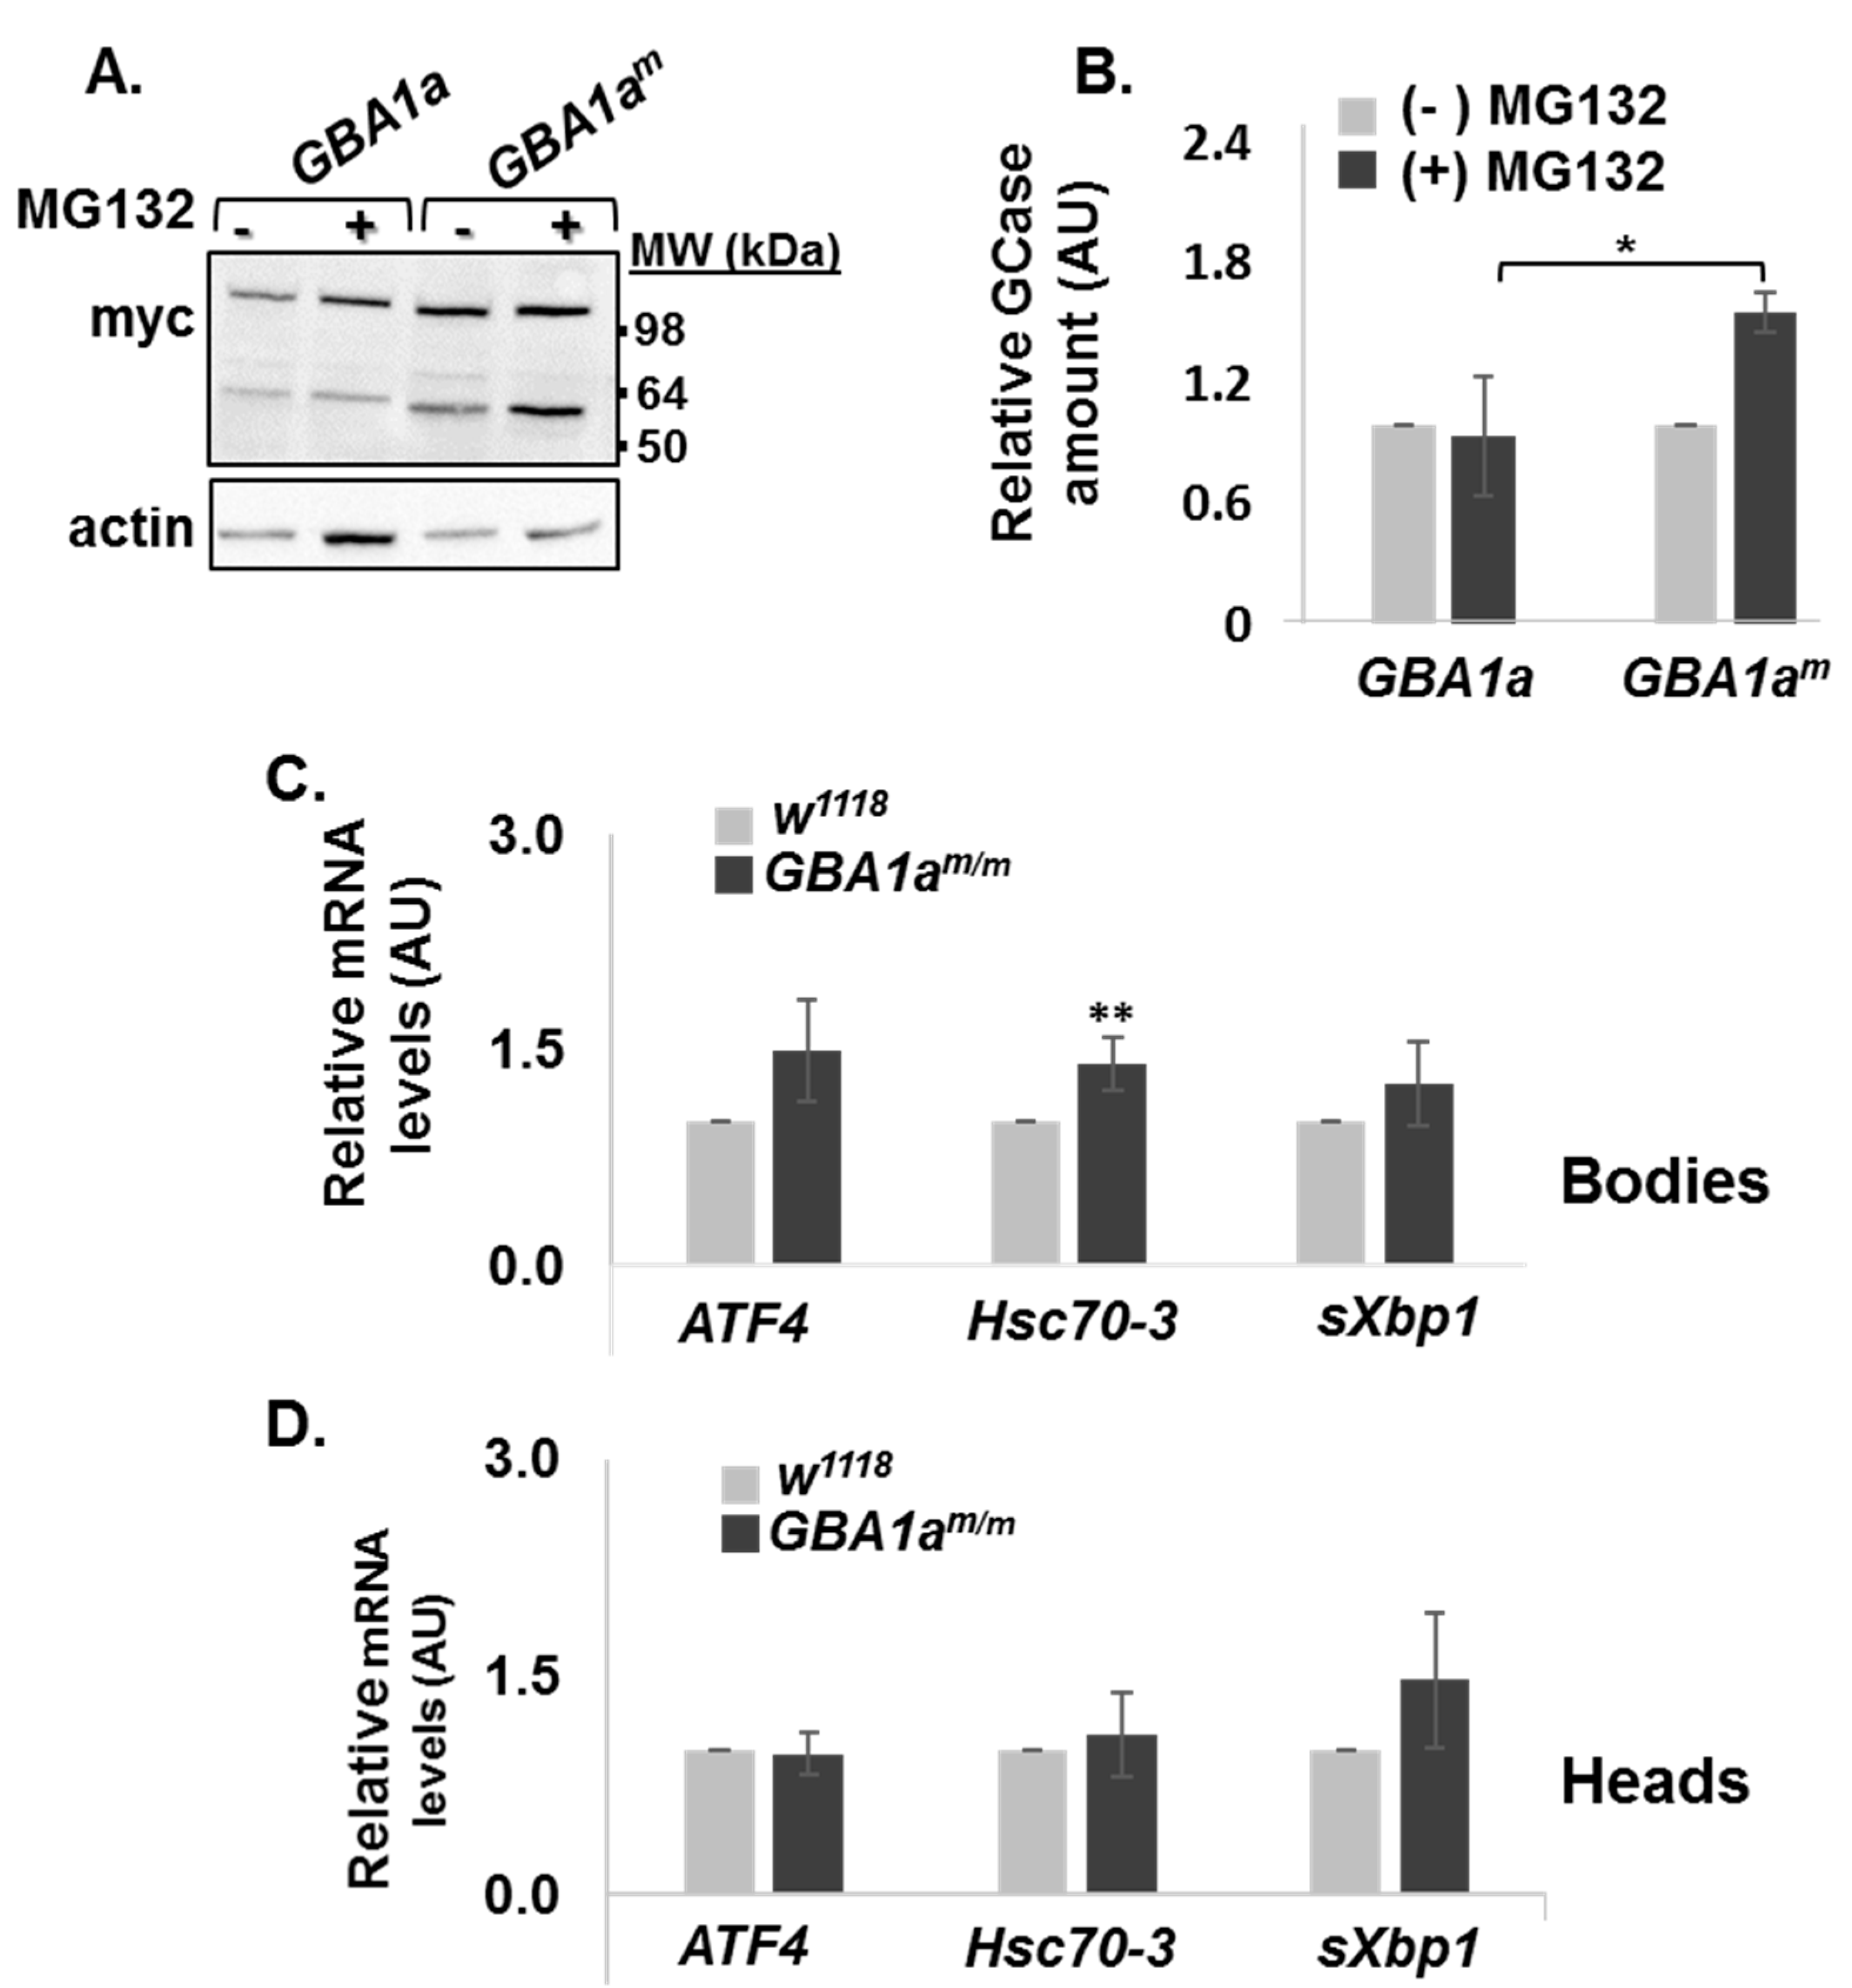
3.2. ERAD and UPR Activation in GBA1am/m Flies

The results did not reveal any lysosomal function for GBA1a-encoded protein; however, we tested whether its mutant form leads to activation of UPR and of ERAD, like the fly GBA1bm ortholog [5] and the human GBA1-encoded GCase [22,23,24]. With no available anti GBA1a-encoded protein antibodies and with difficulties to grow flies in the presence of a proteasome inhibitor, we tested ERAD of GBA1a-encoded protein in transfected HEK293T cells expressing the normal or the mutant variants of GBA1a, treated with the proteasome inhibitor MG132 (Figure 3A,B). The results indicated 70% increase in the amount of mutant GBA1a encoded protein (GBA1am) in the presence of the proteasome inhibitor, arguing that GBA1am protein undergoes ERAD. As expected, GBA1a-encoded protein appeared as two peptides, the upper one represents most probably a dimer, that is unstable under strong reducing conditions [5].
To test UPR activation in GBA1am/m flies, mRNA levels of the fly BiP ortholog (Hsc70-3) [25] and ATF4 [26] as well as splicing of Xbp1 [27] were tested by qRT-PCR (CHOP does not exist in Drosophila). The results indicated a mild and significant elevation in the expression level of Hsc70-3 in bodies of 18-day old GBA1am/m flies (Figure 3C). We did not observe a significant increase in UPR-related genes in heads of GBA1am/m flies (Figure 3D), as expected, since GBA1a is hardly expressed in heads (http://flybase.org/) [3,5].
Taken together, the results reflected mild UPR activation, a pathological condition triggered by the expression of mutant GBA1am-encoded protein in the ER.

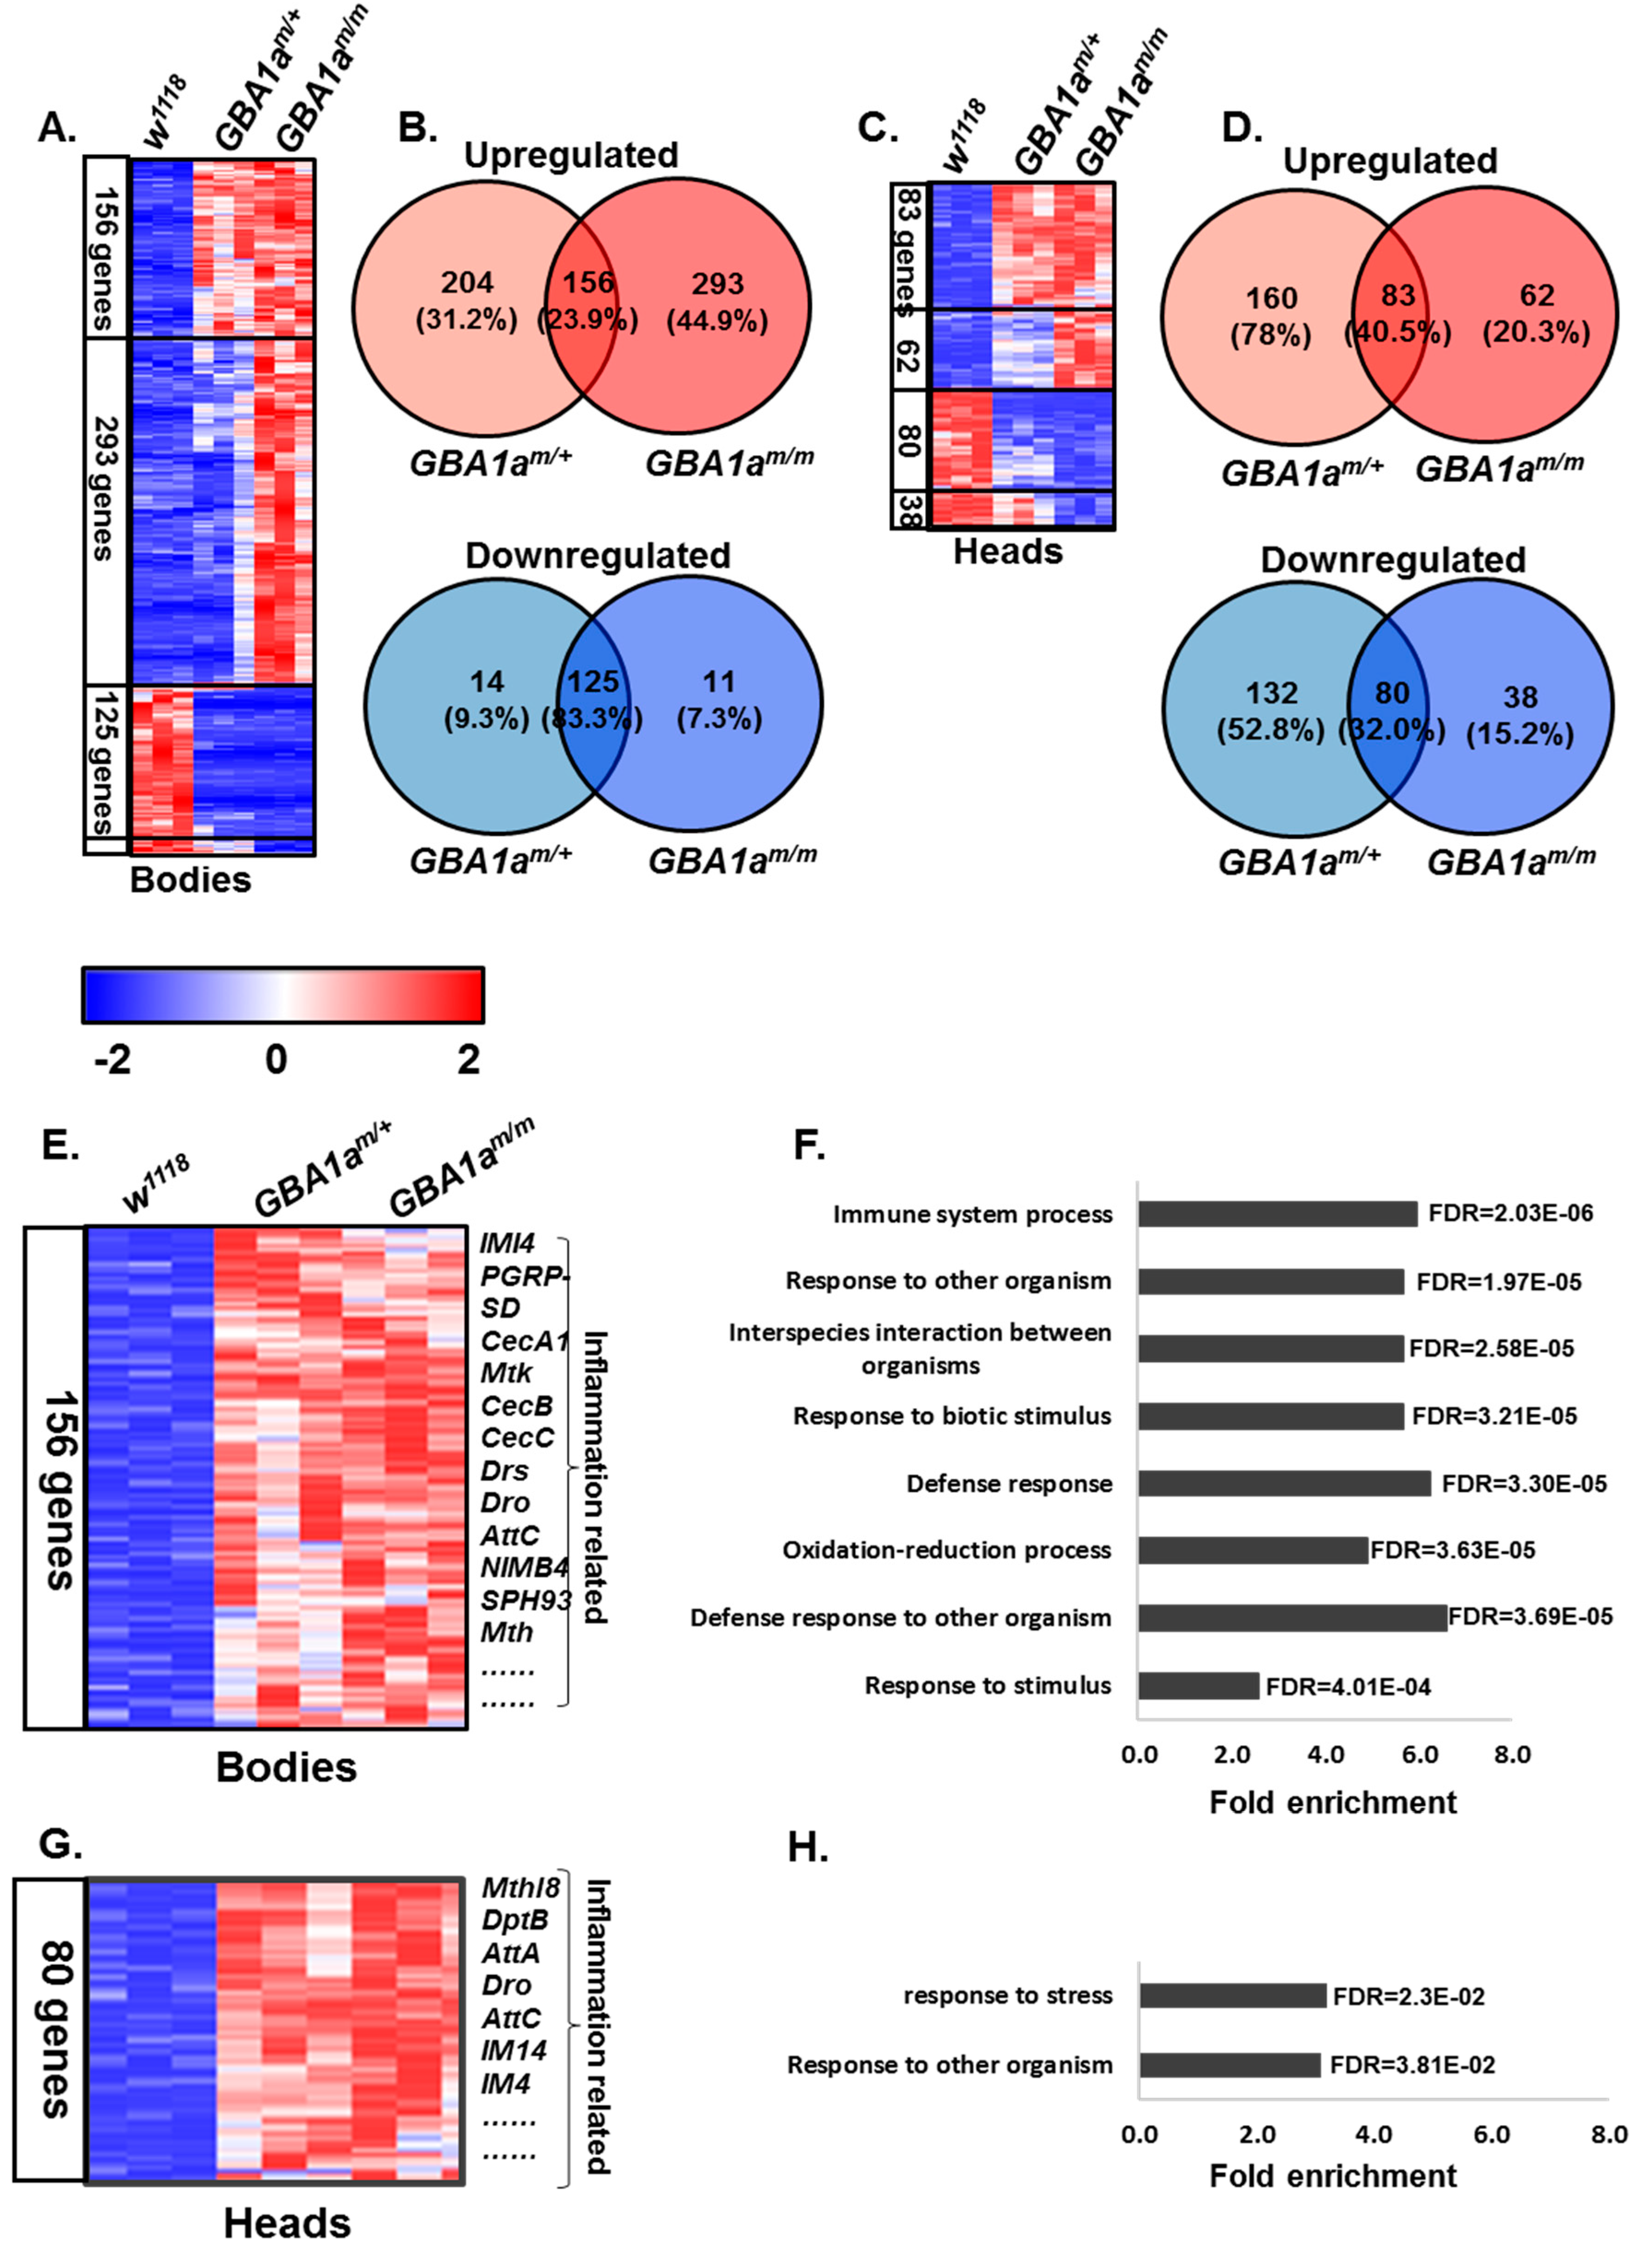
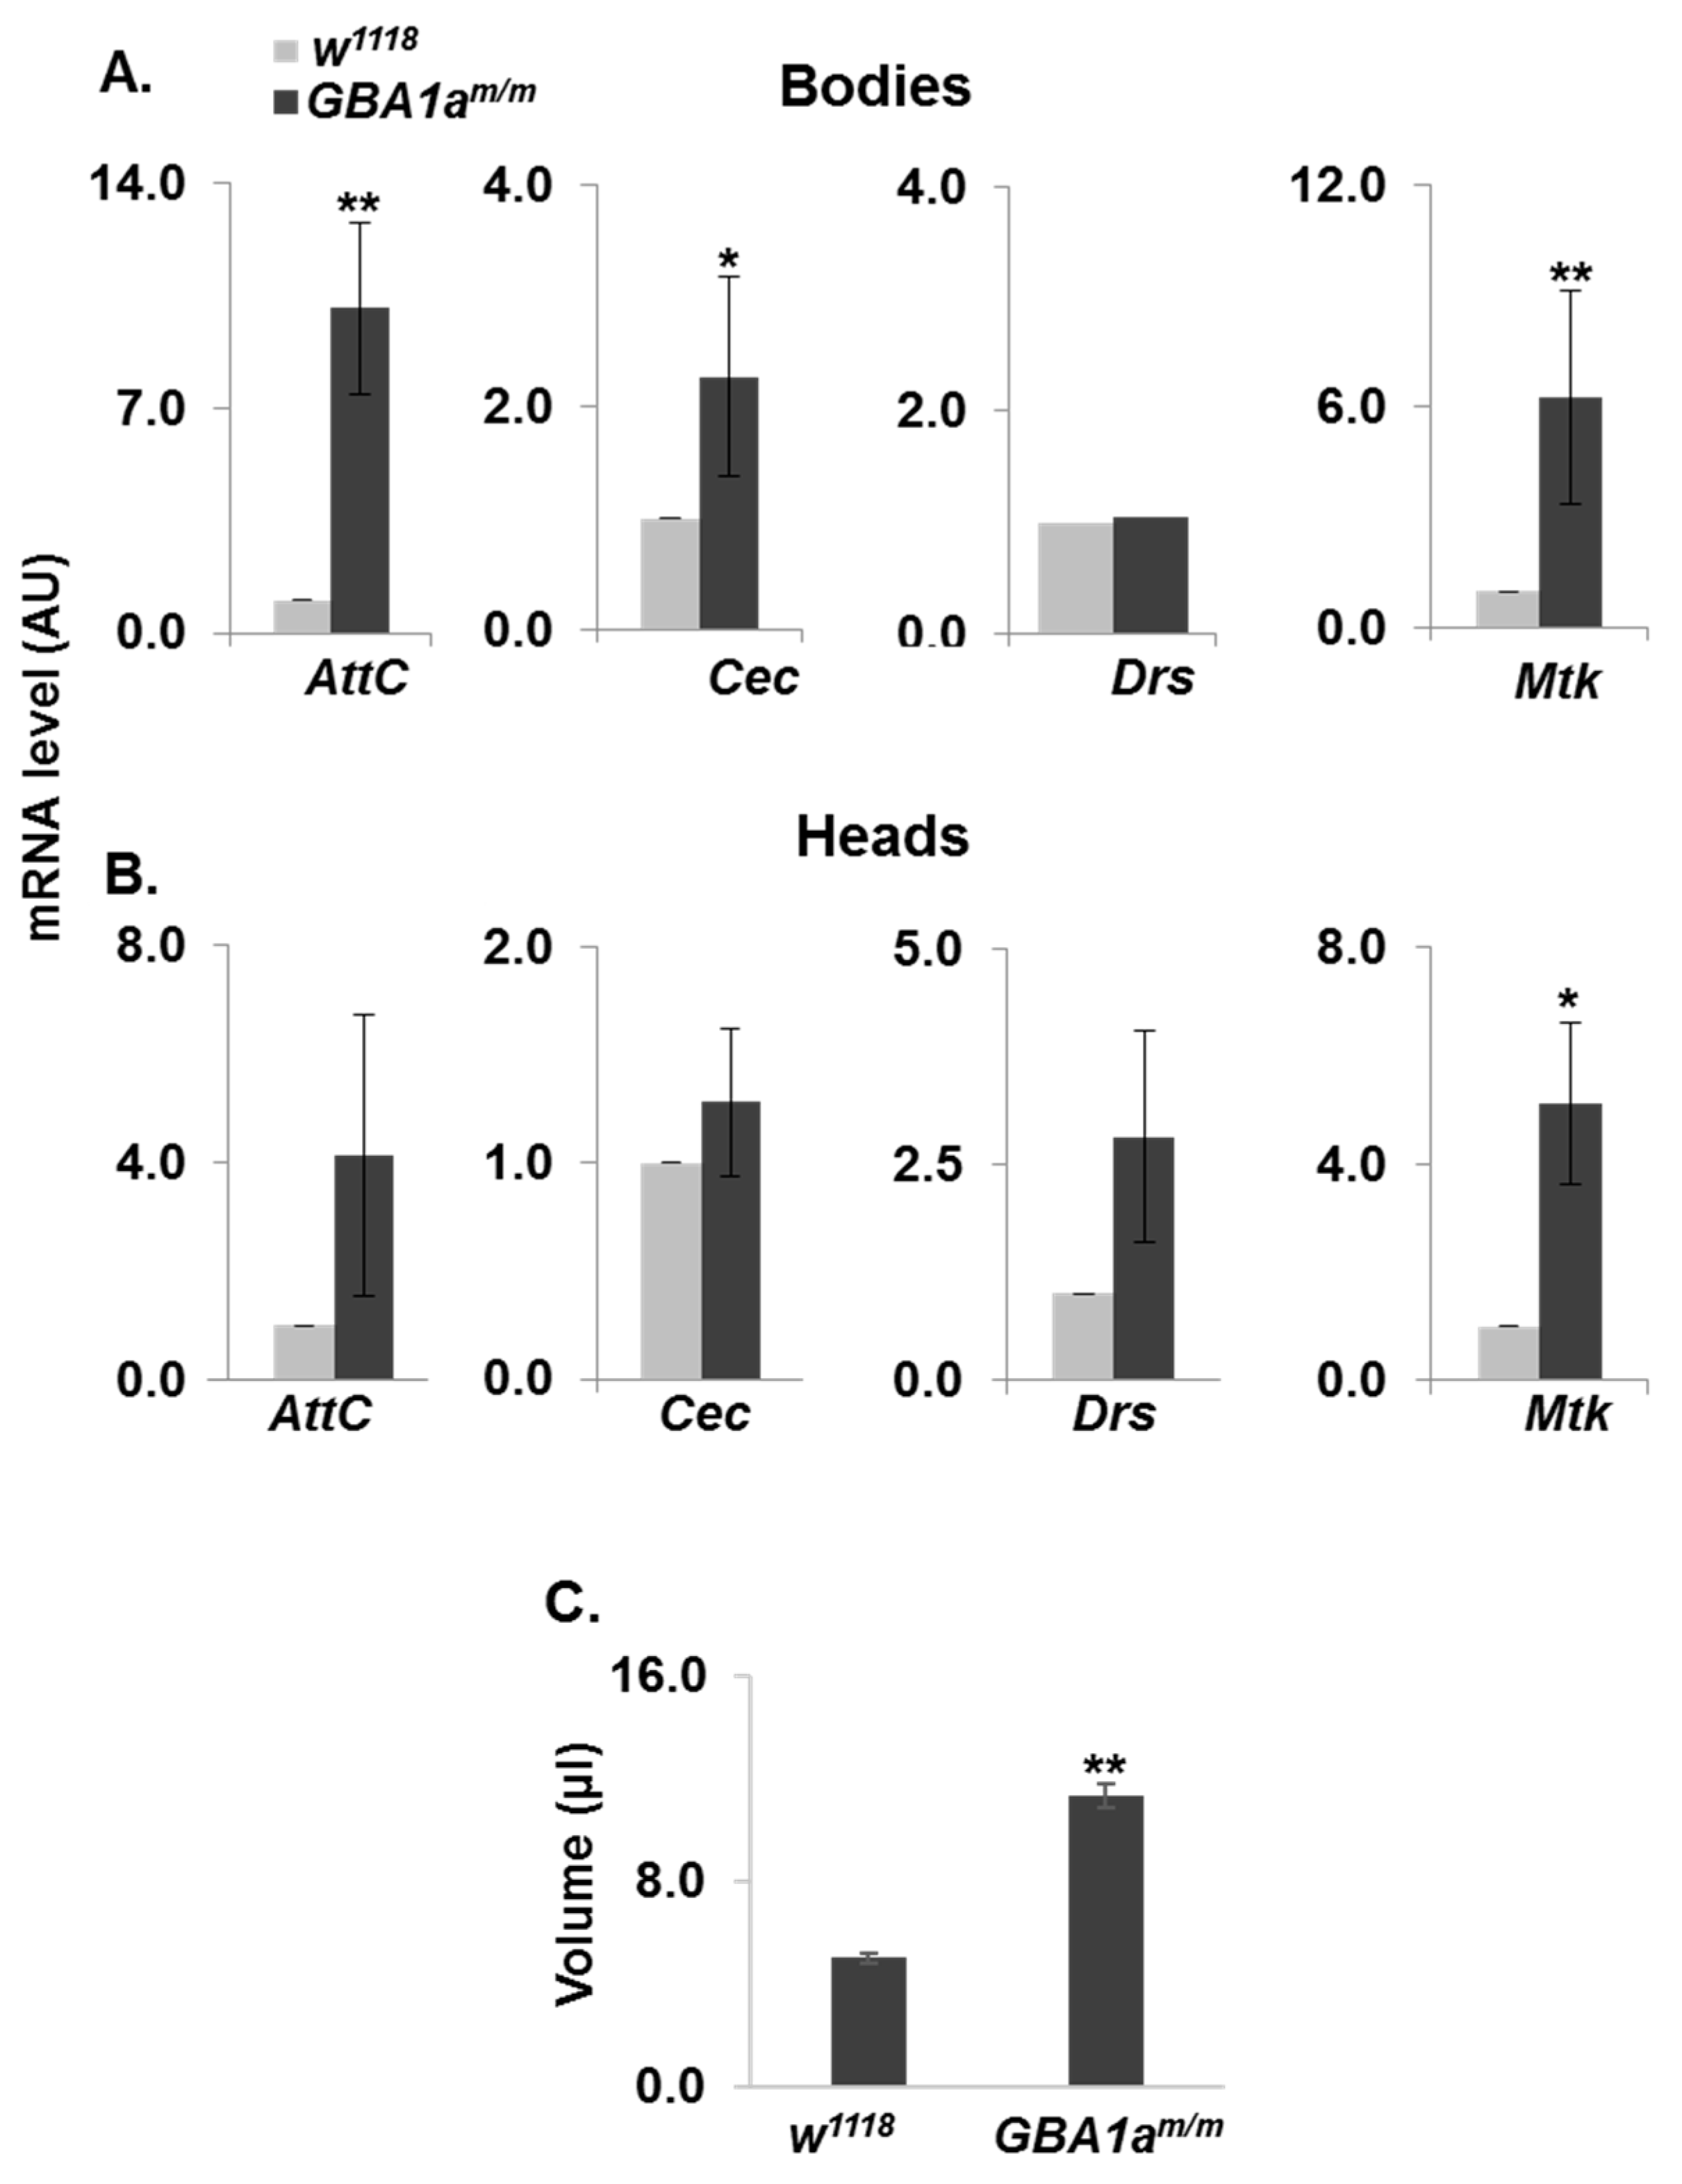
3.3. Inflammation in GBA1am/m Flies

Activation of inflammation is well documented in LSDs [28,29,30,31]. This could result from the lysosomal storage of undegraded substrate. However, other processes, like UPR, may lead to inflammation [26,32,33,34]. Since we documented mild UPR activation in the GBA1am/m flies, we tested possible inflammation in these flies.
Transcriptomic analysis was performed on 12-day-old flies, to test whether inflammation and other related pathways are enriched in the GBA1am/m flies. 449 genes were upregulated in bodies of GBA1am/m flies, out of which 156 were upregulated in bodies of heterozygous flies as well (Figure 4A,B, Tables S1 and S2). 145 genes were upregulated in heads of the homozygous GBA1am/m flies out of which 83 were also upregulated in heterozygous heads (Figure 4C,D). As predicted by the GO enrichment analysis tool (http://geneontology.org/) (The Gene Ontology Consortium, CC-BY 4.0) genes that were upregulated in GBA1am/m and in GBA1am/+ flies presented enrichment of inflammation related pathways (Figure 4E,F). A slight elevation in inflammation related pathways was also noted in GBA1am/m and GBA1am/+ heads (Figure 4G,H).
To validate upregulation of inflammation in the GBA1am/m mutant flies, we measured the levels of antimicrobial peptides (AMPs), which are known markers for innate immune response in Drosophila [35]. For that, we measured the mRNA levels of four AMPs by qRT-PCR analysis (Figure 5A,B). The results showed a significant elevation in three out of the four tested markers, in bodies of 18-day-old GBA1am/m flies. Only Mtk level was significantly elevated in heads, which reflects a much lower degree of immune response in heads of GBA1am/m flies, due to low expression level of GBA1a in heads. The volume of body fluids in 12-day-old mutant females and in age-matched controls was measured, since inflammation in flies is displayed by water retention [36], a phenotype that is more prominent in adult females than in adult males. The volume of GBA1am/m body fluids was about twice that of age-matched normal females (Figure 5C), pointing to the presence of inflammation.

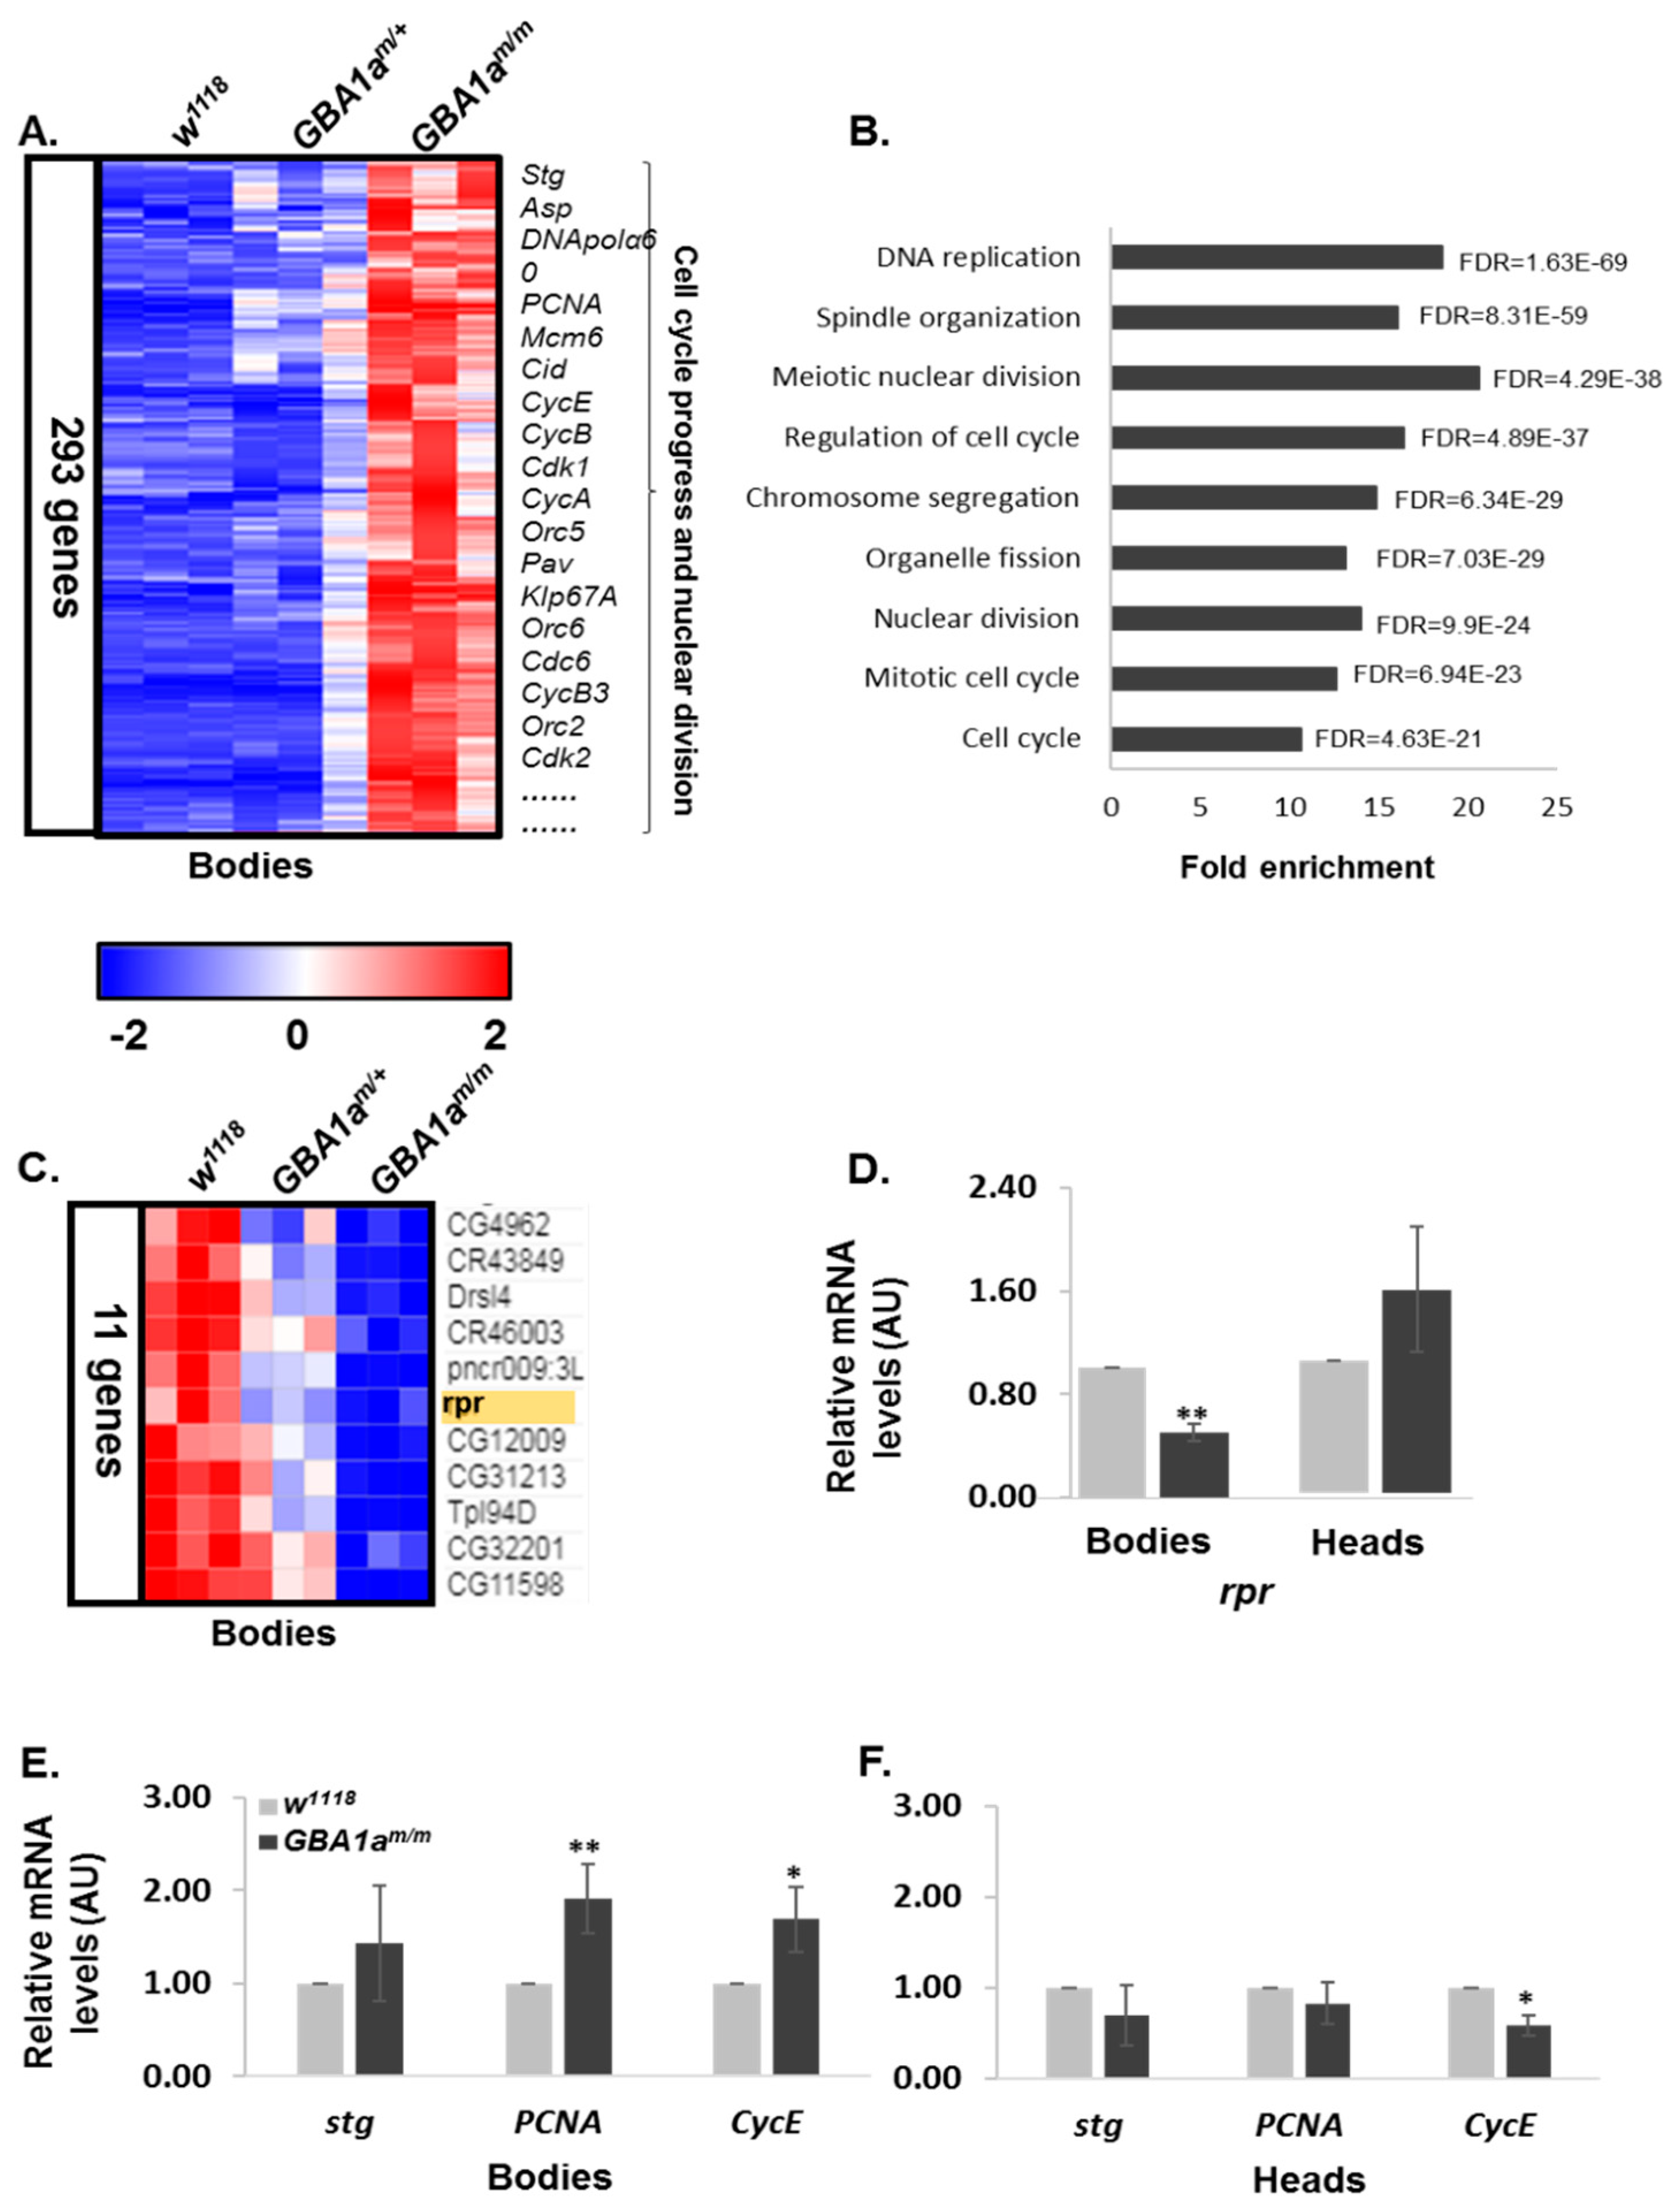
3.4. Enriched Pathways in GBA1am/m Flies

As mentioned, transcriptomic analysis, performed on homozygous, heterozygous, and control flies revealed 449 genes that were upregulated in bodies of GBA1am/m flies, out of which 156 genes were upregulated in heterozygous and 293 genes were exclusive to homozygous flies (Figure 4A,B, Figure 6A and Tables S3 and S4). High enrichment in pathways related to cell cycle progress and nuclear division was observed (Figure 6B). Eleven genes were downregulated in bodies, with a slight reduction in heterozygous flies as well (Figure 6C). Among these genes was reaper (rpr), a known PCD gene (Figure 6C) [27,37]. According to the gene ontology tool, and as expected, no significant pathway enrichment was noted in heads of the flies.
In order to validate the data, qRT-PCR analyses were performed with primers specific to reaper and to three markers of mitosis progression, which were upregulated according to the transcriptomic analyses: string (stg), proliferating cell nuclear antigen (PCNA), and cyclin e (CycE) [38,39]. The results revealed a significant reduction in the level of reaper and a significant elevation in levels of PCNA and CycE in bodies of GBA1am/m flies (Figure 6D,E).
To summarize, our data strongly indicated enrichment in cell-cycle related genes in GBA1am/m flies.

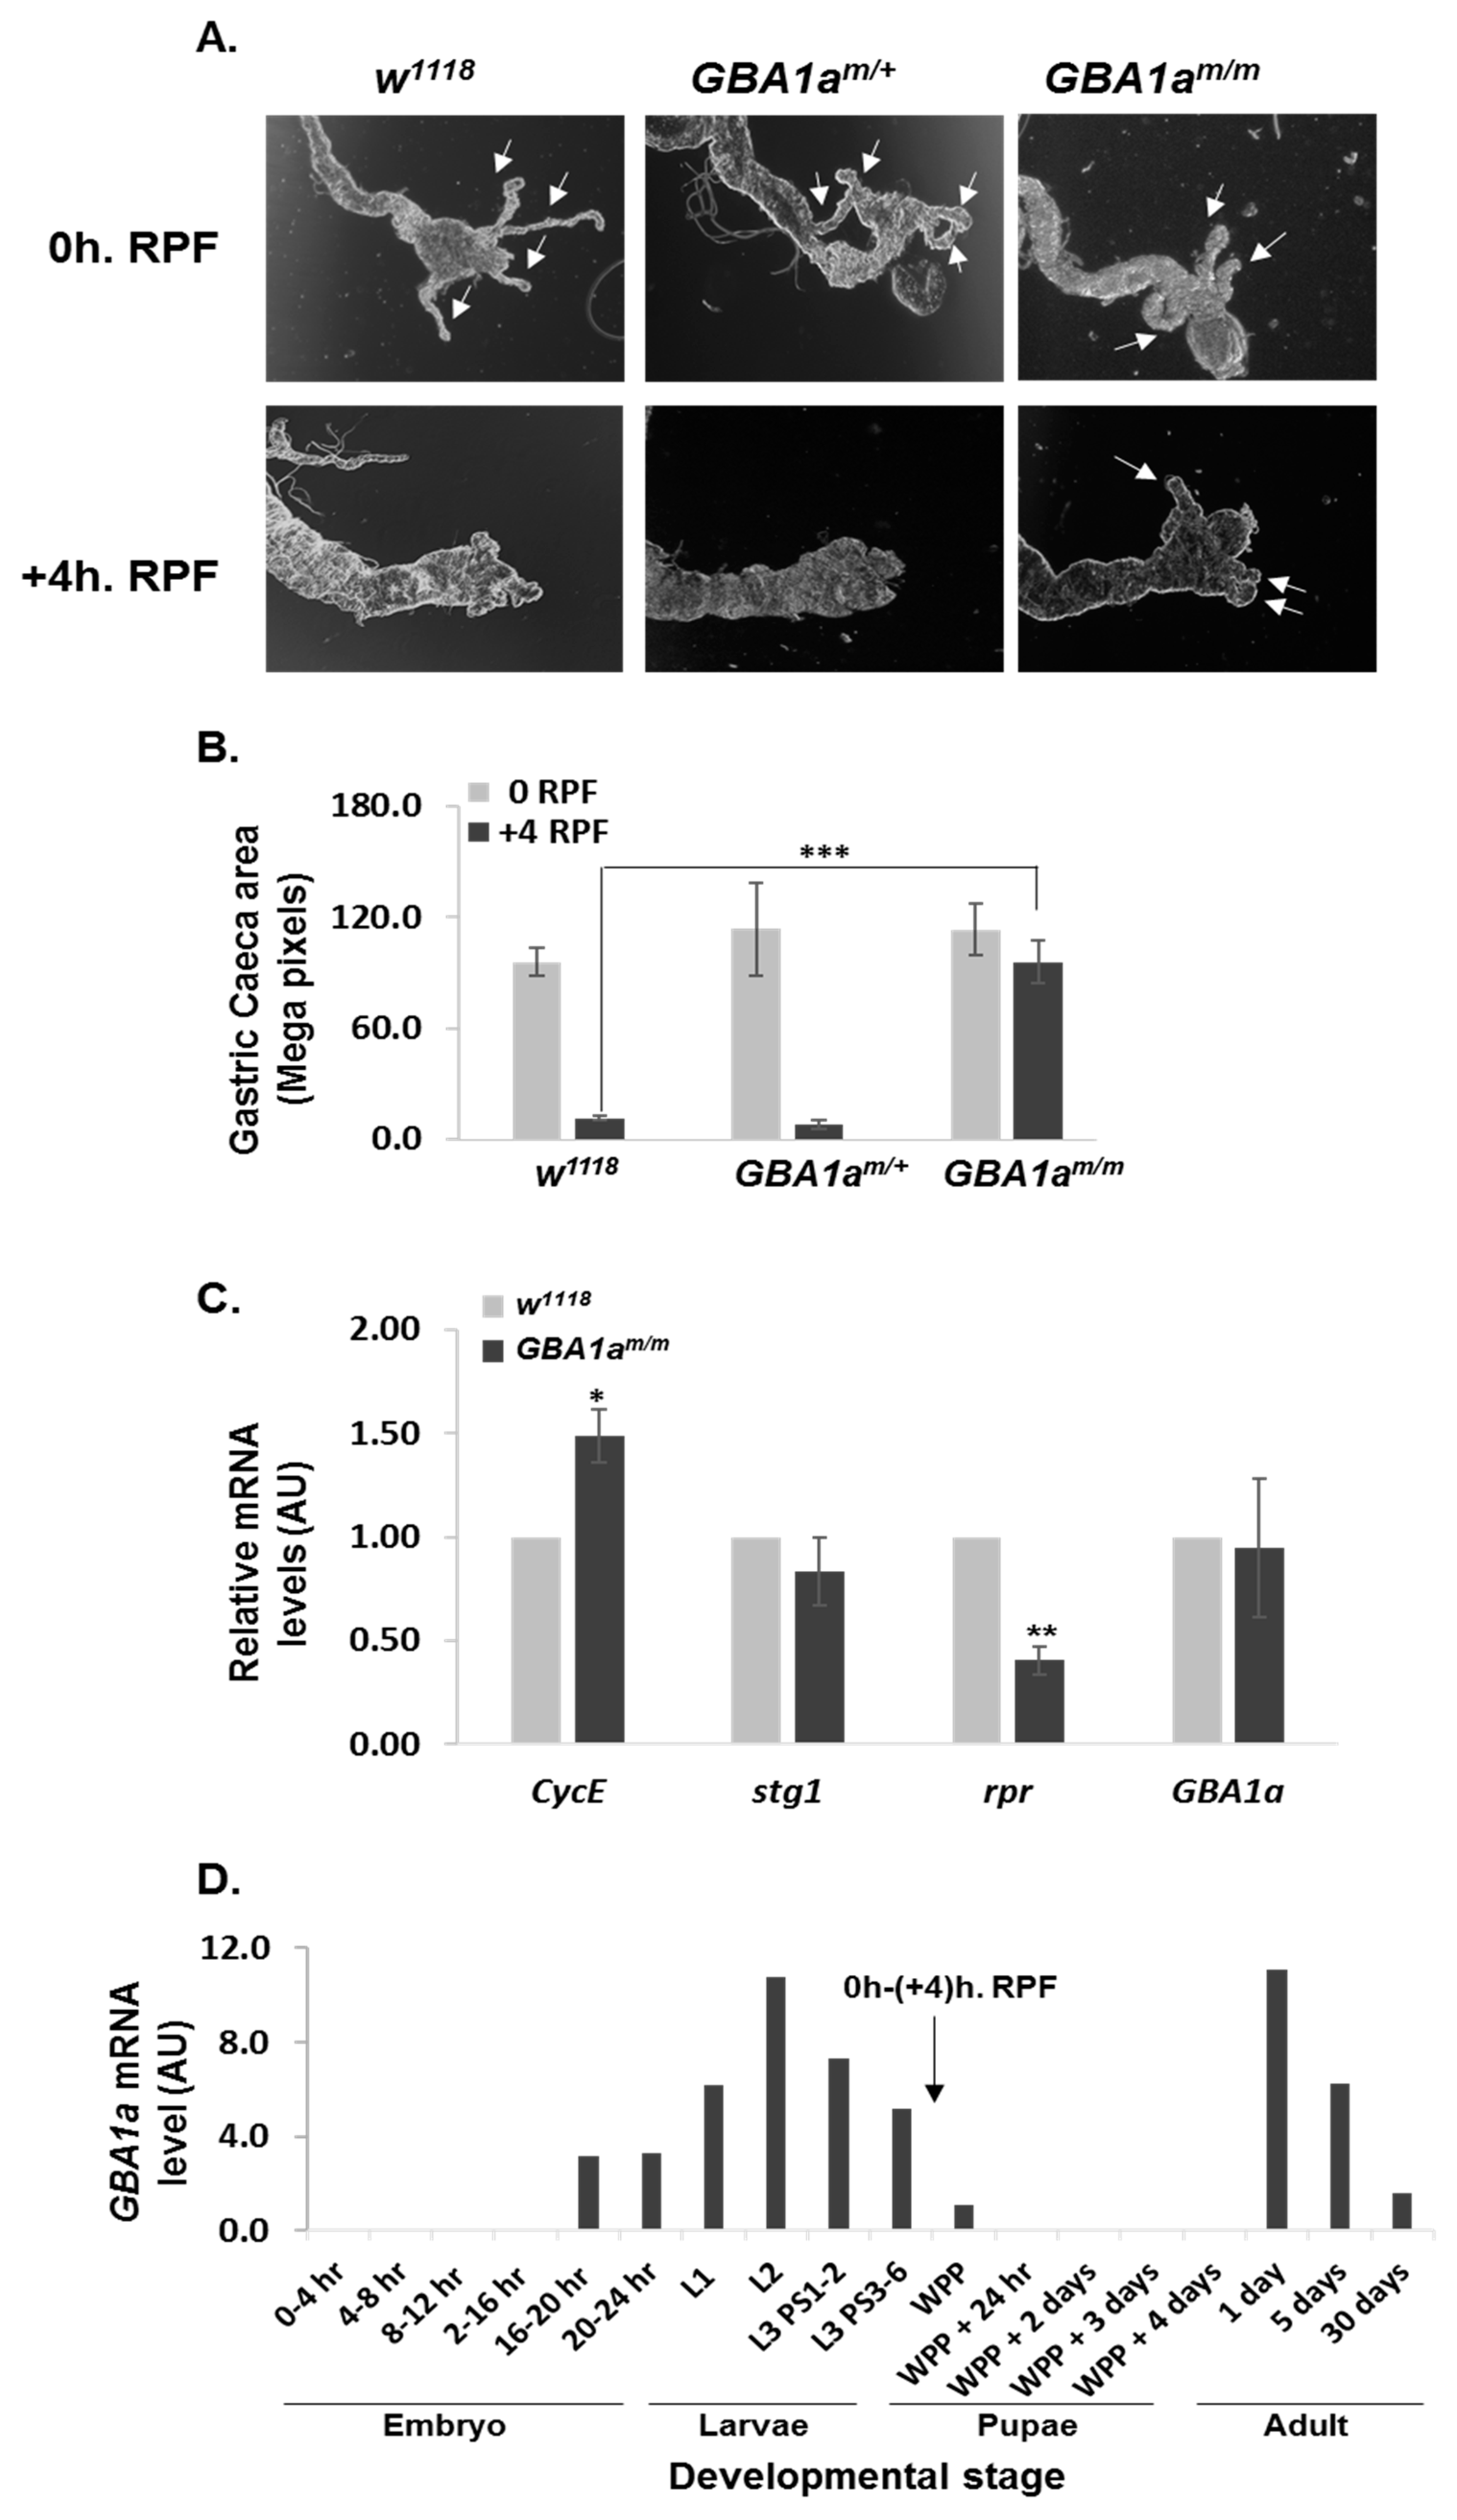
3.5. Delayed Midgut Morphogenesis in GBA1m/m Flies

Since upregulation of cell cycle-related genes was observed in mutant GBA1am/m flies, and based on the documented function of GBA1a in regulating autophagy-associated cell death during larval midgut development, resulting in midgut regression [8], we tested whether our mutant GBA1am/m exhibits retarded death during larvae midgut development. To this end, we recorded the size of elongated gastric caeca, present at the junction of the foregut and midgut of mutant GBA1am/m flies, of GBA1am/+ heterozygotes, as well as of age-matched controls (w1118), at the beginning of puparium (0 h. RPF) and four hours later (+4 h. RPF). While no significant change was obvious between the different lines at 0h. RPF, at +4 h. RPF, the area of gastric caeca of GBA1am/m pupae was larger than that of control and of GBA1am/+ larvae (Figure 7A,B), pointing to a delay in midgut PCD in larvae of GBA1am/m flies. Measurement of cell cycle-related genes in this developmental stage, employing qRT-PCR, revealed an increase in CycE mRNA level (Figure 7C), but no change in the level of stg was found for adults (Figure 6E,F) and not in that of PCNA (Figure S1), differently from what was shown in bodies of adult flies (Figure 6E,F). This variation in PCNA mRNA levels may reflect a different expression pattern of the tested genes between midgut and adult bodies. There was also a decrease in rpr mRNA level (Figure 7C), as seen in bodies of 18-day-old GBA1am/m flies (see Figure 6D).
Retarded midgut development was in agreement with the mRNA expression of GBA1a during Drosophila development, which is absent in the embryo and pupae and is the highest during larvae stages and early adulthood (FlyBase.org) (Figure 7D).

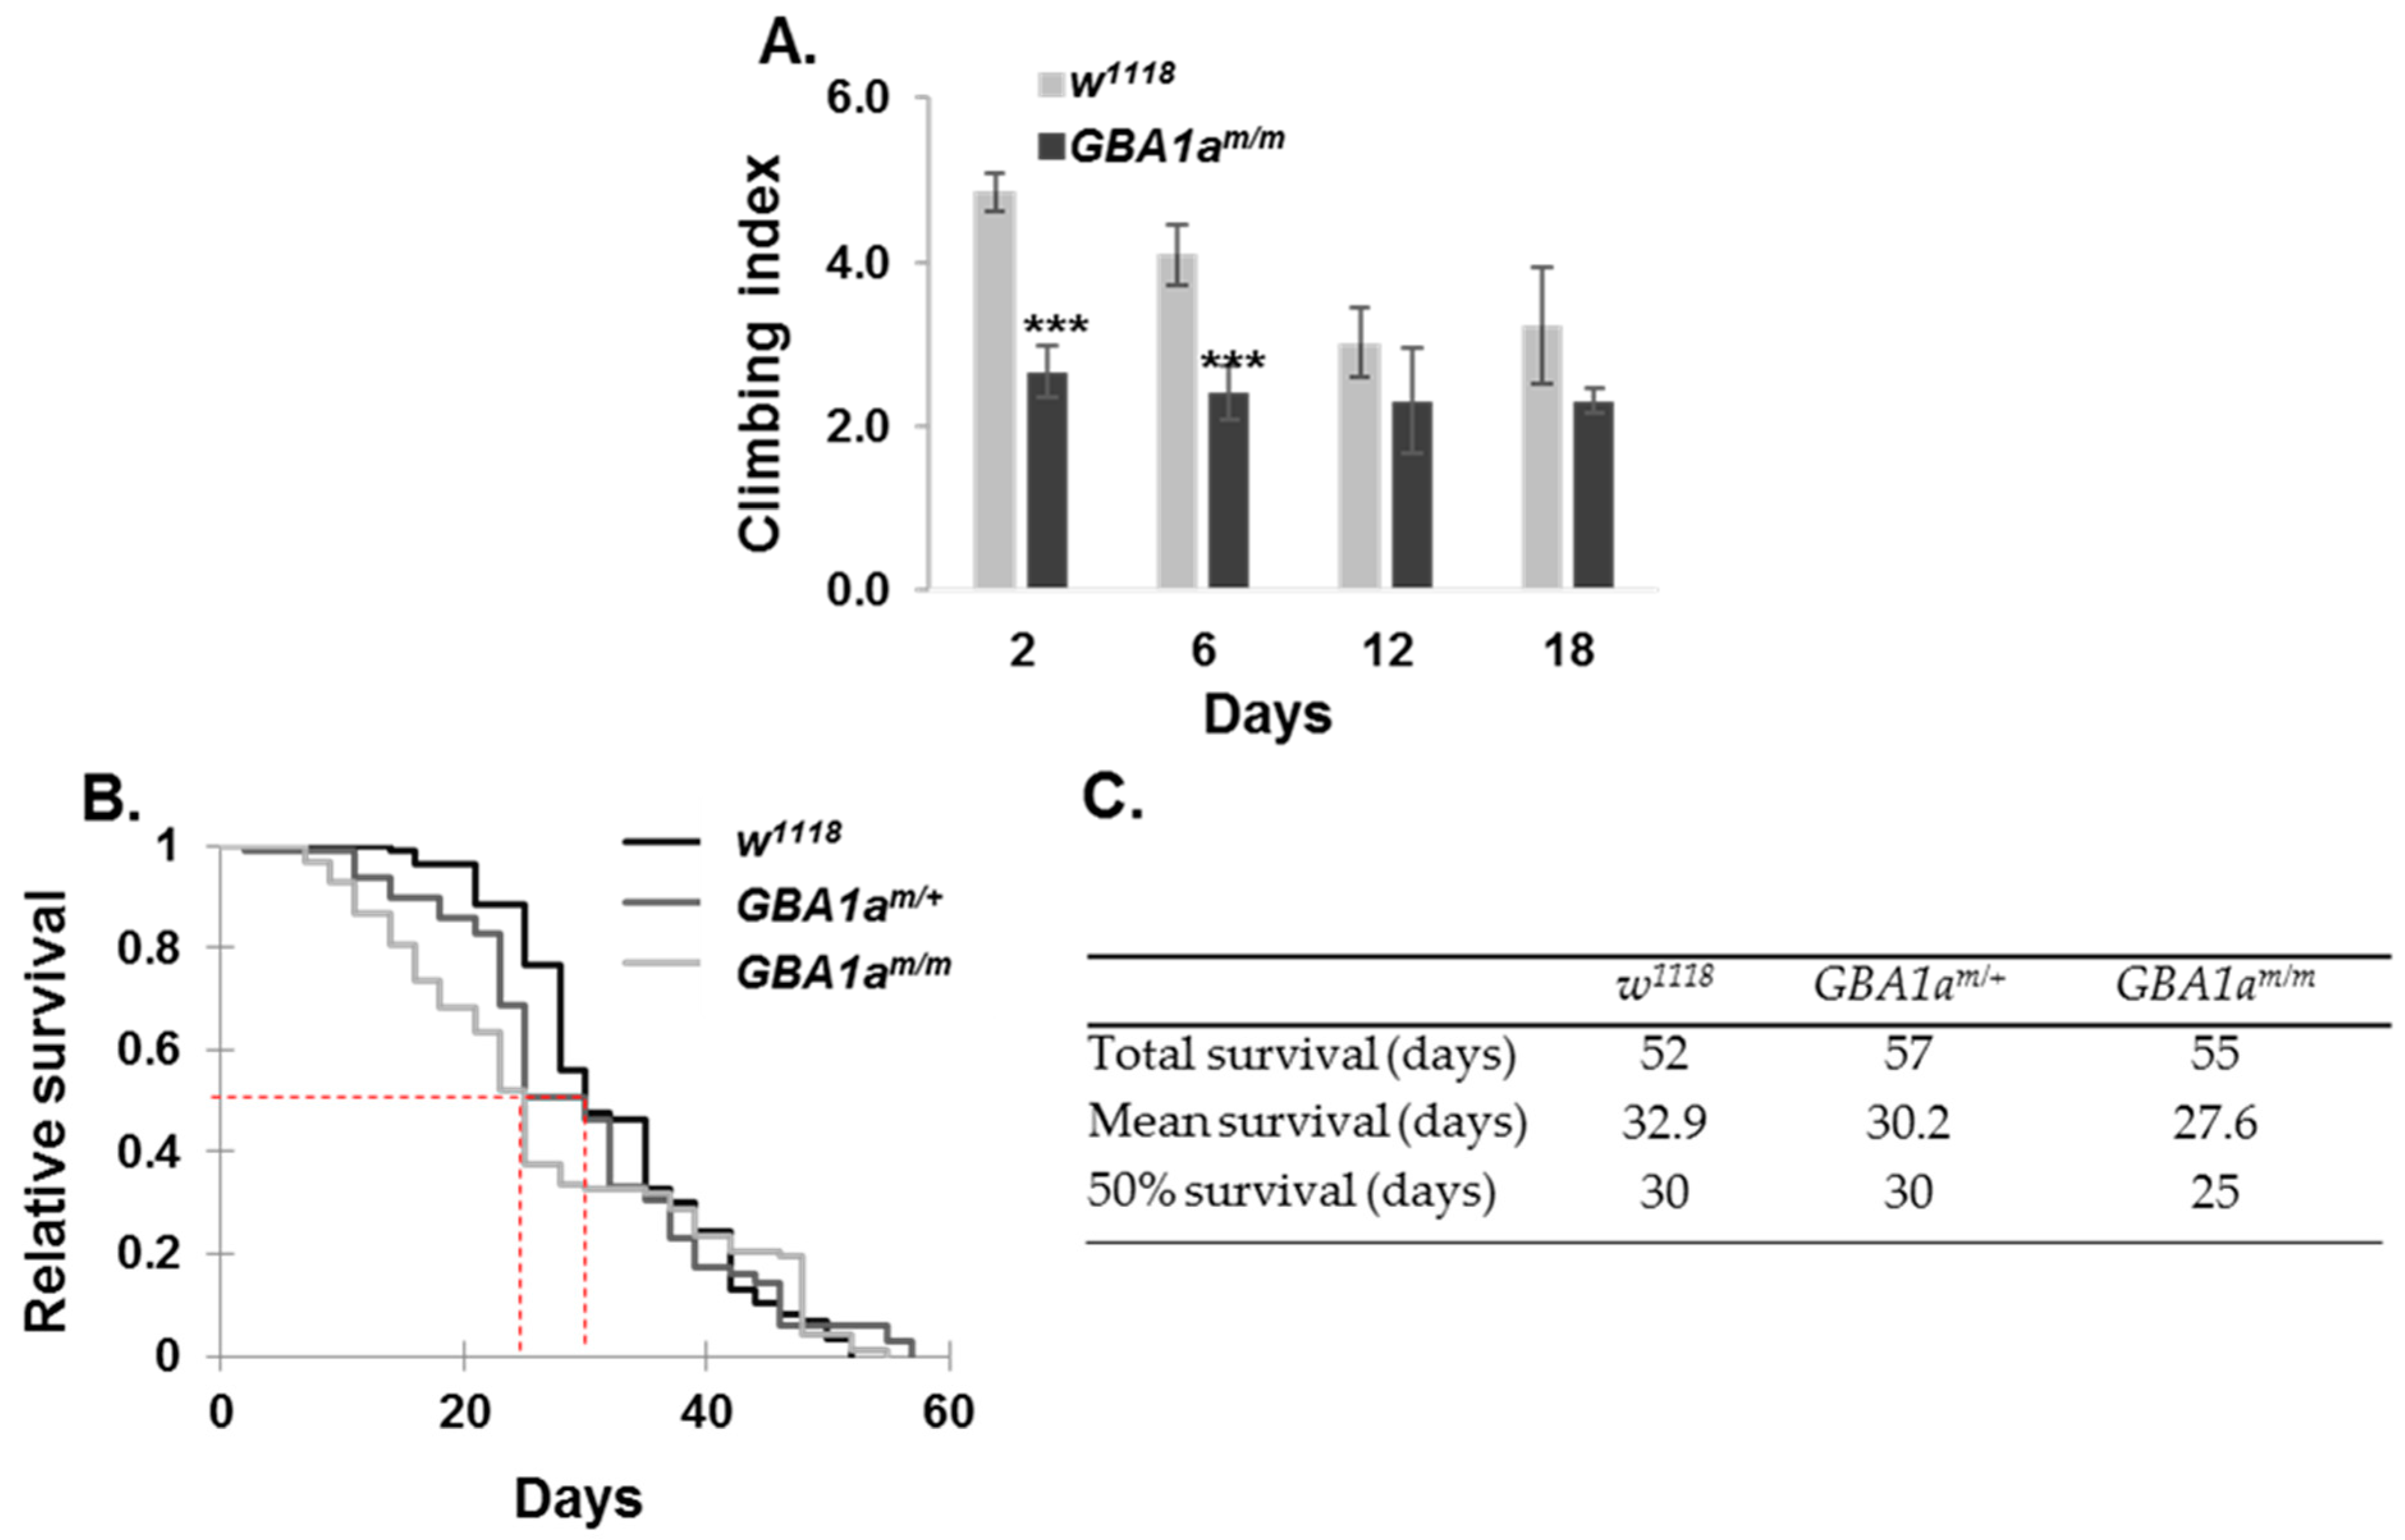
3.6. Longevity and Locomotion of GBA1am/m Flies

Since there was delayed midgut development in GBA1am/m larvae, it is conceivable that other apoptotic related processes are defective, which may delay normal development, locomotion, and longevity of the GBA1am/m flies. To this end, we followed different developmental stages in mutant and age-matched control flies. No significant change was recorded in egg laying or in larvae hatching between GBA1am/m flies and their age-matched controls (Table 3).
Next, percent of larvae surviving to pupae and percent of pupae surviving to adult was tested in GBA1am/m in comparison to that in heterozygous and in age-matched control lines, at 25 °C and 29 °C. A significant reduction in survival was observed for the GBA1am/m larvae surviving to pupae at 25 °C and 29 °C (Table 4). No significant difference was recorded for percent homozygous pupae surviving to adult. A reduction in the negative geotaxis of GBA1am/m flies was noted at day 2 and 6 post-eclosion, with no further changes, in comparison to that of age-matched controls (Figure 8A). This decreased locomotion is in agreement with the peak of expression of GBA1a in the first days after eclosion (Figure 7C). Survival of GBA1am/m was also decreased during early adulthood, with 50% survival of the GBA1am/m flies reached five days earlier than that of the control flies (w1118), (Figure 8B,C). However, the overall survival of the GBA1am/m flies did not significantly differ from that of the age-matched controls (Figure 8B,C). These results also reflect the highest expression of GBA1a in the first days post-eclosion (Figure 7C).
Taken together, our results point to developmental defects at pre-pupation and in young adult GBA1am/m flies, which affect their normal maturation, as well as their locomotion and is reflected in an abnormal survival, compared to that of age-matched controls.

4. Discussion

In the present study, we searched for a possible function of the GBA1a-encoded protein. Though 47% identical and 80% similar to the GBA1b-encoded GCase, the GBA1a-encoded protein has no lysosomal GCase activity. It does not have activity of other known lysosomal glucosidases. We were able to show that the mutant protein underwent ERAD and activated UPR. Interestingly, we also recorded inflammation in the GBA1am/m flies. Since we did not find any substrate accumulation [5], we assumed that this is a UPR induced inflammation, well documented in the literature [36,37,38]. Thus, it was demonstrated that ATF4 and Xbp1, two branches of the UPR, are essential transcription factors of the inflammatory cytokines IL8, IL6, and MCP1 in human aortic endothelial cells [33]. Likewise, hyper-activated IRE1α, another UPR-related gene, was found as an activator of the NLRP3 inflammasome [32] and as an activator of JNK and NF-κB, which induce the production of inflammatory cytokines in INS-1 cells [34]. UPR-induced inflammation was documented in different diseases, including Alzheimer disease [40], diabetes [41], and atherosclerosis [42].
In addition to the upregulation in inflammatory related genes in the GBA1am/m flies, transcriptomic analysis data revealed a high enrichment in cell cycle and nuclear division pathways. Validation with qRT-PCR analysis showed elevation in PCNA and cyclin E mRNAs, known markers for mitosis in Drosophila, as well as downregulation in reaper, a known apoptosis-related gene [27,37].
In the last decade, autophagic-induced cell death, autosis, was documented [43]. In an effort to isolate autosis-related genes, resveratrol-treated A549 human lung carcinoma cells were transfected with a RNAi library, and colonies with significantly longer survival were tested for the nature of the transfected RNAis. GBA1 was identified as an autosis regulator [44]. In order to establish the function of GBA1 in autosis, and knowing that there is autosis during fly larvae midgut maturation, where there is high expression level of GBA1a, the authors analyzed the effect of downregulation in Drosophila using GBA1a RNAi. The authors documented a regression of larval midgut caeca in GBA1a KD [8]. We could recapitulate these results using the GBA1am/m flies. We also tested the effect of the mutant protein on the ability of the larvae and pupae to mature. Our results showed that the mutant GBA1a-encoded protein affected larvae survival. Interestingly the effect of the mutation corresponded well to the time of high expression of the GBA1a gene during development. GBA1a expression has two peaks (FlyBase.org, see Figure 7C): during larvae stages 2–3 and during the first days post-eclosion. These are the two time points in which defects were observed in the GBA1am/m flies: midgut regression in the larvae, and locomotion deficit and decreased survival in the first days post-eclosion.
From previous reports [3,4,6,7] and from our results [5], it seems that GBA1a-encoded protein functions differently from its closely related GBA1b-encoded protein. While the GBA1b encodes a bona fide GCase, GBA1a encodes a protein with no GCase activity, but with a function during terminal apoptotic stages of development. Interestingly, the one human active GBA1 gene possess these two activities [44]. Likewise, in mice, there is one GBA1 gene, which encodes a bona fide GCase and seems to be involved in cell death, cell differentiation, cell proliferation, signaling, and system development (http://www.informatics.jax.org/marker/MGI:95665, Gene Ontology classification).
The phenomenon of proteins with more than one function, designated protein moonlighting, is well-recognized in the literature [45]. Cathepsin L, a lysosomal protein, is involved in the initiation of protein degradation and turnover of plasma membrane proteins for maintenance of intestinal homeostasis. In addition, it enters the nucleus and accelerates cell cycle progression [46]. Cytochrome C functions in the electron transport chain in mitochondria. However, it also functions as a proapoptotic mediator [47]. Another moonlighting protein is the endocytic protein EHD2. EHD2 is a plasma membrane-associated protein that regulates internalization. It contains a nuclear localization sequence, which enables its shuttling to the nucleus, where it functions as a transcription repressor [10].
To summarize, our results confirm that the GBA1a-encoded protein mediates larvae mid-gut regression. Its mutant variant (GBA1am) activates UPR, which leads to its ERAD, evokes the inflammatory response, and results in deregulated development, attenuated locomotion performance, and a change in the survival of the flies.

Supplementary Materials

The following are available online at https://www.mdpi.com/2073-4409/10/3/630/s1. Figure S1. mRNA level of Drosophila PCNA; Table S1. Upregulated genes in bodies of GBA1am/m and in GBA1am/+. Table S2. GO enrichment analysis of upregulated genes in bodies of GBA1am/m and in GBA1am/+; Table S3. Upregulated genes in bodies of GBA1am/m; Table S4. GO enrichment analysis of upregulated genes in bodies of GBA1am/m.

Author Contributions

Conceptualization, O.C., J.A. and M.H.; methodology, O.C., J.A. and M.H.; software, O.C. and M.P.-C.; formal analysis, O.C., J.A. and M.H.; investigation, O.C., S.P., G.M., W.K., J.A. and M.H.; writing—original draft preparation, O.C. and M.H.; writing—review and editing, O.C., S.P., J.A. and M.H.; resources, M.H.; data curation, O.C., M.P.-C. and M.H.; visualization, O.C. and M.H.; supervision, M.H. and J.A.; and project administration, M.H. All authors have read and agreed to the published version of the manuscript.

Funding

This study was supported by an Independent Research Grant from Pfizer, Inc. and partially by a grant from the Israel Science Foundation (1300/13).

Institutional Review Board Statement

Not applicable.

Informed Consent Statement

Not applicable.

Data Availability Statement

The data will be available on December 2022 at https://www.ncbi.nlm.nih.gov/geo/query/acc.cgi?acc=GSE142144 (ID GSE142144).

Acknowledgments

Stocks obtained from the Bloomington Drosophila Stock Center (NIH P40OD018537) were used in this study. We greatly appreciate the assistance and discussion with C.L. Kuo from The Leiden Institute of Chemistry, regarding the application of activity-based probes.

Conflicts of Interest

The authors declare no conflict of interest. The funder had no role in the design of the study; in the collection, analyses, or interpretation of data; in the writing of the manuscript, or in the decision to publish the results.

References

  1. Hruska, K.S.; LaMarca, M.E.; Scott, C.R.; Sidransky, E. Gaucher disease: Mutation and polymorphism spectrum in the gluco-cerebrosidase gene (GBA). Hum. Mutat. 2008, 29, 567–583. [Google Scholar] [CrossRef] [PubMed]
  2. Dvir, H.; Harel, M.; McCarthy, A.A.; Toker, L.; Silman, I.; Futerman, A.H.; Sussman, J.L. X-ray structure of human ac-id-beta-glucosidase, the defective enzyme in Gaucher disease. EMBO Rep. 2003, 4, 704–709. [Google Scholar] [CrossRef] [PubMed]
  3. Kinghorn, K.J.; Grönke, S.; Castillo-Quan, J.I.; Woodling, N.S.; Li, L.; Sirka, E.; Gegg, M.; Mills, K.; Hardy, J.; Bjedov, I.; et al. A Drosophila Model of Neuronopathic Gaucher Disease Demonstrates Lysosomal-Autophagic Defects and Altered mTOR Signalling and Is Functionally Rescued by Rapamycin. J. Neurosci. 2016, 36, 11654–11670. [Google Scholar] [CrossRef] [Green Version]
  4. Davis, M.Y.; Trinh, K.; Thomas, R.E.; Yu, S.; Germanos, A.A.; Whitley, B.N.; Sardi, S.P.; Montine, T.J.; Pallanck, L.J. Gluco-cerebrosidase deficiency in w results in alpha-synuclein-independent protein aggregation and neurodegeneration. PLoS Genet. 2016, 12, e1005944. [Google Scholar] [CrossRef] [Green Version]
  5. Cabasso, O.; Paul, S.; Dorot, O.; Maor, G.; Krivoruk, O.; Pasmanik-Chor, M.; Mirzaian, M.; Ferraz, M.; Aerts, J.; Horowitz, M. Drosophila melanogaster Mutated in its GBA1b Ortholog Recapitulates Neuronopathic Gaucher Disease. J. Clin. Med. 2019, 8, 1420. [Google Scholar] [CrossRef] [PubMed] [Green Version]
  6. Kawasaki, H.; Suzuki, T.; Ito, K.; Takahara, T.; Goto-Inoue, N.; Setou, M.; Sakata, K.; Ishida, N. Minos-insertion mutant of the Drosophila GBA gene homologue showed abnormal phenotypes of climbing ability, sleep and life span with accumulation of hydroxy-glucocerebroside. Gene 2017, 614, 49–55. [Google Scholar] [CrossRef]
  7. Suzuki, T.; Shimoda, M.; Ito, K.; Hanai, S.M.; Aizawa, H.; Kato, T.; Kawasaki, K.; Yamaguchi, T.; Ryoo, H.D.; Goto-Inoue, N.; et al. Expression of Human Gaucher Disease Gene GBA Generates Neurodevelopmental Defects and ER Stress in Drosophila Eye. PLoS ONE 2013, 8, e69147. [Google Scholar] [CrossRef] [Green Version]
  8. Dasari, S.K.; Schejter, E.; Bialik, S.; Shkedy, A.; Levin-Salomon, V.; Levin-Zaidman, S.; Kimchi, A. Death by over-eating: The Gaucher disease associated gene GBA1, identified in a screen for mediators of autophagic cell death, is necessary for devel-opmental cell death in Drosophila midgut. Cell Cycle 2017, 16, 2003–2010. [Google Scholar] [CrossRef] [Green Version]
  9. Maor, G.; Rencus-Lazar, S.; Filocamo, M.; Steller, H.; Segal, D.; Horowitz, M. Unfolded protein response in Gaucher disease: From human to Drosophila. Orphanet J. Rare Dis. 2013, 8, 140. [Google Scholar] [CrossRef] [PubMed] [Green Version]
  10. Pekar, O.; Benjamin, S.; Weidberg, H.; Smaldone, S.; Ramirez, F.; Horowitz, M. EHD2 shuttles to the nucleus and represses transcription. Biochem. J. 2012, 444, 383–394. [Google Scholar] [CrossRef] [PubMed] [Green Version]
  11. Dobin, A.; Davis, C.A.; Schlesinger, F.; Drenkow, J.; Zaleski, C.; Jha, S.; Batut, P.; Chaisson, M.; Gingeras, T.R. STAR: Ultrafast universal RNA-seq aligner. Bioinformatics 2013, 29, 15–21. [Google Scholar] [CrossRef] [PubMed]
  12. Love, M.I.; Huber, W.; Anders, S. Moderated estimation of fold change and dispersion for RNA-seq data with DESeq2. Genome. Biol. 2014, 15, 550. [Google Scholar] [CrossRef] [PubMed] [Green Version]
  13. Benjamini, Y.; Hochberg, Y. Controlling the false discovery rate: A practical and powerful approach to multiple testing. journal of the royal statistical society. Ser. B (Methodol.) 1995, 57, 289–300. [Google Scholar] [CrossRef]
  14. Kallemeijn, W.W.; Witte, M.D.; Voorn-Brouwer, T.M.; Walvoort, M.T.; Li, K.Y.; Codee, J.D.; van der Marel, G.A.; Boot, R.G.; Overkleeft, H.S.; Aerts, J.M. A sensitive gel-based method combining distinct cyclophellitol-based probes for the identification of acid/base residues in human retaining beta-glucosidases. J. Biol. Chem. 2014, 289, 35351–35362. [Google Scholar] [CrossRef] [PubMed] [Green Version]
  15. Witte, M.D.; Kallemeijn, W.W.; Aten, J.; Li, K.-Y.; Strijland, A.; Donker-Koopman, W.E.; van den Nieuwendijk, A.M.C.H.; Bleijlevens, B.; Kramer, G.; Florea, B.I.; et al. Ultrasensitive in situ visualization of active glucocerebrosidase molecules. Nat. Chem. Biol. 2010, 6, 907–913. [Google Scholar] [CrossRef] [PubMed] [Green Version]
  16. Willems, L.I.; Beenakker, T.J.M.; Murray, B.; Scheij, S.; Kallemeijn, W.W.; Boot, R.G.; Verhoek, M.; Donker-Koopman, W.E.; Ferraz, M.J.; Van Rijssel, E.R.; et al. Potent and selective activity-based probes for GH27 human retaining α-galactosidases. J. Am. Chem. Soc. 2014, 136, 11622–11625. [Google Scholar] [CrossRef] [PubMed]
  17. Armstrong, Z.; Kuo, C.-L.; Lahav, D.; Liu, B.; Johnson, R.; Beenakker, T.J.M.; De Boer, C.; Wong, C.-S.; Van Rijssel, E.R.; Debets, M.F.; et al. Manno-epi-cyclophellitols Enable activity-based protein profiling of human α-mannosidases and discovery of new Golgi mannosidase II inhibitors. J. Am. Chem. Soc. 2020, 142, 13021–13029. [Google Scholar] [CrossRef] [PubMed]
  18. Jiang, J.; Kuo, C.L.; Wu, L.; Franke, C.; Kallemeijn, W.W.; Florea, B.I.; van Meel, E.; van der Marel, G.A.; Codee, J.D.; Boot, R.G.; et al. Detection of active mammalian GH31 alpha-Glucosidases in health and disease using in-class, broad-spectrum ac-tivity-based probes. ACS Cent. Sci. 2016, 2, 351–358. [Google Scholar] [CrossRef]
  19. Wu, L.; Jiang, J.; Jin, Y.; Kallemeijn, W.W.; Kuo, C.L.; Artola, M.; Dai, W.; van Elk, C.; van Eijk, M.; van der Marel, G.A.; et al. Activity-based probes for functional interrogation of retaining beta-glucuronidases. Nat. Chem. Biol. 2017, 13, 867–873. [Google Scholar] [CrossRef] [Green Version]
  20. Kuo, C.-L.; Van Meel, E.; Kytidou, K.; Kallemeijn, W.W.; Witte, M.; Overkleeft, H.S.; Artola, M.E.; Aerts, J.M. Activity-Based Probes for Glycosidases: Profiling and Other Applications. Methods Enzymol. 2018, 598, 217–235. [Google Scholar] [CrossRef]
  21. Inagaki, H.K.; Kamikouchi, A.; Ito, K. Methods for quantifying simple gravity sensing in Drosophila melanogaster. Nat. Protoc. 2010, 5, 20–25. [Google Scholar] [CrossRef]
  22. Ron, I.; Horowitz, M. ER retention and degradation as the molecular basis underlying Gaucher disease heterogeneity. Hum. Mol. Genet. 2005, 14, 2387–2398. [Google Scholar] [CrossRef] [PubMed] [Green Version]
  23. Bendikov-Bar, I.; Horowitz, M. Gaucher disease paradigm: From ERAD to comorbidity. Hum. Mutat. 2012, 33, 1398–1407. [Google Scholar] [CrossRef] [PubMed]
  24. Braunstein, H.; Papazian, M.; Maor, G.; Lukas, J.; Rolfs, A.; Horowitz, M. Misfolding of Lysosomal α-Galactosidase a in a Fly Model and its Alleviation by the Pharmacological Chaperone Migalastat. Int. J. Mol. Sci. 2020, 21, 7397. [Google Scholar] [CrossRef]
  25. Rubin, D.M.; Mehta, A.D.; Zhu, J.; Shoham, S.; Chen, X.; Wells, Q.R.; Palter, K.B. Genomic structure and sequence analysis of Drosophila melanogaster HSC70 genes. Gene 1993, 128, 155–163. [Google Scholar] [CrossRef]
  26. Chan, S.M.; Zhao, X.; Elfowiris, A.; Ratnam, C.; Herbert, T.P. The role of de novo protein synthesis and SIRT1 in ER stress-induced Atf4 and Chop mRNA expression in mammalian cells. Biochimie 2017, 138, 156–167. [Google Scholar] [CrossRef]
  27. Ryoo, H.D.; Domingos, P.M.; Kang, M.-J.; Steller, H. Unfolded protein response in a Drosophila model for retinal degeneration. EMBO J. 2006, 26, 242–252. [Google Scholar] [CrossRef] [PubMed] [Green Version]
  28. Rigante, D.; Cipolla, C.; Basile, U.; Gulli, F.; Savastano, M.C. Overview of immune abnormalities in lysosomal storage dis-orders. Immunol. Lett. 2017, 188, 79–85. [Google Scholar] [CrossRef]
  29. Boven, L.A.; van Meurs, M.; Boot, R.G.; Mehta, A.; Boon, L.; Aerts, J.M.; Laman, J.D. Gaucher cells demonstrate a distinct macrophage phenotype and resemble alternatively activated macrophages. Am. J. Clin. Pathol. 2004, 122, 359–369. [Google Scholar] [CrossRef]
  30. Boot, R.G.; Verhoek, M.; De Fost, M.; Hollak, C.E.M.; Maas, M.; Bleijlevens, B.; Van Breemen, M.J.; Van Meurs, M.; Boven, L.A.; Laman, J.D.; et al. Marked elevation of the chemokine CCL18/PARC in Gaucher disease: A novel surrogate marker for assessing therapeutic intervention. Blood 2004, 103, 33–39. [Google Scholar] [CrossRef] [Green Version]
  31. De Francesco, P.N.; Mucci, J.M.; Ceci, R.; Fossati, C.A.; Rozenfeld, P.A. Fabry disease peripheral blood immune cells release inflammatory cytokines: Role of globotriaosylceramide. Mol. Genet. Metab. 2013, 109, 93–99. [Google Scholar] [CrossRef]
  32. Lerner, A.G.; Upton, J.-P.; Praveen, P.; Ghosh, R.; Nakagawa, Y.; Igbaria, A.; Shen, S.; Nguyen, V.; Backes, B.J.; Heiman, M.; et al. IRE1α Induces thioredoxin-interacting protein to activate the NLRP3 inflammasome and promote programmed cell death under irremediable ER stress. Cell Metab. 2012, 16, 250–264. [Google Scholar] [CrossRef] [PubMed] [Green Version]
  33. Gargalovic, P.S.; Gharavi, N.M.; Clark, M.J.; Pagnon, J.; Yang, W.-P.; He, A.; Truong, A.; Baruch-Oren, T.; Berliner, J.A.; Kirchgessner, T.G.; et al. The unfolded protein response is an important regulator of inflammatory genes in endothelial cells. Arter. Thromb. Vasc. Biol. 2006, 26, 2490–2496. [Google Scholar] [CrossRef] [PubMed] [Green Version]
  34. Amen, O.M.; Sarker, S.D.; Ghildyal, R.; Arya, A. Endoplasmic reticulum stress activates unfolded protein response signaling and mediates inflammation, Obesity, and Cardiac Dysfunction: Therapeutic and Molecular Approach. Front. Pharmacol. 2019, 10, 977. [Google Scholar] [CrossRef] [Green Version]
  35. Cao, Y.; Chtarbanova, S.; Petersen, A.J.; Ganetzky, B. Dnr1 mutations cause neurodegeneration in Drosophila by activating the innate immune response in the brain. Proc. Natl. Acad. Sci. USA 2013, 110, E1752–E1760. [Google Scholar] [CrossRef] [PubMed] [Green Version]
  36. Arnold, P.A.; Johnson, K.N.; White, C.R. Physiological and metabolic consequences of viral infection in Drosophila mela-nogaster. J. Exp. Biol. 2013, 216, 3350–3357. [Google Scholar] [CrossRef] [PubMed] [Green Version]
  37. Goyal, L.; McCall, K.; Agapite, J.; Hartwieg, E.; Steller, H. Induction of apoptosis by Drosophila reaper, hid and grim through inhibition of IAP function. EMBO J. 2000, 19, 589–597. [Google Scholar] [CrossRef] [Green Version]
  38. Lanzotti, D.J.; Kupsco, J.M.; Marzluff, W.F.; Duronio, R.J. string(cdc25) and cyclin E are required for patterned histone expression at different stages of Drosophila embryonic development. Dev. Biol. 2004, 274, 82–93. [Google Scholar] [CrossRef] [Green Version]
  39. Duronio, R.J.; O’Farrell, P.H. Developmental control of a G1-S transcriptional program in Drosophila. Development 1994, 120, 1503–1515. [Google Scholar]
  40. Salminen, A.; Kaarniranta, K.; Kauppinen, A. ER stress activates immunosuppressive network: Implications for aging and Alzheimer’s disease. J. Mol. Med. 2020, 98, 633–650. [Google Scholar] [CrossRef] [PubMed] [Green Version]
  41. Zhang, S.X.; Sanders, E.; Wang, J.J. Endoplasmic reticulum stress and inflammation: Mechanisms and implications in diabetic retinopathy. J. Ocul. Biol. Dis. Inform. 2011, 4, 51–61. [Google Scholar] [CrossRef] [PubMed] [Green Version]
  42. Thorp, E.B. Methods and models for monitoring UPR-associated macrophage death during advanced atherosclerosis. Methods Enzymol. 2011, 489, 277–296. [Google Scholar]
  43. Giusti, C.; Luciani, M.-F.; Golstein, P. A second signal for autophagic cell death? Autophagy 2010, 6, 823–824. [Google Scholar] [CrossRef] [PubMed] [Green Version]
  44. Dasari, S.K.; Bialik, S.; Levin-Zaidman, S.; Levin-Salomon, V.; Jr, A.H.M.; Futerman, A.H.; Kimchi, A. Signalome-wide RNAi screen identifies GBA1 as a positive mediator of autophagic cell death. Cell Death Differ. 2017, 24, 1288–1302. [Google Scholar] [CrossRef] [PubMed] [Green Version]
  45. Jeffery, C.J. Moonlighting proteins: Old proteins learning new tricks. Trends Genet. 2003, 19, 415–417. [Google Scholar] [CrossRef]
  46. Tamhane, T.; Lllukkumbura, R.; Lu, S.; Maelandsmo, G.M.; Haugen, M.H.; Brix, K. Nuclear cathepsin L activity is required for cell cycle progression of colorectal carcinoma cells. Biochimie 2016, 122, 208–218. [Google Scholar] [CrossRef] [PubMed] [Green Version]
  47. Liu, X.; Kim, C.N.; Yang, J.; Jemmerson, R.; Wang, X. Induction of Apoptotic Program in Cell-Free Extracts: Requirement for dATP and Cytochrome c. Cell 1996, 86, 147–157. [Google Scholar] [CrossRef] [Green Version]
Figure 1. Schematic representation of the GBA1a variants and their sequence. (A) Schematic representation of normal (upper panel) and mutant (lower panel) GBA1a genes. The mutant allele is the outcome of a Minos transposable element insertion in the fourth exon, resulting in a 33 C-terminal amino acids deletion. The missing part of the gene is labeled with red. (B) Alignment between GBA1a and GBA1b encoded protein sequences. Yellow box—predicted signal sequence; green box—amino acids associated with substrate recognition; blue box—amino acids comprising the active site; red box—position of Minos insertion. Red line represents 33 C-terminal amino acids that are missing in the mutant protein. “*”-residue identity; “.”-residue similarity.
Cells 10 00630 g001
Figure 2. Activity of GBA1a-encoded protein. (A + B) Lysates, prepared from bodies (A) or heads (B) of homozygotes and heterozygotes: GBA1am/m, GBA1am/+, GBA1bm/m and GBA1bm/+ flies and of their age matched controls (w1118), were incubated with a general GBA (GBA1, GBA2, and GBA3) ABP (JJB367) or a specific GBA1 ABP (ME362), after which they were resolved through SDS-PAGE. The gel was visualized as indicated in Materials and Methods. (C) Lysates prepared from bodies of GBA1am/m and GBA1bm/m flies, were incubated with different activity-based probes: α-galactosidase (TB474), β-galactosidase (TB652), α-mannosidase (TB482), β-mannosidase (TB434), α-glucosidase (JJB383), and β-glucuronidase (JJB392) after which they were resolved through SDS-PAGE. The gel was visualized as indicated in Materials and Methods. Blue dot represents a putative GBA1a-specific band. (D) BLAST analysis comparing between the human α-mannosidase (H.sap. α-man) and GBA1a proteins. Amino acid D196 is the nucleophile of the human α-mannosidase catalytic site and highlighted in blue. “*”-residue identity; “.”-residue similarity.
Cells 10 00630 g002
Figure 3. ERAD and UPR of GBA1am-encoded protein. (A) Protein lysates prepared from HEK293T cells, transfected with plasmids expressing wt or mutant GBA1a encoded proteins coupled to a myc-tag were treated or untreated for 18 h with MG132, after which they were resolved through SDS-PAGE. The corresponding blot was interacted with anti-myc or anti actin antibodies, as a loading control. (B) To quantify the results, wt and mutant myc-GBA1a band intensity was divided by that of actin in the same lane, and the value obtained for GBA1a without treatment was considered one. The results represent the mean ± SEM of three independent experiments. (C + D) mRNA levels of UPR markers: activating transcription factor 4 (ATF4) Heat shock-70-3 (Hsc70-3) and spliced x-box binding protein (Xbp1), in bodies (C) and heads (D) of GBA1am/m and w1118 (control) and flies at 18 days post-eclosion, as analyzed by qRT-PCR. In case of spliced Xbp1, the forward primer could anneal only to the spliced form of Xbp1 mRNA. AU—Arbitrary units. * p < 0.05. ** p < 0.01.
Cells 10 00630 g003
Figure 4. Immune response-related pathways enrichment in GBA1am/m flies. (A + C) Heat maps of differentially expressed genes in bodies (A) and heads (C) of 12 days old GBA1am/m flies, as collected from transcriptomic analysis. The number of genes in each cluster (separated with a black line) is denoted in the left. (B + D). Venny tool analysis (https://bioinfogp.cnb.csic.es/tools/venny/), showing the number of upregulated (upper panel, red) and downregulated (lower panel, blue) genes in bodies (B) and heads (D) of GBA1am/m and GBA1am/+ flies. (E + G) Shown are the 156 genes that were upregulated in bodies of GBA1am/m and of GBA1am/+ flies (E; Enlargement of the upper cluster of panel A), and the 80 genes upregulated in heads (G; Enlargement of the upper cluster of panel C). (F + H) Gene ontology enrichment analysis of upregulated genes in bodies (F) and heads (H) of both homozygous (GBA1am/m) and heterozygous (GBA1am/+) flies in comparison to age matched controls. The hyper genomic test was used for the calculation of fold enrichment.
Cells 10 00630 g004
Figure 5. Activation of inflammation in GBA1am/m flies. (A + B) mRNA levels of Attacin C (AttC), Cecropin (Cec), Drosomycin (Drs) and Metchnikowin (Mtk) in bodies (A) and heads (B) of GBA1am/m and of age-matched controls (w1118) at 18 days post-eclosion, as analyzed by qRT-PCR. (C) A comparison between the volume of GBA1am/m and age-matched controls body fluid, as measured by Hamilton syringe. Body fluid was extracted from 100 GBA1am/m or age-matched control (w1118), 18-day-old females flies. The results in the different panels present the mean ± SEM of three-five independent experiments. * p < 0.05; ** p < 0.05.
Cells 10 00630 g005
Figure 6. Cell cycle-related genes are upregulated in GBA1am/m flies. (A) 293 genes were upregulated in bodies of GBA1am/m flies in comparison to age-matched controls (w1118). (B) Gene ontology enrichment analysis of upregulated genes in bodies of GBA1am/m flies in comparison to age-matched controls. The hyper genomic test was used for the calculation of fold enrichment. (C) Eleven genes were downregulated in bodies of 12-day-old GBA1am/m flies with a slight reduction in GBA1am/+ flies, as predicted from transcriptomic analysis. Reaper (rpr) is highlighted in yellow. (D) mRNA level of the Drosophila apoptotic gene reaper (rpr) in bodies and in heads of GBA1am/m and of control (w1118) flies, at 18 days post-eclosion, as analyzed by qRT-PCR. AU—Arbitrary units. (E + F) mRNA levels of the Drosophila cell cycle related genes markers: string (stg), proliferating cell nuclear antigen (PCNA) and cyclin e (CycE), in bodies (E) and in heads (H) of GBA1am/m and control (w1118), flies at 18 days post-eclosion, as analyzed by qRT-PCR. The results in the different panels present the mean ± SEM of three-five independent experiments. * p < 0.05; ** p < 0.005.
Cells 10 00630 g006
Figure 7. Midgut regression is delayed in GBA1am/m flies. (A) Representing light microscopy images of midguts dissected from GBA1am/m, GBA1am/+ and control (w1118) larvae at 0 h RPF (beginning of white pre pupa) and +4 h RPF. Arrows indicate gastric caeca. (B) Quantification of gastric caeca size at 0 and at +4 h RPF. Data represents mean ± SEM of 10–12 midguts per genotype. (C) mRNA levels of the Drosophila cell cycle related genes markers cyclin E (CycE), string (stg), the apoptotic gene reaper (rpr), and GBA1a in guts of GBA1am/m and control (w1118) white pre pupae, as analyzed by qRT-PCR. Presented is the mean ± SEM of three independent experiments. (D) GBA1a mRNA expression according to FlyBase data (exonic expression by developmental stage). Relative puparium formation zero (0 h. RPF) and +four hours (+4 h. RPF) are marked with an arrow. WPP—white prepupa. * p < 0.05; ** p < 0.005; *** p < 0.001.
Cells 10 00630 g007
Figure 8. Phenotype of GBA1am/m flies. (A) Climbing assay comparing the locomotion of thirty GBA1am/m and of thirty control (w1118) flies at different time points. Presented is the average of four different experiments ± SEM. *** p < 0.005. (B) Kaplan Meier survival curve showing longevity of GBA1am/m, of GBA1am/+, and of control (w1118) flies at 25 °C. (C) A table showing the total, mean, and 50% survival of GBA1am/m, GBA1am/+, and of control (w1118) flies, as obtained from Kaplan Meier analysis.
Cells 10 00630 g008
Table 1. Active site associated amino acids in human and fly GBA1-encoded proteins.
Role in Active SiteHuman GCaseGBA1a EncodedGBA1b Encoded
Catalytic amino acidE235E298E298
Catalytic amino acidE340E405E405
Stabilizing the substrateF128F194F194
Stabilizing the substrateW179W246W246
Stabilizing the substrateF246F308F308
Stabilizing the substrateY313Y389Y389
Stabilizing the substrateW381W408W408
Stabilizing the substrateF397---F463
Table 2. Primers used in the present study. The table depicts all primers used in the present study for qRT-PCR analyses.
NamePrimer Sequence
ATF4F: 5′-AGACGCTGCTTCGCTTCCTTC-3′
R: 5′-GCCCGTAAGTGCGAGTACGCT-3′
Hsc70-3F: 5′-GCTGGTGTTATTGCCGGTCTGC-3′
R: 5′-GATGCCTCGGGATGGTTCCTTGC-3′
sXBP1F: 5′-CCGAACTGAAGCAGCAACAGC-3′
R: 5′-GTATACCCTGCGGCAGATCC-3′
AttCF: 5′-CTGCACTGGACTACTCCCACATCA-3′
R: 5′-CGATCCTGCGACTGCCAAAGATTG-3′
CECF: 5′-CATTGGACAATCGGAAGCTGGGTG-3′
R: 5′-TAATCATCGTGGTCAACCTCGGGC-3′
DRSF: 5′-AGTACTTGTTCGCCCTCTTCGCTG-3′
R: 5′-CCTTGTATCTTCCGGACAGGCAGT-3′
MTKF: 5′-CATCAATCAATTCCCGCCACCGAG-3′
R: 5′-AAATGGGTCCCTGGTGACGATGAG-3′
stgF: 5’-CGTCGTCGAGTCAACAGCTCTTC-3′
R: 5′-GTATTTCGGAGTGTGGTTGTGCG-3′
PCNAF: 5’-GCAGCGACTCCGGCATTCAG-3′
R: 5′-CGCAGGGTCAGCGAGACAAG-3′
RF: 5’-GCTGGATGGAGCCATTCTTCCG-3′
R: 5′-CCTGGGCCATAAGCACTTCGTC-3′
RPRF: 5’CATACCCGATCAGGCGACTC-3′
R: 5’-GCTTGCGATATTTGCCGGAC-3′
rp49F: 5′-TAAGAAGCGCACAAAGCACT-3′
R: 5′-GGGCATCAGATATTGTCCCT-3′
Table 3. Egg laying and larval hatching.
TemperatureGenotypeNumber of Laid EggsNumber of Hatching
25 °Cw111810572
GBA1am/m10364
p = 0.61p = 0.35
Number of egg laying and larval hatching of w1118 and GBA1am/m lines at 25 °C. p values are shown below the relevant numbers.
Table 4. Survival at different developmental stages.
Temperature Genotype% Larvae Surviving to Pupae% Pupae Surviving to Adult
25 °Cw111810094
GBA1am/+98.192
GBA1am/m90 *87
29 °Cw111896.985.6
GBA1am/+95.290.3
GBA1am/m86.7 *80.6
Survival of GBA1am/m, GBA1am/+, and w1118 larvae to pupae and of pupae to adult flies at 25 and 29 °C. * p < 0.05.
Publisher’s Note: MDPI stays neutral with regard to jurisdictional claims in published maps and institutional affiliations.

