
Digital Immunophenotyping Predicts Disease Free and Overall Survival in Early Stage Melanoma Patients

 , , , , ,
Abstract
1. Introduction
2. Materials and Methods
2.1. Patients Characteristics
2.2. Tissue Samples
2.3. Ethical Committee
2.4. Immunohistochemistry
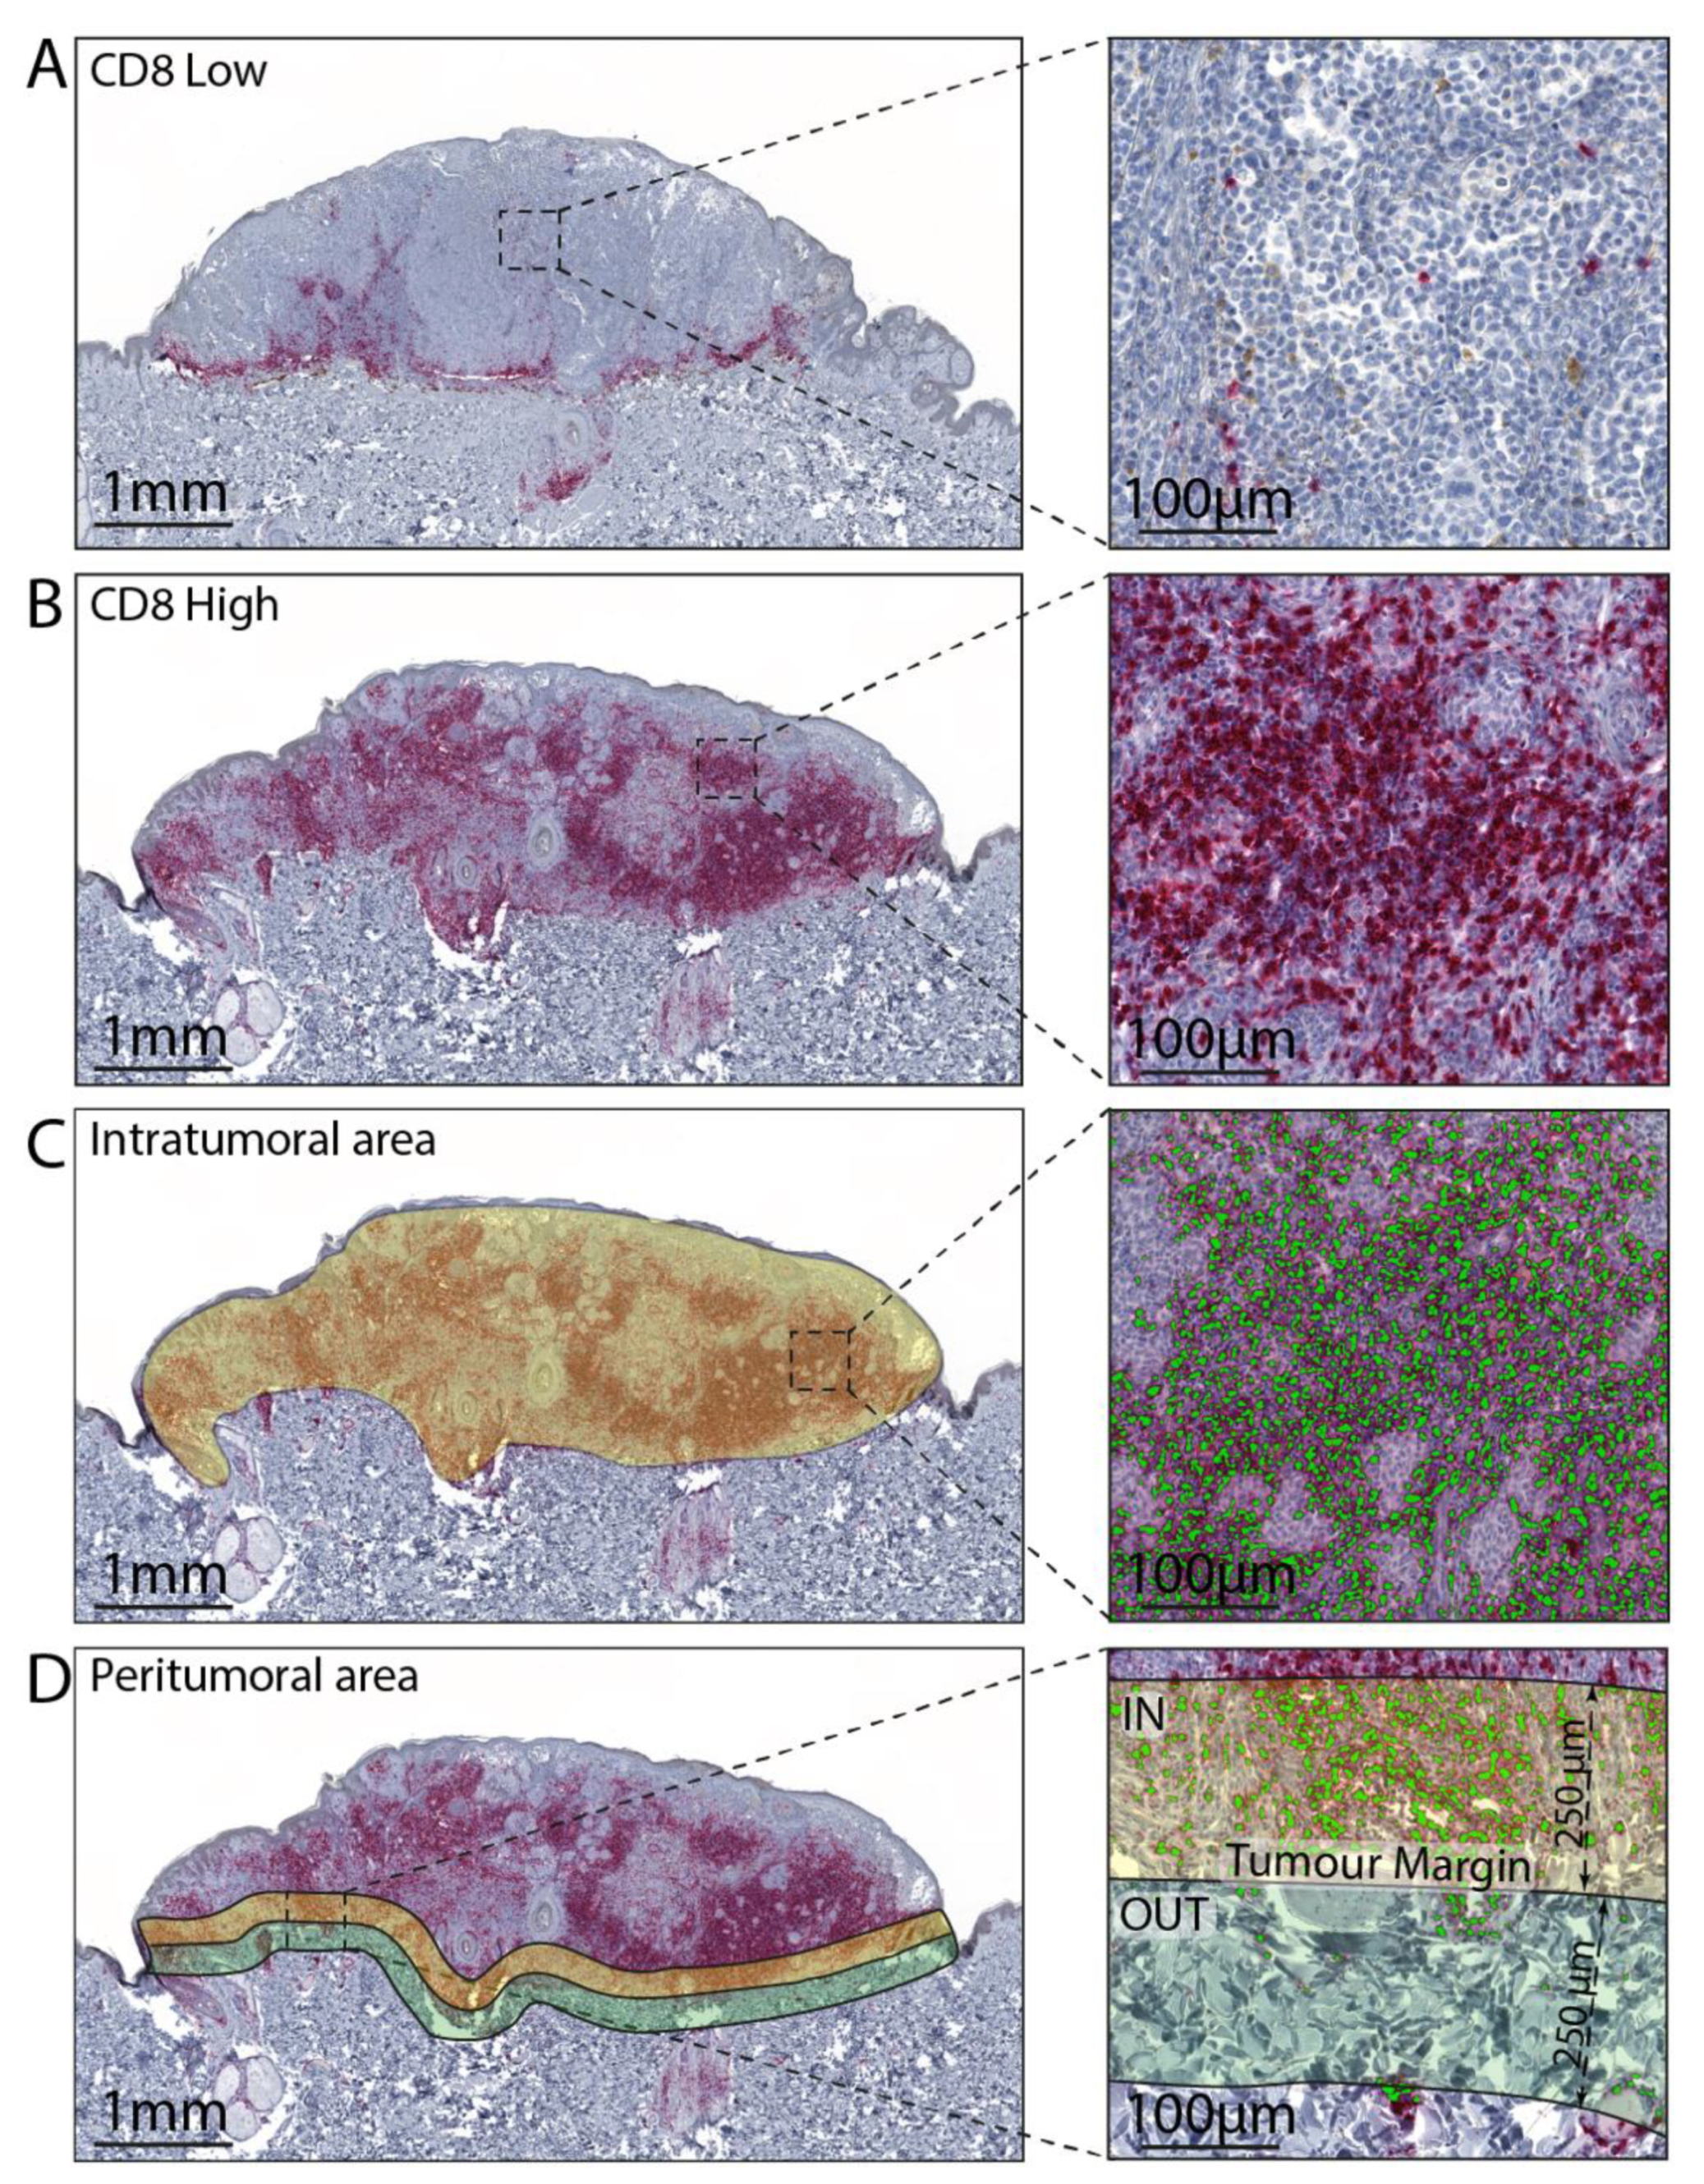
2.5. Image Analysis
2.6. Statistical Analysis
3. Results
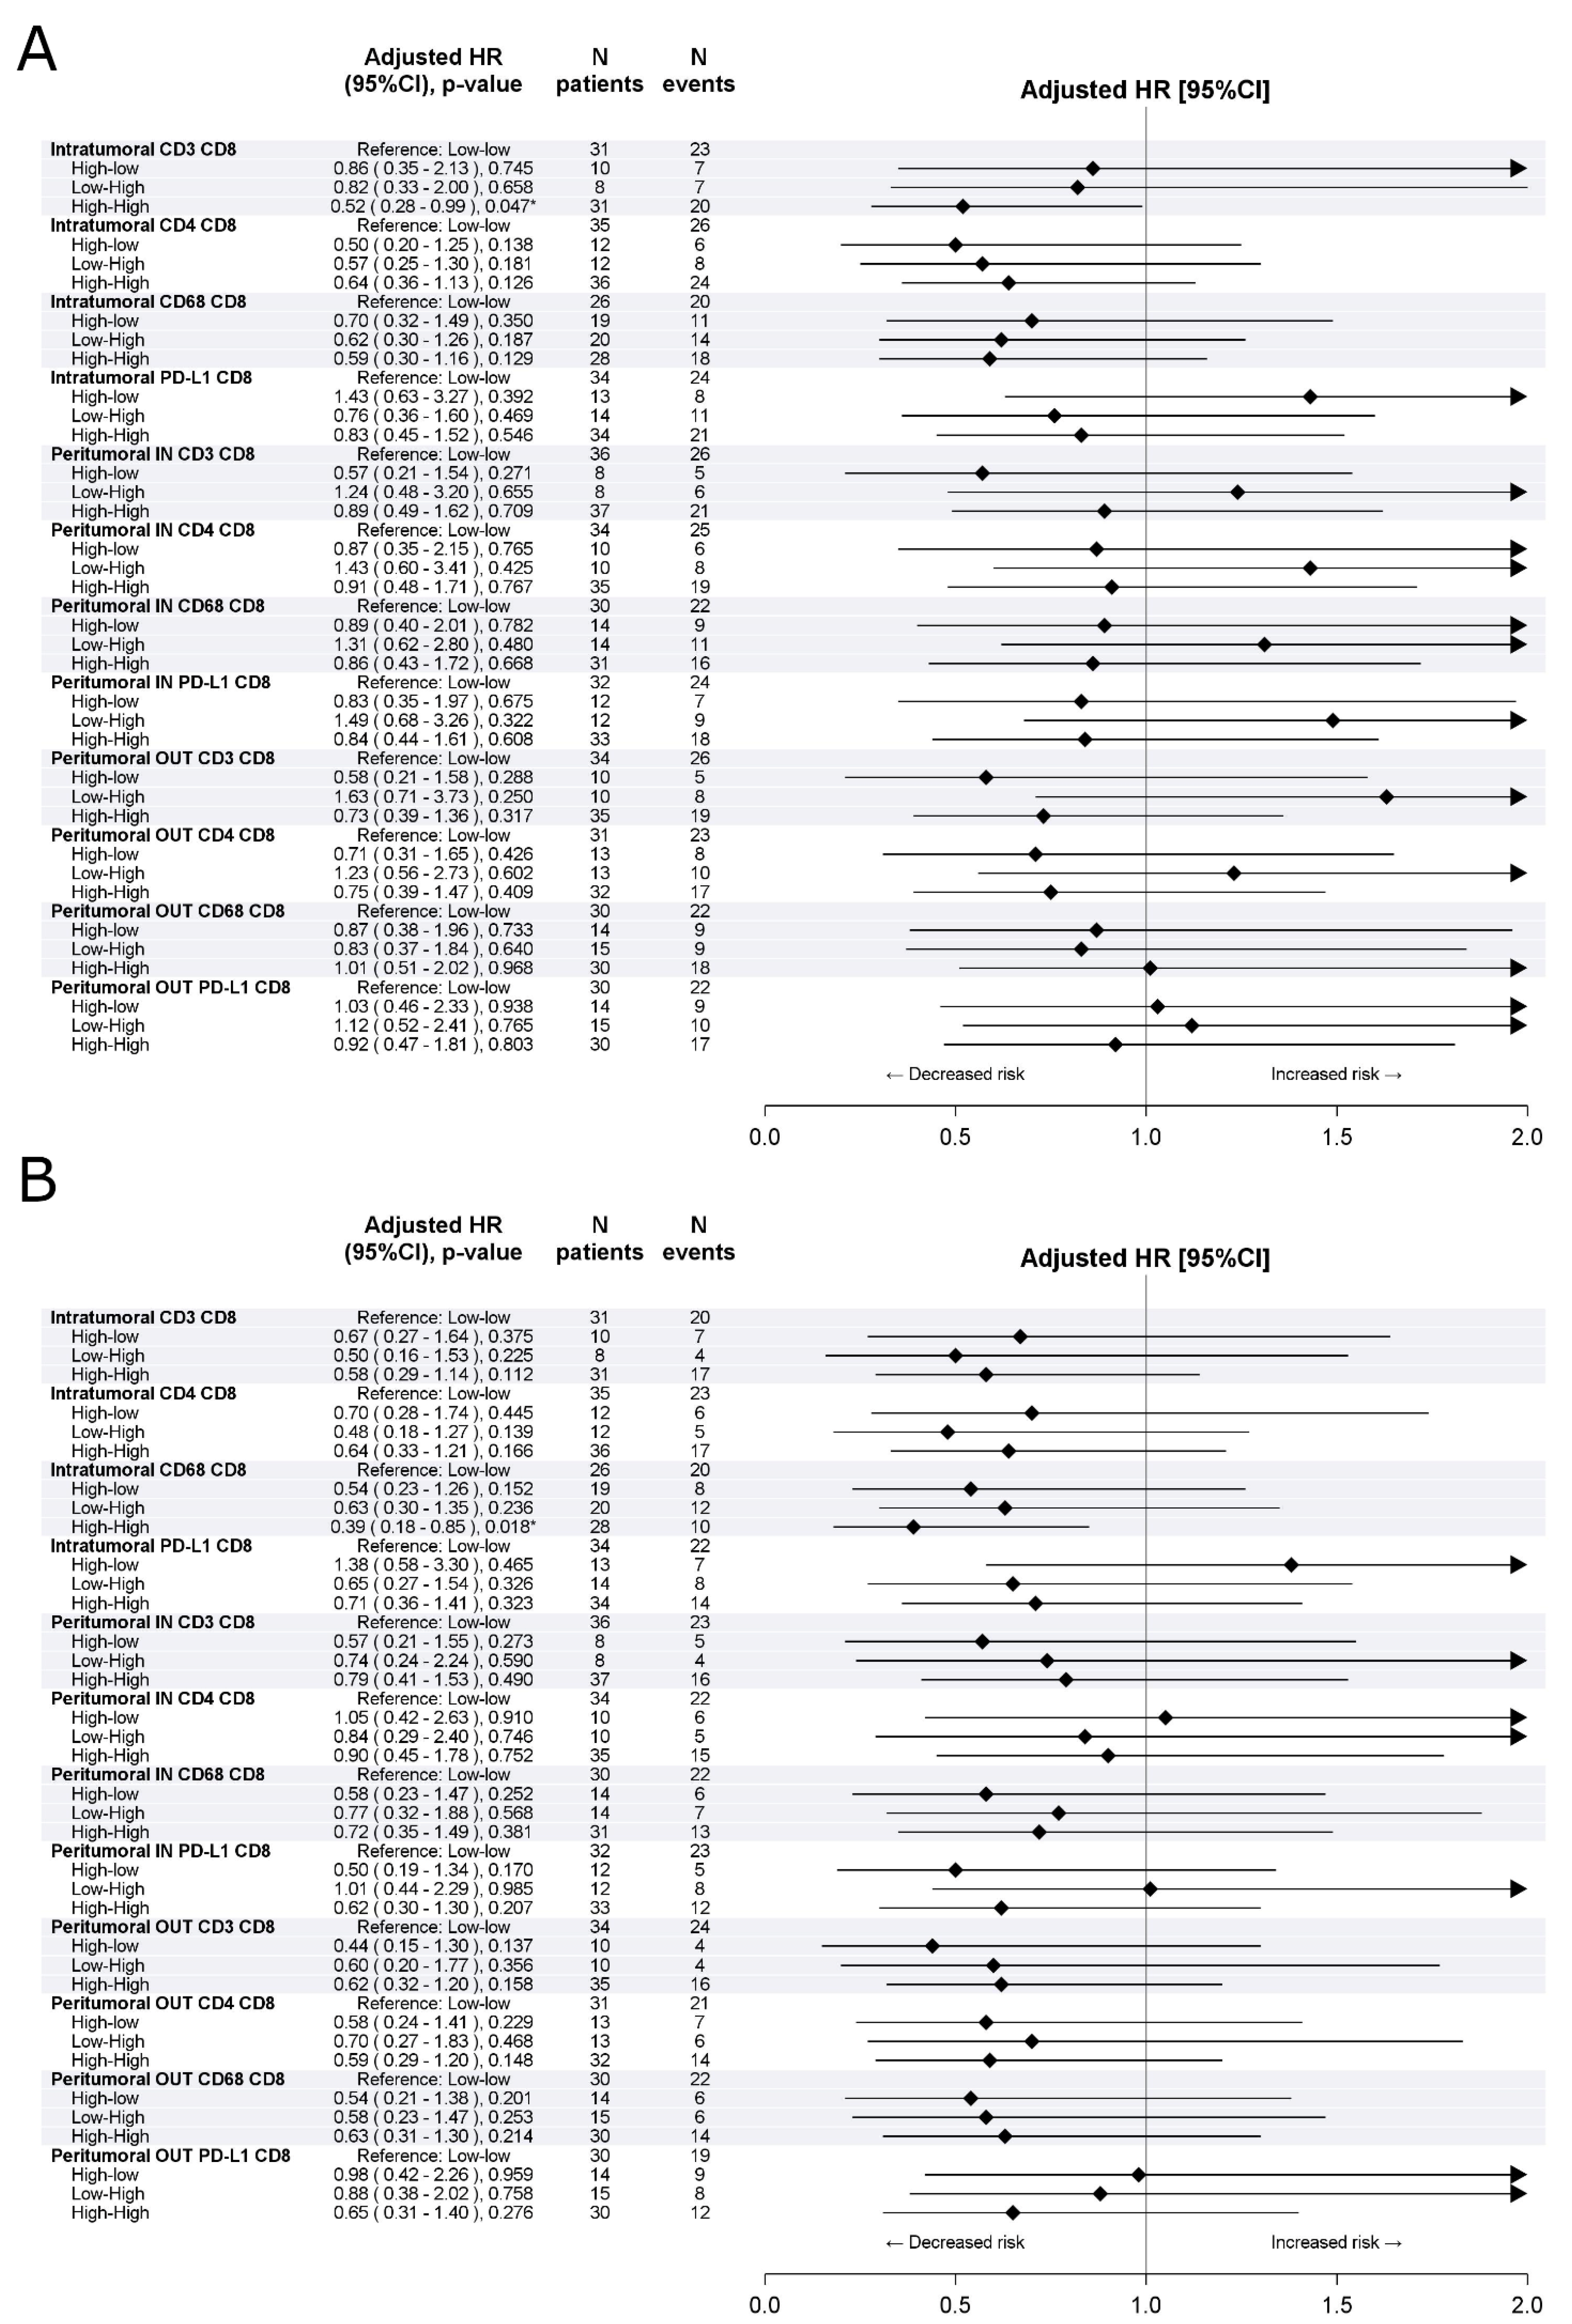
3.1. Training Cohort
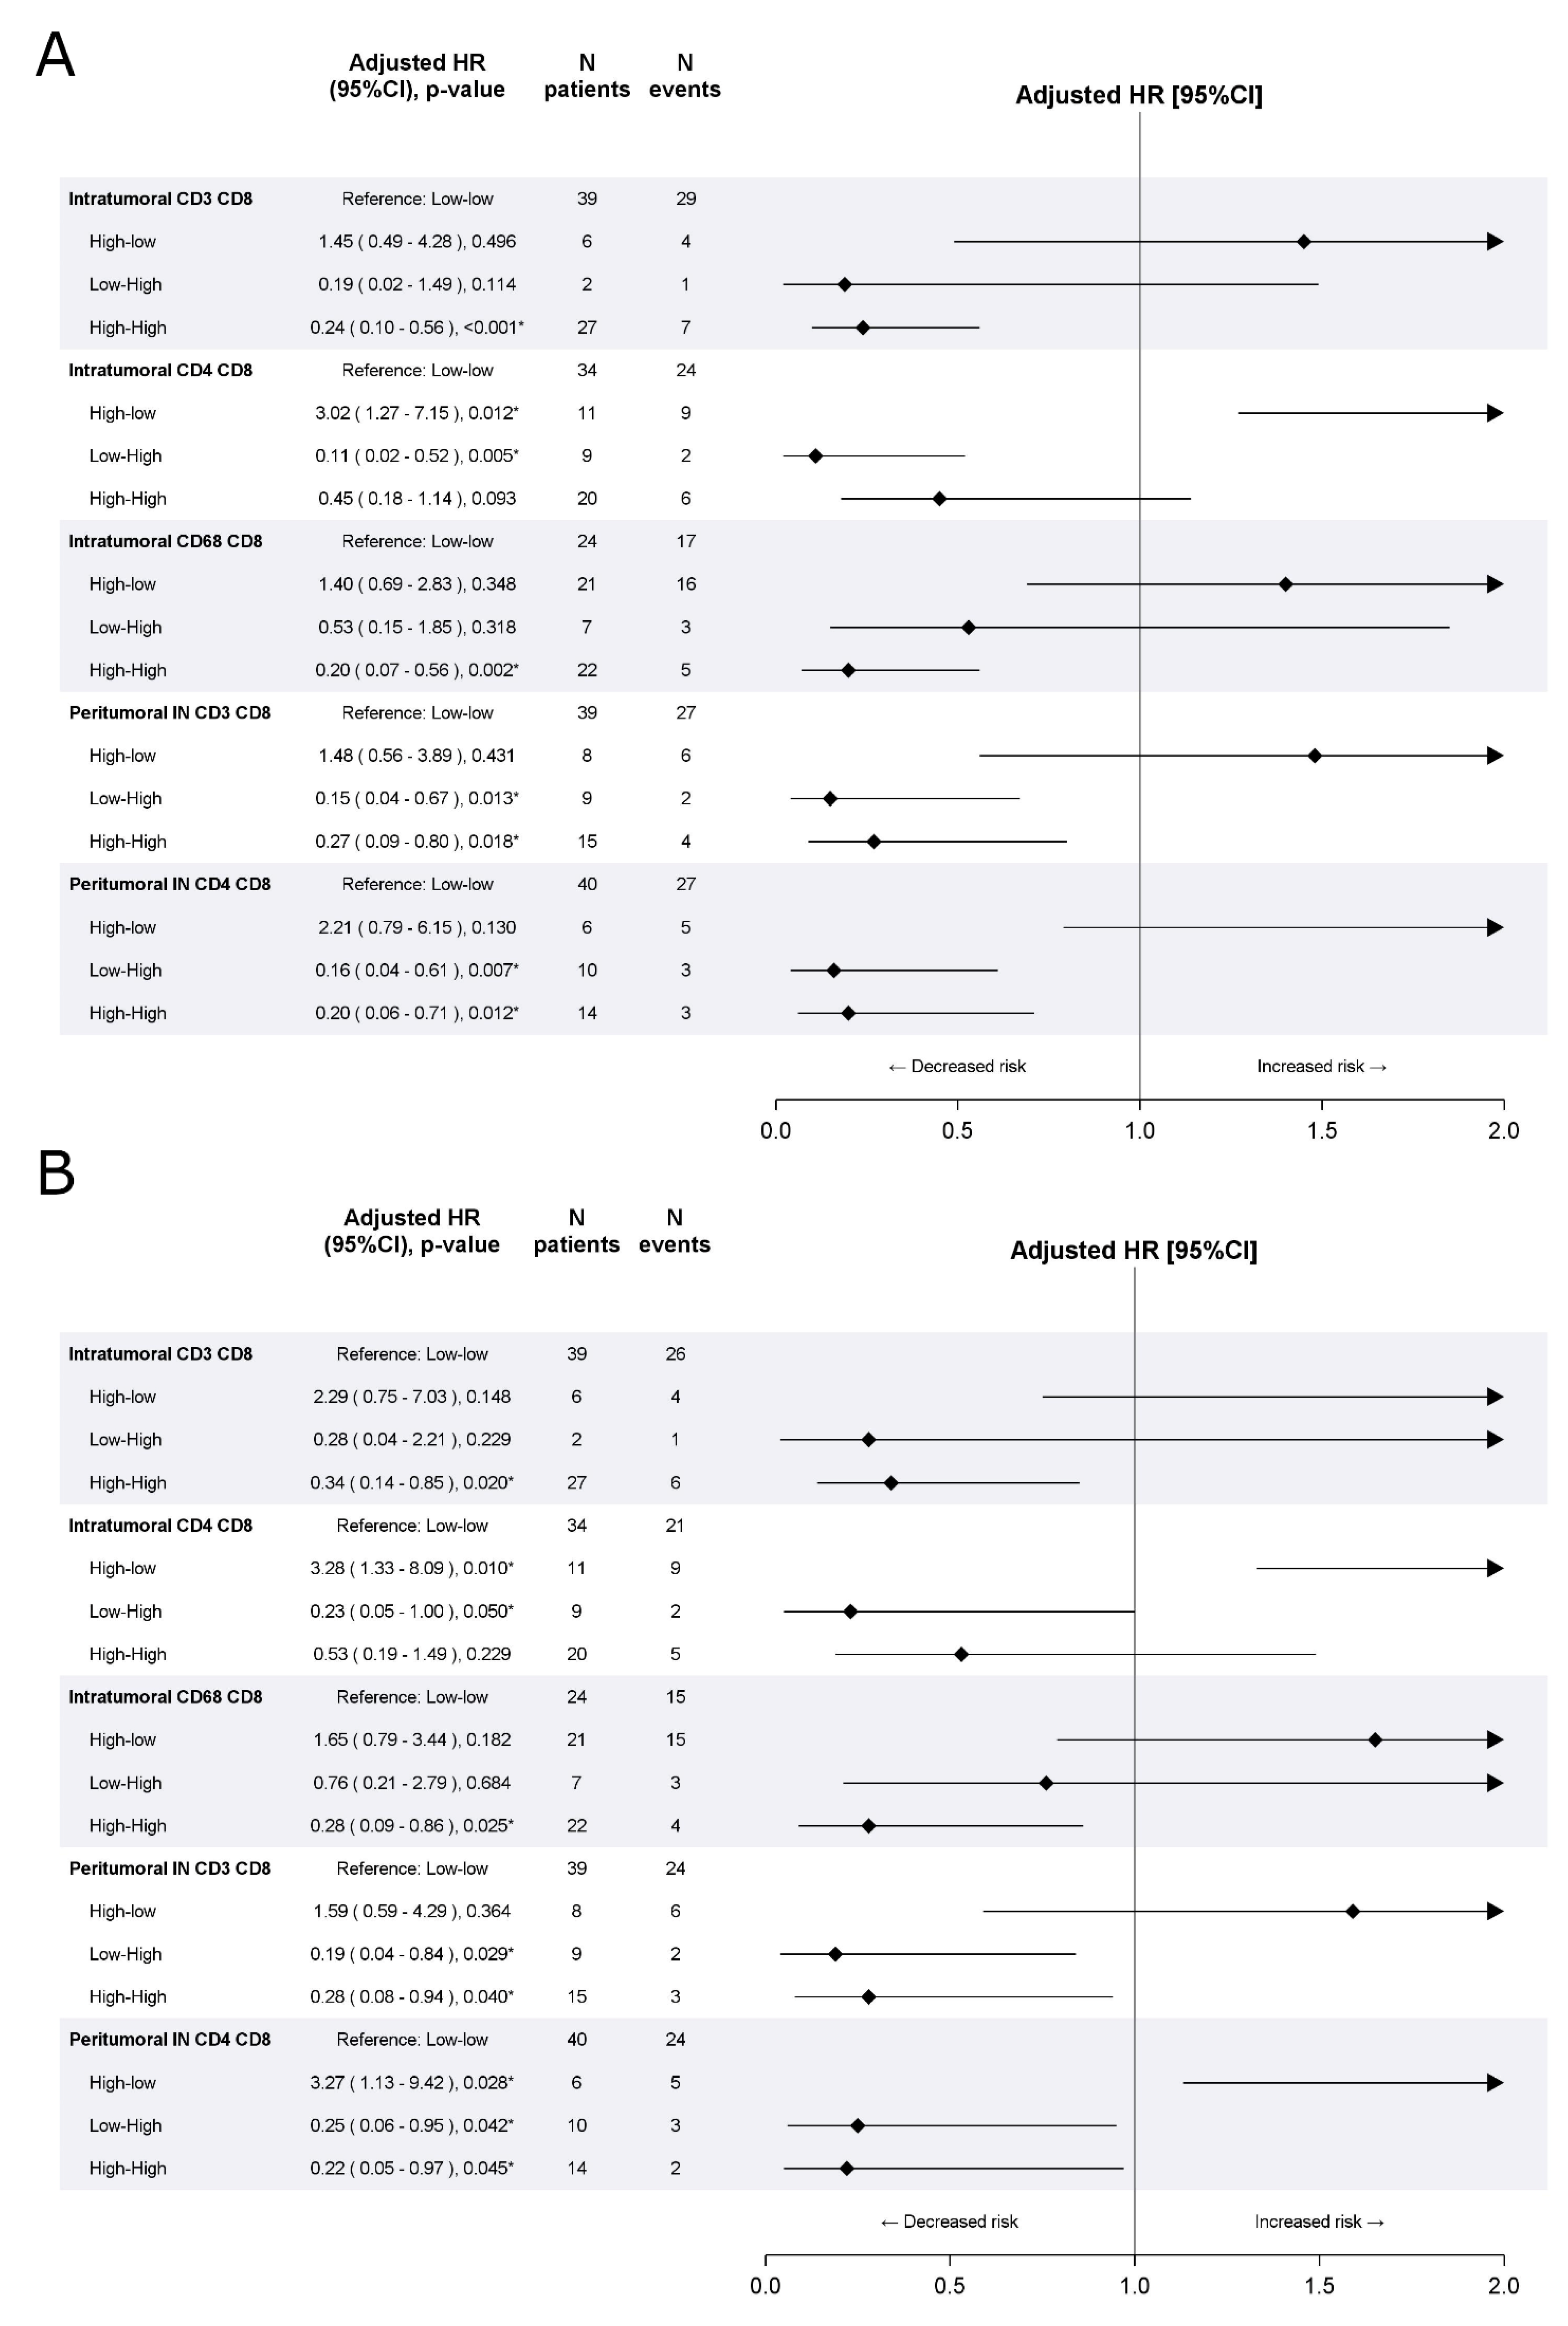
3.2. Validation Cohort
4. Discussion
Supplementary Materials
Author Contributions
Funding
Institutional Review Board Statement
Informed Consent Statement
Data Availability Statement
Conflicts of Interest
References
- Palucka, A.K.; Coussens, L.M. The basis of oncoimmunology. Cell 2016, 164, 1233–1247. [Google Scholar] [CrossRef]
- Teng, M.W.L.; Ngiow, S.F.; Ribas, A.; Smyth, M.J. Classifying cancers based on T-cell infil-tration and PD-L1. Cancer Res. 2015, 75, 2139–2145. [Google Scholar] [CrossRef]
- Poźniak, J.; Nsengimana, J.; Laye, J.P.; O’Shea, S.J.; Diaz, J.M.S.; Droop, A.P.; Filia, A.; Harland, M.; Davies, J.R.; Mell, T.; et al. Genetic and Environmental Determinants of Immune Response to Cutaneous Melanoma. Cancer Res. 2019, 79, 2684–2696. [Google Scholar] [CrossRef] [PubMed]
- Chen, D.S.; Mellman, D.S.C.I. Elements of cancer immunity and the cancer–immune set point. Nat. Cell Biol. 2017, 541, 321–330. [Google Scholar] [CrossRef] [PubMed]
- Curtin, J.A.; Fridlyand, J.; Kageshita, T.; Patel, H.N.; Busam, K.J.; Kutzner, H.; Cho, K.-H.; Aiba, S.; Bröcker, E.-B.; LeBoit, P.E.; et al. Distinct Sets of Genetic Alterations in Melanoma. N. Engl. J. Med. 2005, 353, 2135–2147. [Google Scholar] [CrossRef] [PubMed]
- Mandalà, M.; Massi, D. Tissue prognostic biomarkers in primary cutaneous melanoma. Virchows Arch. 2014, 464, 265–281. [Google Scholar] [CrossRef] [PubMed]
- Taylor, R.C.; Patel, A.; Panageas, K.S.; Busam, K.J.; Brady, M.S. Tumor-Infiltrating Lymphocytes Predict Sentinel Lymph Node Positivity in Patients With Cutaneous Melanoma. J. Clin. Oncol. 2007, 25, 869–875. [Google Scholar] [CrossRef] [PubMed]
- Azimi, F.; Scolyer, R.A.; Rumcheva, P.; Moncrieff, M.; Murali, R.; McCarthy, S.W.; Saw, R.P.; Thompson, J.F. Tumor-Infiltrating Lymphocyte Grade Is an Independent Predictor of Sentinel Lymph Node Status and Survival in Patients With Cutaneous Melanoma. J. Clin. Oncol. 2012, 30, 2678–2683. [Google Scholar] [CrossRef] [PubMed]
- Thomas, N.E.; Busam, K.J.; From, L.; Kricker, A.; Armstrong, B.K.; Anton-Culver, H.; Gruber, S.B.; Gallagher, R.P.; Zanetti, R.; Rosso, S.; et al. Tumor-Infiltrating Lymphocyte Grade in Primary Melanomas Is Independently Associated With Melanoma-Specific Survival in the Population-Based Genes, Environment and Melanoma Study. J. Clin. Oncol. 2013, 31, 4252–4259. [Google Scholar] [CrossRef] [PubMed]
- De Moll, E.H.; Fu, Y.; Qian, Y.; Perkins, S.H.; Wieder, S.Y.; Gnjatic, S.; Remark, R.; Bernardo, S.G.; Moskalenko, M.; Yao, J.; et al. Immune biomarkers are more accurate in prediction of survival in ulcerated than in non-ulcerated primary melanomas. Cancer Immunol. Immunother. 2015, 64, 1193–1203. [Google Scholar] [CrossRef]
- Donizy, P.; Kaczorowski, M.; Halon, A.; Leskiewicz, M.; Kozyra, C.; Matkowski, R. Paucity of tumor-infiltrating lymphocytes is an unfavorable prognosticator and predicts lymph node metastases in cutaneous melanoma patients. Anticancer Res. 2015, 35, 351–358. [Google Scholar]
- Letca, A.F.; Ungureanu, L.; Șenilă, S.C.; Grigore, L.E.; Pop, S.; Fechete, O.; Vesa, Ş.C.; Cosgarea, R. Regression and Sentinel Lymph Node Status in Melanoma Progression. Med. Sci. Monit. 2018, 24, 1359–1365. [Google Scholar] [CrossRef] [PubMed]
- Fu, Q.; Chen, N.; Ge, C.; Li, R.; Li, Z.; Zeng, B.; Li, C.; Wang, Y.; Xue, Y.; Song, X.; et al. Prognostic value of tumor-infiltrating lymphocytes in melanoma: A systematic review and meta-analysis. OncoImmunology 2019, 8, e1593806. [Google Scholar] [CrossRef]
- Mandalà, M.; Imberti, G.; Piazzalunga, D.; Belfiglio, M.; Labianca, R.; Barberis, M.; Marchesi, L.; Poletti, P.; Bonomi, L.; Novellino, L.; et al. Clinical and histopathological risk factors to predict sentinel lymph node positivity, disease-free and overall survival in clinical stages I–II AJCC skin melanoma: Outcome analysis from a single-institution prospectively collected database. Eur. J. Cancer 2009, 45, 2537–2545. [Google Scholar] [CrossRef] [PubMed]
- Busam, K.J.; Antonescu, C.R.; Marghoob, A.A.; Nehal, K.S.; Sachs, D.L.; Shia, J.; Berwick, M. Histologic Classification of Tumor-Infiltrating Lymphocytes in Primary Cutaneous Malignant Melanoma. Am. J. Clin. Pathol. 2001, 115, 856–860. [Google Scholar] [CrossRef] [PubMed]
- Mantovani, A.; Marchesi, F.; Malesci, A.; Laghi, L.; Allavena, P. Tumour-associated macrophages as treatment targets in oncology. Nat. Rev. Clin. Oncol. 2017, 14, 399–416. [Google Scholar] [CrossRef] [PubMed]
- Gartrell, R.D.; Marks, D.K.; Hart, T.D.; Li, G.; Davari, D.R.; Wu, A.; Blake, Z.; Lu, Y.; Askin, K.N.; Monod, A.; et al. Quantitative Analysis of Immune Infiltrates in Primary Melanoma. Cancer Immunol. Res. 2018, 6, 481–493. [Google Scholar] [CrossRef] [PubMed]
- Gershenwald, J.E.; Scolyer, R.A.; Hess, K.R.; Sondak, V.K.; Long, G.V.; Ross, M.I.; Lazar, A.J.; Faries, M.B.; Kirkwood, J.M.; McArthur, G.A.; et al. Melanoma staging: Evidence-based changes in the American Joint Committee on Cancer eighth edition cancer staging manual. CA Cancer J. Clin. 2017, 67, 472–492. [Google Scholar] [CrossRef]
- Clark, W.H.; Elder, D.E.; Guerry, D.; Braitman, L.E.; Trock, B.J.; Schultz, D.; Synnestvedt, M.; Halpern, A.C. Model Predicting Survival in Stage I Melanoma Based on Tumor Progression. J. Natl. Cancer Inst. 1989, 81, 1893–1904. [Google Scholar] [CrossRef] [PubMed]
- Parra, E.R.; Behrens, C.; Rodriguez-Canales, J.; Lin, H.; Mino, B.; Blando, J.; Zhang, J.; Gibbons, D.L.; Heymach, J.V.; Sepesi, B.; et al. Image Analysis–based Assessment of PD-L1 and Tumor-Associated Immune Cells Density Supports Distinct Intratumoral Microenvironment Groups in Non–small Cell Lung Carcinoma Patients. Clin. Cancer Res. 2016, 22, 6278–6289. [Google Scholar] [CrossRef] [PubMed]
- Eggermont, A.M.; Chiarion-Sileni, V.; Grob, J.-J.; Dummer, R.; Wolchok, J.D.; Schmidt, H.; Hamid, O.; Robert, C.; Ascierto, P.A.; Richards, J.M.; et al. Prolonged Survival in Stage III Melanoma with Ipilimumab Adjuvant Therapy. N. Engl. J. Med. 2016, 375, 1845–1855. [Google Scholar] [CrossRef]
- Hauschild, A.; Dummer, R.; Schadendorf, D.; Santinami, M.; Atkinson, V.; Mandalà, M.; Chiarion-Sileni, V.; Larkin, J.; Nyakas, M.; Dutriaux, C.; et al. Longer Follow-Up Confirms Relapse-Free Survival Benefit with Adjuvant Dabrafenib Plus Trametinib in Patients With Resected BRAF V600–Mutant Stage III Melanoma. J. Clin. Oncol. 2018, 36, 3441–3449. [Google Scholar] [CrossRef] [PubMed]
- Weber, J.; Mandalà, M.; Del Vecchio, M.; Gogas, H.; Arance, A.M.; Cowey, C.L.; Dalle, S.; Schenker, M.; Chiarion-Sileni, V.; Marquez-Rodas, I.; et al. Adjuvant Nivolumab versus Ipilimumab in Resected Stage III or IV Melanoma. N. Engl. J. Med. 2017, 377, 1824–1835. [Google Scholar] [CrossRef] [PubMed]
- Tuccitto, A.; Shahaj, E.; Vergani, E.; Ferro, S.; Huber, V.; Rodolfo, M.; Castelli, C.; Rivoltini, L.; Vallacchi, V. Immunosuppressive circuits in tumor microenvironment and their influence on cancer treatment efficacy. Virchows Arch. 2019, 474, 407–420. [Google Scholar] [CrossRef] [PubMed]
- Mandalà, M.; Rutkowski, P. Rational combination of cancer immunotherapy in melanoma. Virchows Arch. 2018, 474, 433–447. [Google Scholar] [CrossRef] [PubMed]
- Němejcová, K.; Tichá, I.; Bártů, M.; Kodet, O.; Důra, M.; Jakša, R.; Michálková, R.; Dundr, P. Comparison of five different scoring methods in the evaluation of inflammatory infiltration (tumor-infiltrating lymphocytes) in superficial spreading and nodular melanoma. Pigment. Cell Melanoma Res. 2019, 32, 412–423. [Google Scholar] [CrossRef]
- Galon, J.; Costes, A.; Sanchez-Cabo, F.; Kirilovsky, A.; Mlecnik, B.; Lagorce-Pagès, C.; Tosolini, M.; Camus, M.; Berger, A.; Wind, P.; et al. Type, Density, and Location of Immune Cells Within Human Colorectal Tumors Predict Clinical Outcome. Science 2006, 313, 1960–1964. [Google Scholar] [CrossRef] [PubMed]
- Galon, J.; Pagès, F.; Marincola, F.M.; Angell, H.K.; Thurin, M.; Lugli, A.; Zlobec, I.; Berger, A.; Bifulco, C.; Botti, G.; et al. Cancer classification using the Immunoscore: A worldwide task force. J. Transl. Med. 2012, 10, 205. [Google Scholar] [CrossRef]
- Wang, J.-J.; Lei, K.-F.; Han, F. Tumor microenvironment: Recent advances in various cancer treatments. Eur. Rev. Med Pharmacol. Sci. 2018, 22, 3855–3864. [Google Scholar]
- Pagès, F.; Mlecnik, B.; Marliot, F.; Bindea, G.; Ou, F.-S.; Bifulco, C.; Lugli, A.; Zlobec, I.; Rau, T.T.; Berger, M.D.; et al. International validation of the consensus Immunoscore for the classification of colon cancer: A prognostic and accuracy study. Lancet 2018, 391, 2128–2139. [Google Scholar] [CrossRef]
- Galon, J.; Mlecnik, B.; Bindea, G.; Angell, H.K.; Berger, A.; Lagorce, C.; Lugli, A.; Zlobec, I.; Hartmann, A.; Bifulco, C.; et al. Towards the introduction of the ‘Immunoscore’ in the classification of malignant tumours. J. Pathol. 2014, 232, 199–209. [Google Scholar] [CrossRef] [PubMed]
- Guo, W.; Lu, X.; Liu, Q.; Zhang, T.; Li, P.; Qiao, W.; Deng, M. Prognostic value of neutrophil-to-lymphocyte ratio and platelet-to-lymphocyte ratio for breast cancer patients: An updated meta-analysis of 17079 individuals. Cancer Med. 2019, 8, 4135–4148. [Google Scholar] [CrossRef] [PubMed]
- Clemente, C.G.; Mihm, M.C.; Bufalino, R.; Zurrida, S.; Collini, P.; Cascinelli, N. Prognostic value of tumor infiltrating lymphocytes in the vertical growth phase of primary cutaneous melanoma. Cancer 1996, 77, 1303–1310. [Google Scholar] [CrossRef]
- Piras, F.; Colombari, R.; Minerba, L.; Murtas, D.; Floris, C.; Maxia, C.; Corbu, A.; Perra, M.T.; Sirigu, P. The predictive value of CD8, CD4, CD68, and human leukocyte antigen-D-related cells in the prognosis of cutaneous malignant melanoma with vertical growth phase. Cancer 2005, 104, 1246–1254. [Google Scholar] [CrossRef] [PubMed]


| Variable | Training Cohort N = 100 | Validation Cohort N = 74 | Chi-Squared or Wilcoxon p-Value |
|---|---|---|---|
| Centre | - | ||
| University Hospital of Siena | 15 (15.0) | 0 (0.0) | |
| University of Florence | 42 (42.0) | 10 (13.5) | |
| University of Sassari/NRC | 43 (43.0) | 0 (0.0) | |
| Papa Giovanni XXIII Hospital, Bergamo | 0 (0.0) | 64 (86.5) | |
| Age | 0.619 | ||
| Mean (SD) | 63.2 (16.1) | 61.4 (18.6) | |
| Median (Q1–Q3) | 66.0 (50.3–75.3) | 65.8 (46.3–78.2) | |
| Min-Max | 24.0–89.4 | 21.9–88.1 | |
| Sex | 0.486 | ||
| Female | 38 (38.0) | 32 (43.2) | |
| Male | 62 (62.0) | 42 (56.8) | |
| Tumor site | 0.962 a | ||
| Limb | 45 (45.0) | 35 (47.9) | |
| Trunk | 45 (45.0) | 32 (43.8) | |
| Head/neck | 8 (8.0) | 6 (8.2) | |
| Other | 2 (2.0) | 0 (0.0) | |
| NAS | 0 | 1 | |
| Histology | 0.565 | ||
| Superficial spreading melanoma | 49 (49.0) | 40 (54.1) | |
| Nodular melanoma | 36 (36.0) | 21 (28.4) | |
| Other | 15 (15.0) | 13 (17.6) | |
| Breslow thickness (mm) | 0.587 | ||
| Mean (SD) | 6.0 (5.3) | 5.6 (4.6) | |
| Median (Q1–Q3) | 4.3 (3.0–6.5) | 4.0 (3.0–6.0) | |
| Min-Max | 2.1–35.0 | 2.0–25.0 | |
| Mitotic rate | 0.0024 | ||
| Mean (SD) | 9.4 (9.1) | 5.9 (4.5) | |
| Median (Q1–Q3) | 8.0 (3.0–11.0) | 5.0 (3.0–7.0) | |
| Min-Max | 0.0–57.0 | 0.0–23.0 | |
| Clark level | 0.257 | ||
| III | 8 (8.1) | 2 (2.7) | |
| IV | 77 (77.8) | 58 (78.4) | |
| V | 14 (14.1) | 14 (18.9) | |
| Missing | 1 | 0 | |
| Ulceration | 0.628 | ||
| No | 29 (29.0) | 19 (25.7) | |
| Yes | 71 (71.0) | 55 (74.3) | |
| TILs | <0.001 | ||
| Absent | 10 (10.0) | 33 (45.2) | |
| Non brisk | 82 (82.0) | 26 (35.6) | |
| Brisk | 8 (8.0) | 14 (19.2) | |
| Missing | 0 | 1 | |
| Stage at diagnosis | <0.001 b | ||
| I | 0 (0.0) | 1 (1.4) | |
| IB | 0 (0.0) | 1 (1.4) | |
| II | 58 (58.0) | 62 (83.8) | |
| IIA | 12 (20.7) | 10 (13.5) | |
| IIB | 23 (39.7) | 32 (43.2) | |
| IIC | 23 (39.7) | 20 (27.0) | |
| III | 42 (42.0) | 10 (13.5) | |
| IIIA | 0 (0.0) | 1 (1.4) | |
| IIIB | 7 (16.7) | 1 (1.4) | |
| IIIC | 30 (71.4) | 8 (10.8) | |
| IIID | 5 (11.9) | 0 (0.0) | |
| IV | 0 (0.0) | 1 (1.4) |
| Density | Training Cohort N = 100 | Validation Cohort N = 74 | Chi-Squared or Wilcoxon p-Value |
|---|---|---|---|
| CD3+ | |||
| Intratumoral density (cells/mm2) | 0.360 | ||
| Mean (SD) | 1543.9 (1448.4) | 1202.7 (1051.8) | |
| Median (Q1–Q3) | 997.7 (483.8–2163.5) | 800.9 (451.2–1590.9) | |
| Min-Max | 21.0–6275.8 | 47.8–5694.4 | |
| Missing | 19 | 0 | |
| CD3+ intratumoral density according to the median of the training cohort | 0.453 | ||
| Low | 40 (49.4) | 41 (55.4) | |
| High | 41 (50.6) | 33 (44.6) | |
| Missing | 19 | 0 | |
| CD3+ peritumoral IN density (cells/mm2) | 0.014 | ||
| Mean (SD) | 2281.1 (1483.6) | 1765.0 (1492.4) | |
| Median (Q1–Q3) | 2146.9 (1084.5–3162.3) | 1334.0 (775.0–2334.8) | |
| Min-Max | 61.4–6619.7 | 0.0–8655.1 | |
| Missing | 11 | 3 | |
| CD3+ peritumoral IN density according to the median of the training cohort | 0.021 | ||
| Low | 44 (49.4) | 48 (67.6) | |
| High | 45 (50.6) | 23 (32.4) | |
| Missing | 11 | 3 | |
| CD3+ peritumoral OUT density (cells/mm2) | <0.001 | ||
| Mean (SD) | 1916.9 (1363.2) | 379.5 (335.5) | |
| Median (Q1–Q3) | 1611.6 (796.2–2810.5) | 263.3 (146.3–483.5) | |
| Min-Max | 84.6–5300.5 | 27.6–1788.6 | |
| Missing | 11 | 3 | |
| CD3+ peritumoral OUT density according to the median of the training cohort | <0.001 | ||
| Low | 44 (49.4) | 70 (98.6) | |
| High | 45 (50.6) | 1 (1.4) | |
| Missing | 11 | 3 | |
| CD4+ intratumoral density (cells/mm2) | 0.340 | ||
| Mean (SD) | 1675.2 (1379.9) | 1532.3 (1422.1) | |
| Median (Q1–Q3) | 1421.9 (649.5–2333.5) | 1224.8 (551.6–2166.8) | |
| Min-Max | 0.0–7304.6 | 11.4–8665.0 | |
| Missing | 4 | ||
| CD4+ intratumoral density according to the median of the training cohort | 0.293 | ||
| Low | 48 (50.0) | 43 (58.1) | |
| High | 48 (50.0) | 31 (41.9) | |
| Missing | 4 | 0 | |
| CD4+ peritumoral IN density (cells/mm2) | 0.005 | ||
| Mean (SD) | 2622.3 (1662.8) | 1882.2 (1247.8) | |
| Median (Q1–Q3) | 2384.0 (1264.5–3727.1) | 1714.5 (854.8–2580.0) | |
| Min-Max | 0.4–6760.9 | 16.7–5601.2 | |
| Missing | 11 | 4 | |
| CD4+ peritumoral IN density according to the median of the training cohort | 0.005 | ||
| Low | 44 (49.4) | 50 (71.4) | |
| High | 45 (50.6) | 20 (28.6) | |
| Missing | 11 | 4 | |
| CD4+ peritumoral OUT density (cells/mm2) | <0.001 | ||
| Mean (SD) | 2177.9 (1467.5) | 601.4 (440.3) | |
| Median (Q1–Q3) | 1965.3 (1058.0–3124.4) | 495.1 (254.3–804.8) | |
| Min-Max | 0.0–6137.5 | 24.4–1979.4 | |
| Missing | 11 | 4 | |
| CD4+ peritumoral OUT density according to the median of the training cohort | <0.001 | ||
| Low | 44 (49.4) | 69 (98.6) | |
| High | 45 (50.6) | 1 (1.4) | |
| Missing | 11 | 4 | |
| CD8+ intratumoral density (cells/mm2) | 0.823 | ||
| Mean (SD) | 868.8 (1028.3) | 751.4 (719.6) | |
| Median (Q1–Q3) | 553.8 (160.7–1181.2) | 441.9 (258.1–1187.4) | |
| Min-Max | 13.1–6559.4 | 32.0–3809.9 | |
| MIssing | 5 | 0 | |
| CD8+ intratumoral density according to the median of the training cohort | 0.142 | ||
| Low | 47 (49.5) | 45 (60.8) | |
| High | 48 (50.5) | 29 (39.2) | |
| Missing | 5 | 0 | |
| CD8+ peritumoral IN density (cells/mm2) | 0.090 | ||
| Mean (SD) | 1429.1 (1335.5) | 1054.4 (1062.0) | |
| Median (Q1–Q3) | 1032.2 (447.1–2266.7) | 654.9 (320.8–1398.9) | |
| Min-Max | 33.2–5911.3 | 17.6–5334.9 | |
| Missing | 11 | 3 | |
| CD8+ peritumoral IN density according to the median of the training cohort | 0.034 | ||
| Low | 44 (49.4) | 47 (66.2) | |
| High | 45 (50.6) | 24 (33.8) | |
| Missing | 11 | 3 | |
| CD8+ peritumoral OUT density (cells/mm2) | <0.001 | ||
| Mean (SD) | 1119.8 (1122.1) | 227.0 (287.3) | |
| Median (Q1–Q3) | 646.2 (358.1–1406.7) | 154.5 (80.0–231.5) | |
| Min-Max | 4.8–5088.9 | 5.3–1651.2 | |
| Missing | 11 | 3 | |
| CD8+ peritumoral OUT density according to the median of the training cohort | <0.001 | ||
| Low | 44 (49.4) | 67 (94.4) | |
| High | 45 (50.6) | 4 (5.6) | |
| Missing | 11 | 3 | |
| CD68+ intratumoral density (cells/mm2) | 0.015 | ||
| Mean (SD) | 367.2 (398.5) | 583.7 (633.1) | |
| Median (Q1–Q3) | 248.1 (95.6–488.8) | 363.8 (172.6–763.1) | |
| Min-Max | 4.8–1981.5 | 1.7–2958.6 | |
| Missing | 6 | 0 | |
| CD68+ intratumoral density according to the median of the training cohort | 0.296 | ||
| Low | 47 (50.0) | 31 (41.9) | |
| High | 47 (50.0) | 43 (58.1) | |
| Missing | 6 | 0 | |
| CD68+ peritumoral IN density (cells/mm2) | 0.281 | ||
| Mean (SD) | 469.7 (494.6) | 611.7 (658.4) | |
| Median (Q1–Q3) | 264.3 (128.9–661.9) | 459.7 (144.1–773.6) | |
| Min-Max | 0.0–2589.4 | 1.3–3022.2 | |
| Missing | 11 | 3 | |
| CD68+ peritumoral IN density according to the median of the training cohort | 0.104 | ||
| Low | 44 (49.4) | 26 (36.6) | |
| High | 45 (50.6) | 45 (63.4) | |
| Missing | 11 | 3 | |
| CD68+ peritumoral OUT density (cells/mm2) | <0.001 | ||
| Mean (SD) | 337.9 (312.6) | 88.7 (120.3) | |
| Median (Q1–Q3) | 243.4 (116.7–476.0) | 51.9 (5.9–136.7) | |
| Min-Max | 2.9–1775.6 | 0.0–588.2 | |
| Missing | 11 | 3 | |
| CD68+ peritumoral OUT density according to the median of the training cohort | <0.001 | ||
| Low | 45 (50.6) | 67 (94.4) | |
| High | 44 (49.4) | 4 (5.6) | |
| Missing | 11 | 3 | |
| CD163+ intratumoral density (cells/mm2) | - | ||
| Mean (SD) | 1188.9 (1073.4) | - | |
| Median (Q1–Q3) | 757.6 (481.2–1580.8) | - | |
| Min-Max | 18.8–5017.9 | - | |
| Missing | 4 | - | |
| CD163+ peritumoral IN density (cells/mm2) | - | ||
| Mean (SD) | 1472.6 (1090.4) | - | |
| Median (Q1–Q3) | 1205.6 (608.6–2033.9) | - | |
| Min-Max | 41.4–5147.3 | - | |
| Missing | 11 | - | |
| CD163+ peritumoral OUT density (cells/mm2) | - | ||
| Mean (SD) | 1061.4 (691.7) | - | |
| Median (Q1–Q3) | 878.3 (548.9–1388.2) | - | |
| Min-Max | 101.4–3456.6 | - | |
| Missing | 11 | - | |
| FOXP3 intratumoral density (cells/mm2) | - | ||
| Mean (SD) | 528.5 (1297.7) | - | |
| Median (Q1–Q3) | 40.5 (2.2–315.3) | - | |
| Min-Max | 0.0–6794.9 | - | |
| Missing | 4 | - | |
| FOXP3 peritumoral IN density (cells/mm2) | - | ||
| Mean (SD) | 430.1 (1031.0) | - | |
| Median (Q1–Q3) | 69.2 (1.5–409.2) | - | |
| Min-Max | 0.0–7104.4 | - | |
| Missing | 11 | - | |
| FOXP3 peritumoral OUT density (cells/mm2) | - | ||
| Mean (SD) | 292.4 (602.4) | - | |
| Median (Q1–Q3) | 40.3 (0.5–306.1) | - | |
| Min-Max | 0.0–2898.8 | - | |
| Missing | 11 | - | |
| PD1 intratumoral density (cells/mm2) | - | ||
| Mean (SD) | 440.4 (604.6) | - | |
| Median (Q1–Q3) | 253.5 (57.9–507.5) | - | |
| Min-Max | 3.7–3038.4 | - | |
| Missing | 4 | - | |
| PD1 peritumoral IN density (cells/mm2) | - | ||
| Mean (SD) | 806.4 (959.3) | - | |
| Median (Q1–Q3) | 512.3 (164.9–1124.6) | - | |
| Min-Max | 7.2–5068.7 | - | |
| Missing | 11 | - | |
| PD1 peritumoral OUT density (cells/mm2) | - | ||
| Mean (SD) | 549.9 (678.0) | - | |
| Median (Q1–Q3) | 361.4 (160.9–654.2) | - | |
| Min-Max | 6.2–4411.1 | - | |
| Missing | 11 | - | |
| PD-L1 intratumoral density (cells/mm2) | - | ||
| Mean (SD) | 358.5 (872.7) | - | |
| Median (Q1–Q3) | 39.9 (11.9–260.2) | - | |
| Min-Max | 0.1–6251.2 | - | |
| Missing | 4 | - | |
| PD-L1 peritumoral IN density (cells/mm2) | - | ||
| Mean (SD) | 331.3 (685.1) | - | |
| Median (Q1–Q3) | 52.0 (8.8–257.5) | - | |
| Min-Max | 0.0–3501.0 | - | |
| Missing | 11 | - | |
| PD-L1 peritumoral OUT density (cells/mm2) | - | ||
| Mean (SD) | 108.0 (192.5) | - | |
| Median (Q1–Q3) | 30.1 (9.4–124.0) | - | |
| Min-Max | 0.0–919.1 | - | |
| Missing | 11 | - |
| DISEASE FREE SURVIVAL | OVERALL SURVIVAL | |||||||
|---|---|---|---|---|---|---|---|---|
| Univariable Analysis | Multivariable Analysis | Univariable Analysis | Multivariable Analysis | |||||
| HR (95% CI) | p-Value | HR (95% CI) | p-Value | HR (95% CI) | p-Value | HR (95% CI) | p-Value | |
| CD3+ | ||||||||
| Intratumoral(100 cell/mm2 increase) | 0.98 (0.96–1.00) | 0.060 | 0.98 (0.96–1.00) | 0.059 | 0.98 (0.96–1.00) | 0.121 | 0.98 (0.96–1.00) | 0.074 |
| Intratumoral(high vs. low) | 0.59 (0.35–1.00) | 0.050 * | 0.59 (0.33–1.05) | 0.072 | 0.72 (0.41–1.27) | 0.256 | 0.66 (0.36–1.20) | 0.173 |
| Peritumoral IN(100 cell/mm2 increase) | 0.98 (0.96–1.00) | 0.072 | 0.98 (0.97–1.00) | 0.090 | 0.98 (0.96–1.00) | 0.112 | 0.99 (0.96–1.01) | 0.179 |
| Peritumoral IN(high vs. low) | 0.75 (0.44–1.28) | 0.290 | 0.78 (0.46–1.33) | 0.361 | 0.75 (0.42–1.34) | 0.338 | 0.76 (0.43–1.37) | 0.365 |
| Peritumoral OUT(100 cell/mm2 increase) | 0.98 (0.96–1.00) | 0.120 | 0.98 (0.96–1.00) | 0.055 | 0.98 (0.96–1.01) | 0.183 | 0.98 (0.95–1.00) | 0.044 * |
| Peritumoral OUT(high vs. low) | 0.69 (0.40–1.18) | 0.172 | 0.62 (0.36–1.07) | 0.086 | 0.80 (0.45–1.44) | 0.459 | 0.64 (0.35–1.15) | 0.137 |
| CD4+ | ||||||||
| Intratumoral(100 cell/mm2 increase) | 0.98 (0.95–1.00) | 0.032 * | 0.98 (0.95–1.00) | 0.041 * | 0.98 (0.95–1.00) | 0.073 | 0.98 (0.95–1.00) | 0.104 |
| Intratumoral(high vs. low) | 0.67 (0.41–1.09) | 0.109 | 0.70 (0.43–1.16) | 0.166 | 0.67 (0.39–1.17) | 0.159 | 0.75 (0.43–1.31) | 0.318 |
| Peritumoral IN(100 cell/mm2 increase) | 0.98 (0.96–1.00) | 0.056 | 0.99 (0.97–1.01) | 0.196 | 0.98 (0.96–1.00) | 0.086 | 0.99 (0.97–1.01) | 0.296 |
| Peritumoral IN(high vs. low) | 0.71 (0.42–1.20) | 0.201 | 0.83 (0.48–1.44) | 0.510 | 0.79 (0.45–1.41) | 0.434 | 0.97 (0.54–1.75) | 0.925 |
| Peritumoral OUT(100 cell/mm2 increase) | 0.98 (0.97–1.00) | 0.123 | 0.98 (0.96–1.00) | 0.096 | 0.99 (0.97–1.01) | 0.412 | 0.98 (0.96–1.01) | 0.175 |
| Peritumoral OUT(high vs. low) | 0.74 (0.44–1.26) | 0.270 | 0.70 (0.40–1.22) | 0.210 | 0.80 (0.45–1.42) | 0.443 | 0.64 (0.35–1.18) | 0.153 |
| CD8+ | ||||||||
| Intratumoral(100 cell/mm2 increase) | 0.98 (0.95–1.01) | 0.108 | 0.99 (0.96–1.02) | 0.387 | 0.96 (0.92–1.00) | 0.050 * | 0.98 (0.94–1.01) | 0.219 |
| Intratumoral(high vs. low) | 0.70 (0.42–1.15) | 0.160 | 0.74 (0.45–1.22) | 0.241 | 0.57 (0.32–0.99) | 0.048 * | 0.64 (0.36–1.13) | 0.122 |
| Peritumoral IN(100 cell/mm2 increase) | 0.99 (0.97–1.01) | 0.287 | 1.00 (0.97–1.02) | 0.693 | 0.98 (0.95–1.01) | 0.112 | 0.99 (0.96–1.02) | 0.451 |
| Peritumoral IN(high vs. low) | 0.90 (0.53–1.52) | 0.684 | 1.05 (0.60–1.81) | 0.872 | 0.73 (0.41–1.31) | 0.293 | 0.87 (0.47–1.60) | 0.657 |
| Peritumoral OUT(100 cell/mm2 increase) | 0.98 (0.95–1.01) | 0.157 | 0.98 (0.95–1.01) | 0.171 | 0.98 (0.94–1.01) | 0.152 | 0.97 (0.94–1.01) | 0.151 |
| Peritumoral OUT(high vs. low) | 0.95 (0.56–1.62) | 0.853 | 0.98 (0.57–1.69) | 0.947 | 0.75 (0.42–1.35) | 0.336 | 0.74 (0.41–1.35) | 0.323 |
| CD68+ | ||||||||
| Intratumoral(100 cell/mm2 increase) | 1.00 (0.99–1.01) | 0.775 | 1.00 (0.99–1.01) | 0.934 | 1.00 (0.99–1.00) | 0.322 | 1.00 (0.99–1.00) | 0.328 |
| Intratumoral(high vs. low) | 0.86 (0.52–1.42) | 0.547 | 0.78 (0.46–1.31) | 0.349 | 0.51 (0.29–0.92) | 0.025 * | 0.52 (0.29–0.95) | 0.033 * |
| Peritumoral IN(100 cell/mm2 increase) | 1.00 (0.99–1.00) | 0.366 | 1.00 (0.99–1.00) | 0.553 | 1.00 (0.99–1.00) | 0.429 | 1.00 (0.99–1.01) | 0.588 |
| Peritumoral IN(high vs. low) | 0.83 (0.48–1.40) | 0.478 | 0.79 (0.46–1.37) | 0.408 | 0.75 (0.42–1.36) | 0.345 | 0.73 (0.40–1.32) | 0.298 |
| Peritumoral OUT(100 cell/mm2 increase) | 1.00 (1.00–1.01) | 0.451 | 1.00 (1.00–1.01) | 0.368 | 1.00 (0.99–1.01) | 0.862 | 1.00 (0.99–1.01) | 0.864 |
| Peritumoral OUT(high vs. low) | 1.10 (0.65–1.86) | 0.725 | 1.02 (0.58–1.79) | 0.945 | 0.85 (0.47–1.51) | 0.574 | 0.70 (0.38–1.30) | 0.259 |
| CD163+ | ||||||||
| Intratumoral(100 cell/mm2 increase) | 0.97 (0.95–1.00) | 0.046 * | 0.98 (0.96–1.00) | 0.070 | 0.97 (0.95–1.00) | 0.062 | 0.98 (0.95–1.00) | 0.094 |
| Intratumoral(high vs. low) | 0.68 (0.41–1.13) | 0.135 | 0.85 (0.51–1.44) | 0.548 | 0.59 (0.33–1.03) | 0.063 | 0.77 (0.43–1.39) | 0.387 |
| Peritumoral IN(100 cell/mm2 increase) | 0.98 (0.95–1.00) | 0.093 | 0.98 (0.96–1.01) | 0.127 | 0.98 (0.95–1.01) | 0.170 | 0.99 (0.96–1.01) | 0.275 |
| Peritumoral IN(high vs. low) | 0.53 (0.31–0.90) | 0.019 * | 0.56 (0.32–0.99) | 0.047 * | 0.57 (0.32–1.03) | 0.064 | 0.64 (0.35–1.19) | 0.158 |
| Peritumoral OUT(100 cell/mm2 increase) | 0.97 (0.93–1.01) | 0.198 | 0.97 (0.93–1.01) | 0.123 | 0.98 (0.94–1.03) | 0.393 | 0.97 (0.94–1.01) | 0.206 |
| Peritumoral OUT(high vs. low) | 0.69 (0.41–1.18) | 0.174 | 0.73 (0.43–1.25) | 0.248 | 0.70 (0.39–1.26) | 0.236 | 0.70 (0.39–1.26) | 0.231 |
| FOXP3 | ||||||||
| Intratumoral(10 cell/mm2 increase) | 1.00 (1.00–1.00) | 0.359 | 1.00 (1.00–1.00) | 0.804 | 1.00 (1.00–1.00) | 0.050 | 1.00 (1.00–1.00) | 0.329 |
| Intratumoral(high vs. low) | 0.84 (0.51–1.38) | 0.498 | 0.66 (0.39–1.10) | 0.112 | 1.25 (0.72–2.16) | 0.432 | 0.94 (0.53–1.66) | 0.827 |
| Peritumoral IN(10 cell/mm2 increase) | 1.00 (1.00–1.00) | 0.713 | 1.00 (1.00–1.00) | 0.377 | 1.00 (1.00–1.00) | 0.565 | 1.00 (1.00–1.00) | 0.956 |
| Peritumoral IN(high vs. low) | 0.72 (0.42–1.21) | 0.216 | 0.59 (0.34–1.02) | 0.057 | 0.81 (0.46–1.44) | 0.477 | 0.63 (0.35–1.14) | 0.126 |
| Peritumoral OUT(10 cell/mm2 increase) | 1.00 (0.99–1.00) | 0.365 | 1.00 (0.99–1.00) | 0.126 | 1.00 (1.00–1.00) | 0.950 | 1.00 (0.99–1.00) | 0.295 |
| Peritumoral OUT(high vs. low) | 0.80 (0.47–1.35) | 0.401 | 0.66 (0.39–1.13) | 0.130 | 0.87 (0.49–1.55) | 0.642 | 0.61 (0.34–1.12) | 0.109 |
| PD1 | ||||||||
| Intratumoral(100 cell/mm2 increase) | 0.98 (0.93–1.02) | 0.287 | 1.00 (0.95–1.05) | 0.916 | 0.97 (0.91–1.02) | 0.227 | 1.00 (0.94–1.06) | 0.893 |
| Intratumoral(high vs. low) | 0.84 (0.51–1.38) | 0.492 | 0.96 (0.57–1.62) | 0.878 | 0.58 (0.33–1.03) | 0.061 | 0.63 (0.35–1.12) | 0.117 |
| Peritumoral IN(100 cell/mm2 increase) | 0.97 (0.94–1.01) | 0.116 | 0.98 (0.95–1.02) | 0.308 | 0.97 (0.93–1.01) | 0.116 | 0.98 (0.94–1.02) | 0.376 |
| Peritumoral IN(high vs. low) | 0.62 (0.36–1.06) | 0.078 | 0.70 (0.40–1.22) | 0.210 | 0.53 (0.29–0.97) | 0.039 * | 0.59 (0.32–1.10) | 0.095 |
| Peritumoral OUT(100 cell/mm2 increase) | 0.97 (0.93–1.02) | 0.262 | 0.98 (0.94–1.03) | 0.447 | 0.97 (0.92–1.02) | 0.259 | 0.97 (0.92–1.03) | 0.305 |
| Peritumoral OUT(high vs. low) | 0.92 (0.54–1.55) | 0.747 | 1.04 (0.59–1.82) | 0.894 | 0.80 (0.45–1.43) | 0.456 | 0.86 (0.47–1.59) | 0.638 |
| PD-L1 | ||||||||
| Intratumoral(10 cell/mm2 increase) | 1.00 (1.00–1.00) | 0.764 | 1.00 (1.00–1.00) | 0.823 | 1.00 (1.00–1.00) | 0.847 | 1.00 (1.00–1.00) | 0.624 |
| Intratumoral(high vs. low) | 0.90 (0.54–1.49) | 0.678 | 1.03 (0.62–1.74) | 0.897 | 0.83 (0.47–1.46) | 0.514 | 0.98 (0.55–1.75) | 0.957 |
| Peritumoral IN(10 cell/mm2 increase) | 0.99 (0.99–1.00) | 0.069 | 1.00 (0.99–1.00) | 0.128 | 0.99 (0.98–1.00) | 0.085 | 0.99 (0.99–1.00) | 0.154 |
| Peritumoral IN(high vs. low) | 0.70 (0.41–1.19) | 0.188 | 0.76 (0.44–1.31) | 0.327 | 0.51 (0.28–0.93) | 0.027 * | 0.58 (0.31–1.07) | 0.079 |
| Peritumoral OUT(10 cell/mm2 increase) | 0.99 (0.97–1.00) | 0.123 | 0.98 (0.97–1.00) | 0.098 | 0.99 (0.97–1.01) | 0.241 | 0.98 (0.96–1.00) | 0.128 |
| Peritumoral OUT(high vs. low) | 0.94 (0.55–1.61) | 0.830 | 0.92 (0.53–1.60) | 0.772 | 0.94 (0.52–1.69) | 0.839 | 0.80 (0.44–1.46) | 0.461 |
Publisher’s Note: MDPI stays neutral with regard to jurisdictional claims in published maps and institutional affiliations. |
© 2021 by the authors. Licensee MDPI, Basel, Switzerland. This article is an open access article distributed under the terms and conditions of the Creative Commons Attribution (CC BY) license (http://creativecommons.org/licenses/by/4.0/).
Share and Cite
De Logu, F.; Galli, F.; Nassini, R.; Ugolini, F.; Simi, S.; Cossa, M.; Miracco, C.; Gianatti, A.; De Giorgi, V.; Rulli, E.; et al. Digital Immunophenotyping Predicts Disease Free and Overall Survival in Early Stage Melanoma Patients. Cells 2021, 10, 422. https://doi.org/10.3390/cells10020422
De Logu F, Galli F, Nassini R, Ugolini F, Simi S, Cossa M, Miracco C, Gianatti A, De Giorgi V, Rulli E, et al. Digital Immunophenotyping Predicts Disease Free and Overall Survival in Early Stage Melanoma Patients. Cells. 2021; 10(2):422. https://doi.org/10.3390/cells10020422
Chicago/Turabian StyleDe Logu, Francesco, Francesca Galli, Romina Nassini, Filippo Ugolini, Sara Simi, Mara Cossa, Clelia Miracco, Andrea Gianatti, Vincenzo De Giorgi, Eliana Rulli, and et al. 2021. "Digital Immunophenotyping Predicts Disease Free and Overall Survival in Early Stage Melanoma Patients" Cells 10, no. 2: 422. https://doi.org/10.3390/cells10020422
APA StyleDe Logu, F., Galli, F., Nassini, R., Ugolini, F., Simi, S., Cossa, M., Miracco, C., Gianatti, A., De Giorgi, V., Rulli, E., Cossu, A., Massi, D., & Mandalà, M. (2021). Digital Immunophenotyping Predicts Disease Free and Overall Survival in Early Stage Melanoma Patients. Cells, 10(2), 422. https://doi.org/10.3390/cells10020422