
Mayaro Virus Non-Structural Protein 2 Circumvents the Induction of Interferon in Part by Depleting Host Transcription Initiation Factor IIE Subunit 2

 , , ,
, , ,  and
and 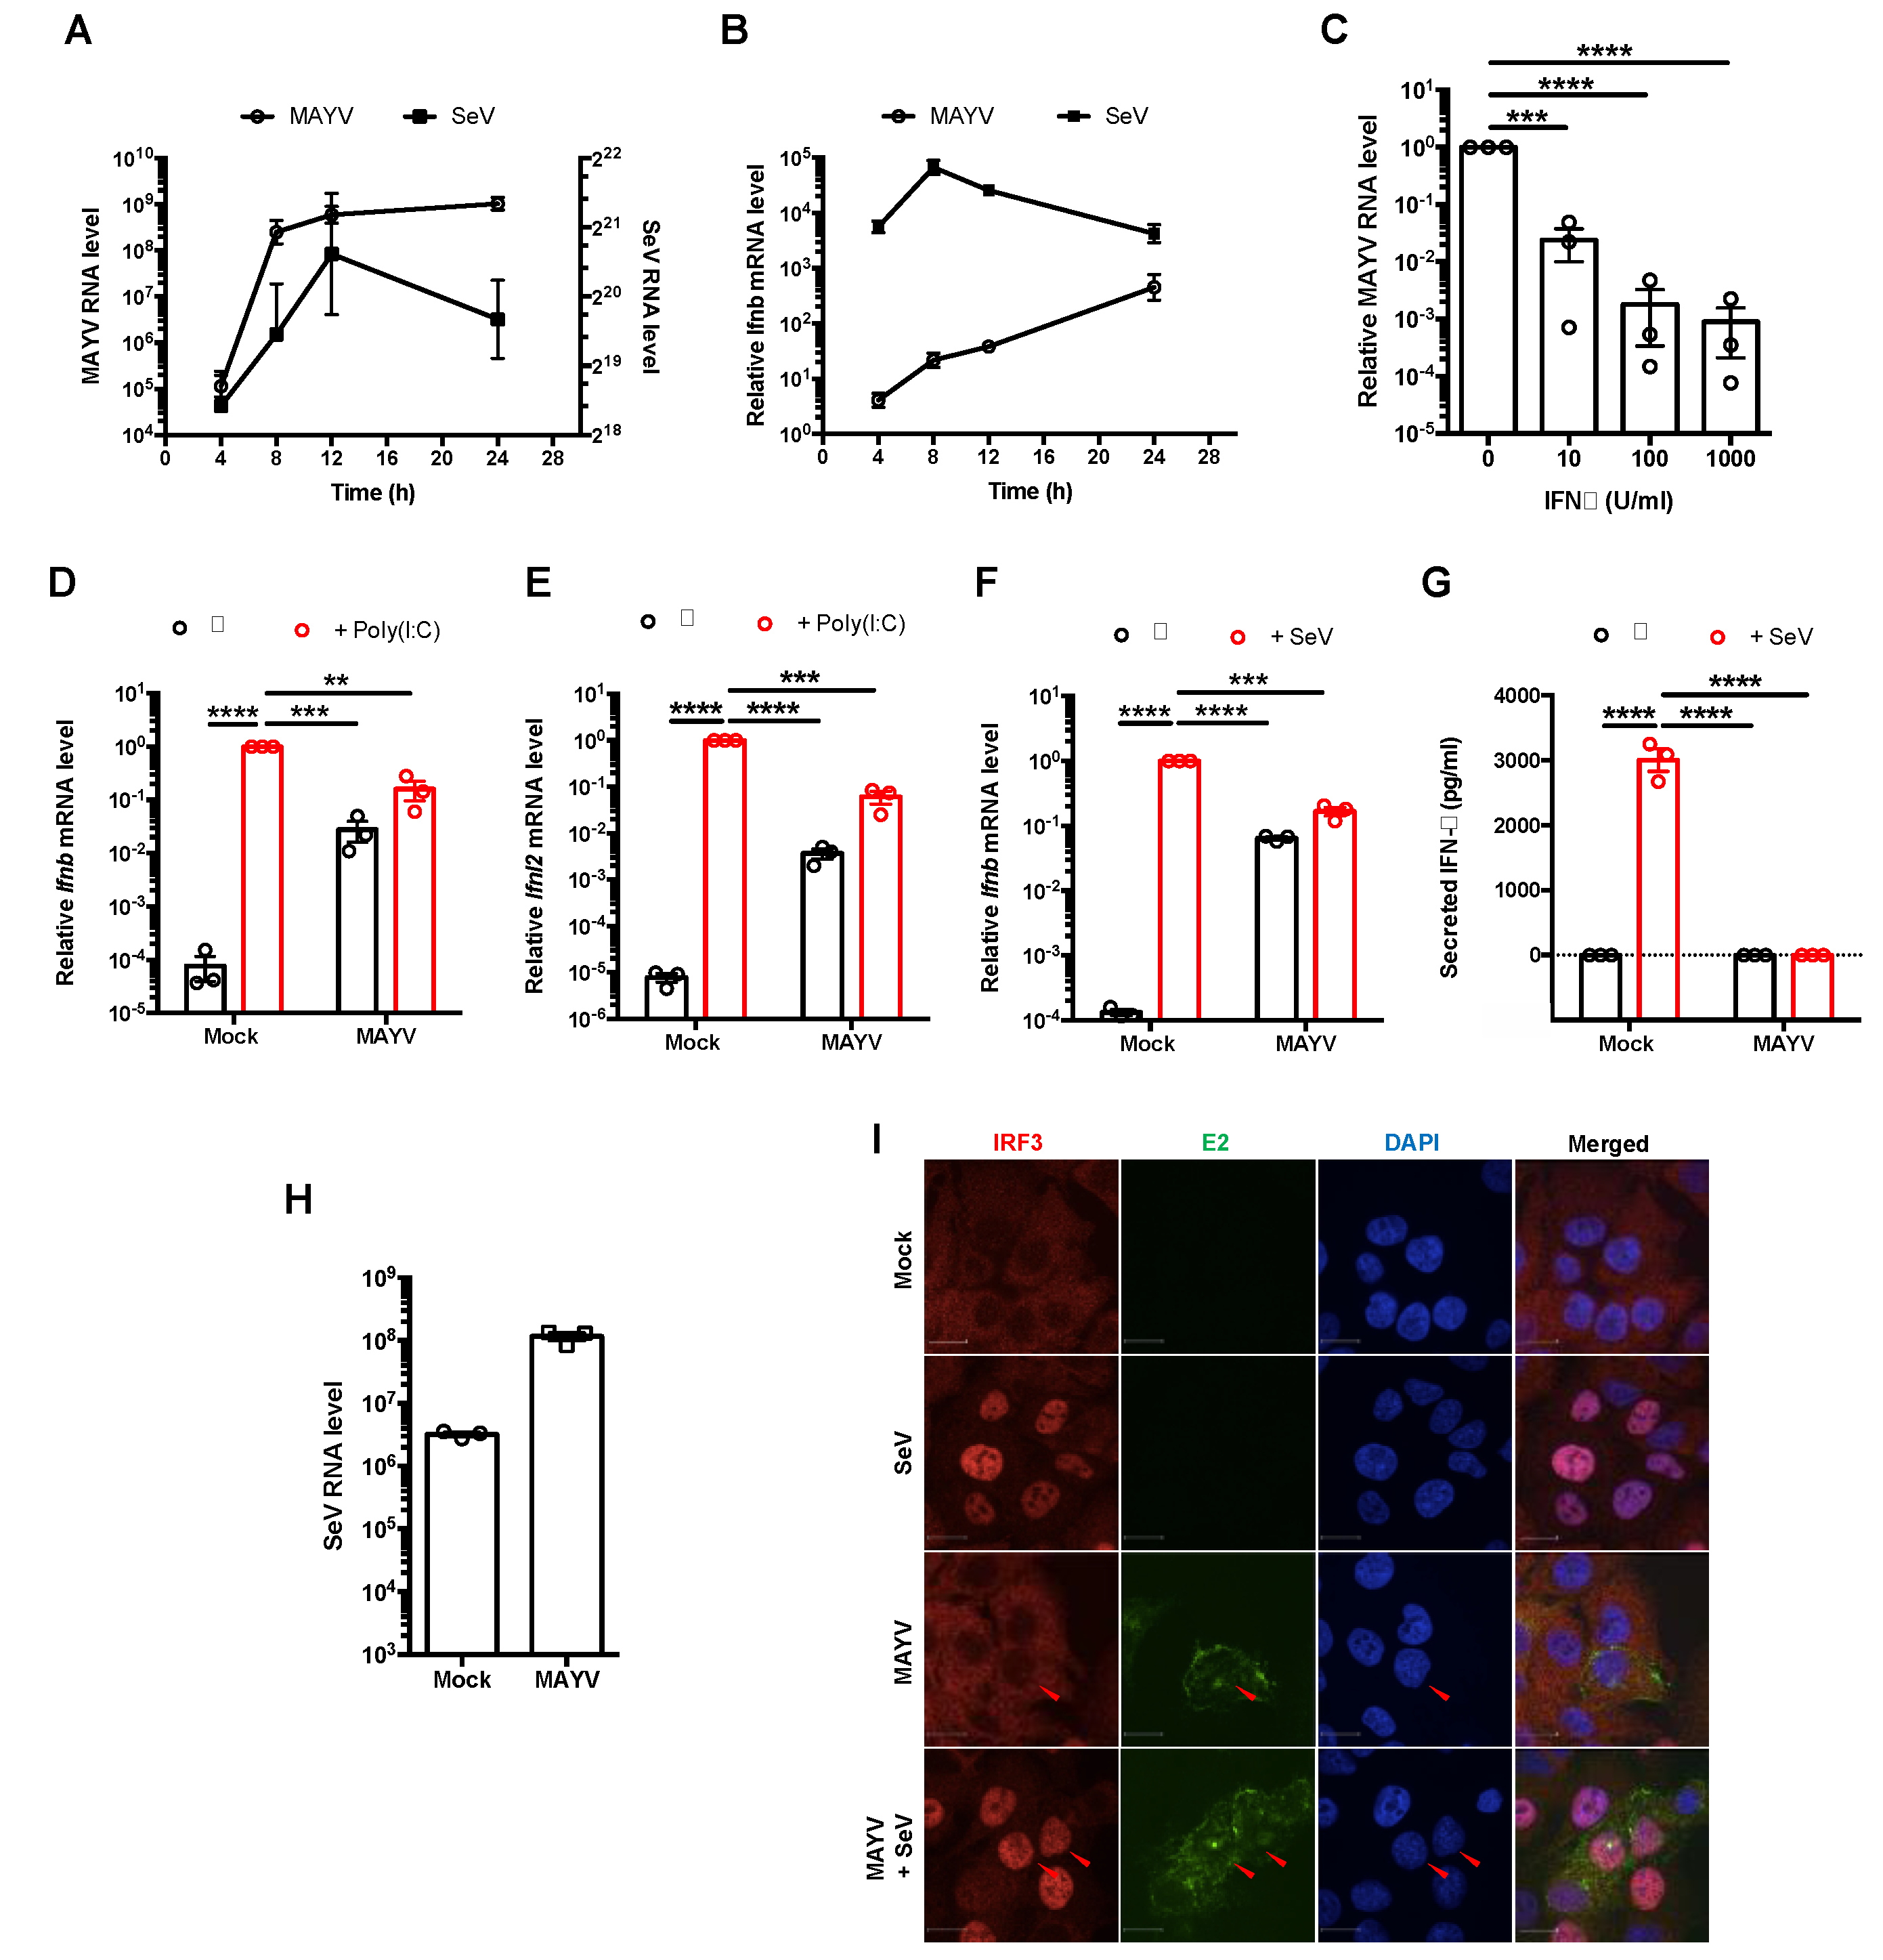
Abstract
:1. Introduction
2. Materials and Methods
2.1. Cell Culture and Virus Infection
2.2. Plasmids and Transfection
2.3. Antibodies and Compounds
2.4. Immunoblotting
2.5. Immunoprecipitation
2.6. Mass Spectrometry and Mass Spectrometry Interaction Statistics (MiST)
2.7. Biological Process Enrichment Analysis
2.8. Confocal Immunofluorescence (IF) Microscopy
2.9. Quantitative Real Time PCR (qRT-PCR)
2.10. Luciferase Reporter Assay
2.11. Enzyme-Linked Immunosorbent Assay (ELISA)
2.12. Statistical Analyses
3. Results
3.1. MAYV Suppressed Production of Type I and III IFNs Downstream of IRF3 Nuclear Translocation
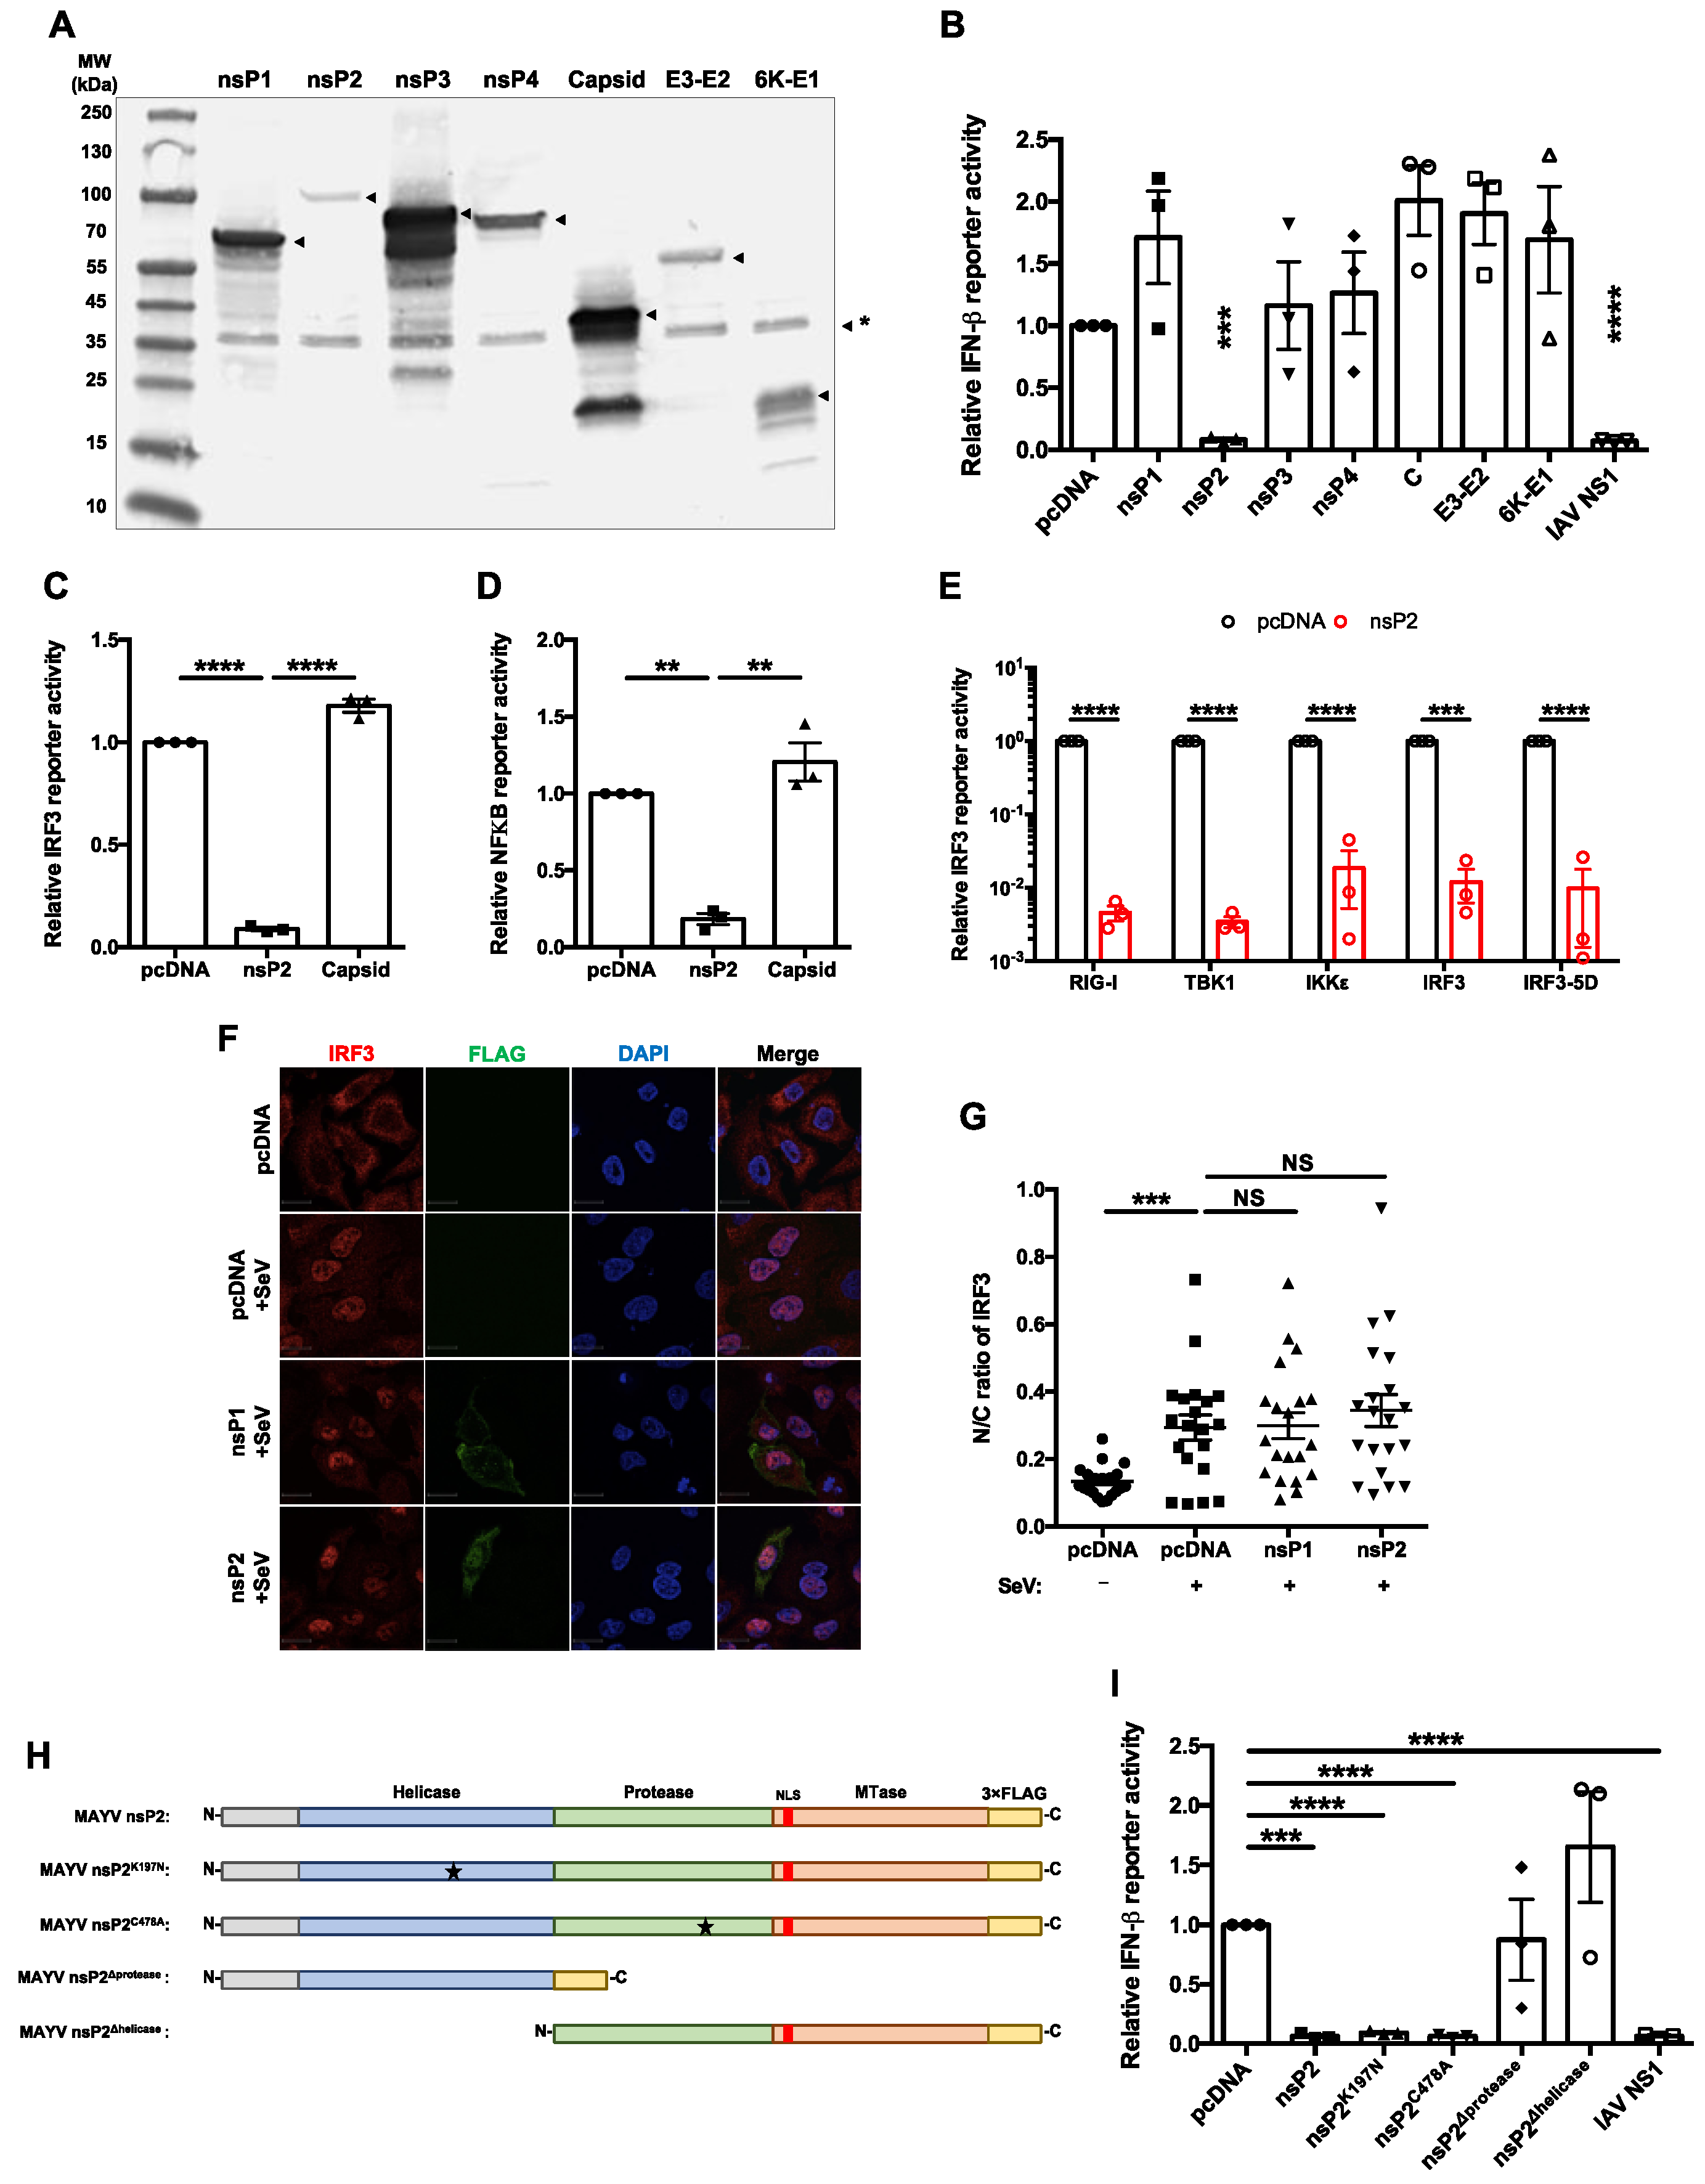
3.2. MAYV nsP2 Abrogated Interferon Induction Downstream of IRF3 Activation
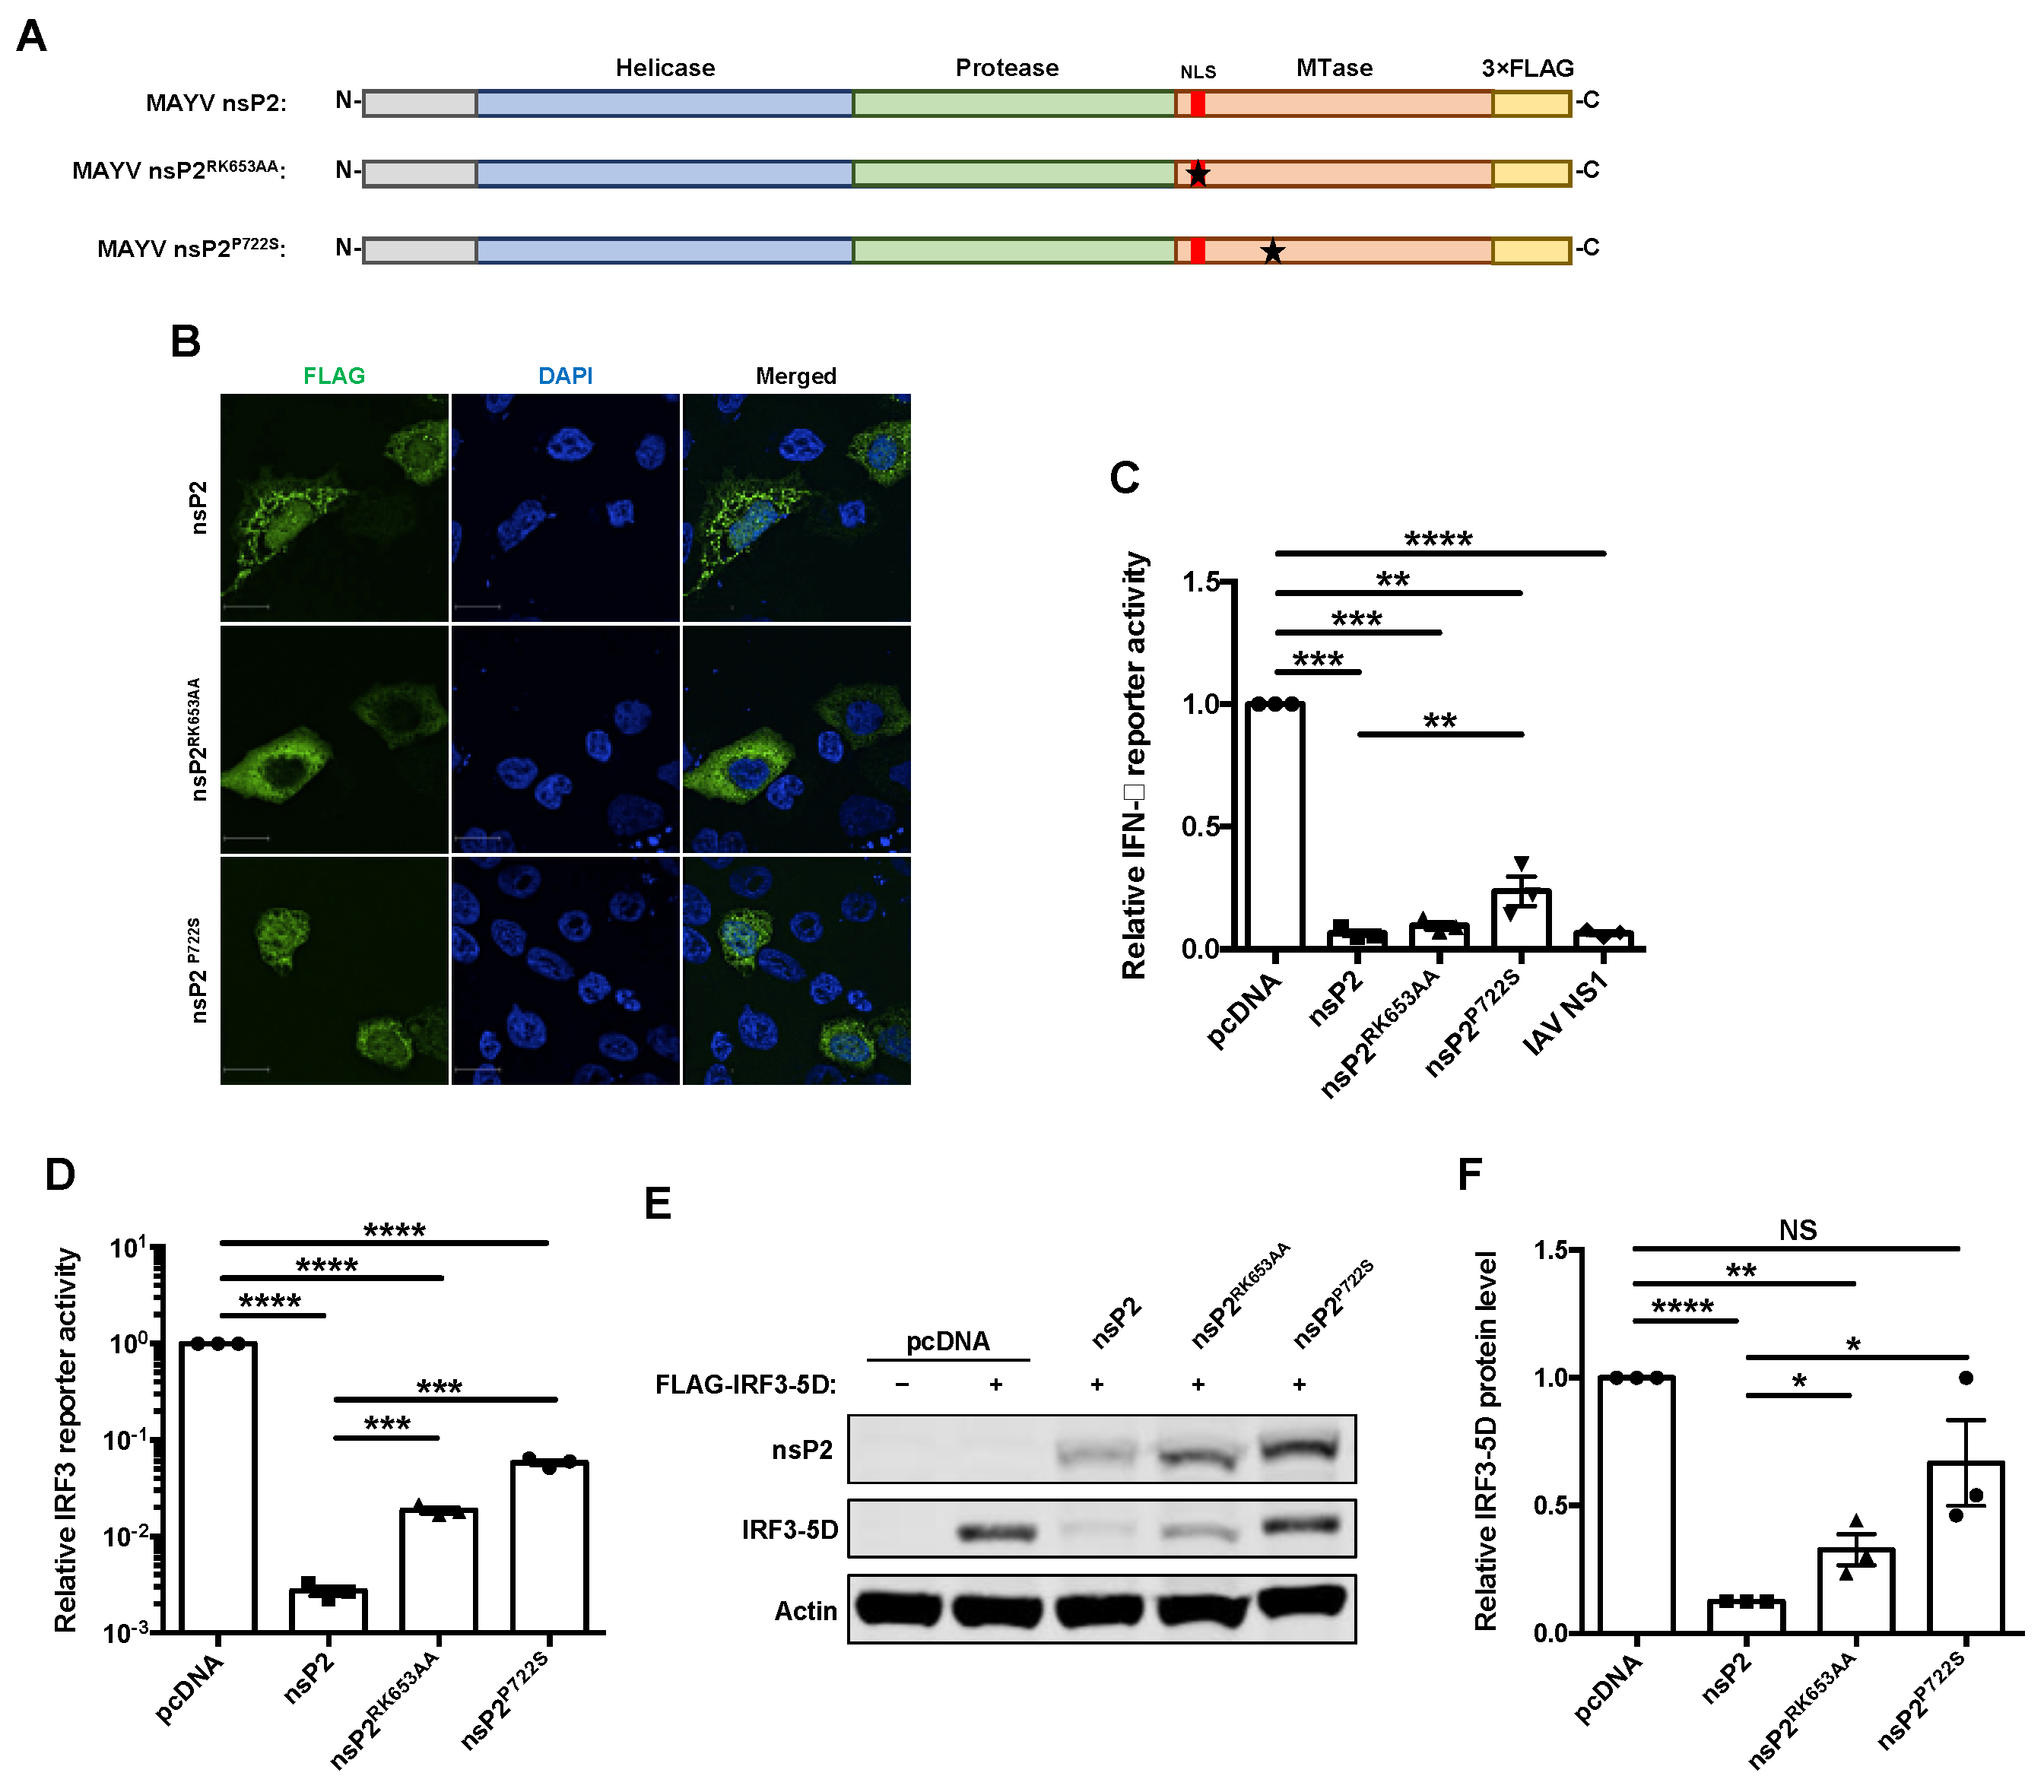
3.3. The Effect of nsP2 on Interferon Induction Was Found to Be Partially Mediated by Transcriptional Shutoff
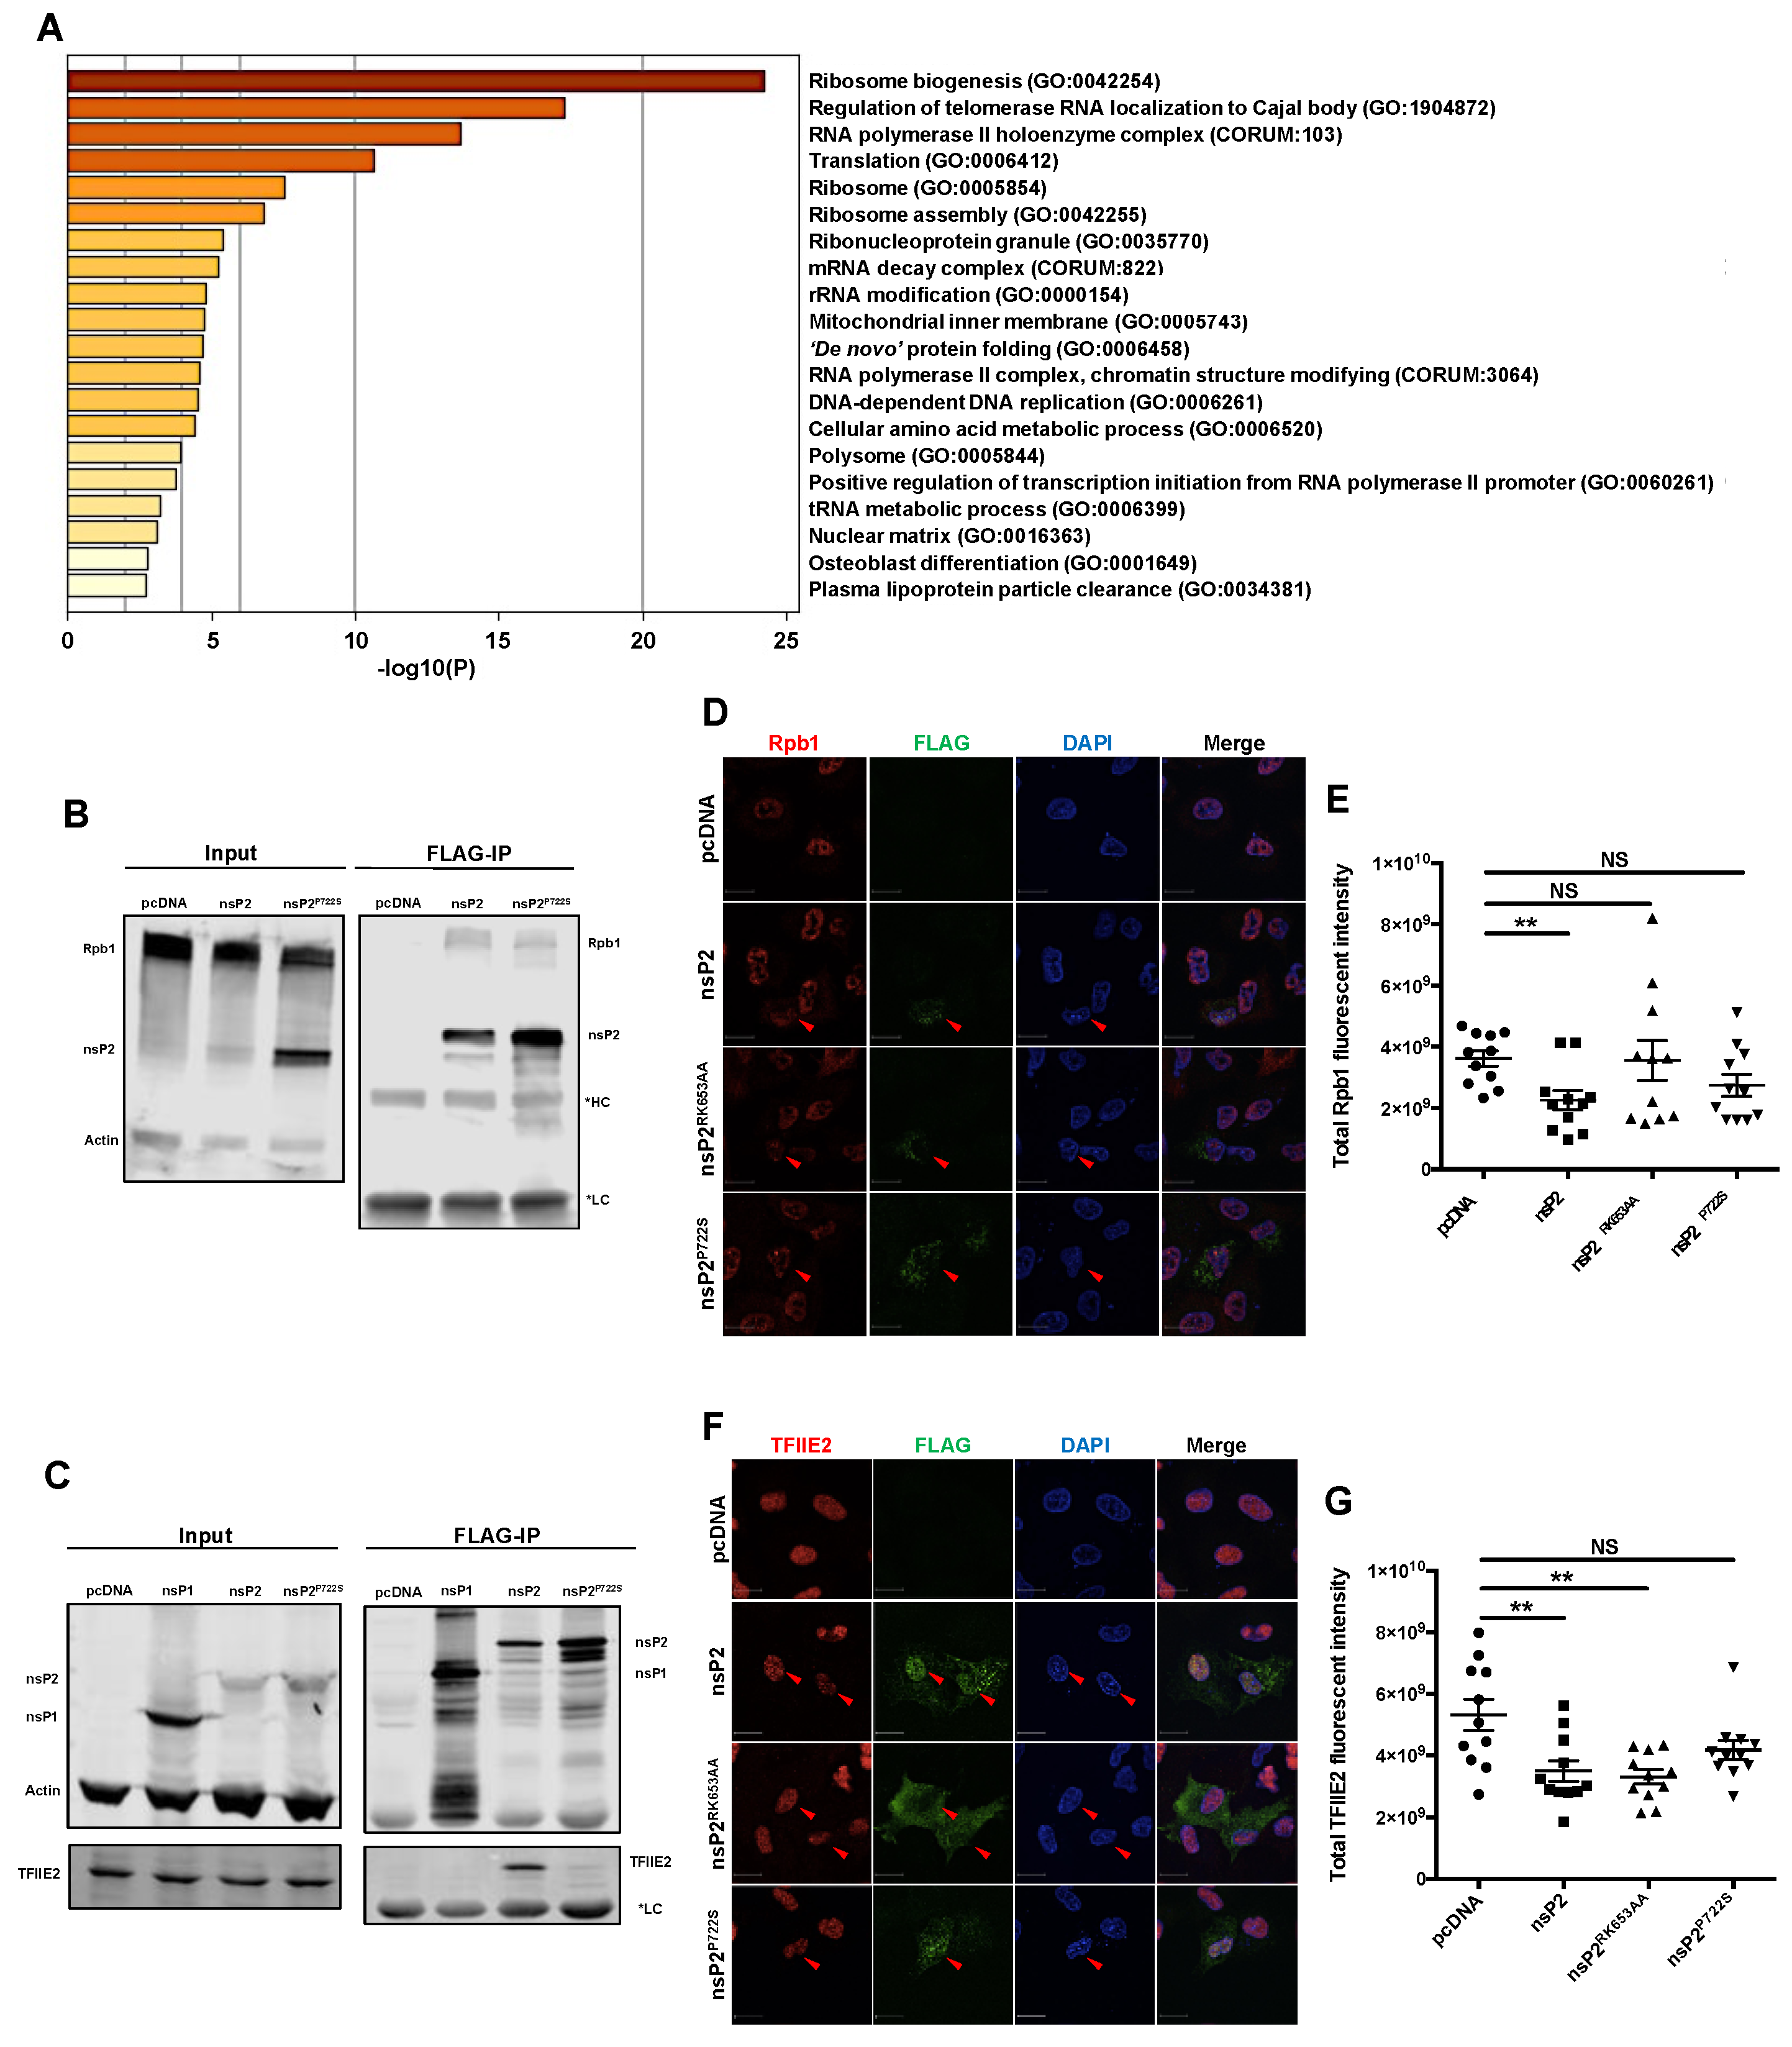
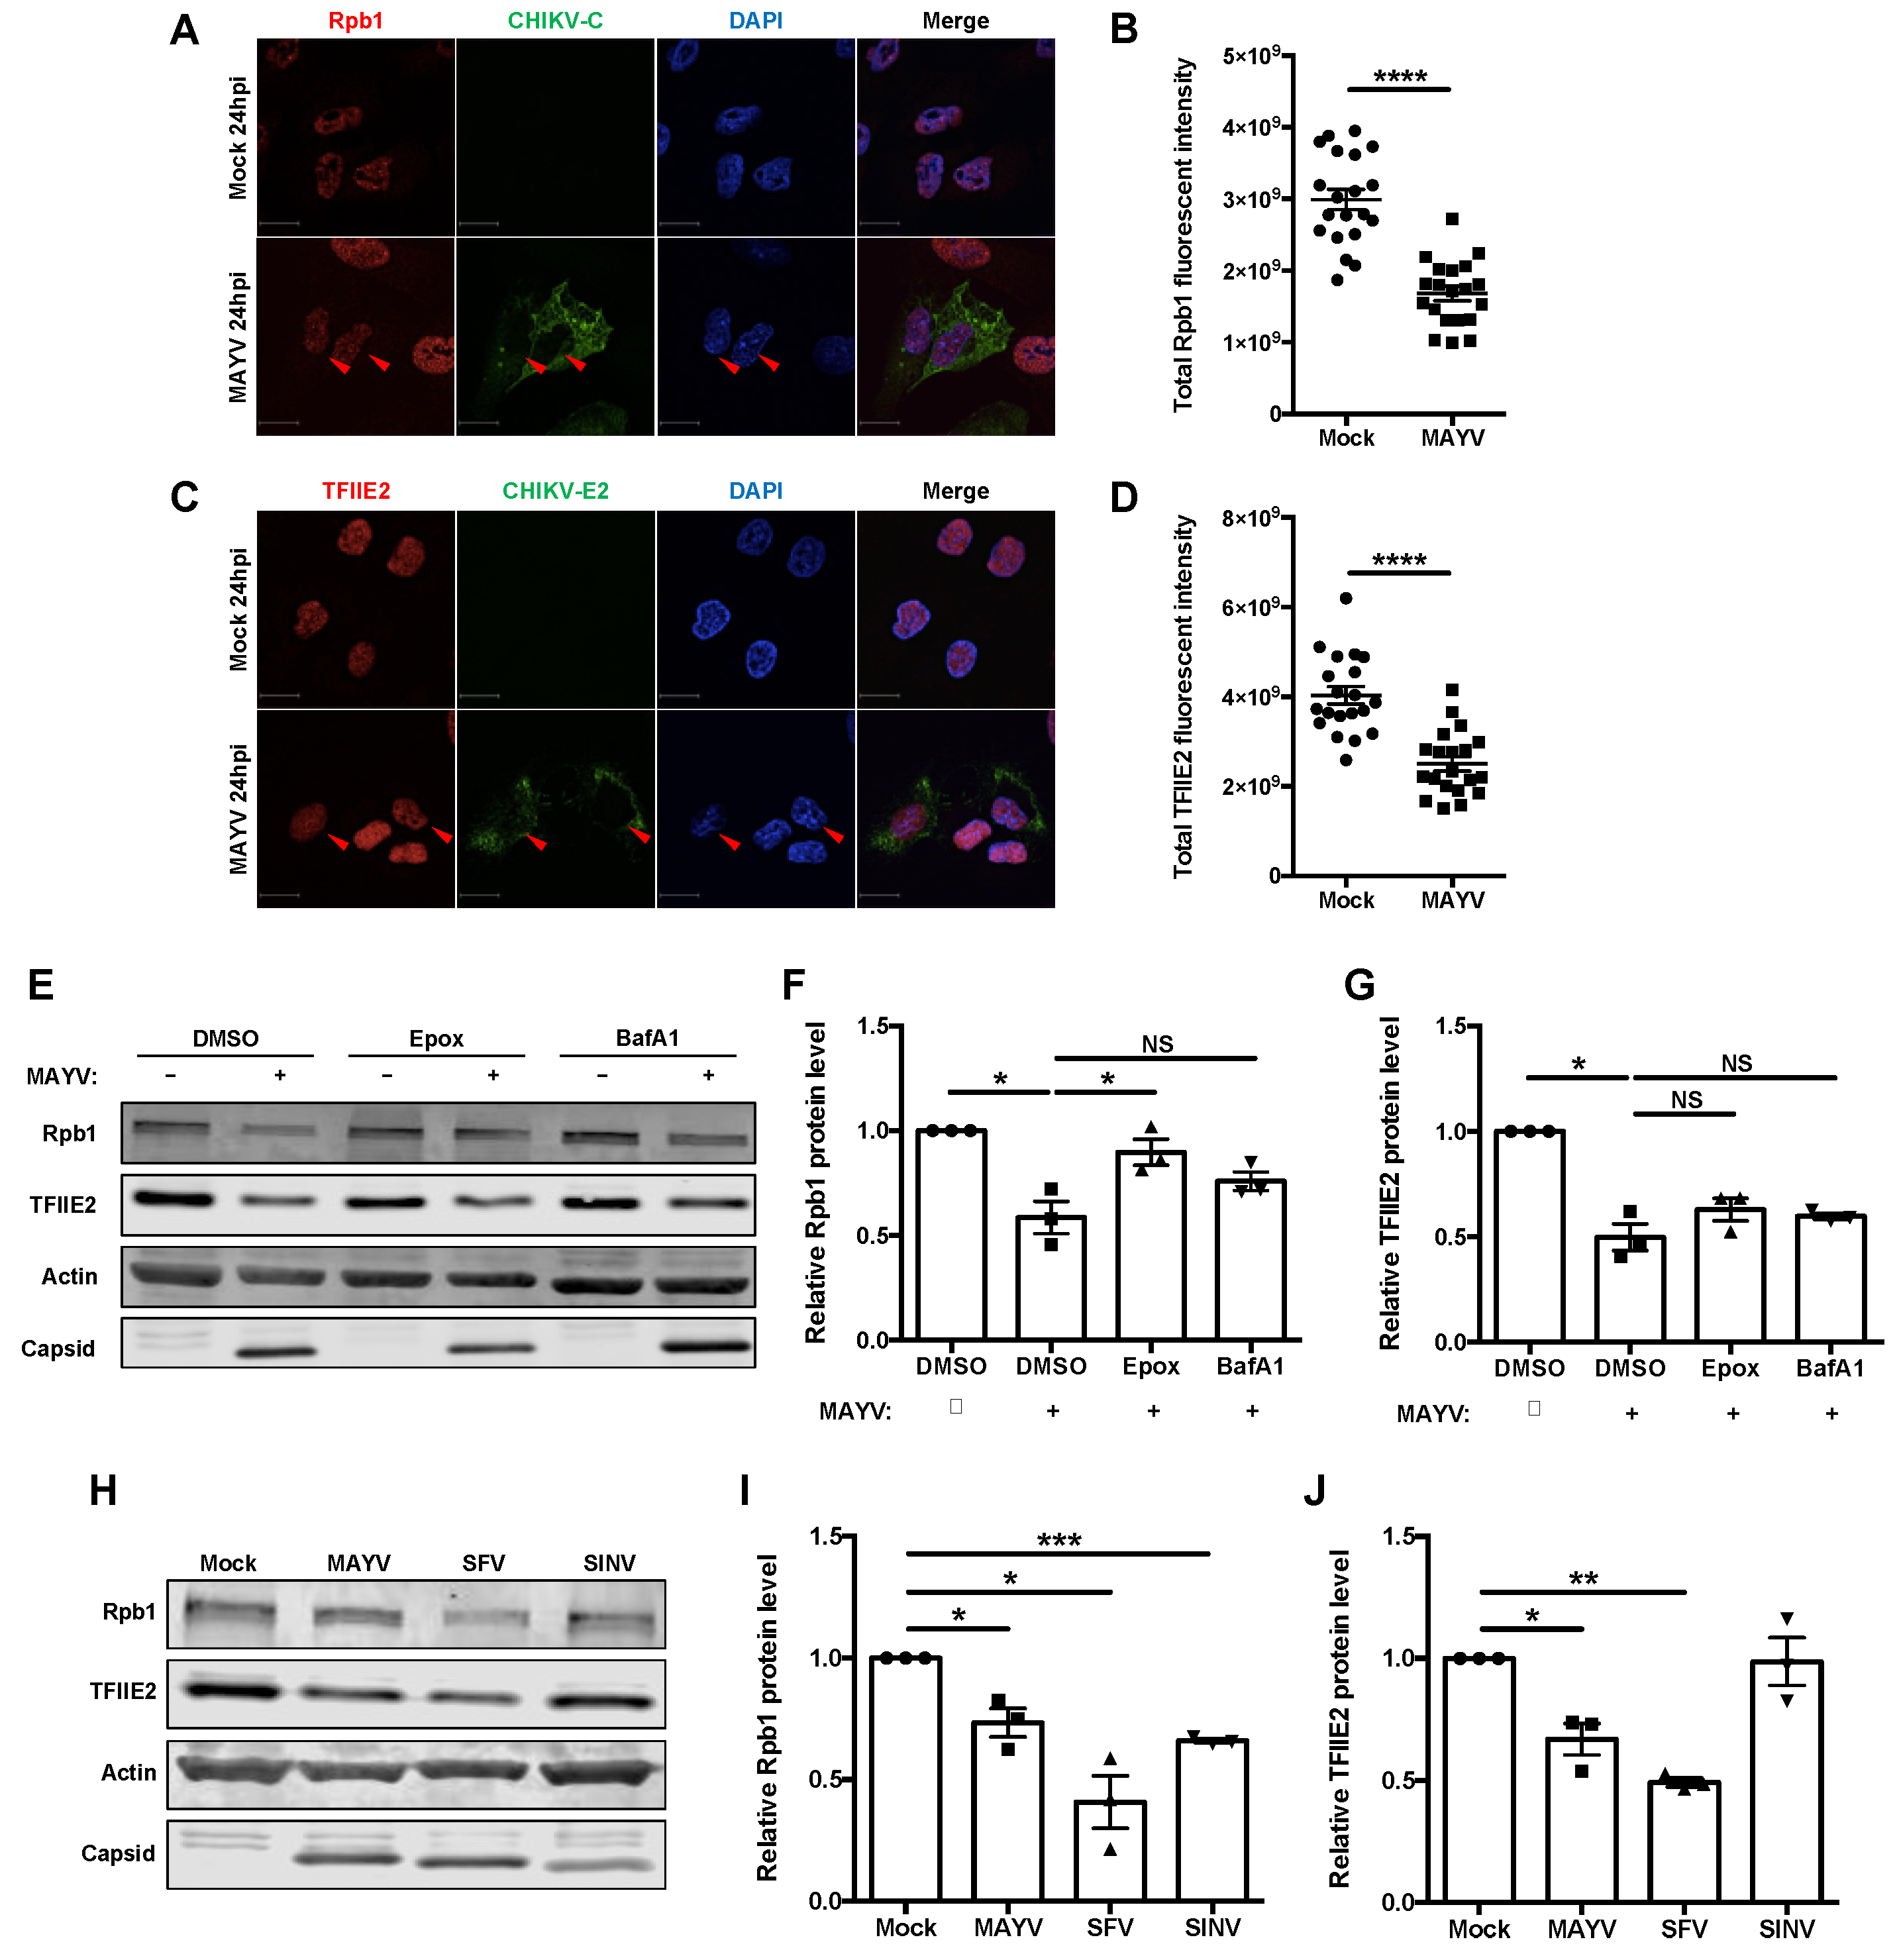
3.4. nsP2 Interacted with and Downregulated the Levels of Host Transcription Mediators Rpb1 and TFIIE2
3.5. Some but Not All Alphaviruses Induced Loss of TFIIE2
4. Discussion
Supplementary Materials
Author Contributions
Funding
Institutional Review Board Statement
Informed Consent Statement
Data Availability Statement
Acknowledgments
Conflicts of Interest
References
- Suhrbier, A.; Jaffar-Bandjee, M.C.; Gasque, P. Arthritogenic alphaviruses—An overview. Nat. Rev. Rheumatol. 2012, 8, 420–429. [Google Scholar] [CrossRef] [PubMed]
- Vittor, A.Y.; Armien, B.; Gonzalez, P.; Carrera, J.P.; Dominguez, C.; Valderrama, A.; Glass, G.E.; Beltran, D.; Cisneros, J.; Wang, E.; et al. Epidemiology of Emergent Madariaga Encephalitis in a Region with Endemic Venezuelan Equine Encephalitis: Initial Host Studies and Human Cross-Sectional Study in Darien, Panama. PLoS Negl. Trop. Dis. 2016, 10, e0004554. [Google Scholar] [CrossRef] [PubMed]
- Acosta-Ampudia, Y.; Monsalve, D.M.; Rodriguez, Y.; Pacheco, Y.; Anaya, J.M.; Ramirez-Santana, C. Mayaro: An emerging viral threat? Emerg. Microbes Infect. 2018, 7, 163. [Google Scholar] [CrossRef]
- Yue, C.; Teitz, S.; Miyabashi, T.; Boller, K.; Lewis-Ximenez, L.L.; Baylis, S.A.; Blumel, J. Inactivation and Removal of Chikungunya Virus and Mayaro Virus from Plasma-derived Medicinal Products. Viruses 2019, 11, 234. [Google Scholar] [CrossRef] [Green Version]
- Diagne, C.T.; Bengue, M.; Choumet, V.; Hamel, R.; Pompon, J.; Misse, D. Mayaro Virus Pathogenesis and Transmission Mechanisms. Pathogens 2020, 9, 738. [Google Scholar] [CrossRef]
- Tsetsarkin, K.A.; Vanlandingham, D.L.; McGee, C.E.; Higgs, S. A single mutation in chikungunya virus affects vector specificity and epidemic potential. PLoS Pathog. 2007, 3, e201. [Google Scholar] [CrossRef] [PubMed]
- Burt, F.J.; Chen, W.; Miner, J.J.; Lenschow, D.J.; Merits, A.; Schnettler, E.; Kohl, A.; Rudd, P.A.; Taylor, A.; Herrero, L.J.; et al. Chikungunya virus: An update on the biology and pathogenesis of this emerging pathogen. Lancet Infect. Dis. 2017, 17, e107–e117. [Google Scholar] [CrossRef]
- Wiggins, K.; Eastmond, B.; Alto, B.W. Transmission potential of Mayaro virus in Florida Aedes aegypti and Aedes albopictus mosquitoes. Med. Vet. Entomol. 2018, 32, 436–442. [Google Scholar] [CrossRef] [PubMed] [Green Version]
- Lednicky, J.; De Rochars, V.M.; Elbadry, M.; Loeb, J.; Telisma, T.; Chavannes, S.; Anilis, G.; Cella, E.; Ciccozzi, M.; Okech, B.; et al. Mayaro Virus in Child with Acute Febrile Illness, Haiti, 2015. Emerg. Infect. Dis. 2016, 22, 2000–2002. [Google Scholar] [CrossRef] [PubMed]
- Brustolin, M.; Pujhari, S.; Henderson, C.A.; Rasgon, J.L. Anopheles mosquitoes may drive invasion and transmission of Mayaro virus across geographically diverse regions. PLoS Negl. Trop. Dis. 2018, 12, e0006895. [Google Scholar] [CrossRef] [Green Version]
- Taylor, S.F.; Patel, P.R.; Herold, T.J. Recurrent arthralgias in a patient with previous Mayaro fever infection. South. Med. J. 2005, 98, 484–485. [Google Scholar] [CrossRef]
- Slegers, C.A.; Keuter, M.; Gunther, S.; Schmidt-Chanasit, J.; van der Ven, A.J.; de Mast, Q. Persisting arthralgia due to Mayaro virus infection in a traveler from Brazil: Is there a risk for attendants to the 2014 FIFA World Cup? J. Clin. Virol. 2014, 60, 317–319. [Google Scholar] [CrossRef] [PubMed]
- Llagonne-Barets, M.; Icard, V.; Leparc-Goffart, I.; Prat, C.; Perpoint, T.; Andre, P.; Ramiere, C. A case of Mayaro virus infection imported from French Guiana. J. Clin. Virol. 2016, 77, 66–68. [Google Scholar] [CrossRef] [PubMed]
- Langendries, L.; Abdelnabi, R.; Neyts, J.; Delang, L. Repurposing Drugs for Mayaro Virus: Identification of EIDD-1931, Favipiravir and Suramin as Mayaro Virus Inhibitors. Microorganisms 2021, 9, 734. [Google Scholar] [CrossRef] [PubMed]
- Powers, J.M.; Haese, N.N.; Denton, M.; Ando, T.; Kreklywich, C.; Bonin, K.; Streblow, C.E.; Kreklywich, N.; Smith, P.; Broeckel, R.; et al. Non-replicating adenovirus based Mayaro virus vaccine elicits protective immune responses and cross protects against other alphaviruses. PLoS Negl. Trop. Dis. 2021, 15, e0009308. [Google Scholar] [CrossRef]
- Hoque, H.; Islam, R.; Ghosh, S.; Rahaman, M.M.; Jewel, N.A.; Miah, M.A. Implementation of in silico methods to predict common epitopes for vaccine development against Chikungunya and Mayaro viruses. Heliyon 2021, 7, e06396. [Google Scholar] [CrossRef]
- Rafael, K.C.; Preciado-Llanes, L.; Azar, S.R.; Kim, Y.C.; Brandon, O.; Lopez-Camacho, C.; Reyes-Sandoval, A.; Rossi, S.L. Adenoviral-Vectored Mayaro and Chikungunya Virus Vaccine Candidates Afford Partial Cross-Protection From Lethal Challenge in A129 Mouse Model. Front. Immunol. 2020, 11, 591885. [Google Scholar]
- Campos, D.; Navarro, S.; Llamas-Gonzalez, Y.Y.; Sugasti, M.; Gonzalez-Santamaria, J. Broad Antiviral Activity of Ginkgolic Acid against Chikungunya, Mayaro, Una, and Zika Viruses. Viruses 2020, 12, 449. [Google Scholar] [CrossRef] [PubMed] [Green Version]
- Haller, O.; Kochs, G.; Weber, F. The interferon response circuit: Induction and suppression by pathogenic viruses. Virology 2006, 344, 119–130. [Google Scholar] [CrossRef] [Green Version]
- Nan, Y.; Nan, G.; Zhang, Y.J. Interferon induction by RNA viruses and antagonism by viral pathogens. Viruses 2014, 6, 4999–5027. [Google Scholar] [CrossRef]
- Fensterl, V.; Chattopadhyay, S.; Sen, G.C. No Love Lost Between Viruses and Interferons. Annu. Rev. Virol. 2015, 2, 549–572. [Google Scholar] [CrossRef] [PubMed]
- Dalrymple, N.A.; Cimica, V.; Mackow, E.R. Dengue Virus NS Proteins Inhibit RIG-I/MAVS Signaling by Blocking TBK1/IRF3 Phosphorylation: Dengue Virus Serotype 1 NS4A Is a Unique Interferon-Regulating Virulence Determinant. MBio 2015, 6, e00553-15. [Google Scholar] [CrossRef] [Green Version]
- Lane, W.C.; Dunn, M.D.; Gardner, C.L.; Lam, L.K.M.; Watson, A.M.; Hartman, A.L.; Ryman, K.D.; Klimstra, W.B. The Efficacy of the Interferon Alpha/Beta Response versus Arboviruses Is Temperature Dependent. mBio 2018, 9, e00535-18. [Google Scholar] [CrossRef] [Green Version]
- Fros, J.J.; Liu, W.J.; Prow, N.A.; Geertsema, C.; Ligtenberg, M.; Vanlandingham, D.L.; Schnettler, E.; Vlak, J.M.; Suhrbier, A.; Khromykh, A.A.; et al. Chikungunya virus nonstructural protein 2 inhibits type I/II interferon-stimulated JAK-STAT signaling. J. Virol. 2010, 84, 10877–10887. [Google Scholar] [CrossRef] [Green Version]
- Reynaud, J.M.; Kim, D.Y.; Atasheva, S.; Rasalouskaya, A.; White, J.P.; Diamond, M.S.; Weaver, S.C.; Frolova, E.I.; Frolov, I. IFIT1 Differentially Interferes with Translation and Replication of Alphavirus Genomes and Promotes Induction of Type I Interferon. PLoS Pathog. 2015, 11, e1004863. [Google Scholar] [CrossRef] [Green Version]
- Garcia-Sastre, A. Ten Strategies of Interferon Evasion by Viruses. Cell Host Microbe 2017, 22, 176–184. [Google Scholar] [CrossRef] [PubMed]
- Akhrymuk, I.; Frolov, I.; Frolova, E.I. Both RIG-I and MDA5 detect alphavirus replication in concentration-dependent mode. Virology 2016, 487, 230–241. [Google Scholar] [CrossRef] [Green Version]
- Burke, C.W.; Gardner, C.L.; Steffan, J.J.; Ryman, K.D.; Klimstra, W.B. Characteristics of alpha/beta interferon induction after infection of murine fibroblasts with wild-type and mutant alphaviruses. Virology 2009, 395, 121–132. [Google Scholar] [CrossRef] [Green Version]
- Bhalla, N.; Gardner, C.L.; Downs, S.N.; Dunn, M.; Sun, C.; Klimstra, W.B. Macromolecular Synthesis Shutoff Resistance by Myeloid Cells Is Critical to IRF7-Dependent Systemic Interferon Alpha/Beta Induction after Alphavirus Infection. J. Virol. 2019, 93. [Google Scholar] [CrossRef] [PubMed]
- Akhrymuk, I.; Frolov, I.; Frolova, E.I. Sindbis Virus Infection Causes Cell Death by nsP2-Induced Transcriptional Shutoff or by nsP3-Dependent Translational Shutoff. J. Virol. 2018, 92, e01388-18. [Google Scholar] [CrossRef] [PubMed] [Green Version]
- Fros, J.J.; Pijlman, G.P. Alphavirus Infection: Host Cell Shut-Off and Inhibition of Antiviral Responses. Viruses 2016, 8, 166. [Google Scholar] [CrossRef] [PubMed]
- Akhrymuk, I.; Lukash, T.; Frolov, I.; Frolova, E.I. Novel Mutations in nsP2 Abolish Chikungunya Virus-Induced Transcriptional Shutoff and Make the Virus Less Cytopathic without Affecting Its Replication Rates. J. Virol. 2019, 93, e02062-18. [Google Scholar] [CrossRef] [PubMed] [Green Version]
- Fros, J.J.; van der Maten, E.; Vlak, J.M.; Pijlman, G.P. The C-terminal domain of chikungunya virus nsP2 independently governs viral RNA replication, cytopathicity, and inhibition of interferon signaling. J. Virol. 2013, 87, 10394–10400. [Google Scholar] [CrossRef] [PubMed] [Green Version]
- Frolova, E.I.; Fayzulin, R.Z.; Cook, S.H.; Griffin, D.E.; Rice, C.M.; Frolov, I. Roles of nonstructural protein nsP2 and Alpha/Beta interferons in determining the outcome of Sindbis virus infection. J. Virol. 2002, 76, 11254–11264. [Google Scholar] [CrossRef] [PubMed] [Green Version]
- Gorchakov, R.; Frolova, E.; Frolov, I. Inhibition of transcription and translation in Sindbis virus-infected cells. J. Virol. 2005, 79, 9397–9409. [Google Scholar] [CrossRef] [PubMed] [Green Version]
- Breakwell, L.; Dosenovic, P.; Karlsson Hedestam, G.B.; D’Amato, M.; Liljestrom, P.; Fazakerley, J.; McInerney, G.M. Semliki Forest virus nonstructural protein 2 is involved in suppression of the type I interferon response. J. Virol. 2007, 81, 8677–8684. [Google Scholar] [CrossRef] [Green Version]
- Goertz, G.P.; McNally, K.L.; Robertson, S.J.; Best, S.M.; Pijlman, G.P.; Fros, J.J. The Methyltransferase-Like Domain of Chikungunya Virus nsP2 Inhibits the Interferon Response by Promoting the Nuclear Export of STAT1. J. Virol. 2018, 92, e01008-18. [Google Scholar] [CrossRef] [Green Version]
- Assi, M.; Thon-Hon, V.G.; Jaffar-Bandjee, M.C.; Martinez, A.; Gasque, P. Regulation of type I-interferon responses in the human epidermal melanocyte cell line SKMEL infected by the Ross River alphavirus. Cytokine 2015, 76, 572–576. [Google Scholar] [CrossRef]
- Vannini, A.; Cramer, P. Conservation between the RNA polymerase I, II, and III transcription initiation machineries. Mol. Cell 2012, 45, 439–446. [Google Scholar] [CrossRef] [Green Version]
- Kumar, A.; Hou, S.; Airo, A.M.; Limonta, D.; Mancinelli, V.; Branton, W.; Power, C.; Hobman, T.C. Zika virus inhibits type-I interferon production and downstream signaling. EMBO Rep. 2016, 17, 1766–1775. [Google Scholar] [CrossRef] [Green Version]
- UniProt, C. UniProt: The universal protein knowledgebase in 2021. Nucleic Acids Res. 2021, 49, D480–D489. [Google Scholar]
- Zhou, Y.; Zhou, B.; Pache, L.; Chang, M.; Khodabakhshi, A.H.; Tanaseichuk, O.; Benner, C.; Chanda, S.K. Metascape provides a biologist-oriented resource for the analysis of systems-level datasets. Nat. Commun. 2019, 10, 1523. [Google Scholar] [CrossRef] [PubMed]
- Elco, C.P.; Guenther, J.M.; Williams, B.R.; Sen, G.C. Analysis of genes induced by Sendai virus infection of mutant cell lines reveals essential roles of interferon regulatory factor 3, NF-kappaB, and interferon but not toll-like receptor 3. J. Virol. 2005, 79, 3920–3929. [Google Scholar] [CrossRef] [Green Version]
- Okamoto, S.; Watanabe, Y.; Takakura, Y.; Hashida, M. Cationic liposome-mediated efficient induction of type I interferons by a low dose of poly I:poly C in mouse cell lines. J. Biochem. 1998, 124, 697–701. [Google Scholar] [CrossRef]
- Melancon, P.; Garoff, H. Processing of the Semliki Forest virus structural polyprotein: Role of the capsid protease. J. Virol. 1987, 61, 1301–1309. [Google Scholar] [CrossRef] [Green Version]
- Gack, M.U.; Albrecht, R.A.; Urano, T.; Inn, K.S.; Huang, I.C.; Carnero, E.; Farzan, M.; Inoue, S.; Jung, J.U.; Garcia-Sastre, A. Influenza A virus NS1 targets the ubiquitin ligase TRIM25 to evade recognition by the host viral RNA sensor RIG-I. Cell Host Microbe 2009, 5, 439–449. [Google Scholar] [CrossRef] [Green Version]
- de Gomez Cedron, M.; Ehsani, N.; Mikkola, M.L.; Garcia, J.A.; Kaariainen, L. RNA helicase activity of Semliki Forest virus replicase protein NSP2. FEBS Lett. 1999, 448, 19–22. [Google Scholar] [CrossRef] [Green Version]
- Vasiljeva, L.; Merits, A.; Auvinen, P.; Kaariainen, L. Identification of a novel function of the alphavirus capping apparatus. RNA 5’-triphosphatase activity of Nsp2. J. Biol Chem. 2000, 275, 17281–17287. [Google Scholar] [CrossRef] [Green Version]
- Strauss, E.G.; De Groot, R.J.; Levinson, R.; Strauss, J.H. Identification of the active site residues in the nsP2 proteinase of Sindbis virus. Virology 1992, 191, 932–940. [Google Scholar] [CrossRef]
- Russo, A.T.; White, M.A.; Watowich, S.J. The crystal structure of the Venezuelan equine encephalitis alphavirus nsP2 protease. Structure 2006, 14, 1449–1458. [Google Scholar] [CrossRef] [PubMed] [Green Version]
- Akhrymuk, I.; Kulemzin, S.V.; Frolova, E.I. Evasion of the innate immune response: The Old World alphavirus nsP2 protein induces rapid degradation of Rpb1, a catalytic subunit of RNA polymerase II. J. Virol. 2012, 86, 7180–7191. [Google Scholar] [CrossRef] [Green Version]
- Figueiredo, C.M.; Neris, R.; Gavino-Leopoldino, D.; da Silva, M.O.L.; Almeida, J.S.; Dos-Santos, J.S.; Figueiredo, C.P.; Bellio, M.; Bozza, M.T.; Assuncao-Miranda, I. Mayaro Virus Replication Restriction and Induction of Muscular Inflammation in Mice Are Dependent on Age, Type-I Interferon Response, and Adaptive Immunity. Front. Microbiol. 2019, 10, 2246. [Google Scholar] [CrossRef]
- Gardner, J.; Anraku, I.; Le, T.T.; Larcher, T.; Major, L.; Roques, P.; Schroder, W.A.; Higgs, S.; Suhrbier, A. Chikungunya virus arthritis in adult wild-type mice. J. Virol. 2010, 84, 8021–8032. [Google Scholar] [CrossRef] [Green Version]
- Schilte, C.; Couderc, T.; Chretien, F.; Sourisseau, M.; Gangneux, N.; Guivel-Benhassine, F.; Kraxner, A.; Tschopp, J.; Higgs, S.; Michault, A.; et al. Type I IFN controls chikungunya virus via its action on nonhematopoietic cells. J. Exp. Med. 2010, 207, 429–442. [Google Scholar] [CrossRef] [PubMed]
- Couderc, T.; Chretien, F.; Schilte, C.; Disson, O.; Brigitte, M.; Guivel-Benhassine, F.; Touret, Y.; Barau, G.; Cayet, N.; Schuffenecker, I.; et al. A mouse model for Chikungunya: Young age and inefficient type-I interferon signaling are risk factors for severe disease. PLoS Pathog. 2008, 4, e29. [Google Scholar] [CrossRef] [PubMed] [Green Version]
- Bae, S.; Lee, J.Y.; Myoung, J. Chikungunya Virus-Encoded nsP2, E2 and E1 Strongly Antagonize the Interferon-beta Signaling Pathway. J. Microbiol. Biotechnol. 2019, 29, 1852–1859. [Google Scholar] [CrossRef]
- Rogers, K.J.; Jones-Burrage, S.; Maury, W.; Mukhopadhyay, S. TF protein of Sindbis virus antagonizes host type I interferon responses in a palmitoylation-dependent manner. Virology 2020, 542, 63–70. [Google Scholar] [CrossRef] [PubMed]
- Bhalla, N.; Sun, C.; Metthew Lam, L.K.; Gardner, C.L.; Ryman, K.D.; Klimstra, W.B. Host translation shutoff mediated by non-structural protein 2 is a critical factor in the antiviral state resistance of Venezuelan equine encephalitis virus. Virology 2016, 496, 147–165. [Google Scholar] [CrossRef] [PubMed]
- Sanz, M.A.; Garcia-Moreno, M.; Carrasco, L. Inhibition of host protein synthesis by Sindbis virus: Correlation with viral RNA replication and release of nuclear proteins to the cytoplasm. Cell Microbiol. 2015, 17, 520–541. [Google Scholar] [CrossRef] [Green Version]
- Carrasco, L.; Sanz, M.A.; Gonzalez-Almela, E. The Regulation of Translation in Alphavirus-Infected Cells. Viruses 2018, 10, 70. [Google Scholar] [CrossRef] [PubMed] [Green Version]
- Saisawang, C.; Sillapee, P.; Sinsirimongkol, K.; Ubol, S.; Smith, D.R.; Ketterman, A.J. Full length and protease domain activity of chikungunya virus nsP2 differ from other alphavirus nsP2 proteases in recognition of small peptide substrates. Biosci. Rep. 2015, 35, e00196. [Google Scholar] [CrossRef] [PubMed]
- Hotez, P.J.; Murray, K.O. Dengue, West Nile virus, chikungunya, Zika-and now Mayaro? PLoS Negl. Trop. Dis. 2017, 11, e0005462. [Google Scholar] [CrossRef] [PubMed]


Publisher’s Note: MDPI stays neutral with regard to jurisdictional claims in published maps and institutional affiliations. |
© 2021 by the authors. Licensee MDPI, Basel, Switzerland. This article is an open access article distributed under the terms and conditions of the Creative Commons Attribution (CC BY) license (https://creativecommons.org/licenses/by/4.0/).
Share and Cite
Ishida, R.; Cole, J.; Lopez-Orozco, J.; Fayad, N.; Felix-Lopez, A.; Elaish, M.; Luo, S.Y.; Julien, O.; Kumar, A.; Hobman, T.C. Mayaro Virus Non-Structural Protein 2 Circumvents the Induction of Interferon in Part by Depleting Host Transcription Initiation Factor IIE Subunit 2. Cells 2021, 10, 3510. https://doi.org/10.3390/cells10123510
Ishida R, Cole J, Lopez-Orozco J, Fayad N, Felix-Lopez A, Elaish M, Luo SY, Julien O, Kumar A, Hobman TC. Mayaro Virus Non-Structural Protein 2 Circumvents the Induction of Interferon in Part by Depleting Host Transcription Initiation Factor IIE Subunit 2. Cells. 2021; 10(12):3510. https://doi.org/10.3390/cells10123510
Chicago/Turabian StyleIshida, Ray, Jamie Cole, Joaquin Lopez-Orozco, Nawell Fayad, Alberto Felix-Lopez, Mohamed Elaish, Shu Yue Luo, Olivier Julien, Anil Kumar, and Tom C. Hobman. 2021. "Mayaro Virus Non-Structural Protein 2 Circumvents the Induction of Interferon in Part by Depleting Host Transcription Initiation Factor IIE Subunit 2" Cells 10, no. 12: 3510. https://doi.org/10.3390/cells10123510
APA StyleIshida, R., Cole, J., Lopez-Orozco, J., Fayad, N., Felix-Lopez, A., Elaish, M., Luo, S. Y., Julien, O., Kumar, A., & Hobman, T. C. (2021). Mayaro Virus Non-Structural Protein 2 Circumvents the Induction of Interferon in Part by Depleting Host Transcription Initiation Factor IIE Subunit 2. Cells, 10(12), 3510. https://doi.org/10.3390/cells10123510