Article

Roles of a Cryptochrome in Carbon Fixation and Sucrose Metabolism in the Liverwort Marchantia polymorpha

Jilin Province Engineering Laboratory of Plant Genetic Improvement, College of Plant Science, Jilin University, Changchun 130062, China
*
Authors to whom correspondence should be addressed.
These authors contribute equally to this paper.
Cells 2021, 10(12), 3387; https://doi.org/10.3390/cells10123387
Submission received: 26 October 2021 / Revised: 25 November 2021 / Accepted: 30 November 2021 / Published: 1 December 2021
(This article belongs to the Section Plant, Algae and Fungi Cell Biology)

Abstract

:
In vascular plants, cryptochromes acting as blue-light photoreceptors have various functions to adapt plants to the fluctuating light conditions on land, while the roles of cryptochromes in bryophytes have been rarely reported. In this study, we investigated functions of a single-copy ortholog of cryptochrome (MpCRY) in the liverwort Marchantia polymorpha. Knock-out of MpCRY showed that a large number of the mutant plants exhibited asymmetric growth of thalli under blue light. Transcriptome analyses indicated that MpCRY is mainly involved in photosynthesis and sugar metabolism. Further physiological analysis showed that Mpcry mutant exhibited a reduction in CO2 uptake and sucrose metabolism. In addition, exogenous application of sucrose or glucose partially restored the symmetrical growth of the Mpcry mutant thalli. Together, these results suggest that MpCRY is involved in the symmetrical growth of thallus and the regulation of carbon fixation and sucrose metabolism in M. polymorpha.

1. Introduction

The perception and response of organisms to blue light have been a focus of scientific interest [1], especially on cryptochrome (cry), one of the blue light receptors found in the evolutionary lineages of archaea, bacteria, plants and animals [1,2,3]. Cryptochromes from aquatic to terrestrial organisms retain fairly conservative functions and also generate relatively novel functions [4]. Cryptochromes from plants and animals are considered to have originated from two independent evolutionary events [2,4]. Cryptochromes in animals regulate the circadian clock and magnetoreception [5,6,7]. In vascular plants, cryptochromes have various functions to adapt to the fluctuating light conditions on land, including the regulation of the circadian clock, the hypocotyl elongation under blue light, photoperiodic flowering, cotyledon expansion, shade avoidance, and stomata opening [8,9,10,11,12,13].
Previous studies on bryophyte cryptochromes are limited to Physcomitrium patens. There are two cryptochromes in P. patens, PpCRY1a and PpCRY1b, which play the roles in induction of side branching of protonema and differentiation and growth of gametophore [14]. In addition, PpCRYs influence the daily expression profiles of the orthologs of sigma factors (PpSigs) and RNA polymerase subunit alpha (PpRpoA). PpCRYs also regulate the transcription of Squamosa promoter binding protein orthologs (PpSBP1 and PpSBP4) to induce side branch formation under blue light [15,16]. These studies indicate that cryptochromes are an important factor in the transduction of blue light signal in P. patens. However, the specific mechanism of cryptochromes affecting the growth and development of bryophytes still remains to be analyzed.
The liverwort Marchantia polymorpha has recently been established as a model plant species. It has a life cycle whose dominant form is haploid, and its genome shows a low genetic redundancy [17,18]. In addition, its genetic transformation and gene targeting systems have been established [19]. Previous studies have shown the functions of the single-copy phytochrome ortholog MpPHY, the ultraviolet-B photoreceptor MpUVR8, and the blue light receptors MpPHOT and MpFKF in M. polymorpha [20,21,22,23,24]. However, although present in the genome [18], the function of MpCRY has never been reported.
To study the function of MpCRY, we obtained Mpcry knock-out mutants using CRISPR/Cas9-mediated genome editing technology [25]. Interestingly, we found that MpCRY is required for symmetrical growth of thallus under continuous blue light. We also found that MpCRY is involved in the regulation of photosynthesis and sucrose metabolism. Together, these results provide new insights into the function of MpCRY during growth and development of M. polymorpha.

2. Materials and Methods

2.1. Plant Materials and Growth Conditions

Male and female M. polymorpha accessions, Takaragaike-1 (Tak-1) and Takaragaike 2 (Tak-2) [26], were cultured aseptically on half-strength Gamborg’s B5 medium [27] under continuous white light of 50 to 60 μmol photon m−2 s−1 at 22 °C. F1 spores were obtained by crossing Tak-2 and Tak-1.

2.2. Phylogenetic Tree Analysis

For the alignment of amino acid sequences, we used the MUSCLE program in Geneious software (Biomatters, Auckland, New Zealand, version 8.1.3) [28]. After sequence alignment, sequence gap and sequences at both ends were manually removed, and a conserved region was retained to calculate evolutionary distance. A phylogenetic tree was built by the online program PhyML 3.0 (www.atgc-montpellier.fr/phyml/ (accessed on 21 March 2020)) [29] with JTT model and four substitution rate categories. Its tree searching was started from the aBioNJ tree, and the tree was optimized with Subtree Pruning and Regrafting (SPR) topological moves. For statistical analysis of the constructed phylogenetic tree, bootstrapping was carried out by resampling trees 1000 times. The beautification of the resulting tree was done in Geneious software. Amino acid sequences of Amborella trichopoda, Selaginella moellendorffii, Physcomitrella patens, Marchantia polymorpha, Chlamydomonas reinhardtii, and Ostreococcus lucimarinus are from https://phytozome-next.jgi.doe.gov (accessed on 8 December 2015). Amino acid sequences of Arabidopsis thaliana are from https://www.arabidopsis.org (accessed on 8 December 2015). Amino acid sequences of Klebsormidium flaccidum are from http://www.plantmorphogenesis.bio.titech.ac.jp/~algae_genome_project/klebsormidium/ (accessed on 8 December 2015).

2.3. Generation of Transgenic Lines

To generate the Mpcry knockout mutant, we used the CRISPR/Cas9 genome editing system [30]. A guide RNA (gRNA) target sequence was designed in the 4th exon of the MpCRY gene. The annealed oligonucleotides (MpCRY-gRNA-F/MpCRY-gRNA-R) of the gRNA sequence was cloned into the BsaI site of pMpGE_En03 [31]. Using the Gateway LR reaction (Thermo Fisher Scientific, Torrance, CA, USA), the MpCRY gRNA expression cassette was transferred to the pMpGE011 vector [31] to generate pMpGE011_MpCRY. As described previously [26], Agrobacterium-mediated transformation of F1 spores was performed. In order to identify gene knockout mutants, crude genomic DNA was extracted from the transformed thalli, and the region targeted by the gRNA sequence was amplified using primers MpCRY-check-f/MpCRY-check-r. The PCR products were directly sequenced using BigDye Terminator v3.1 (Thermo Fisher Scientific).
In order to obtain the MpCRY strain overexpressing the Citrine marker, the CDS sequence of MpCRY without the stop codon from wild-type genomic DNA, which was subcloned into pENTR/D-TOPO vector (Thermo Fisher Scientific). The cloned sequence was then transferred to the pMpGWB306 vector [32]. Regenerated thalli were used for Agrobacterium-mediated genetic transformation [33]. To obtain the overexpression lines of MpCRY-Tdtomato, the coding sequence (CDS) of MpCRY without the stop codon was amplified and cloned into pENTR/D-TOPO vector (Thermo Fisher Scientific). Then the cloned sequence was transferred to the destination vector pMpGWB130 [32] to generate pro35S::MpCRY-Tdtomato binary vector, which was transformed into WT (Tak-1) thalli. The sequences of all primers used in transgenic plant generation are listed in Table S2.

2.4. RNA Extraction and Transcriptome Sequencing

Three biological repeats of total RNA were extracted from three different groups of 2-week-old thalli grown from gemmae using RNAprep pure Plant Kit (TIANGEN BIOTECH, Beijing, China). RNA purity and concentration were tested using NanoDrop 2000 spectrophotometer (Thermo Fisher Scientific) and Agilent 2100 RNA 6000 Nano kit (Agilent Technologies). RNA sequencing analysis (RNA-seq) was performed by Beijing Berry Genomics Co., Ltd. (Berry Genomics Beijing, Beijing, China). RNA molecules were isolated using the poly-A selection protocol to enrich for polyadenylated transcripts. Illumina NovaSeq 6000 was applied paired-end sequencing for RNA-Seq.

2.5. Quantification of Gene Expression Levels in Transcriptome Sequencing

Sequencing reads were filtered by ht2-filter to remove low-quality reads [34], and then mapped to the genomic sequence of Marchantia polymorpha ver 3.1 [18] using TopHat2 with default parameters, i.e., the anchor length of reads was set up as 8 and the maximum number of mismatched bases that can appear in the anchor region was set up as 0 [35]. The relative abundance of mRNA was normalized and presented as fragments per kilobase of transcript per million mapped reads (FPKM) [36].

2.6. Person Correlation Coefficients Analysis

Person correlation coefficients were calculated by the “chart.Correlation” function of the PerformanceAnalytics package in R.

2.7. Principal Component Analysis

Contribution ratios were calculated by the “PCA” function of the FactoMineR package in R. The data frame used in this calculation was composed by the FPKMs of different samples.

2.8. Differential Expression Analysis

Differential expression analysis was performed using edgeR package with default parameters [37]. Genes showing larger than 1.5-fold change of expression compared to control with p-value < 0.05 were considered as differentially expressed genes (DEGs). Venn diagram was created using the ‘VennDiagram’ R package (version 1.6.20).

2.9. GO Enrichment Analysis of Different Response Genes (DRGs)

Gene Ontology (GO) enrichment analysis of DRGs was implemented by Blast2GO (Valencia, Spain, version 2.5.0) [38]. GO terms were enriched by Blast2GO and we chose GO terms of biological functions (BP) with a p-value less than 0.05 calculated by the hypergeometric test.

2.10. Processing Subcellar Images

Leica TCS SP8X confocal microscope was used to observe the gemmalings. A 514 nm laser was used for excitation of the fluorescent protein Citrine, and the emitted fluorescence with wavelength of 520–550 nm was captured. To gain complete picture of plant sample, 111 pictures were captured per 0.686 μm along the z axis. The series of images were analyzed and merged using LAS X (Leica) software (Leica Microsystems, Wetzlar, Germany). To magnify the part of plant cells, 48.94 μm × 48.94 μm ROI (region of interest) was selected, and only one image along the z axis under the same laser condition was captured. W 552 nm laser was used for excitation of the fluorescent protein Tdtomato. 10 μg/mL Hoechst 33342 (Sigma, 14533) was used to stain the nucleus [39]. D 405 nm laser was used for excitation of the Hoechst 33342. Calcein acetoxymethyl (AM) was used to stain the whole cell including the nucleus and cytoplasm [40]. W 488 laser was used for excitation of the Calcein AM. Images were analyzed and merged using LAS X (Leica) software.

2.11. Quantitative Real-Time PCR (RT-PCR) Analysis

cDNA was synthesized from 1 µg total RNA using SuperScript first-strand cDNA synthesis system (Thermo Fisher Scientific). SYBR Premix Ex TaqTM II (Tli RNaseH Plus) (TaKaRa-Bio, Kyoto, Japan) was used for quantitative reverse transcription PCR (qRT-PCR) reaction, using the Mx3000PTM Real-Time PCR System (Stratagene). MpACT expression was measured for the internal control [41]. The sequences of all primers used in qPCR are listed in Table S2.

2.12. Measurement of Chlorophyll Content

Thalli grown under blue light were harvested in liquid nitrogen (LN) and ground into fine powder. The sample powder was weighed, mixed with 1 mL of cool 80% v/v acetone, and kept in the dark at 4 °C overnight. After centrifugation, supernatant was used to measure OD at 645 nm and 663 nm with a spectrometer. Chlorophyll content was calculated using the following equation: Chlorophyll (mg/g) = (8.02 × OD663 + 20.20 × OD645) × V/FW, where V is the volume of the extract (in milliliters) and FW is the fresh weight of the sample powder (in milligrams).

2.13. Photosynthetic Parameter Analysis

For the measurement of Fv/Fm, 14-day-old thalli were dark adapted for 30 min and then were detected by IMAGING PAM (WALZ). A portable photosynthesis system (LI-6400, Li-Cor) was used to measure total conductance to CO2 in the 14-day-old thalli of WT (Tak-1) and Mpcry mutant plants. All measurements were performed at 22 °C and a relative humidity of 60%. The CO2 level and the photosynthetic photon flux density in the chamber was set to 400 μmol mol−1 and 1000 μmol m−2 s−1, respectively.

2.14. Quantification of Starch, Sucrose, Glucose

Plants were harvested into LN and finely ground, and 0.1 g of power was used for each of the following analyses: The starch levels were determined by Amylum Content Assay Kit (Sangon Biotech, Shanghai, China, D799325-0050). The sucrose levels were determined by Plant Sucrose Content Assay Kit (Sangon Biotech, D799789-0050). The glucose levels were determined by Glucose Content Assay Kit (Sangon Biotech, Shanghai, China D799407-0050).

2.15. Quantification and Statistical Analysis

All data were statistically analysed by two-tailed Student’s t-test.

3. Results

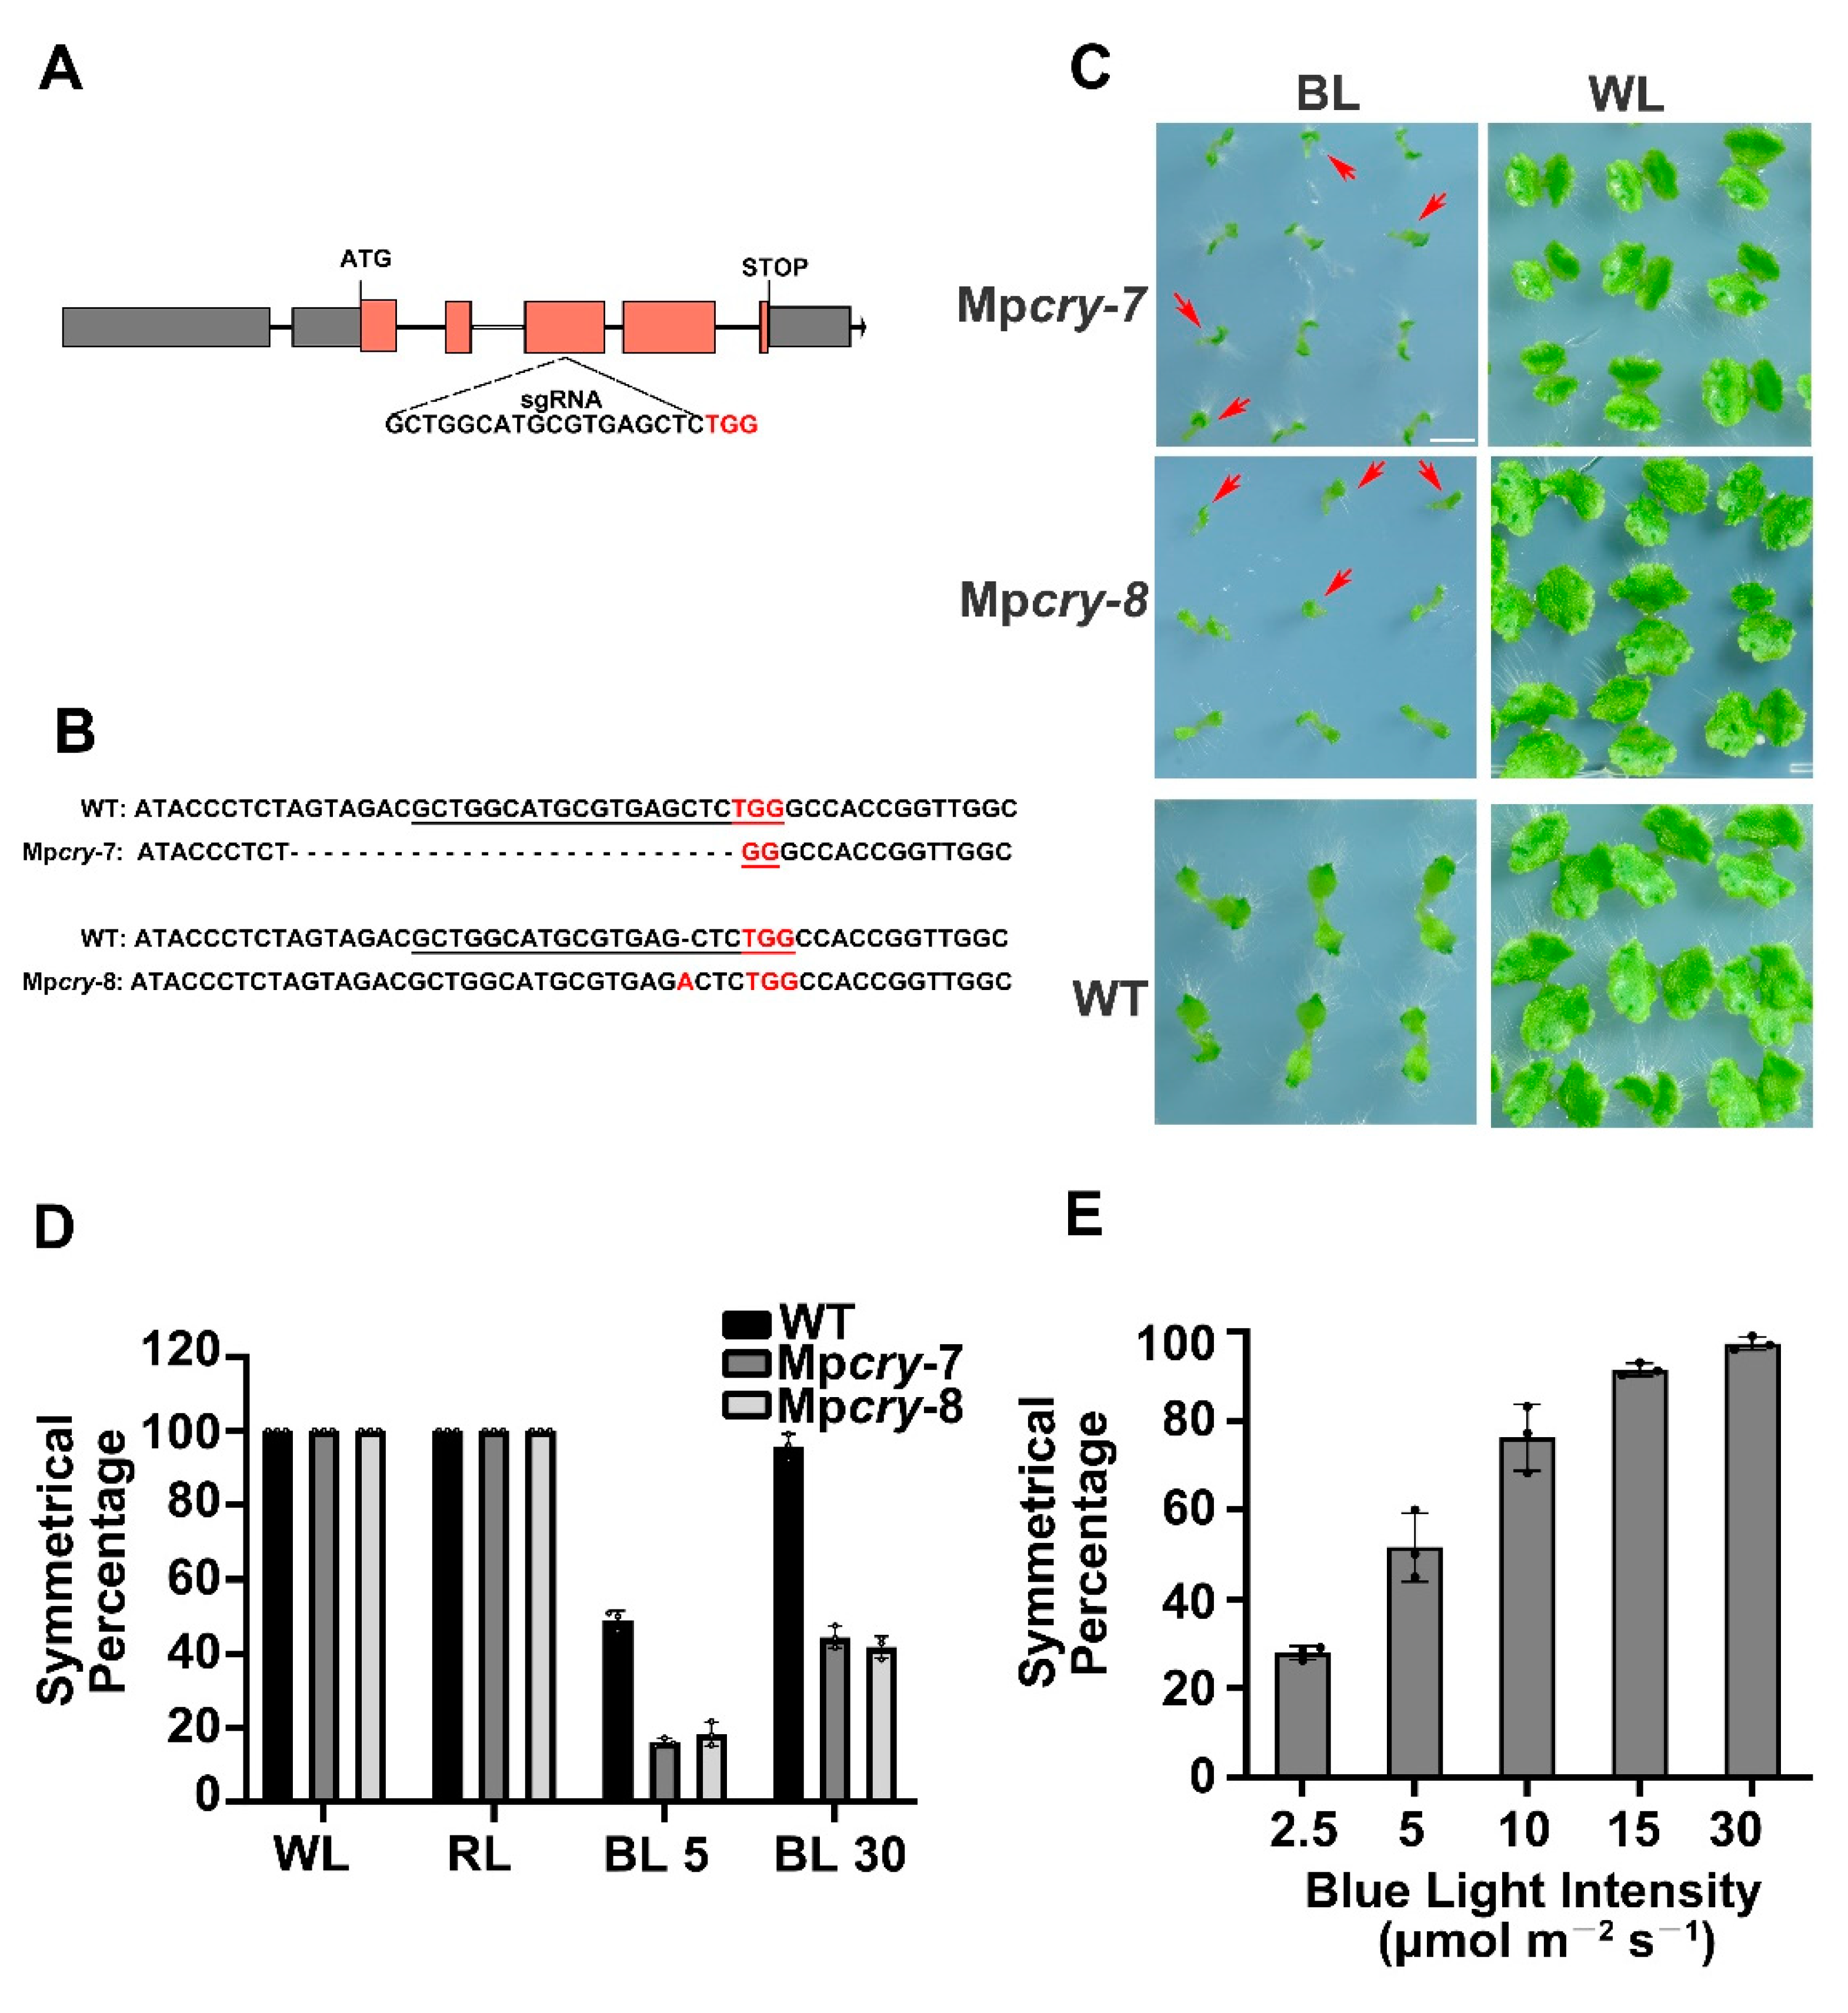
3.1. The Sequence Conservation of MpCRY

Cryptochromes are phylogenetically classified into three distinctive groups, which are represented by plant cryptochromes, animal cryptochromes, and CRY-DASH (cryptochrome-Drosophila, Arabidopsis, Synechocystis, human), respectively [42]. Previous studies have indicated that CRY-DASH primarily plays a role in repairing cyclobutane pyrimidine dimmers, and plant cryptochromes are the major pathway for plant growth and development under blue light [42,43]. Our phylogenetic analysis suggested that the genome of M. polymorpha contains single orthologs of cryptochrome and CRY-DASH (Figure 1A). In this study, we focused on the function of MpCRY (Mp2g17590). The MpCRY gene possesses six exons and five introns, and encodes a protein of 715 amino acids containing a photolyase homologous region (PHR) domain at the N-terminus and a DQXVP-acidic-STAESSS (DAS) domain in the C-terminal cryptochrome C-terminal extension (CCE) domain, both of which are found in most plant cryptochromes [44] (Figure 1B). These results suggest that MpCRY has an evolutionarily conserved structure.

3.2. MpCRY Regulates the Thallus Symmetry of M. polymorpha under Blue Light

To study physiological function of MpCRY, we used a CRISPR/Cas9 system to generate mutants [30], which were named Mpcry-7 and Mpcry-8 respectively (Figure 2A,B). Mpcry-7 and Mpcry-8 have a 26-bp deletion and a 1-bp insertion in the 4th exon of MpCRY, respectively (Figure 2A,B). To confirm both Mpcry-7 and Mpcry-8 are knock-out lines, we performed a qPCR assay to detected the mRNA levels of MpCRY in Mpcry-7 and Mpcry-8 mutants and found that the expression of MpCRY was abolished in both mutant lines (Figure S1A). These mutants were used in the subsequent experiments. It was reported that spores and gemmae of M. polymorpha did not germinate under dark conditions [45,46]. We first incubated the gemmae, vegetative propagules from gemmae gups on the thalli, from WT and Mpcry in darkness and then exposed to continuous white light (WL), red light (RL), and blue light (BL), for two weeks. Under WL, both of the gemmalings of WT and Mpcry grew into flattened thalli with symmetrical dichotomous branches (Figure S1B). With continuous illumination of RL, there was no significant growth differences between WT and Mpcry, and the size of the thalli was slightly smaller than that of thalli grown under WL (Figure S1B). In contrast, both of WT and Mpcry thalli grown under BL (30 μmol m−2 s−1) showed slender shape and oblique angle growth. Interestingly, 56% of Mpcry-7 and 58.2% of Mpcry-8 showed growth from only one side of the gemma (hereafter referred to as ‘asymmetric growth of thallus’) under BL, respectively, while more than 90% of WT plants showed growth from both two sides of the gemma (Figure 2C,D). This asymmetric thallus growth was likely caused by the asymmetric germination of gemmae (Figure S2). To explore the relationship between BL intensity and the asymmetric growth of thalli, we observed the thallus growth of WT exposed to different intensities of BL: The percentage of symmetrically grown thalli decreased by lowering BL intensity from 30 to 2.5 μmol m−2 s−1 in a dose-dependent manner (Figure 2E). We found that under BL of 5 μmol m−2 s−1 intensity, the percentage of symmetric growth in Mpcry-7 and Mpcry-8 was 16% and 18% respectively, significantly lower than that in WT (49%) (Figure 2D), suggesting that Mpcry mutants are less sensitive to BL. These results suggest that BL has a positive effect on the symmetric growth of thallus, and this event is promoted by MpCRY in M. polymorpha.

3.3. Transcriptome Analysis of Mpcry Mutants under Blue Light

The Citrine-tagged version of MpCRY protein was localized to the nucleus and cytoplasm.
(Figure S3A,B), implying its involvement in the transcriptional regulation of BL-responsive genes as reported for A. thaliana [47,48,49]. Since Mpcry and WT both grew symmetrically under WL but presented partial asymmetric growth under BL, we undertook transcriptome analysis on Mpcry-7 and WT gemmalings grown under WL and BL (30 μmol m−2 s−1). In order to compare the transcriptome differences of different genotypes under different light treatments, we calculated a correlation matrix. The Pearson correlation coefficients between the three replicates of each material under each treatment is above 0.98, indicating the repeatability of our experiment. The Pearson correlation coefficients ranged from 0.92 to 0.95 between the three replicates of WT grown in WL and the three replicates of WT grown in BL. Nevertheless, the correlation coefficients decreased (R2 = 0.81–0.88) between the three replicates of Mpcry grown in WL and the three replicates of Mpcry grown in BL (Figure S4A). Therefore, compared to the gene transcription levels in WT, the gene transcription levels in Mpcry change more from WL to pure BL (30 μmol m−2 s−1) irradiation. We also detected a major change in global gene expression, using principal component analysis (PCA). PCA showed that the contribution ratios of PC1 and PC2 were 44.4% and 20.5%, respectively (Figure 3A). Samples of different materials distributed differentially on PC1 and PC2 under different treatment conditions, certifying the diversity of the experimental materials and the variability of experimental treatment conditions. Next, we analysed the expression patterns of shared identified genes in different materals under different light treatments, and found that there are different changes in the expression patterns of WT and Mpcry mutant genes under white light and blue light (Figure S4B). We next defined the genes with the expression fold change ratio (BL vs. WL) > 1.5 or <0.67 and p value < 0.05 as different expression genes (DEGs). We identified 900 down-regulated genes and 968 up-regulated genes under BL compared with WL in WT, and 990 down-regulated genes and 1116 up-regulated genes in Mpcry (Figure 3B). Among the genes down-regulated in Mpcry, 340 genes did not show significant expression changes, while 18 genes were up-regulated in WT; among genes up-regulated in Mpcry, 294 genes did not show significant expression changes, while 38 genes were down-regulated in WT (Figure 3B). 230 down-regulated genes and 166 up-regulated genes in WT did not respond to BL (30 μmol m−2 s−1) in Mpcry (Figure 3B). There are 1086 differential response genes (DRGs) between WT and Mpcry mutants. Subsequently, we undertook GO enrichment analysis on these 1086 differential response genes between WT and Mpcry (Table S1). As shown in Figure 3C, the function enrichment of biological processes is mainly concentrated on photosynthesis, the carbohydrate biosynthetic process, transition metal ion transport and response to light stimulus. In Arabidopsis, cryptochromes regulate transcription factor activities, in a direct or indirect way, to regulate the transcriptional level of a myriad of genes induced by BL [9,11,50,51]. Using the website of PlantTFDB, we predicted 18 transcription factor genes possessing significantly over-represented targets in the 1086 DRGs (Table 1), including MpHY5 (Mp1g16800), MpPIF (Mp3g17350) and MpTCP1 (Mp7g09490).

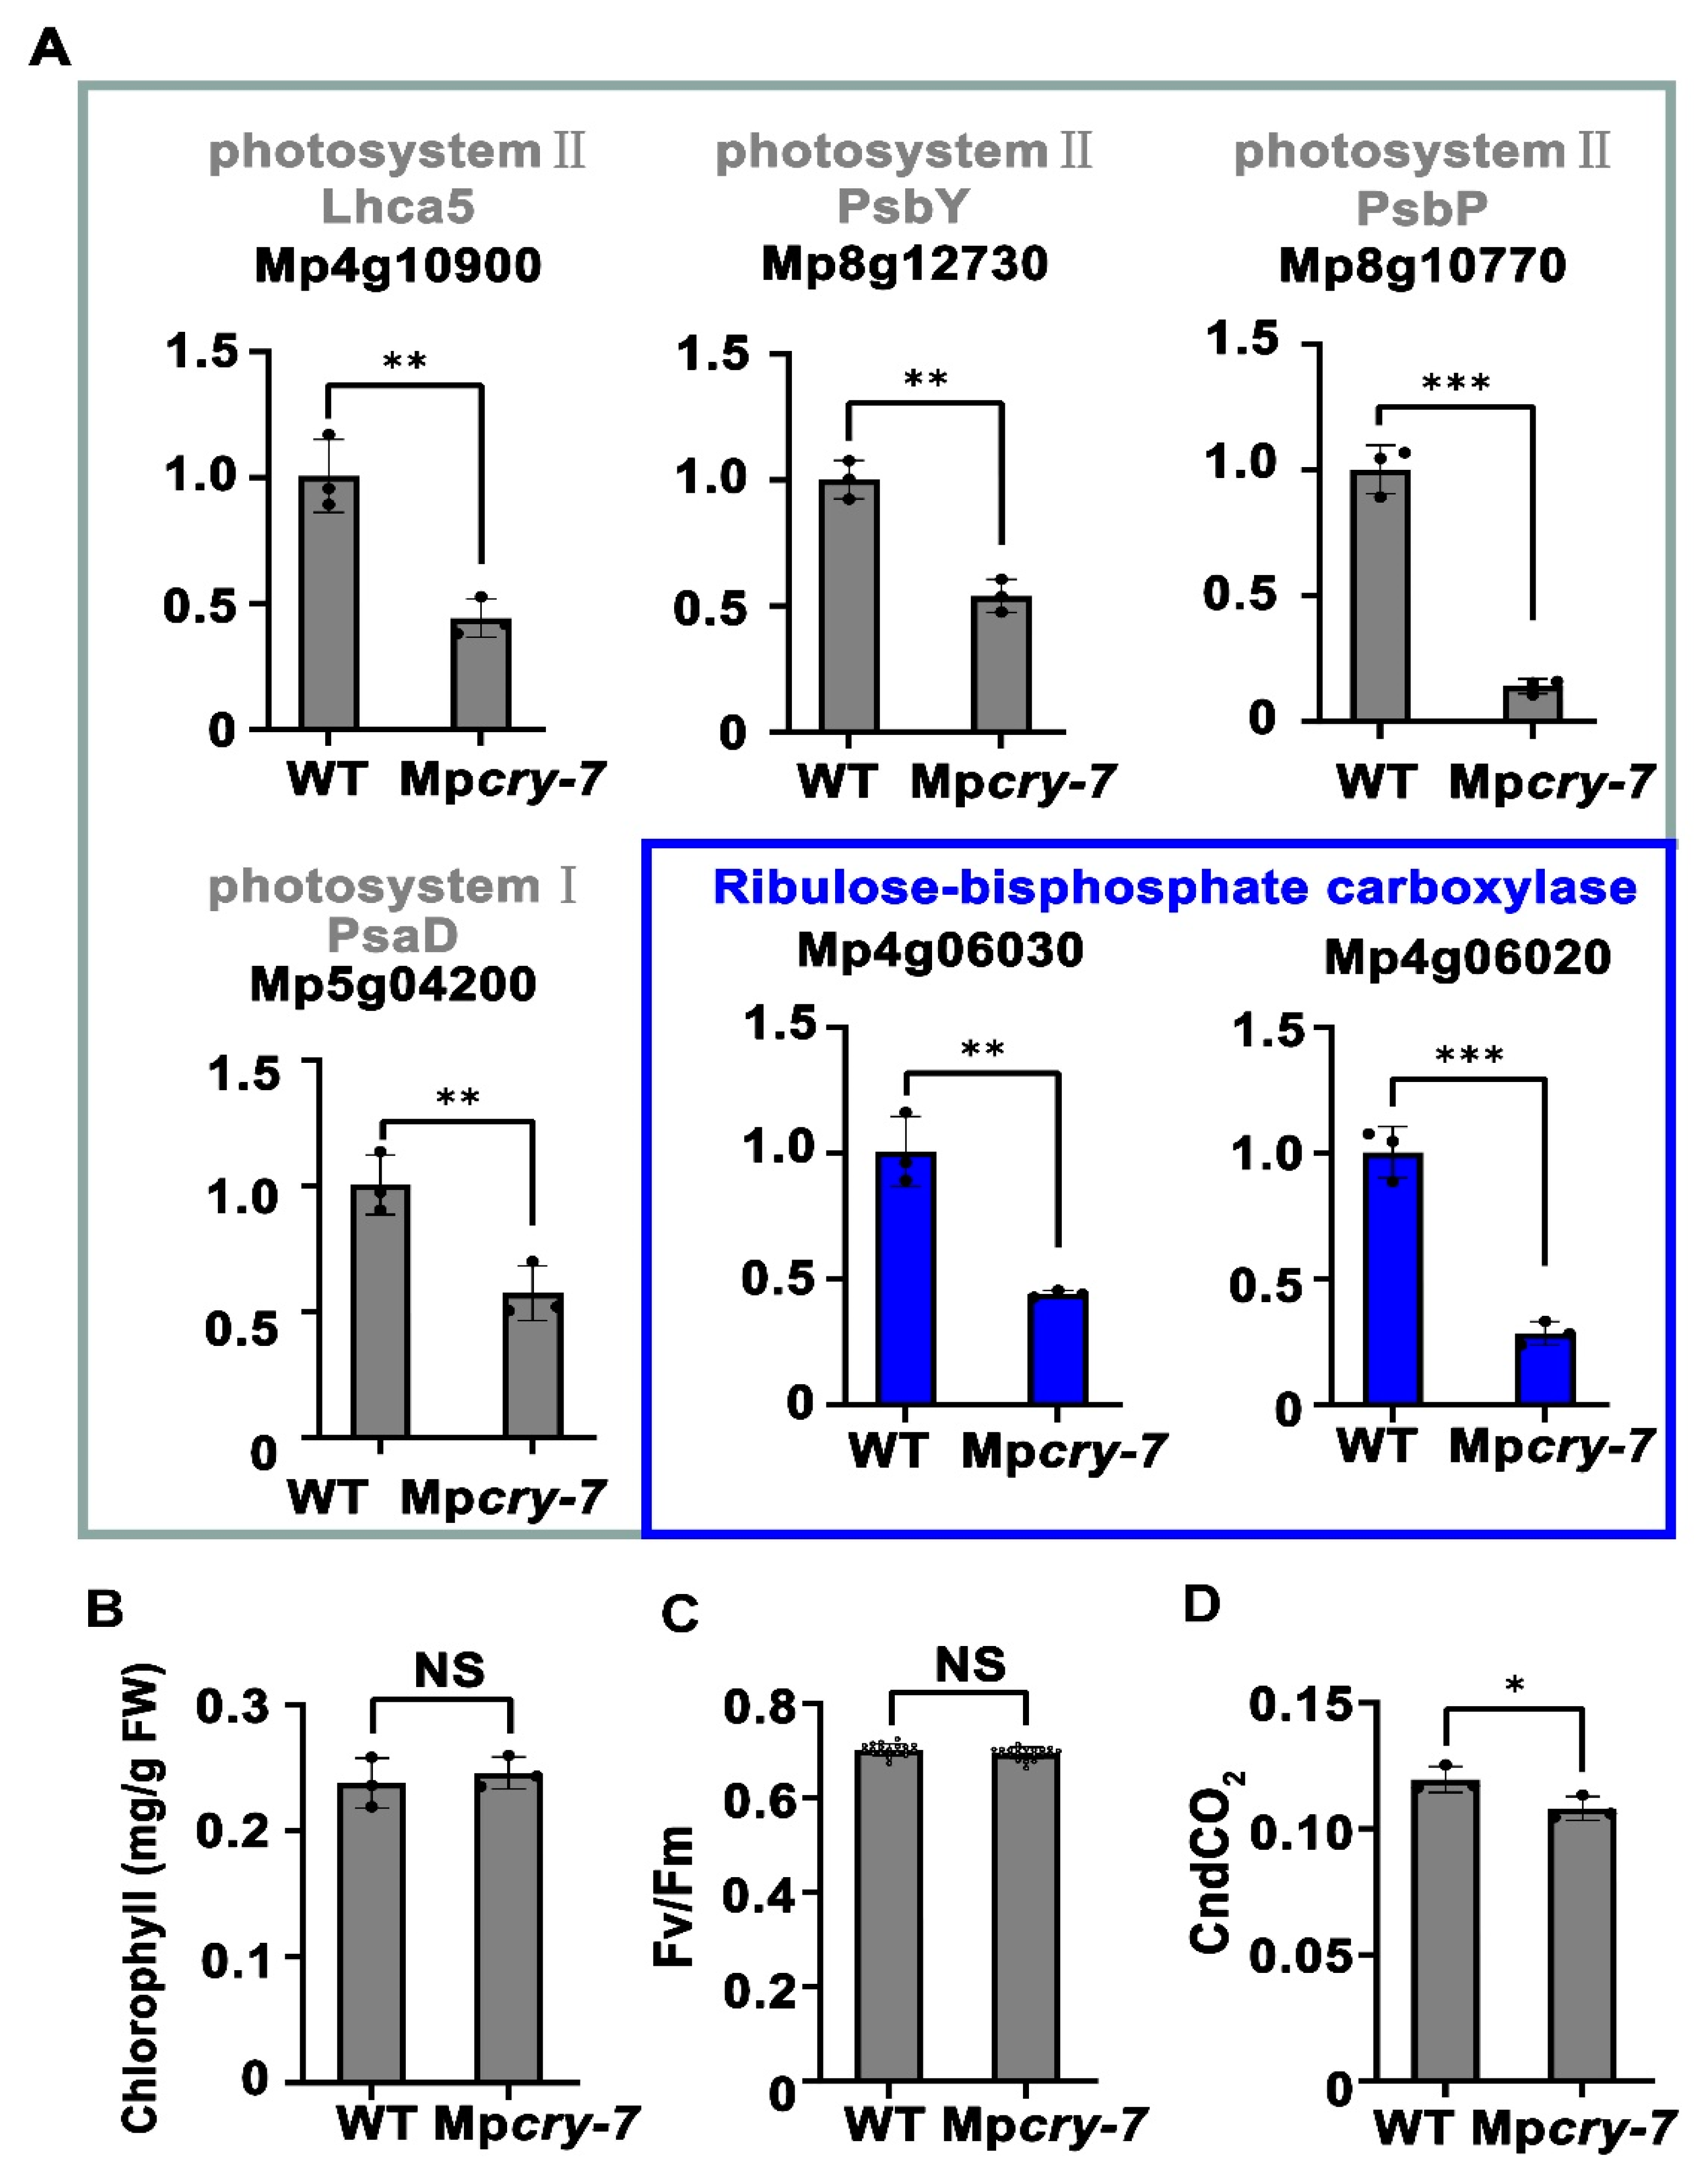
3.4. Mpcry Regulates Transcription of Photosynthesis-Related Genes under Blue Light

To study the regulatory role of Mpcry on photosynthesis, we assessed the photosystems in WT and Mpcry-7 mutant plants under BL (30 μmol m−2 s−1) using qPCR. We detected the expression level of putative photosystem I and II component orthologs, including MpLHCA5, an ortholog of light-harvesting complex II chlorophyll a/b binding protein 5 (Mp4g10900), putative photosystem II components MpPsbY (Mp8g12730) and MpPsbP (Mp8g10770), and a putative photosystem I component MpPsaD (Mp5g04200). We also assessed the expression levels of two putative ribulose-bisphosphate carboxylase small subunit genes involved in carbon fixation in photosynthesis, Mp4g06030 and Mp4g06020. The qPCR analysis showed that the expression level of these genes in Mpcry mutant plants was significantly lower than that in WT (Figure 4A). Although there was no significant difference in chlorophyll content and maximum quantum efficiency of PSII (Fv/Fm) between WT and Mpcry under BL (Figure 4B,C), the absorption efficiency of CO2, commonly used to indicate photosynthetic carbon fixation, decreased in Mpcry when compared with that in WT (Figure 4D). These results indicate that Mpcry induce the expression level of genes involved in photosystem and carbon fixation and Mpcry promotes carbon fixation in M. polymorpha.

3.5. Sucrose Could Partially Restored the Symmetric Growth of the Mpcry Mutant Thallus

To verify whether the asymmetric growth of thalli in Mpcry is mediated by photosynthesis under BL (30 μmol m−2 s−1), we provided sucrose to Mpcry mutant plants. The percentage of Mpcry mutant plants with symmetric thalli raised significantly (Figure 5A,B), suggesting that sucrose plays a supportive role in the symmetric growth of M. polymorpha thalli. To test whether defective photosynthetic light reaction leads to the asymmetric growth of thalli, we added photosynthetic inhibitor DCMU with different concentrations into the culture medium. The results showed that, under BL, 0.01 μM DCMU slightly decreased the percentage of symmetrically grown thalli to 86.3% in WT and to 40.7% in Mpcry, while 0.1 M DCMU remarkably decreased the symmetrical percentage of thalli to 69.8% in WT and to 27% in Mpcry (Figure 5C,D). Besides, DCMU decreases the symmetrical percentage of thalli under WL in WT and Mpcry, as under BL (Figure S5A,B), indicating that the inhibition of photosynthetic light reaction of M. polymorpha leads to a higher percentage of asymmetric growth on thalli irrespective of light quality. These results suggest that BL and sucrose availability are cooperatively involved in the symmetric growth of M. polymorpha thalli, while photosynthetic light reaction influences the symmetry of the thallus growth in a parallel pathway to these two stimuli. To confirm this suggestion, we planted gemmae from Mpcry and WT on the culture medium with 0.01 μM DCMU and 1% sucrose. Consistent with this suggestion, the decreased percentage of symmetrically grown thalli affected by DCMU was partially restored (47.8% in Mpcry and 92.9% in WT) by sucrose (Figure 5E,F and Figure S5C).

3.6. Mpcry Is Likely to Regulate the Symmetric Growth of Thallus through Sucrose Metabolism

As the photosynthesis activity of Mpcry is lower than that of WT, we speculated that the photosynthetic products in Mpcry fewer than WT. Interestingly, the content of starch and sucrose in Mpcry was significantly higher than that in WT (Figure 6A,B). Therefore, we used qPCR to test if expressions of the sugar metabolism pathway genes are changed in Mpcry mutant plants. The results showed that the expression level of a gene encoding putative sucrose-phosphate synthase (SPS; Mp3g02650, Mp2g16990), a key regulator of sucrose biosynthesis, in Mpcry was lower than that in WT, and the expression levels of genes encoding sucrose degradation enzymes, invertases (INVs; Mp7g02630, Mp7g01300, Mp4g16290, Mp7g01660, Mp3g02080) and a sucrose synthase (SuS or SuSy; Mp2g16060), in Mpcry were significantly reduced compared with those in WT (Figure S6). Consistent with these qPCR results, the content of glucose in Mpcry was lower than that in WT (Figure 6C). We applied different amounts of glucose in the culture medium to observe the growth of thalli. The results showed that exogenous application of 0.01% glucose could significantly increase the symmetrical percentage of thalli in Mpcry (from 42% to 69.9%), while the application of a higher concentration of glucose (0.1% and 1%) did not raise the percentage of symmetrical growth in Mpcry thalli (81.6% and 84.8%, respectively) (Figure 6D,E). These results suggest that glucose availability regulates the symmetric growth of thalli in M. polymorpha.

4. Discussion

Energy provided from light is the basis for the normal growth and development of plants. Plants have evolved complex photoreceptor systems to maximize photosynthetic products and make better use of photosynthetic products [52,53]. A previous study showed that the photosynthesis efficiency of Arabidopsis cry1cry2 mutants was reduced [54]. The mechanism of cryptochrome regulating photosynthesis has also been studied. Arabidopsis CRY1 induces the expression of SIG5 to promote the transcription of genes encoding photosystem II core proteins psbA and pcbD under BL [55,56,57]. Arabidopsis CRY2 induces ATAB2 to regulate the photosystem formation of PSI and PSII [58]. Previous transcription and proteomics experiments speculated that CRY2 can affect tomato photosynthesis and the biosynthesis of starch and sucrose [59]. In addition, a recent study showed that tomato CRY1a can promote starch degradation [60]. These studies suggest that cryptochromes play an important role in the regulation of photosynthesis and the utilization of photosynthetic products in vascular plants. However, it has not been studied whether cryptochromes still have these function in bryophytes. In this study, we showed the roles of cryptochrome in carbon fixation and sucrose metabolism in M. polymorpha.
Previous studies have shown that a mixture of RL and far-red light to certain scale significantly affect the germination of gemmae and the morphology of thalli [46]. In this study, we confirmed that BL was associated with the slender thalli and oblique angle growth (Figure S1), and asymmetric growth of thalli in M. polymorpha (Figure 2C,D). Such asymmetry on thalli was actually caused by the asymmetric germination of gemmae in M. polymorpha (Figure S2). In addition, we used transcriptome analysis and found that Mpcry mainly regulates transcription of genes for photosynthesis and sugar metabolism (Figure 3C), suggesting the contribution of Mpcry to photosynthesis and utilization of photosynthetic products in M. polymorpha. Then we found that the efficiency of carbon fixation in Mpcry was lower than that in WT and that sucrose increased the percentage of individuals with asymmetrical growth of thalli in Mpcry (Figure 5A,B), indicating MpCRY positively regulates carbon fixation. Although the transcription of genes encoding proteins in PSII and PSI was down regulated in Mpcry, the maximum quantum yield of photochemical products in PSII did not significantly decrease. These findings suggest that the photosystems may be tolerant to overall down-regulation of most photosynthesis-related genes, but carbon fixation and metabolism may not be. A previous study showed that loss of Photosynthesis-Related RAF (MpPRAF) impaired carbon metabolism but did not have any significant impact on Fv/Fm value [61]. However, MpPRAF is not included in the DEGs of WT and Mpcry. Further experiments are needed to prove whether MpCRY regulates the protein level of MpPRAF. In addition, we found both WT and Mpcry mutants showed an increase in asymmetric growth by DCMU treatment under WL or BL. This result indicates that reduced photosynthesis capacity in M. polymorpha can increase the percentage of individuals with asymmetrical thalli. The decreased percentage of symmetrically grown thalli affected by DCMU was partially restored by sucrose, indicating that photosynthetic light reaction and sucrose influence the symmetry of the thallus growth in a parallel pathway.
Transcriptome analysis also showed 18 transcription factor genes possessing significantly over-represented targets in the 1086 DRPs (Table 1). As these transcriptional factors, such as HY5, have been proven to be regulated by cryptochromes in Arabidopsis [11,50,51], it is reasonable to speculate that cryptochromes play conserved roles in the regulation of these transcription factors. Recent studies have shown that HY5 is a key factor transmitting the nuclear signal, which is mediated by the blue light receptor cryptochromes, to chloroplasts [62]. HY5 not only regulates photosynthesis, but also starch degradation [60,63]. So, whether MpCRY regulates photosynthesis and carbon allocation through HY5 needs further study.
In Mpcry, the efficiency of carbon fixation was lower compared with that in WT, but the content of starch and sucrose was higher (Figure 6A,B). Our study showed that the expression of invertases was down-regulated in Mpcry (Figure S5B). Generally, invertases decompose sucrose into glucose and fructose [64], and glucose can induce the germination of M. polymorpha spores in the dark [45]. These studies suggest a critical role of glucose in the growth and development in M. polymorpha. Consistently, our study showed that symmetric growth of Mpcry thalli was restored when glucose was added into the culture medium (Figure 6D). Taken together, we speculate that the reduction of carbon fixation in Mpcry affects the overall carbon level and that the decrease of sucrose degradation reduces the content of glucose, thus contributing to the asymmetric germination of gemmae. More experiments need to be performed to proof this speculation. For example, whether the knock-out mutants of genes encoding sucrose degradation enzymes also exhibit increased percentage of asymmetric growth of thalli and whether overexpressed MpCRY in these knock-out mutants can restore this phenotype. In addition, we also speculate that there seems to be a mechanism to concentrate glucose or some downstream substances of glucose to one meristem when its availability is limited. It would be interesting to study this mechanism.

Supplementary Materials

The following are available online at https://www.mdpi.com/article/10.3390/cells10123387/s1, Figure S1: Appearance of the top and side of the thalli under the indicated light conditions; Figure S2: Photographs of WT and Mpcry-7 gemmae of M. polymorpha; Figure S3: Confocal microscopy images of Citrine; bright-field and merged images of pro35S::MpCRY-Citrine and pro35S::MpCRY-Tdtomato transgenic lines; Figure S4: Transcriptome differences of different genotypes under different light treatments; Figure S5: DCMU inhibits the symmetrical growth of thalli under WL; Figure S6: Mpcry mutants affect expression of genes involved in sucrose metabolism, Table S1: Go enrichment. Table S2: Primers in this study.

Author Contributions

T.L., L.Z., Z.Y. and Z.Z. conceived the study, designed the experiments. T.L. and S.L. carried out plant material construction and phenotype analysis. L.Z. and S.S. carried out transcriptome analysis, analyzed data of phenotypes and made the publish figures. J.Z. carried out confocal imaging and analyzed data. T.L. and L.Z. wrote the manuscript. Z.Y. and Z.Z. critically commented and revised it. All authors have read and agreed to the published version of the manuscript.

Funding

This research was funded by National Natural Science Foundation of China, grant number 31371411.

Institutional Review Board Statement

Not applicable.

Informed Consent Statement

Not applicable.

Data Availability Statement

RNA-Seq data in this study had been submitted to NCBI with the SRA accession of PRJNA754679.

Acknowledgments

This work was supported by grants from the National Natural Science Foundation of China (31371411 to Z.Z.). We thank all members of the Kohchi, Z.Z. groups and R.S. for helpful discussions and support. T.L. was supported by the China Scholarship Council (CSC) Scholarship Program.

Conflicts of Interest

The authors declare no conflict of interest.

References

  1. Han, X.; Chang, X.; Zhang, Z.; Chen, H.; He, H.; Zhong, B.; Deng, X.W. Origin and evolution of core components responsible for monitoring light environment changes during plant terrestrialization. Mol. Plant 2019, 12, 847–862. [Google Scholar] [CrossRef]
  2. Cashmore, A.R.; Jarillo, J.A.; Wu, Y.J.; Liu, D. Cryptochromes: Blue light receptors for plants and animals. Science 1999, 284, 760–765. [Google Scholar] [CrossRef] [PubMed]
  3. Sancar, A. Cryptochrome: The second photoactive pigment in the eye and its role in circadian photoreception. Annu. Rev. Biochem. 2000, 69, 31–67. [Google Scholar] [CrossRef] [Green Version]
  4. Falciatore, A.; Bowler, C. The evolution and function of blue and red light photoreceptors. Curr. Top. Dev. Biol. 2005, 68, 317–350. [Google Scholar]
  5. Dodson, C.A.; Hore, P.J.; Wallace, M.I. A radical sense of direction: Signalling and mechanism in cryptochrome magnetoreception. Trends Biochem. Sci. 2013, 38, 435–446. [Google Scholar] [CrossRef] [PubMed]
  6. Emery, P.; So, W.V.; Kaneko, M.; Hall, J.C.; Rosbash, M. Cry, a drosophila clock and light-regulated cryptochrome, is a major contributor to circadian rhythm resetting and photosensitivity. Cell 1998, 95, 669–679. [Google Scholar] [CrossRef] [Green Version]
  7. Thresher, R.J.; Vitaterna, M.H.; Miyamoto, Y.; Kazantsev, A.; Hsu, D.S.; Petit, C.; Selby, C.P.; Dawut, L.; Smithies, O.; Takahashi, J.S.; et al. Role of mouse cryptochrome blue-light photoreceptor in circadian photoresponses. Science 1998, 282, 1490–1494. [Google Scholar] [CrossRef] [PubMed]
  8. Ahmad, M.; Cashmore, A.R. Hy4 gene of a. Thaliana encodes a protein with characteristics of a blue-light photoreceptor. Nature 1993, 366, 162–166. [Google Scholar] [CrossRef]
  9. Liu, H.; Yu, X.; Li, K.; Klejnot, J.; Yang, H.; Lisiero, D.; Lin, C. Photoexcited cry2 interacts with cib1 to regulate transcription and floral initiation in arabidopsis. Science 2008, 322, 1535–1539. [Google Scholar] [CrossRef] [Green Version]
  10. Lin, C.; Yang, H.; Guo, H.; Mockler, T.; Chen, J.; Cashmore, A.R. Enhancement of blue-light sensitivity of arabidopsis seedlings by a blue light receptor cryptochrome 2. Proc. Natl. Acad. Sci. USA 1998, 95, 2686–2690. [Google Scholar] [CrossRef] [Green Version]
  11. Pedmale, U.V.; Huang, S.C.; Zander, M.; Cole, B.J.; Hetzel, J.; Ljung, K.; Reis, P.A.B.; Sridevi, P.; Nito, K.; Nery, J.R.; et al. Cryptochromes interact directly with pifs to control plant growth in limiting blue light. Cell 2016, 164, 233–245. [Google Scholar] [CrossRef] [Green Version]
  12. Somers, D.E.; Devlin, P.F.; Kay, S.A. Phytochromes and cryptochromes in the entrainment of the arabidopsis circadian clock. Science 1998, 282, 1488–1490. [Google Scholar] [CrossRef] [Green Version]
  13. Mao, J.; Zhang, Y.C.; Sang, Y.; Li, Q.H.; Yang, H.Q. From the cover: A role for arabidopsis cryptochromes and cop1 in the regulation of stomatal opening. Proc. Natl. Acad. Sci. USA 2005, 102, 12270–12275. [Google Scholar] [CrossRef] [PubMed] [Green Version]
  14. Imaizumi, T.; Kadota, A.; Hasebe, M.; Wada, M. Cryptochrome light signals control development to suppress auxin sensitivity in the moss physcomitrella patens. Plant Cell 2002, 14, 373–386. [Google Scholar] [CrossRef] [PubMed] [Green Version]
  15. Ichikawa, K.; Sugita, M.; Imaizumi, T.; Wada, M.; Aoki, S. Differential expression on a daily basis of plastid sigma factor genes from the moss physcomitrella patens. Regulatory interactions among ppsig5, the circadian clock, and blue light signaling mediated by cryptochromes. Plant Physiol. 2004, 136, 4285–4298. [Google Scholar] [CrossRef] [PubMed] [Green Version]
  16. Riese, M.; Zobell, O.; Saedler, H.; Huijser, P. Sbp-domain transcription factors as possible effectors of cryptochrome-mediated blue light signalling in the moss physcomitrella patens. Planta 2008, 227, 505–515. [Google Scholar] [CrossRef] [Green Version]
  17. Berger, F.; Bowman, J.L.; Kohchi, T. Marchantia. Curr. Biol. CB 2016, 26, R186–R187. [Google Scholar] [CrossRef] [Green Version]
  18. Bowman, J.L.; Kohchi, T.; Yamato, K.T.; Jenkins, J.; Shu, S.; Ishizaki, K.; Yamaoka, S.; Nishihama, R.; Nakamura, Y.; Berger, F.; et al. Insights into land plant evolution garnered from the marchantia polymorpha genome. Cell 2017, 171, 287–304.e215. [Google Scholar] [CrossRef] [Green Version]
  19. Ishizaki, K.; Nishihama, R.; Yamato, K.T.; Kohchi, T. Molecular genetic tools and techniques for marchantia polymorpha research. Plant Cell Physiol. 2016, 57, 262–270. [Google Scholar] [CrossRef] [Green Version]
  20. Komatsu, A.; Terai, M.; Ishizaki, K.; Suetsugu, N.; Tsuboi, H.; Nishihama, R.; Yamato, K.T.; Wada, M.; Kohchi, T. Phototropin encoded by a single-copy gene mediates chloroplast photorelocation movements in the liverwort marchantia polymorpha. Plant Physiol. 2014, 166, 411–427. [Google Scholar] [CrossRef] [Green Version]
  21. Suzuki, T.; Takio, S.; Yamamoto, I.; Satoh, T. Characterization of cdna of the liverwort phytochrome gene, and phytochrome involvement in the light-dependent and light-independent protochlorophyllide oxidoreductase gene expression in marchantia paleacea var. Diptera. Plant Cell Physiol. 2001, 42, 576–582. [Google Scholar] [CrossRef] [Green Version]
  22. Inoue, K.; Nishihama, R.; Kataoka, H.; Hosaka, M.; Manabe, R.; Nomoto, M.; Tada, Y.; Ishizaki, K.; Kohchi, T. Phytochrome signaling is mediated by phytochrome interacting factor in the liverwort marchantia polymorpha. Plant Cell 2016, 28, 1406–1421. [Google Scholar] [CrossRef] [Green Version]
  23. Soriano, G.; Cloix, C.; Heilmann, M.; Nunez-Olivera, E.; Martinez-Abaigar, J.; Jenkins, G.I. Evolutionary conservation of structure and function of the uvr8 photoreceptor from the liverwort marchantia polymorpha and the moss physcomitrella patens. New Phytol. 2018, 217, 151–162. [Google Scholar] [CrossRef] [Green Version]
  24. Kubota, A.; Kita, S.; Ishizaki, K.; Nishihama, R.; Yamato, K.T.; Kohchi, T. Co-option of a photoperiodic growth-phase transition system during land plant evolution. Nat. Commun. 2014, 5, 3668. [Google Scholar] [CrossRef] [PubMed]
  25. Sugano, S.S.; Shirakawa, M.; Takagi, J.; Matsuda, Y.; Shimada, T.; Hara-Nishimura, I.; Kohchi, T. Crispr/cas9-mediated targeted mutagenesis in the liverwort marchantia polymorpha l. Plant Cell Physiol. 2014, 55, 475–481. [Google Scholar] [CrossRef]
  26. Ishizaki, K.; Chiyoda, S.; Yamato, K.T.; Kohchi, T. Agrobacterium-mediated transformation of the haploid liverwort marchantia polymorpha l, an emerging model for plant biology. Plant Cell Physiol. 2008, 49, 1084–1091. [Google Scholar] [CrossRef] [Green Version]
  27. Gamborg, O.L.; Miller, R.A.; Ojima, K. Nutrient requirements of suspension cultures of soybean root cells. Exp. Cell Res. 1968, 50, 151–158. [Google Scholar] [CrossRef]
  28. Edgar, R.C. Muscle: Multiple sequence alignment with high accuracy and high throughput. Nucleic Acids Res. 2004, 32, 1792–1797. [Google Scholar] [CrossRef] [Green Version]
  29. Guindon, S.; Dufayard, J.F.; Lefort, V.; Anisimova, M.; Hordijk, W.; Gascuel, O. New algorithms and methods to estimate maximum-likelihood phylogenies: Assessing the performance of phyml 3.0. Syst. Biol. 2010, 59, 307–321. [Google Scholar] [CrossRef] [Green Version]
  30. Sugano, S.S.; Nishihama, R. Crispr/cas9-based genome editing of transcription factor genes in marchantia polymorpha. Methods Mol. Biol. 2018, 1830, 109–126. [Google Scholar] [PubMed]
  31. Sugano, S.S.; Nishihama, R.; Shirakawa, M.; Takagi, J.; Matsuda, Y.; Ishida, S.; Shimada, T.; Hara-Nishimura, I.; Osakabe, K.; Kohchi, T. Efficient crispr/cas9-based genome editing and its application to conditional genetic analysis in marchantia polymorpha. PLoS ONE 2018, 13, e0205117. [Google Scholar] [CrossRef] [Green Version]
  32. Ishizaki, K.; Nishihama, R.; Ueda, M.; Inoue, K.; Ishida, S.; Nishimura, Y.; Shikanai, T.; Kohchi, T. Development of gateway binary vector series with four different selection markers for the liverwort marchantia polymorpha. PLoS ONE 2015, 10, e0138876. [Google Scholar]
  33. Kubota, A.; Ishizaki, K.; Hosaka, M.; Kohchi, T. Efficient agrobacterium-mediated transformation of the liverwort marchantia polymorpha using regenerating thalli. Biosci. Biotechnol. Bioch. 2013, 77, 167–172. [Google Scholar] [CrossRef] [Green Version]
  34. Yang, X.; Liu, D.; Liu, F.; Wu, J.; Zou, J.; Xiao, X.; Zhao, F.; Zhu, B. Htqc: A fast quality control toolkit for illumina sequencing data. BMC Bioinform. 2013, 14, 33. [Google Scholar] [CrossRef] [PubMed] [Green Version]
  35. Kim, D.; Pertea, G.; Trapnell, C.; Pimentel, H.; Kelley, R.; Salzberg, S.L. Tophat2: Accurate alignment of transcriptomes in the presence of insertions, deletions and gene fusions. Genome Biol. 2013, 14, R36. [Google Scholar] [CrossRef] [Green Version]
  36. Trapnell, C.; Williams, B.A.; Pertea, G.; Mortazavi, A.; Kwan, G.; van Baren, M.J.; Salzberg, S.L.; Wold, B.J.; Pachter, L. Transcript assembly and quantification by rna-seq reveals unannotated transcripts and isoform switching during cell differentiation. Nat. Biotechnol. 2010, 28, 511–515. [Google Scholar] [CrossRef] [PubMed] [Green Version]
  37. Robinson, M.D.; McCarthy, D.J.; Smyth, G.K. Edger: A bioconductor package for differential expression analysis of digital gene expression data. Bioinformatics 2010, 26, 139–140. [Google Scholar] [CrossRef] [Green Version]
  38. Conesa, A.; Gotz, S.; Garcia-Gomez, J.M.; Terol, J.; Talon, M.; Robles, M. Blast2go: A universal tool for annotation, visualization and analysis in functional genomics research. Bioinformatics 2005, 21, 3674–3676. [Google Scholar] [CrossRef] [PubMed] [Green Version]
  39. Sandhu, L.C.; Warters, R.L.; Dethlefsen, L.A. Fluorescence studies of hoechst 33342 with supercoiled and relaxed plasmid pbr322 DNA. Cytometry 1985, 6, 191–194. [Google Scholar] [CrossRef] [PubMed]
  40. Tawakoli, P.N.; Al-Ahmad, A.; Hoth-Hannig, W.; Hannig, M.; Hannig, C. Comparison of different live/dead stainings for detection and quantification of adherent microorganisms in the initial oral biofilm. Clin. Oral Investig. 2013, 17, 841–850. [Google Scholar] [CrossRef]
  41. Saint-Marcoux, D.; Proust, H.; Dolan, L.; Langdale, J.A. Identification of reference genes for real-time quantitative pcr experiments in the liverwort marchantia polymorpha. PLoS ONE 2015, 10, e0118678. [Google Scholar]
  42. Wang, Q.; Lin, C. Mechanisms of cryptochrome-mediated photoresponses in plants. Annu. Rev. Plant Biol. 2020, 71, 103–129. [Google Scholar] [CrossRef] [Green Version]
  43. Selby, C.P.; Sancar, A. A cryptochrome/photolyase class of enzymes with single-stranded DNA-specific photolyase activity. Proc. Natl. Acad. Sci. USA 2006, 103, 17696–17700. [Google Scholar] [CrossRef] [Green Version]
  44. Lin, C.; Shalitin, D. Cryptochrome structure and signal transduction. Annu. Rev. Plant Biol. 2003, 54, 469–496. [Google Scholar] [CrossRef] [Green Version]
  45. Nakazato, T.; Kadota, A.; Wada, M. Photoinduction of spore germination in Marchantia polymorpha L. is mediated by photosynthesis. Plant Cell Physiol. 1999, 40, 1014–1020. [Google Scholar] [CrossRef] [Green Version]
  46. Inoue, K.; Nishihama, R.; Kohchi, T. Phytochrome and light signaling in marchantia. Methods Mol. Biol. 2019, 2026, 215–223. [Google Scholar] [PubMed]
  47. Ma, L.; Li, J.; Qu, L.; Hager, J.; Chen, Z.; Zhao, H.; Deng, X.W. Light control of arabidopsis development entails coordinated regulation of genome expression and cellular pathways. Plant Cell 2001, 13, 2589–2607. [Google Scholar] [CrossRef]
  48. Sellaro, R.; Hoecker, U.; Yanovsky, M.; Chory, J.; Casal, J.J. Synergism of red and blue light in the control of arabidopsis gene expression and development. Curr. Biol. CB 2009, 19, 1216–1220. [Google Scholar] [CrossRef] [Green Version]
  49. Wang, Q.; Zuo, Z.; Wang, X.; Gu, L.; Yoshizumi, T.; Yang, Z.; Yang, L.; Liu, Q.; Liu, W.; Han, Y.J.; et al. Photoactivation and inactivation of arabidopsis cryptochrome 2. Science 2016, 354, 343–347. [Google Scholar] [CrossRef] [PubMed] [Green Version]
  50. Liu, B.; Zuo, Z.; Liu, H.; Liu, X.; Lin, C. Arabidopsis cryptochrome 1 interacts with spa1 to suppress cop1 activity in response to blue light. Genes Dev. 2011, 25, 1029–1034. [Google Scholar] [CrossRef] [PubMed] [Green Version]
  51. He, Z.; Zhao, X.; Kong, F.; Zuo, Z.; Liu, X. Tcp2 positively regulates hy5/hyh and photomorphogenesis in arabidopsis. J. Exp. Bot. 2016, 67, 775–785. [Google Scholar] [CrossRef] [Green Version]
  52. Pierik, R.; Ballaré, C.L. Control of plant growth and defense by photoreceptors: From mechanisms to opportunities in agriculture. Mol. Plant 2021, 14, 61–76. [Google Scholar] [CrossRef] [PubMed]
  53. Fortunato, A.E.; Annunziata, R.; Jaubert, M.; Bouly, J.P.; Falciatore, A. Dealing with light: The widespread and multitasking cryptochrome/photolyase family in photosynthetic organisms. J. Plant Physiol. 2015, 172, 42–54. [Google Scholar] [CrossRef] [PubMed]
  54. Boccalandro, H.E.; Giordano, C.V.; Ploschuk, E.L.; Piccoli, P.N.; Bottini, R.; Casal, J.J. Phototropins but not cryptochromes mediate the blue light-specific promotion of stomatal conductance, while both enhance photosynthesis and transpiration under full sunlight. Plant Physiol. 2012, 158, 1475–1484. [Google Scholar] [CrossRef] [Green Version]
  55. Tsunoyama, Y.; Morikawa, K.; Shiina, T.; Toyoshima, Y. Blue light specific and differential expression of a plastid sigma factor, sig5 in arabidopsis thaliana. FEBS Lett. 2002, 516, 225–228. [Google Scholar] [CrossRef] [Green Version]
  56. Thum, K.E.; Kim, M.; Christopher, D.A.; Mullet, J.E. Cryptochrome 1, cryptochrome 2, and phytochrome a co-activate the chloroplast psbd blue light-responsive promoter. Plant Cell 2001, 13, 2747–2760. [Google Scholar] [PubMed] [Green Version]
  57. Mochizuki, T.; Onda, Y.; Fujiwara, E.; Wada, M.; Toyoshima, Y. Two independent light signals cooperate in the activation of the plastid psbd blue light-responsive promoter in arabidopsis. FEBS Lett. 2004, 571, 26–30. [Google Scholar] [CrossRef] [Green Version]
  58. Barneche, F.; Winter, V.; Crèvecoeur, M.; Rochaix, J.-D. Atab2 is a novel factor in the signalling pathway of light-controlled synthesis of photosystem proteins. EMBO J. 2006, 25, 5907–5918. [Google Scholar] [CrossRef]
  59. Lopez, L.; Carbone, F.; Bianco, L.; Giuliano, G.; Facella, P.; Perrotta, G. Tomato plants overexpressing cryptochrome 2 reveal altered expression of energy and stress-related gene products in response to diurnal cues. Plant Cell Environ. 2012, 35, 994–1012. [Google Scholar] [CrossRef] [PubMed]
  60. Dong, H.; Hu, C.; Liu, C.; Wang, J.; Zhou, Y.; Yu, J. Elongated hypocotyl 5 mediates blue light-induced starch degradation in tomato. J. Exp. Bot. 2021, 72, 2627–2641. [Google Scholar] [CrossRef]
  61. Koide, E.; Suetsugu, N.; Iwano, M.; Gotoh, E.; Nomura, Y.; Stolze, S.C.; Nakagami, H.; Kohchi, T.; Nishihama, R. Regulation of photosynthetic carbohydrate metabolism by a raf-like kinase in the liverwort marchantia polymorpha. Plant Cell Physiol. 2019, 61, 631–643. [Google Scholar] [CrossRef]
  62. Griffin, J.H.C.; Prado, K.; Sutton, P.; Toledo-Ortiz, G. Coordinating light responses between the nucleus and the chloroplast, a role for plant cryptochromes and phytochromes. Physiol. Plant. 2020, 169, 515–528. [Google Scholar] [CrossRef] [PubMed]
  63. Buccitelli, C.; Selbach, M. Mrnas, proteins and the emerging principles of gene expression control. Nat. Rev. Genet. 2020, 21, 630–644. [Google Scholar] [CrossRef] [PubMed]
  64. Ruan, Y.L.; Jin, Y.; Yang, Y.J.; Li, G.J.; Boyer, J.S. Sugar input, metabolism, and signaling mediated by invertase: Roles in development, yield potential, and response to drought and heat. Mol. Plant 2010, 3, 942–955. [Google Scholar] [CrossRef] [PubMed]
Figure 1. Phylogenetic analysis of cryptochromes from green algae and land plants. (A) Phylogenetic relationships of plant cryptochromes. The tree was constructed using 23 cryptochromes from various plant species. The Ostreococcus lucimarinus Ot_43003 sequence was used as the outgroup. Posterior probabilities are indicated at the nodes. At, Arabidopsis thaliana; AmTr, Amborella trichopoda; Sm, Selaginella moellendorffii; Pp/Phpat, Physcomitrium patens; Mapoly, Marchantia polymorpha; Kf, Klebsormidium nitens; Cre, Chlamydomonas reinhardtii; Ot, Ostreococcus lucimarinus. Bar indicates 0.1 substitutions per site. (B) Alignment of amino acid sequences of cryptochromes from M. polymorpha and A. thaliana. Identical and similar amino acid residues are highlighted with black and gray boxes, respectively. Red and yellow underlines indicate N-terminal PHR domain and CCE domain, respectively. Green background sequences indicate the DAS domain. Red inverted triangles indicate positions corresponding to intron insertion in the genes.* indicates the end point of the amino acid sequence.
Cells 10 03387 g001
Figure 2. Growth of gemmalings of WT and Mpcry mutants under various BL conditions. (A) Schematic diagram of the structure of the MpCRY gene and the target sequence of CRISPR/Cas9 genome editing. Grey boxes indicate 5′ UTR and 3′ UTR. Orange boxes indicate CDS regions. Exons contain grey boxes and orange boxes. Black lines indicate introns. (B) Mpcry mutations detected by sequencing analysis. The PAM (protospacer adjacent motif) sequence is highlighted in red, and the target sequence is underlined in black. Dashes indicate deleted bases. (C) Photographs of gemmalings under BL or WL for 14 days. Bar = 5 mm. The red arrows represent individuals with asymmetric growth of thallus. (D) The symmetrical percentage represents the percentage of plants showing symmetric growth under the indicated light conditions. The gemmalings of WT, Mpcry-7, and Mpcry-8 were grown under continuous WL (WL; 50 μmol m−2 s−1), continuous RL (RL; 30 μmol m−2 s−1) or continuous BL (BL; 30 μmol m−2 s−1) for 14 days, respectively. Data are presented as mean ± SD (n = 3 biological statistics). More than 100 gemmalings were used for one count. (E) The symmetrical percentage of WT thalli under continuous BL irradiation at various light intensities (2.5 to 30 μmol m−2 s−1). Data are presented as mean ± SD (n = 3 biological statistics). More than 100 gemmalings were used for one count.
Cells 10 03387 g002
Figure 3. Differential response genes (DRGs) in WT and Mpcry mutant plants grown under BL and WL conditions and GO enrichment analysis. (A) Principal component analysis (PCA) of transcriptome changes of between WT and Mpcry under different light treatments. (B) Venn diagram showing overlaps of DEGs (Blue_vs_White) in WT and Mpcry. Genes with a fold change ratio (Blue_vs_white) > 1.5 or <0.67 and a p value < 0.05 as deferentially expressed genes (DEGs). (C) GO enrichment analysis of 1084 DRGs between WT and Mpcry.
Cells 10 03387 g003
Figure 4. Mpcry regulates the transcription of photosynthesis-related genes under BL. (A) qPCR showing that the expression of genes coding proteins in photosystem II, photosystem I and ribulose-bisphosphate carboxylase in WT and Mpcry-7 (n = 3 biological replicates). Student’s t test: *** p < 0.001, ** p < 0.01, * p < 0.05. (BD) Chlorophyll levels (mg/g FW), Fv/Fm and total conductance to CO2 for WT and Mpcry-7 grown under BL. NS, No significance. In (C), asterisk indicates p < 0.05.
Cells 10 03387 g004
Figure 5. (A) Photographs of gemmalings treated without or with 1% sucrose in half-strength Gamborg’s B5 medium under BL (30 μmol m−2 s−1) for 14 days. Bar = 5 mm. The red arrows represent individuals with asymmetric growth of thalli. (B) The symmetrical percentage in (A). Data are presented as mean ± SD (n = 3 biological statistics, small black circles). More than 100 gemmalings were used for one count. (C) Photographs of gemmalings treated with different concentrations of DCMU in half-strength Gamborg’s B5 medium under BL (30 μmol m−2 s−1) for 14 days. Bar = 5 mm. The red arrows represent individuals with asymmetric growth of thalli. (D) The symmetrical percentage in (C). Data are presented as mean ± SD (n = 3 biological statistics, small black circles). More than 100 gemmalings were used for one count. (E,F) The symmetrical percentage of symmetrically grown gemmalings in Mpcry (E) and in WT (F). Gemmae were planted on the indicate culture medium under BL (30 μmol m−2 s−1) for 5 days. +SUC and −SUC represent the culture medium with or without 1% sucrose. Black and Grey column represent the culture medium with and without 0.01 μM DCMU respectively. Data are presented as mean ± SD (n = 3 biological statistics, small black circles). More than 100 gemmalings were used for one count.
Cells 10 03387 g005
Figure 6. Mpcry regulates the symmetric growth of thalli by affecting glucose content under BL. (AC) Quantifications of starch, sucrose, glucose contents in WT and Mpcry-7 grown under continuous BL for 14 days. Data are presented as mean ± SD (n = 3 biological replicates). Student’s t test: *** p < 0.001, ** p < 0.01. (D) Photographs of gemmalings treated with different concentrations of glucose under BL (30 μmol m−2 s−1) for 14 days. Bar = 5 mm. The red arrows represent individuals with asymmetric growth of thalli. (E) The percentage of individuals with symmetric growth of thalli in (D). Data are presented as mean ± SD (n = 3 biological statistics). More than 100 gemmalings were used for one count.
Cells 10 03387 g006
Table 1. 18 transcription factor genes possessing significantly over-represented targets in the 1086 DRGs.
TFBackground
All
Background
_Bind
Query_AllQuery_Bindp_Valueq_ValueBest Hit in Arabidopsis thalianaDescription
Mp7g0949019,2874041086432.19 × 10−51.78 × 10⁻³AT1G69690TCP family protein
Mp8g0382019,2874901086487.06 × 10−52.53 × 10⁻³AT5G28770bZIP family protein
Mp2g2360019,2876041086569.36 × 10−52.53 × 10⁻³AT1G49720abscisic acid responsive element-binding factor 1
Mp6g0392019,2874841086413.64 × 10−37.38 × 10⁻²AT1G75390basic leucine-zipper 44
Mp6g1865019,2875711086459.36 × 10−31.52 × 10⁻¹AT5G19790related to AP2 11
Mp1g1364019,2871031086111.30 × 10−21.57 × 10⁻¹AT1G20980squamosa promoter binding protein-like 14
Mp5g0697019,2874361086351.41 × 10−21.57 × 10⁻¹AT5G13910ERF family protein
Mp2g0717019,2875031086391.77 × 10−21.57 × 10⁻¹AT2G46270G-box binding factor 3
Mp5g1248019,2875201086401.88 × 10−21.57 × 10⁻¹AT1G72360ERF family protein
Mp4g1453019,2871621086152.06 × 10−21.57 × 10⁻¹AT1G66810C3H family protein
Mp5g2108019,28713911086952.13 × 10−21.57 × 10⁻¹AT5G63090LBD family protein
Mp6g0483019,2872391086202.92 × 10−21.70 × 10⁻¹AT3G49690myb domain protein 84
Mp2g0223019,2874151086322.92 × 10−21.70 × 10⁻¹AT2G40950bZIP family protein
Mp2g1302019,2872251086192.94 × 10−21.70 × 10⁻¹AT5G08520MYB family protein
Mp3g1735019,2873591086283.27 × 10−21.77 × 10⁻¹AT1G09530phytochrome interacting factor 3
Mp7g0264019,2872741086223.67 × 10−21.86 × 10⁻¹AT3G20770EIL family protein
Mp1g2502019,287300110861894.00 × 10−21.91 × 10⁻¹AT1G72050transcription factor IIIA
Mp1g1680019,2874001086304.51 × 10−22.03 × 10⁻¹AT5G11260bZIP family protein
Publisher’s Note: MDPI stays neutral with regard to jurisdictional claims in published maps and institutional affiliations.

