
hiPSC-Derived Schwann Cells Influence Myogenic Differentiation in Neuromuscular Cocultures

 , , ,
, , , 

Abstract
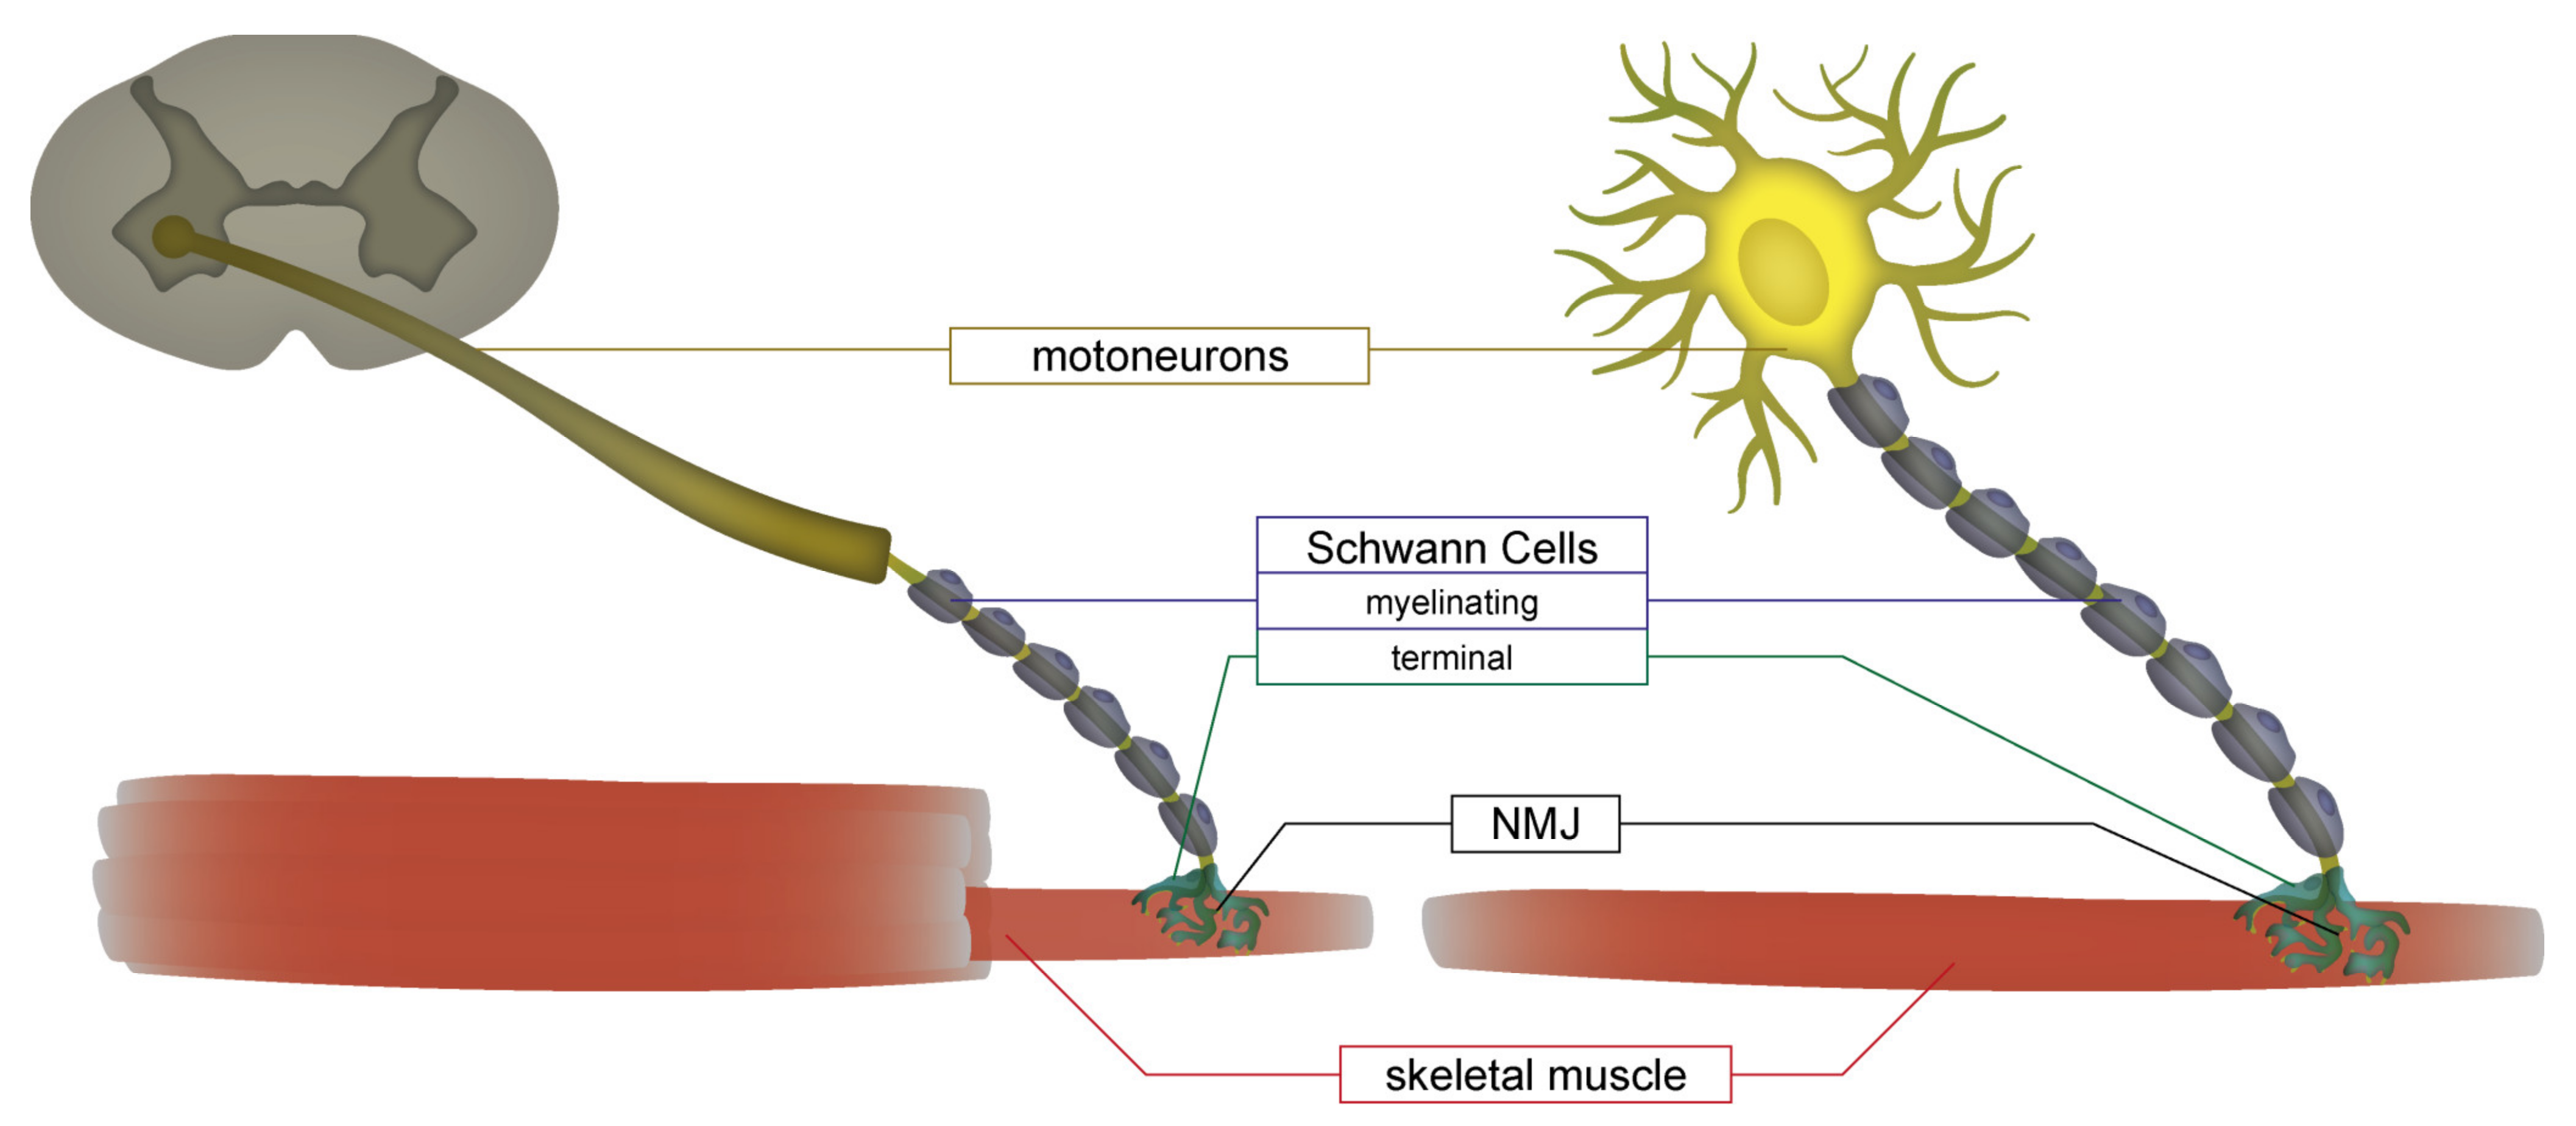
1. Introduction
2. Materials and Methods
2.1. hiPSC Culture
2.2. hiPSC Motoneuron (MN) Differentiation
2.3. hiPSC Schwann Cell (SC) Differentiation
2.4. C2C12 Culture
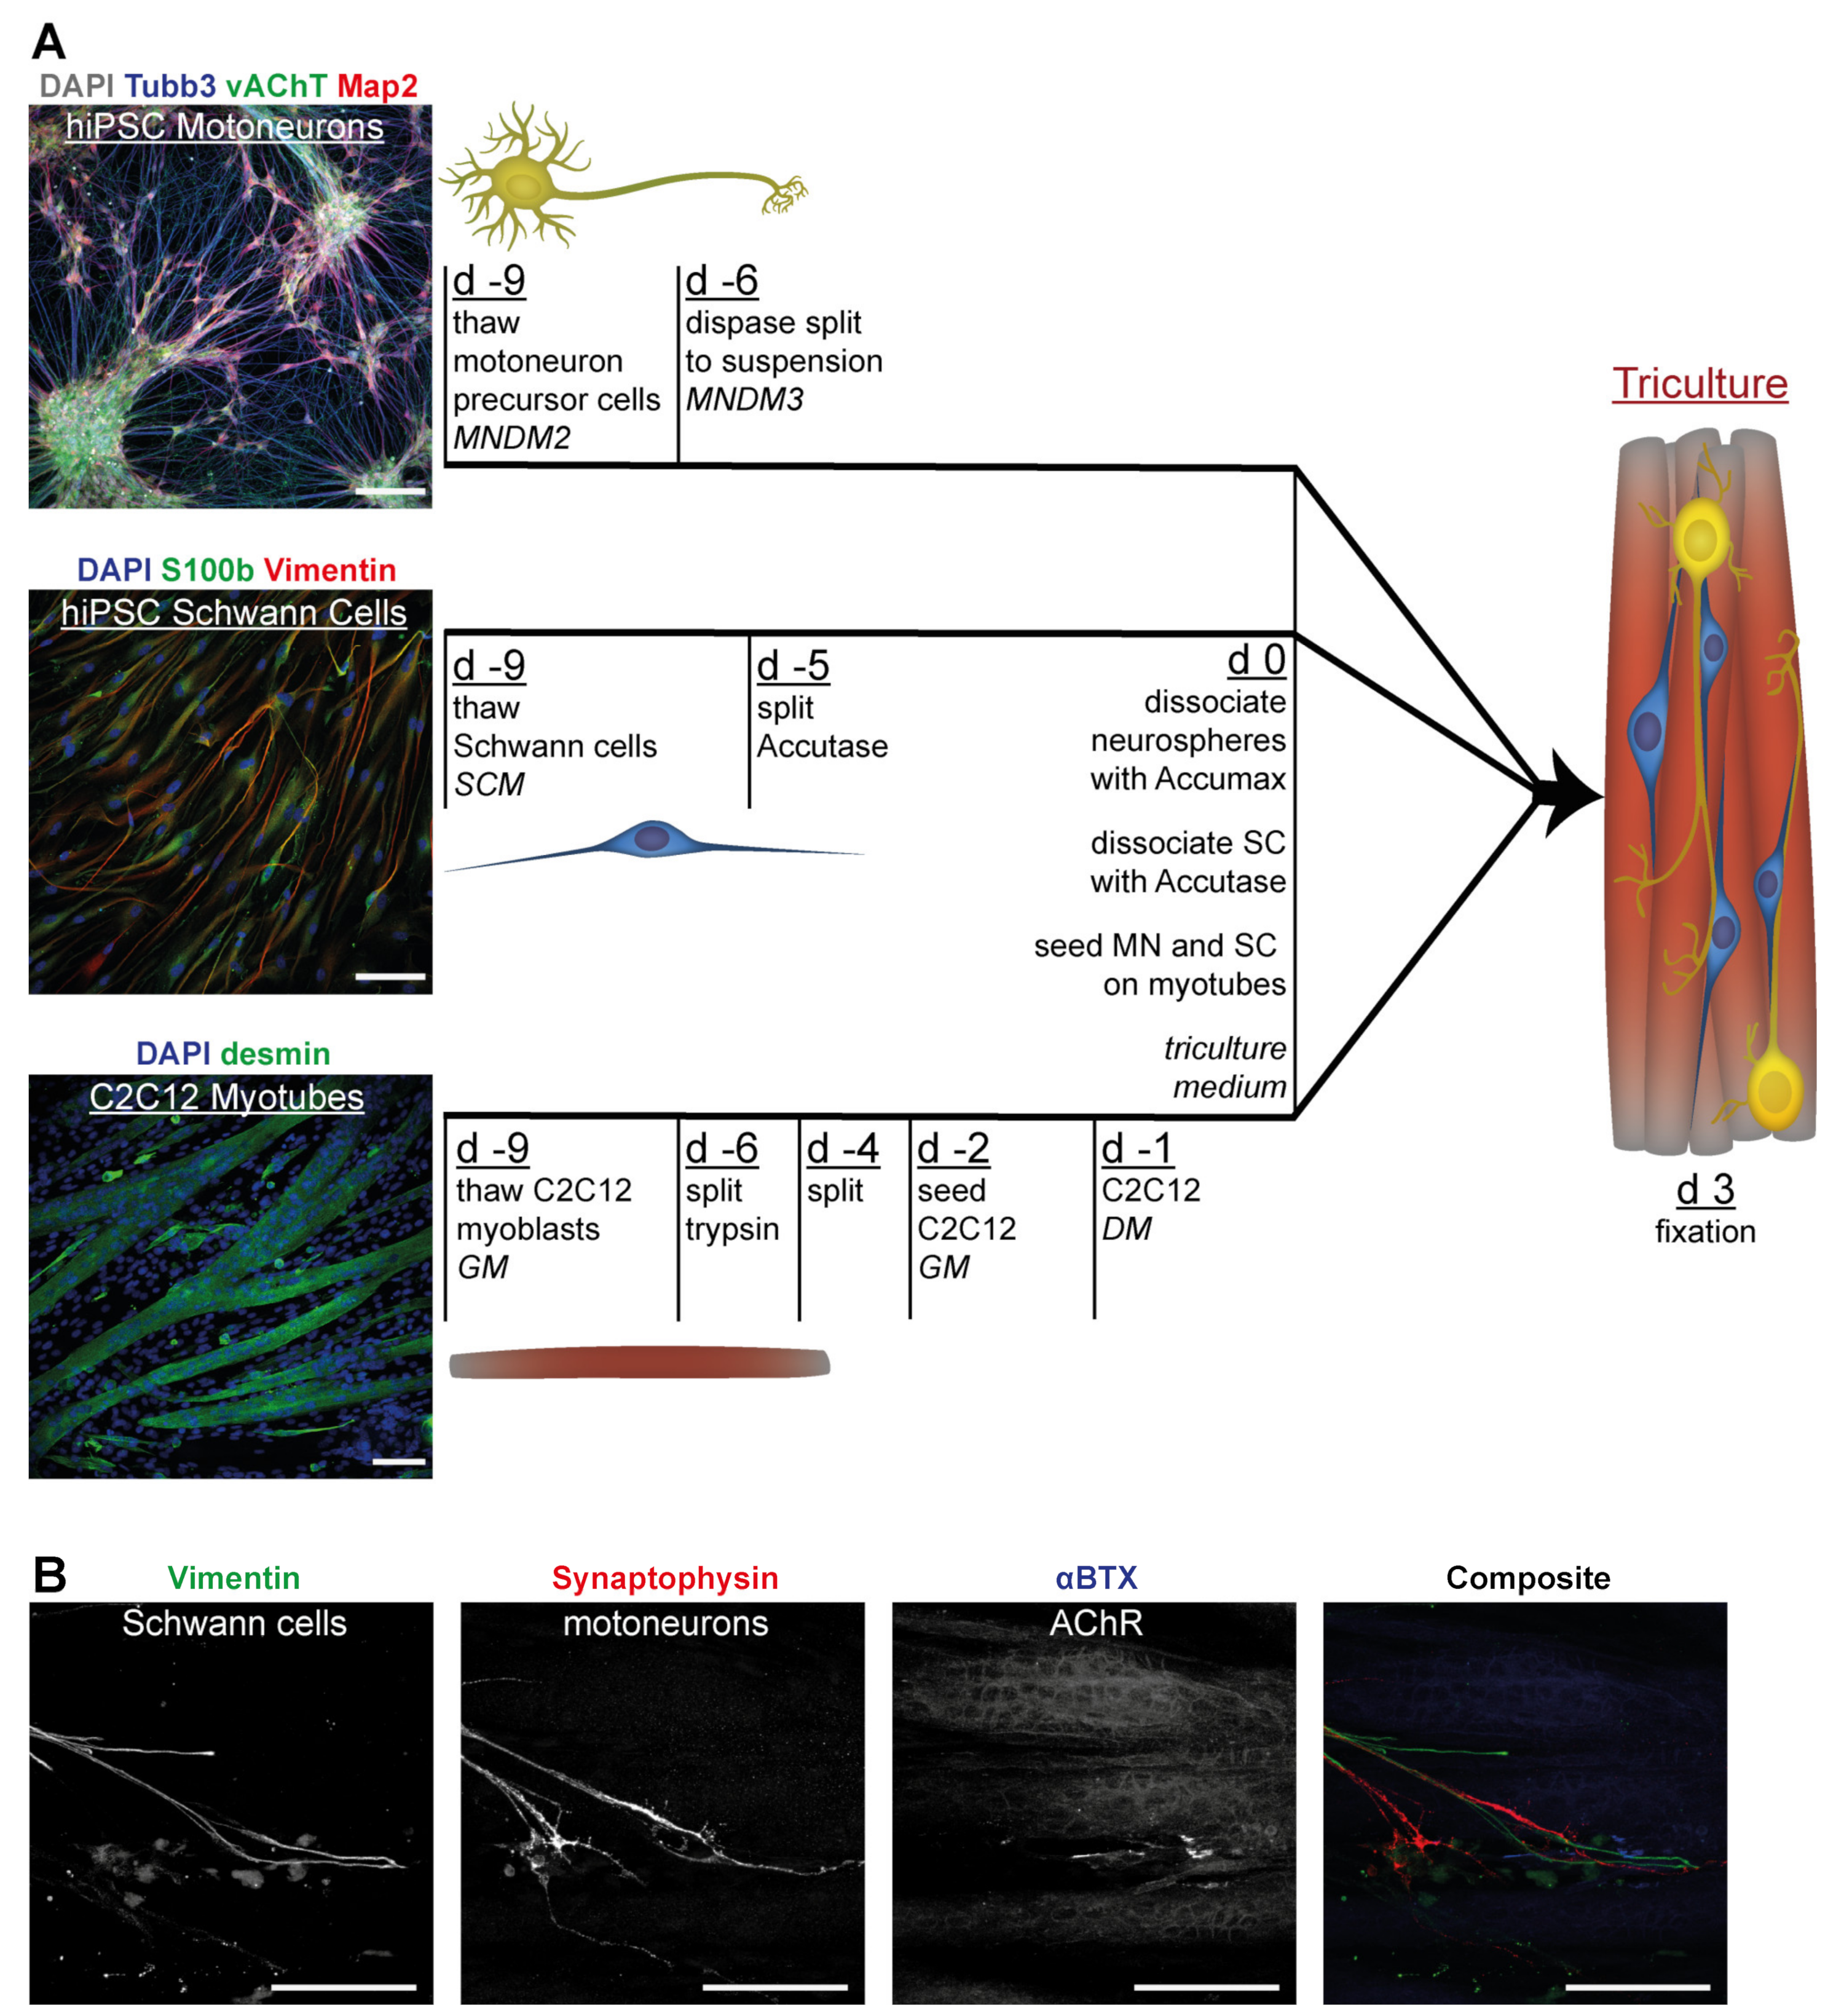
2.5. Tricultures
2.6. Immunofluorescence Staining and Microscopy
2.7. Image Segmentation and Quantitative Analysis
2.8. Statistical Analysis
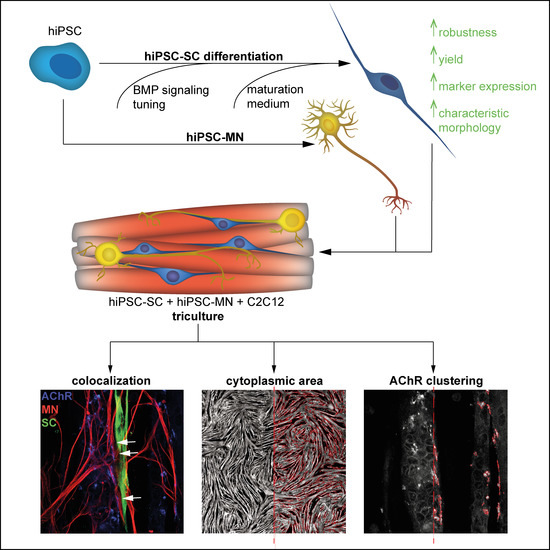
3. Results
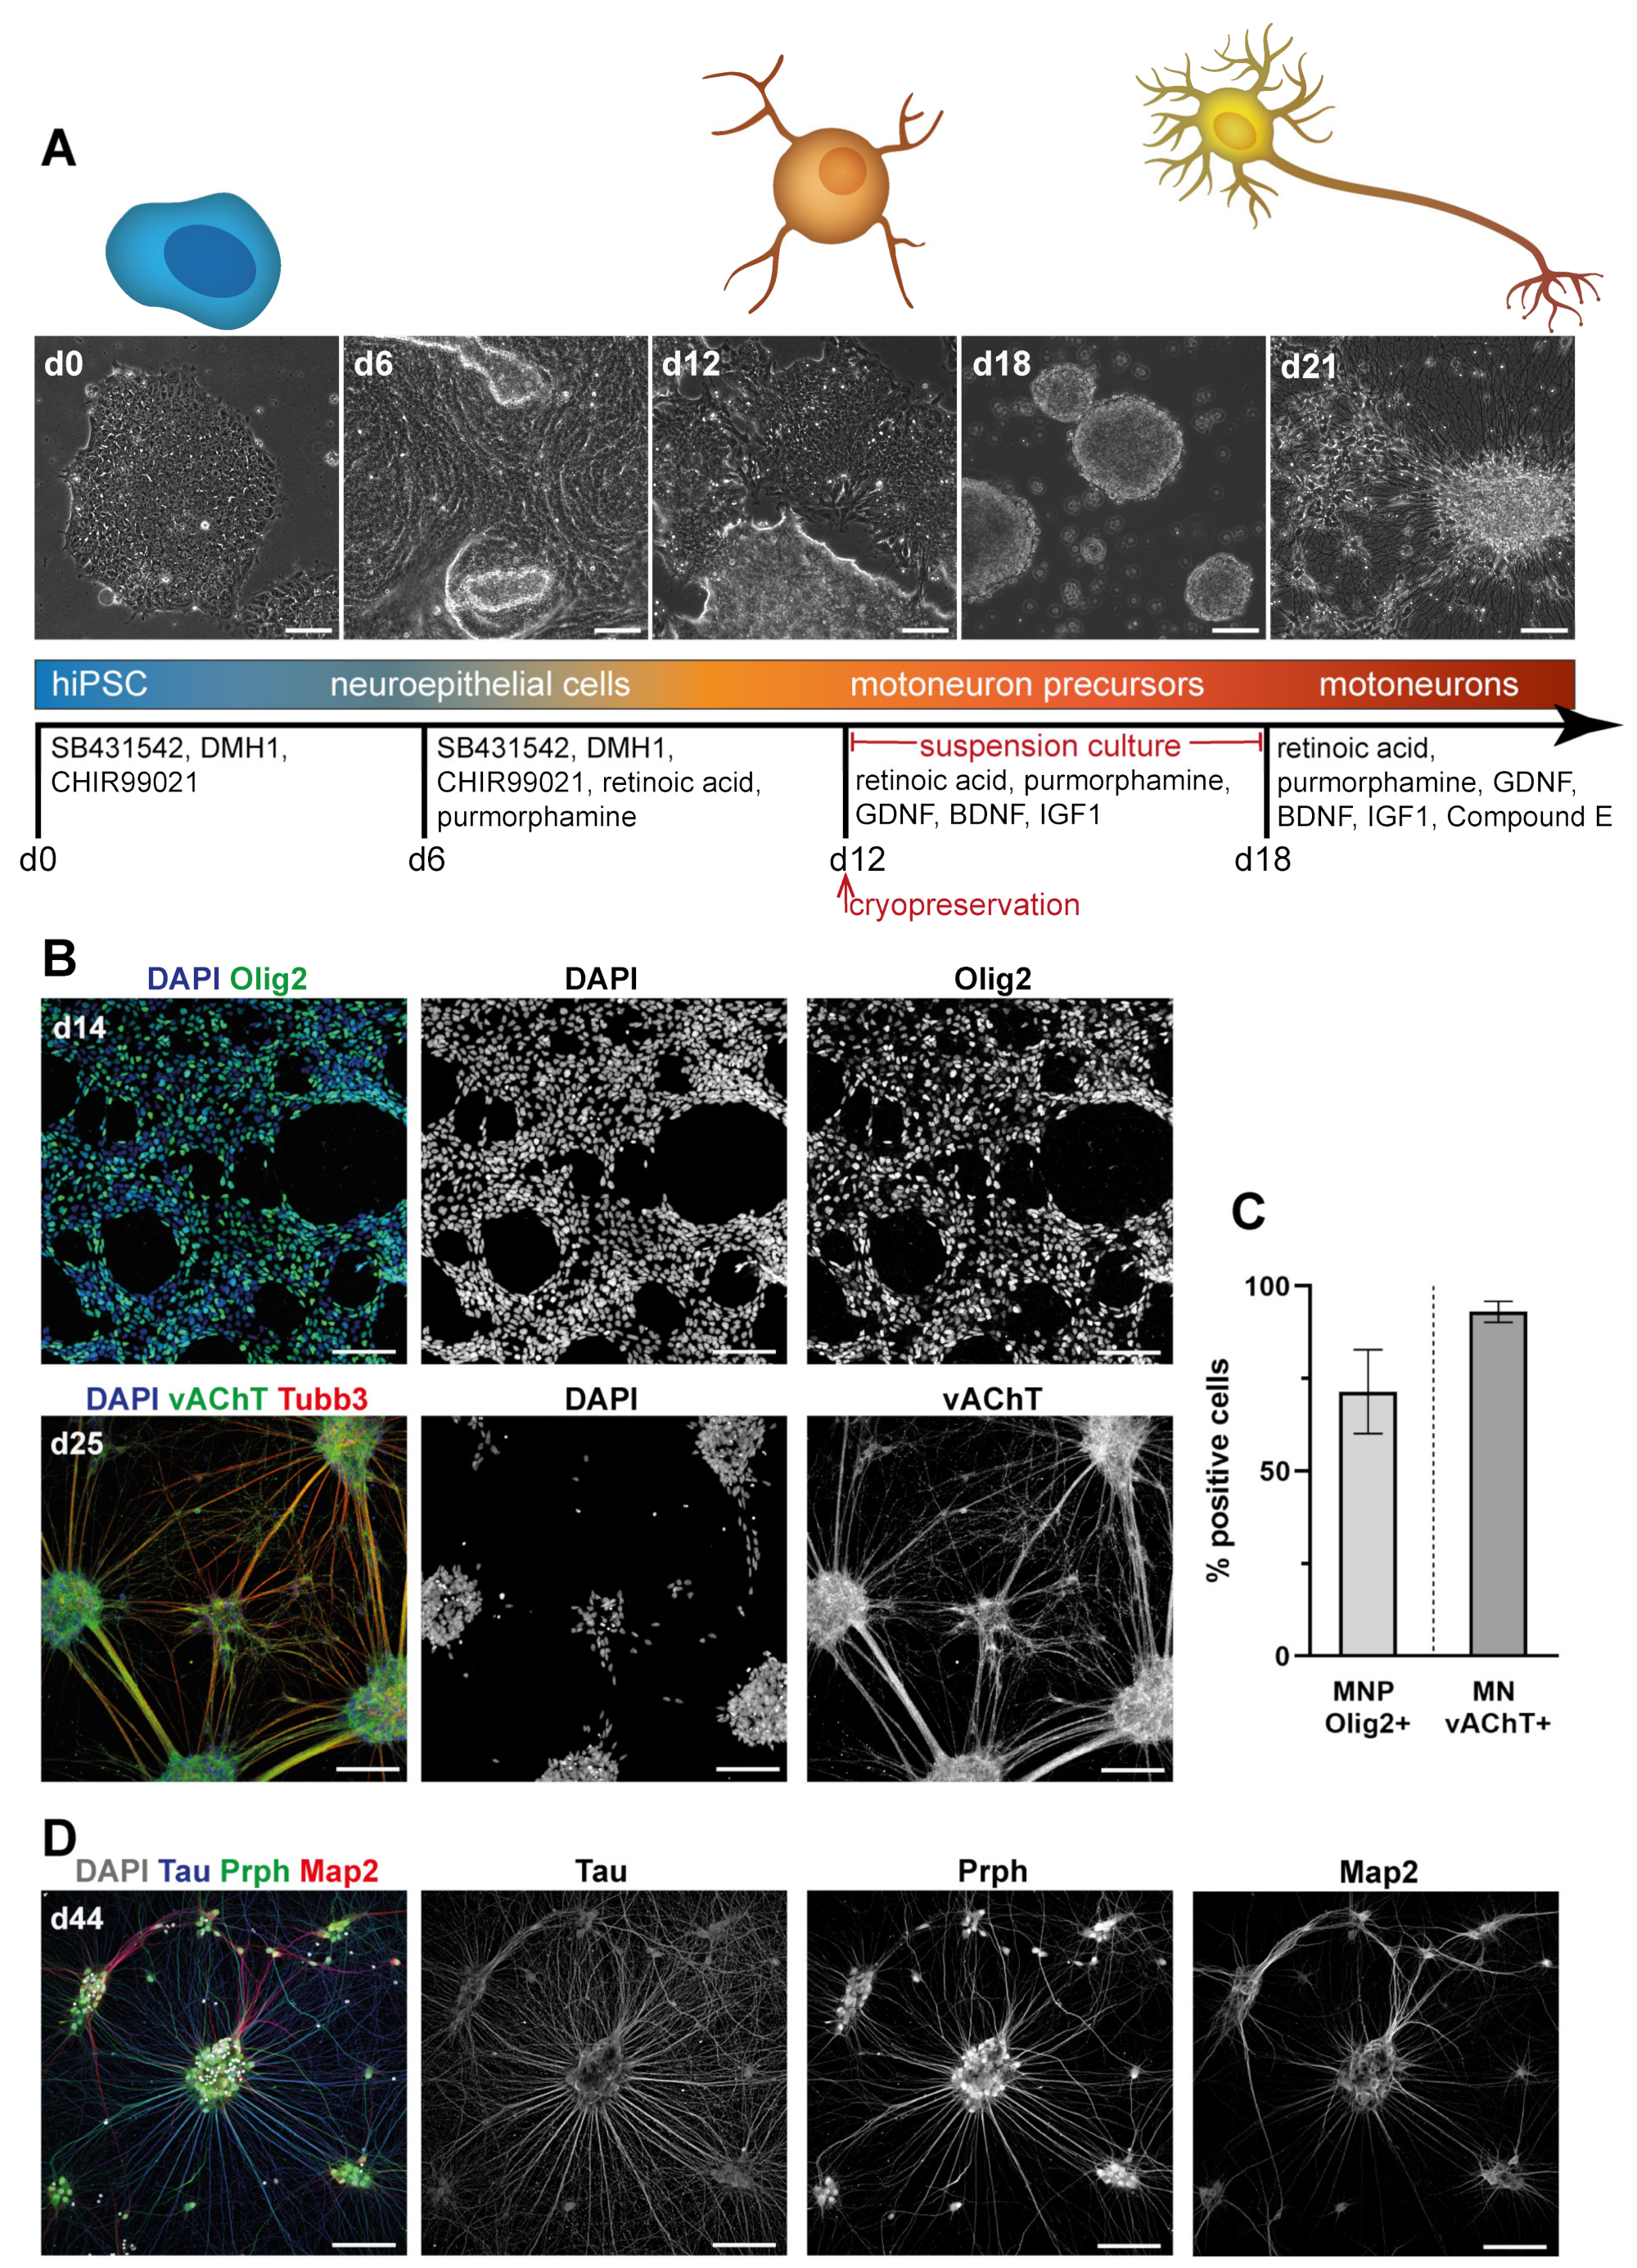
3.1. Differentiation of Motoneurons (MN) and Schwann Cells (SC) from hiPSC
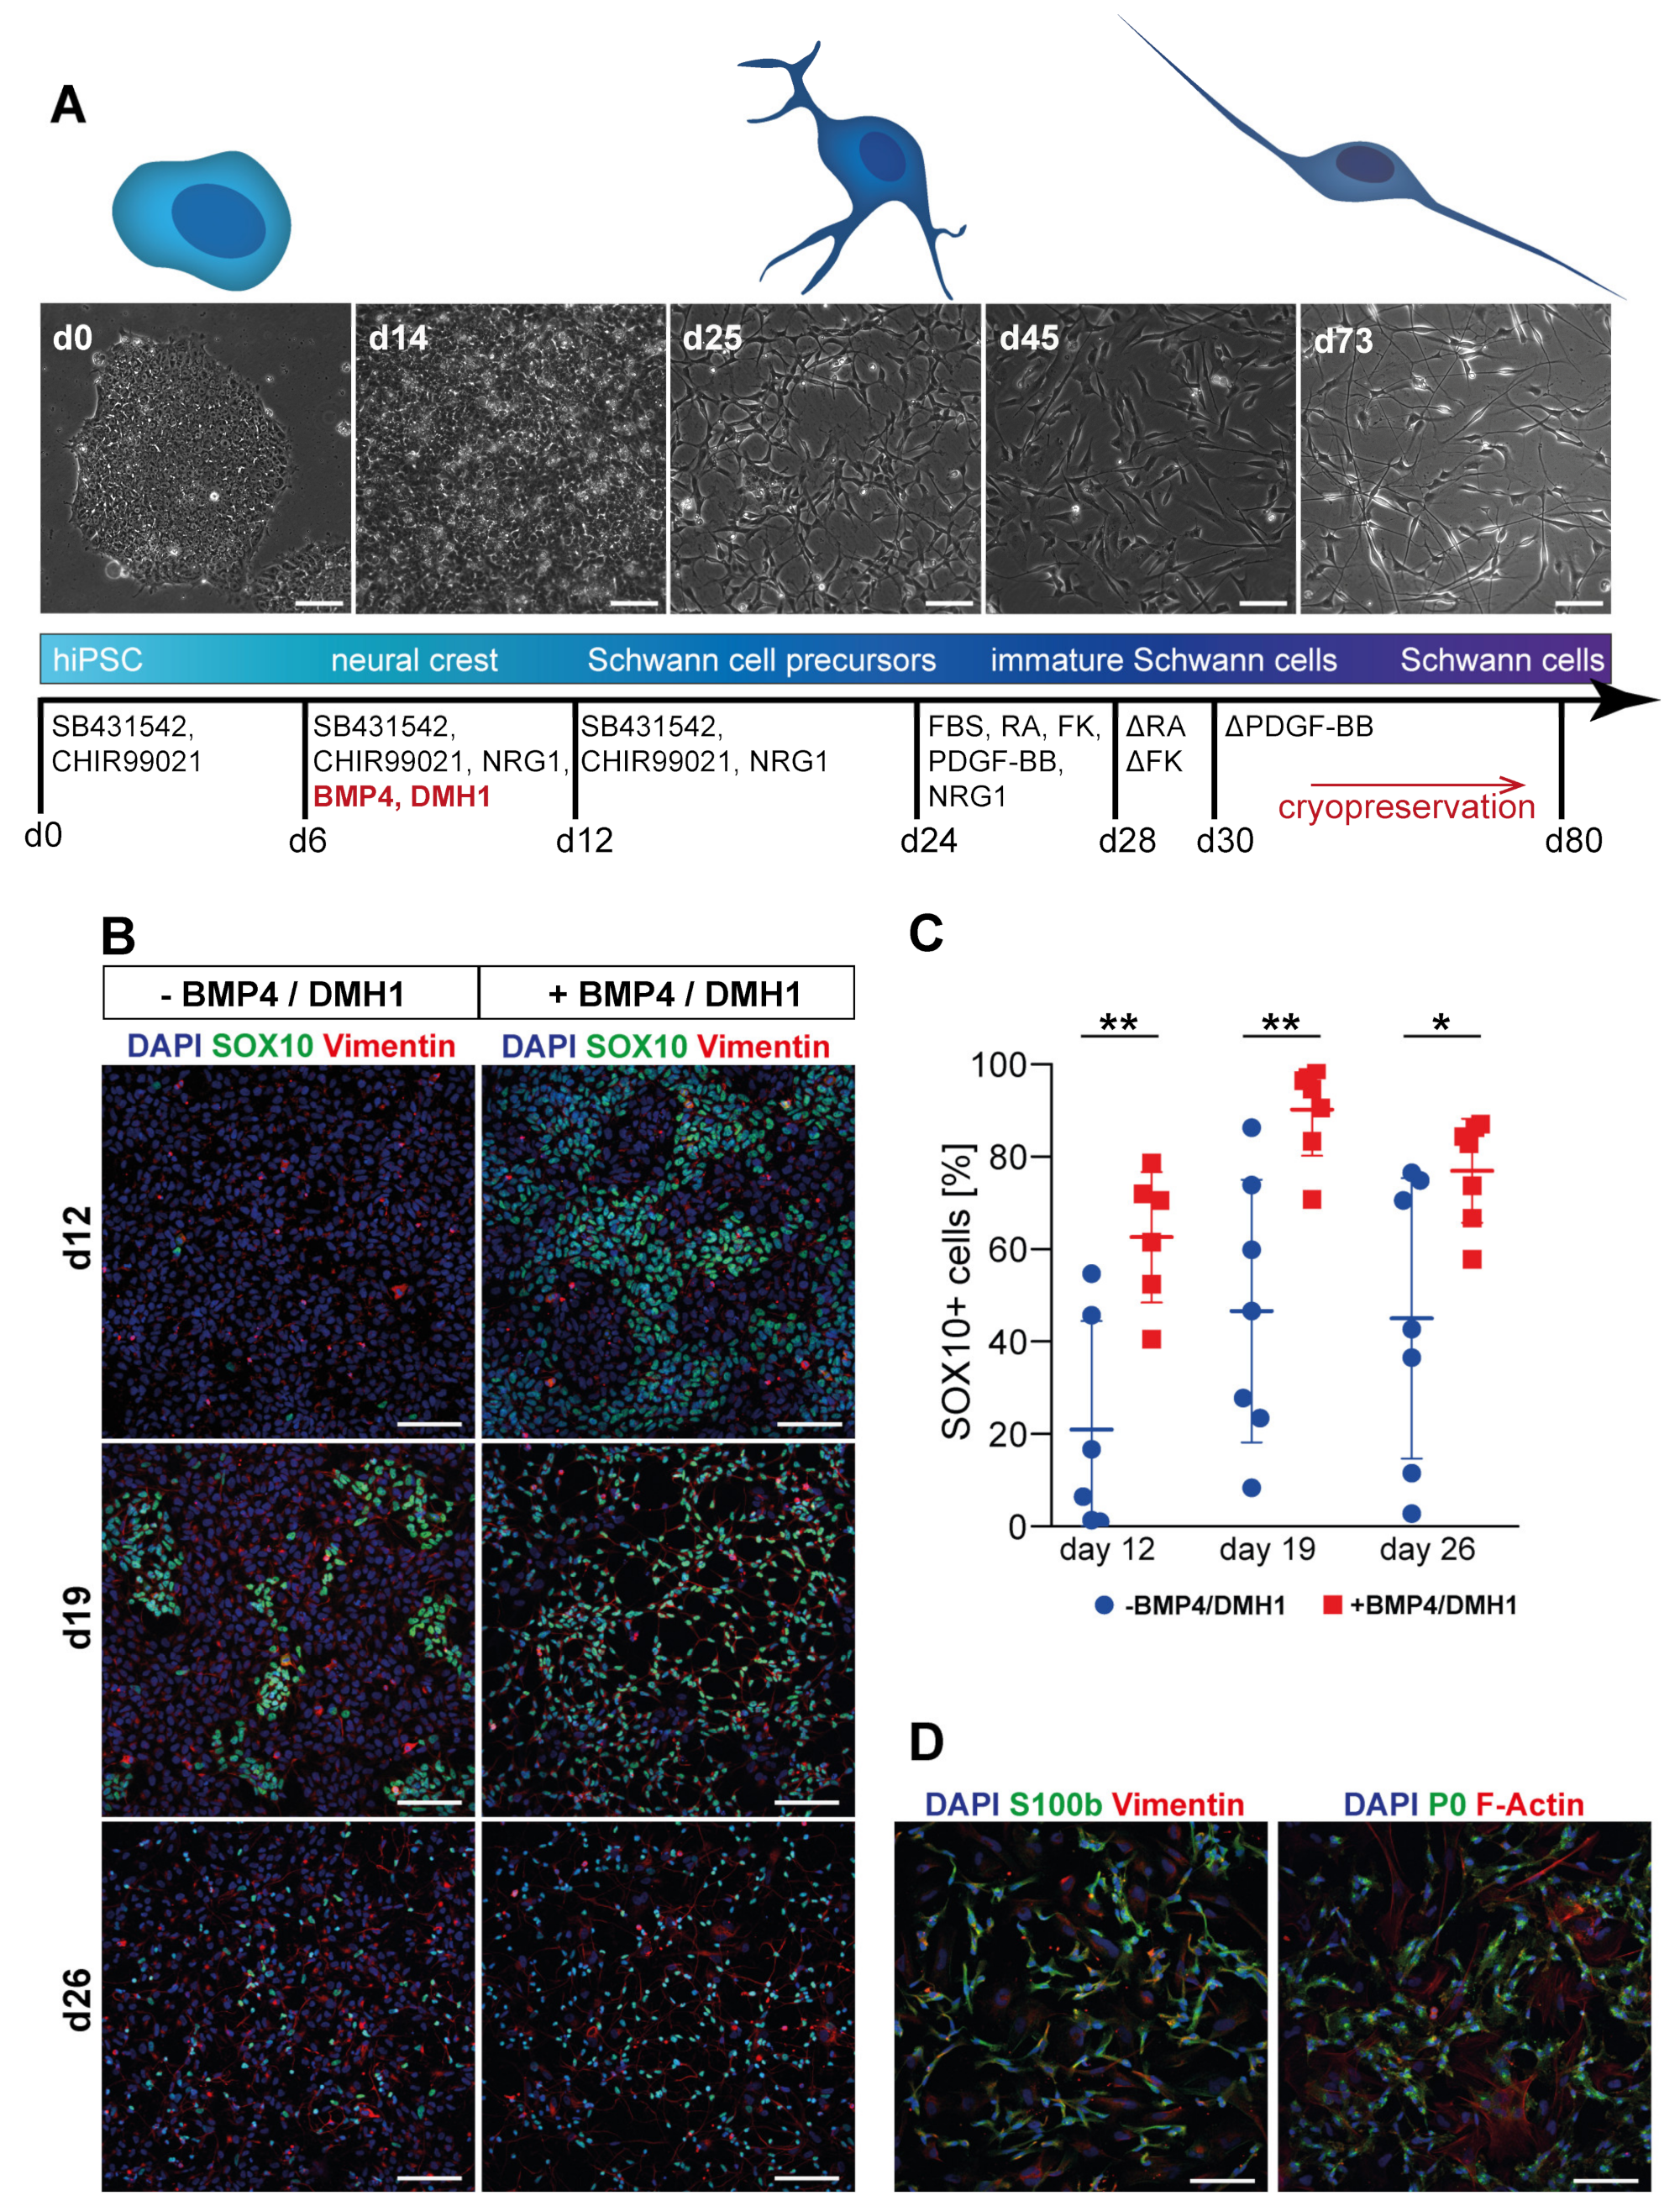
3.2. Tuning of BMP Activation Improves Robustness of Schwann Cell Differentiation
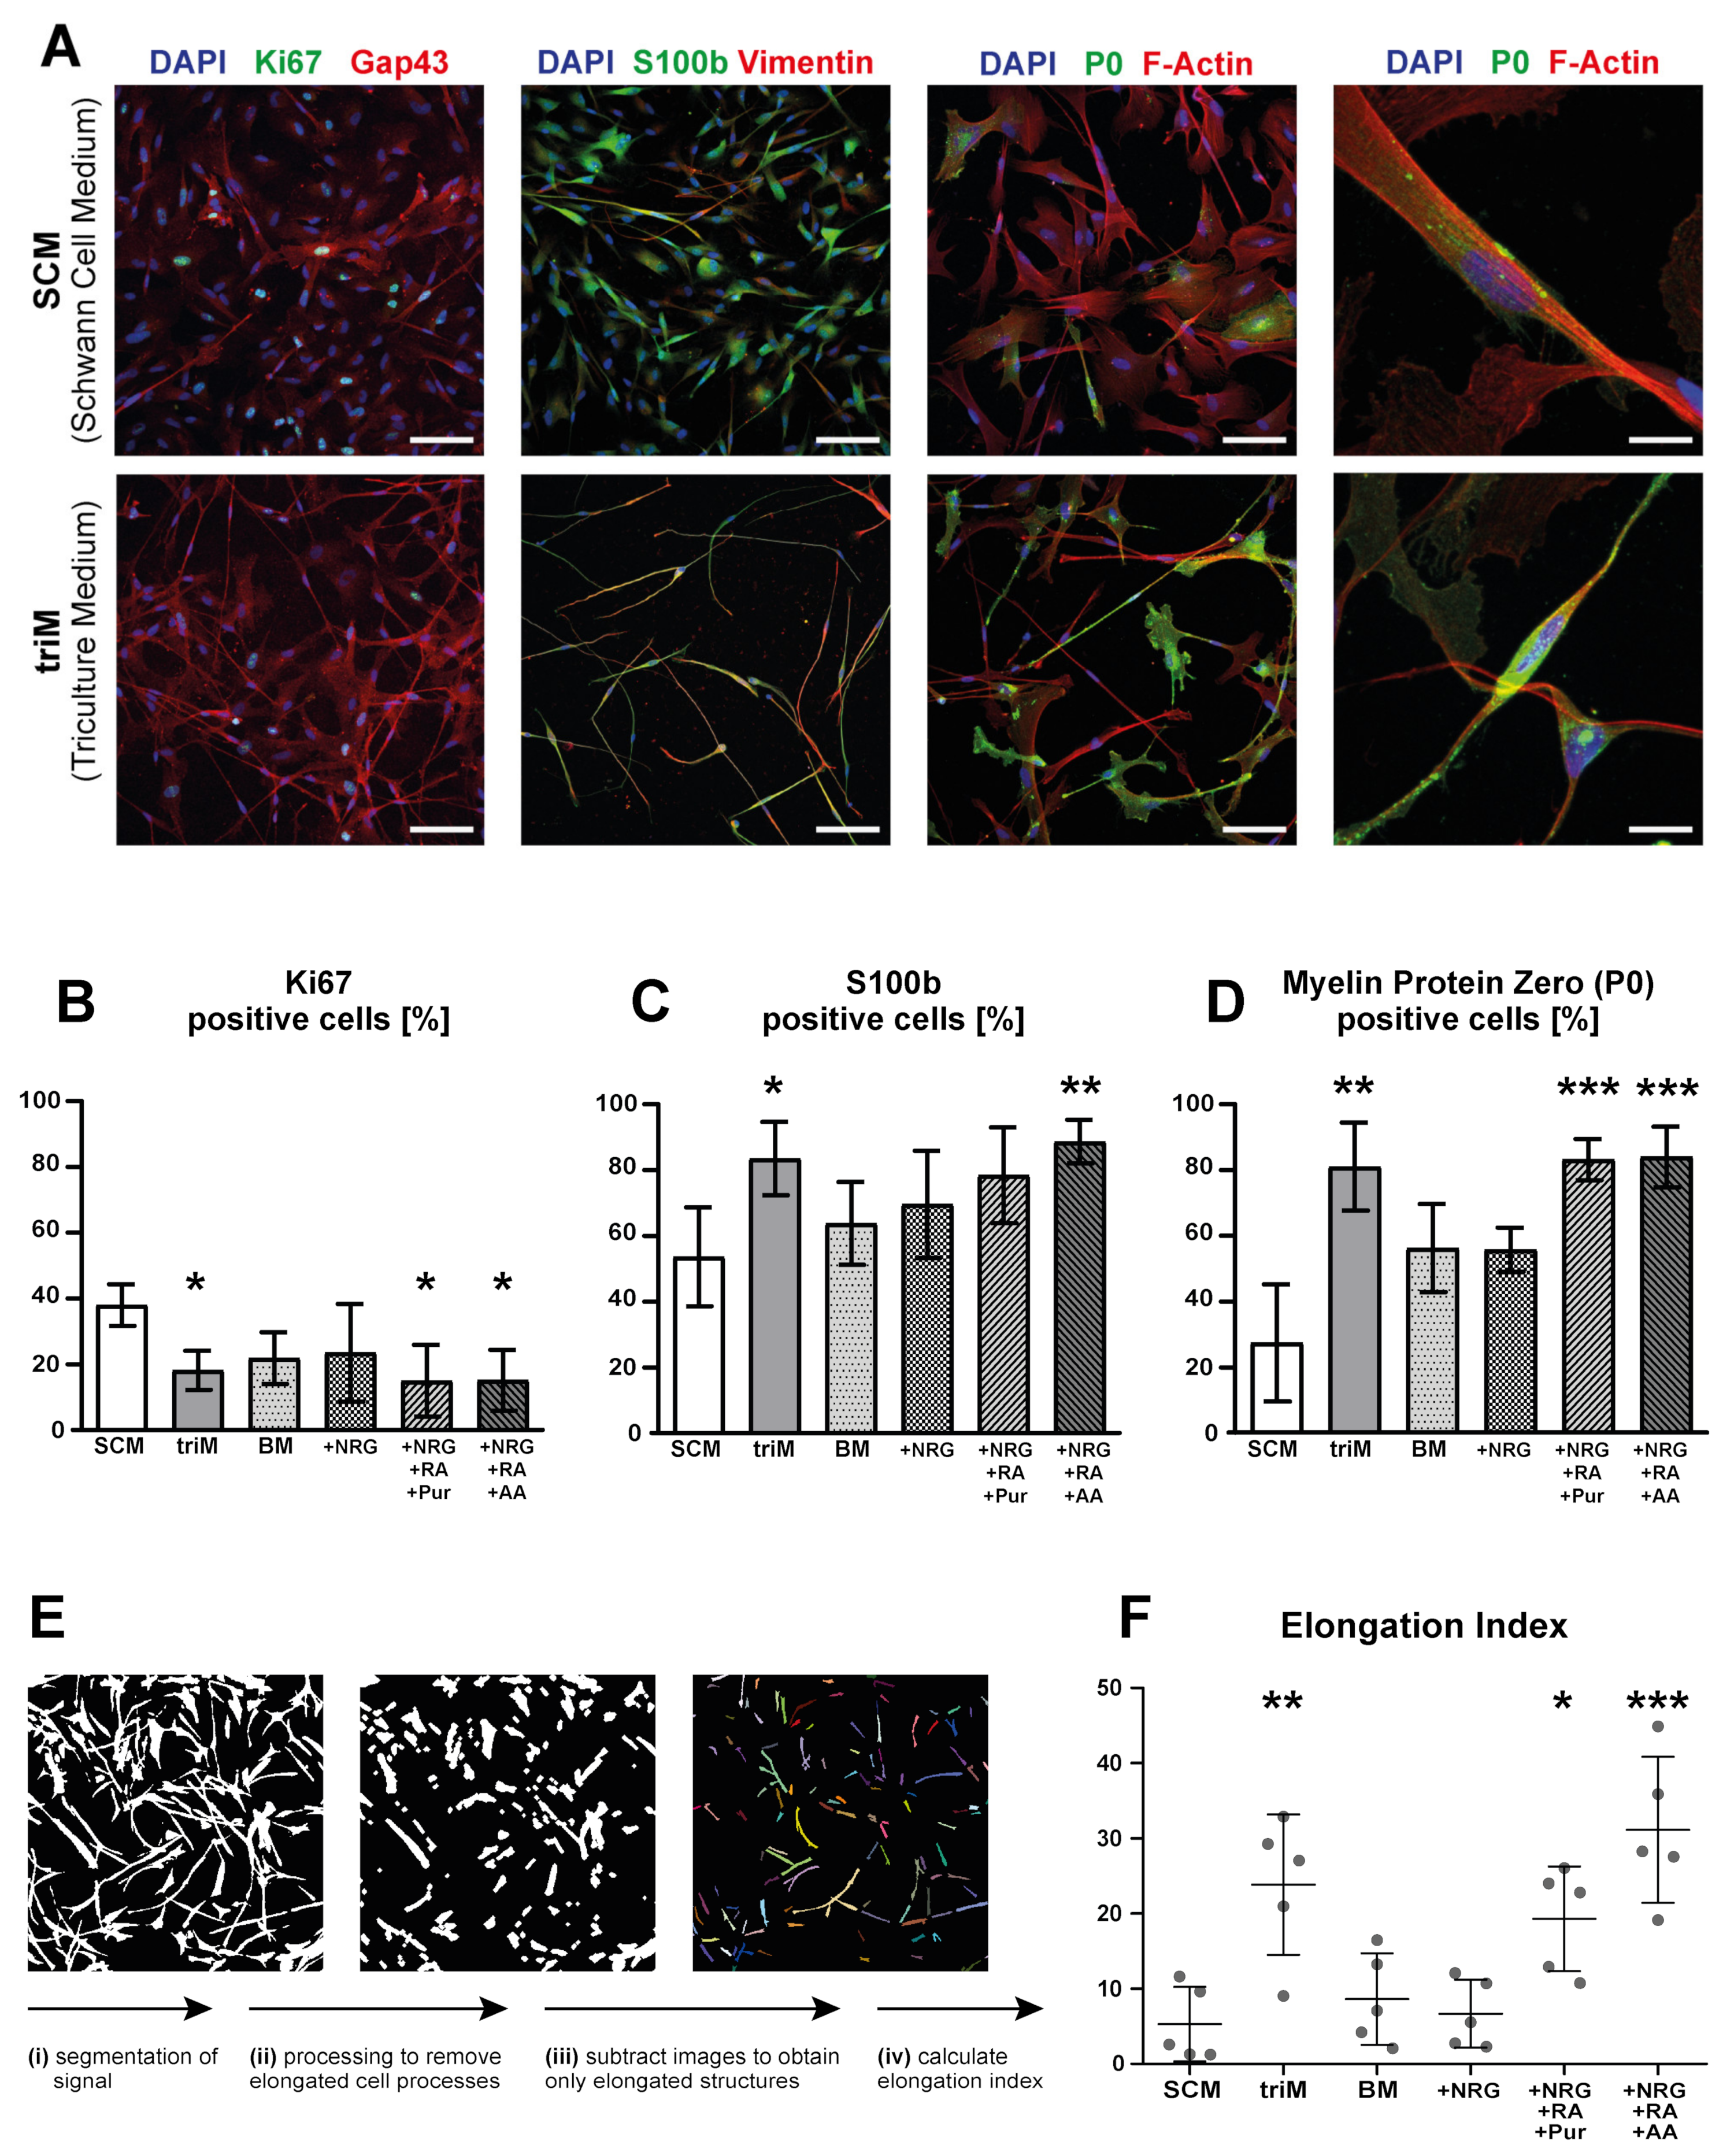
3.3. Differentiation of hiPSC-Derived Schwann Cells Is Promoted in Triculture Medium
3.4. Tricultures Including hiPSC-Derived SC Can Be Prepared from Frozen Cells in Nine Days
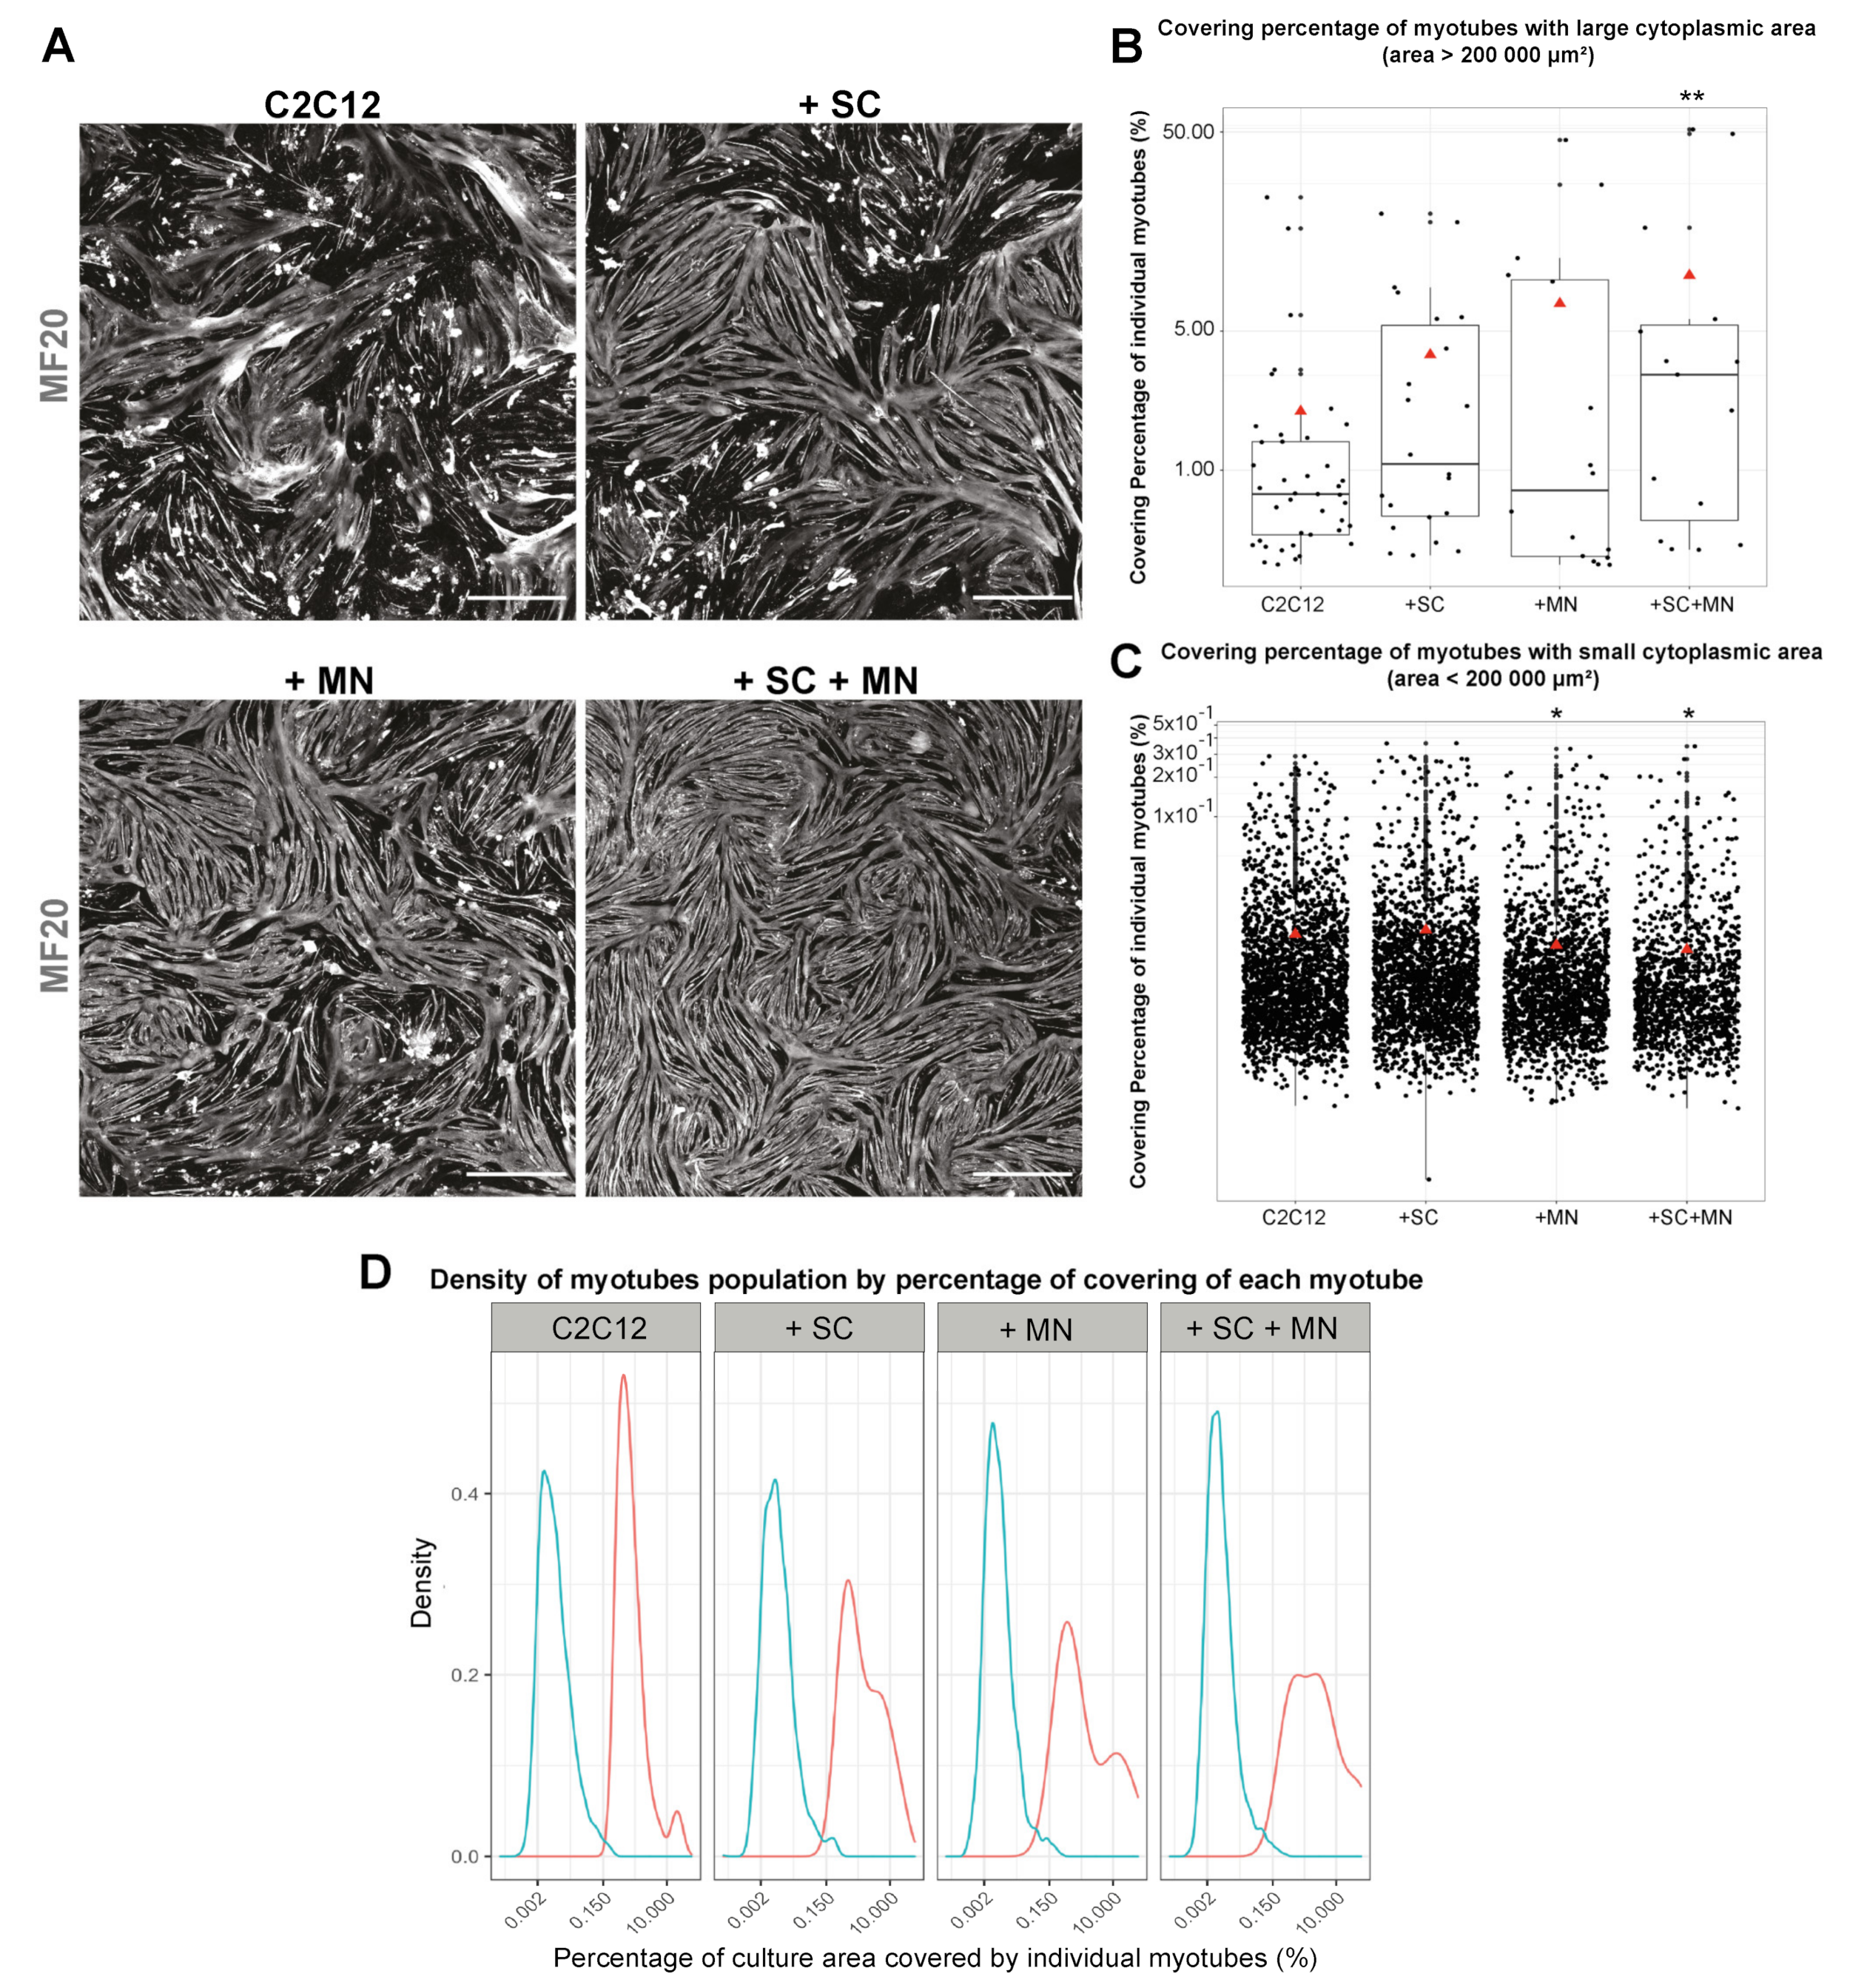
3.5. Cocultures Promote Formation of Myotubes with Increased Cytoplasmic Area
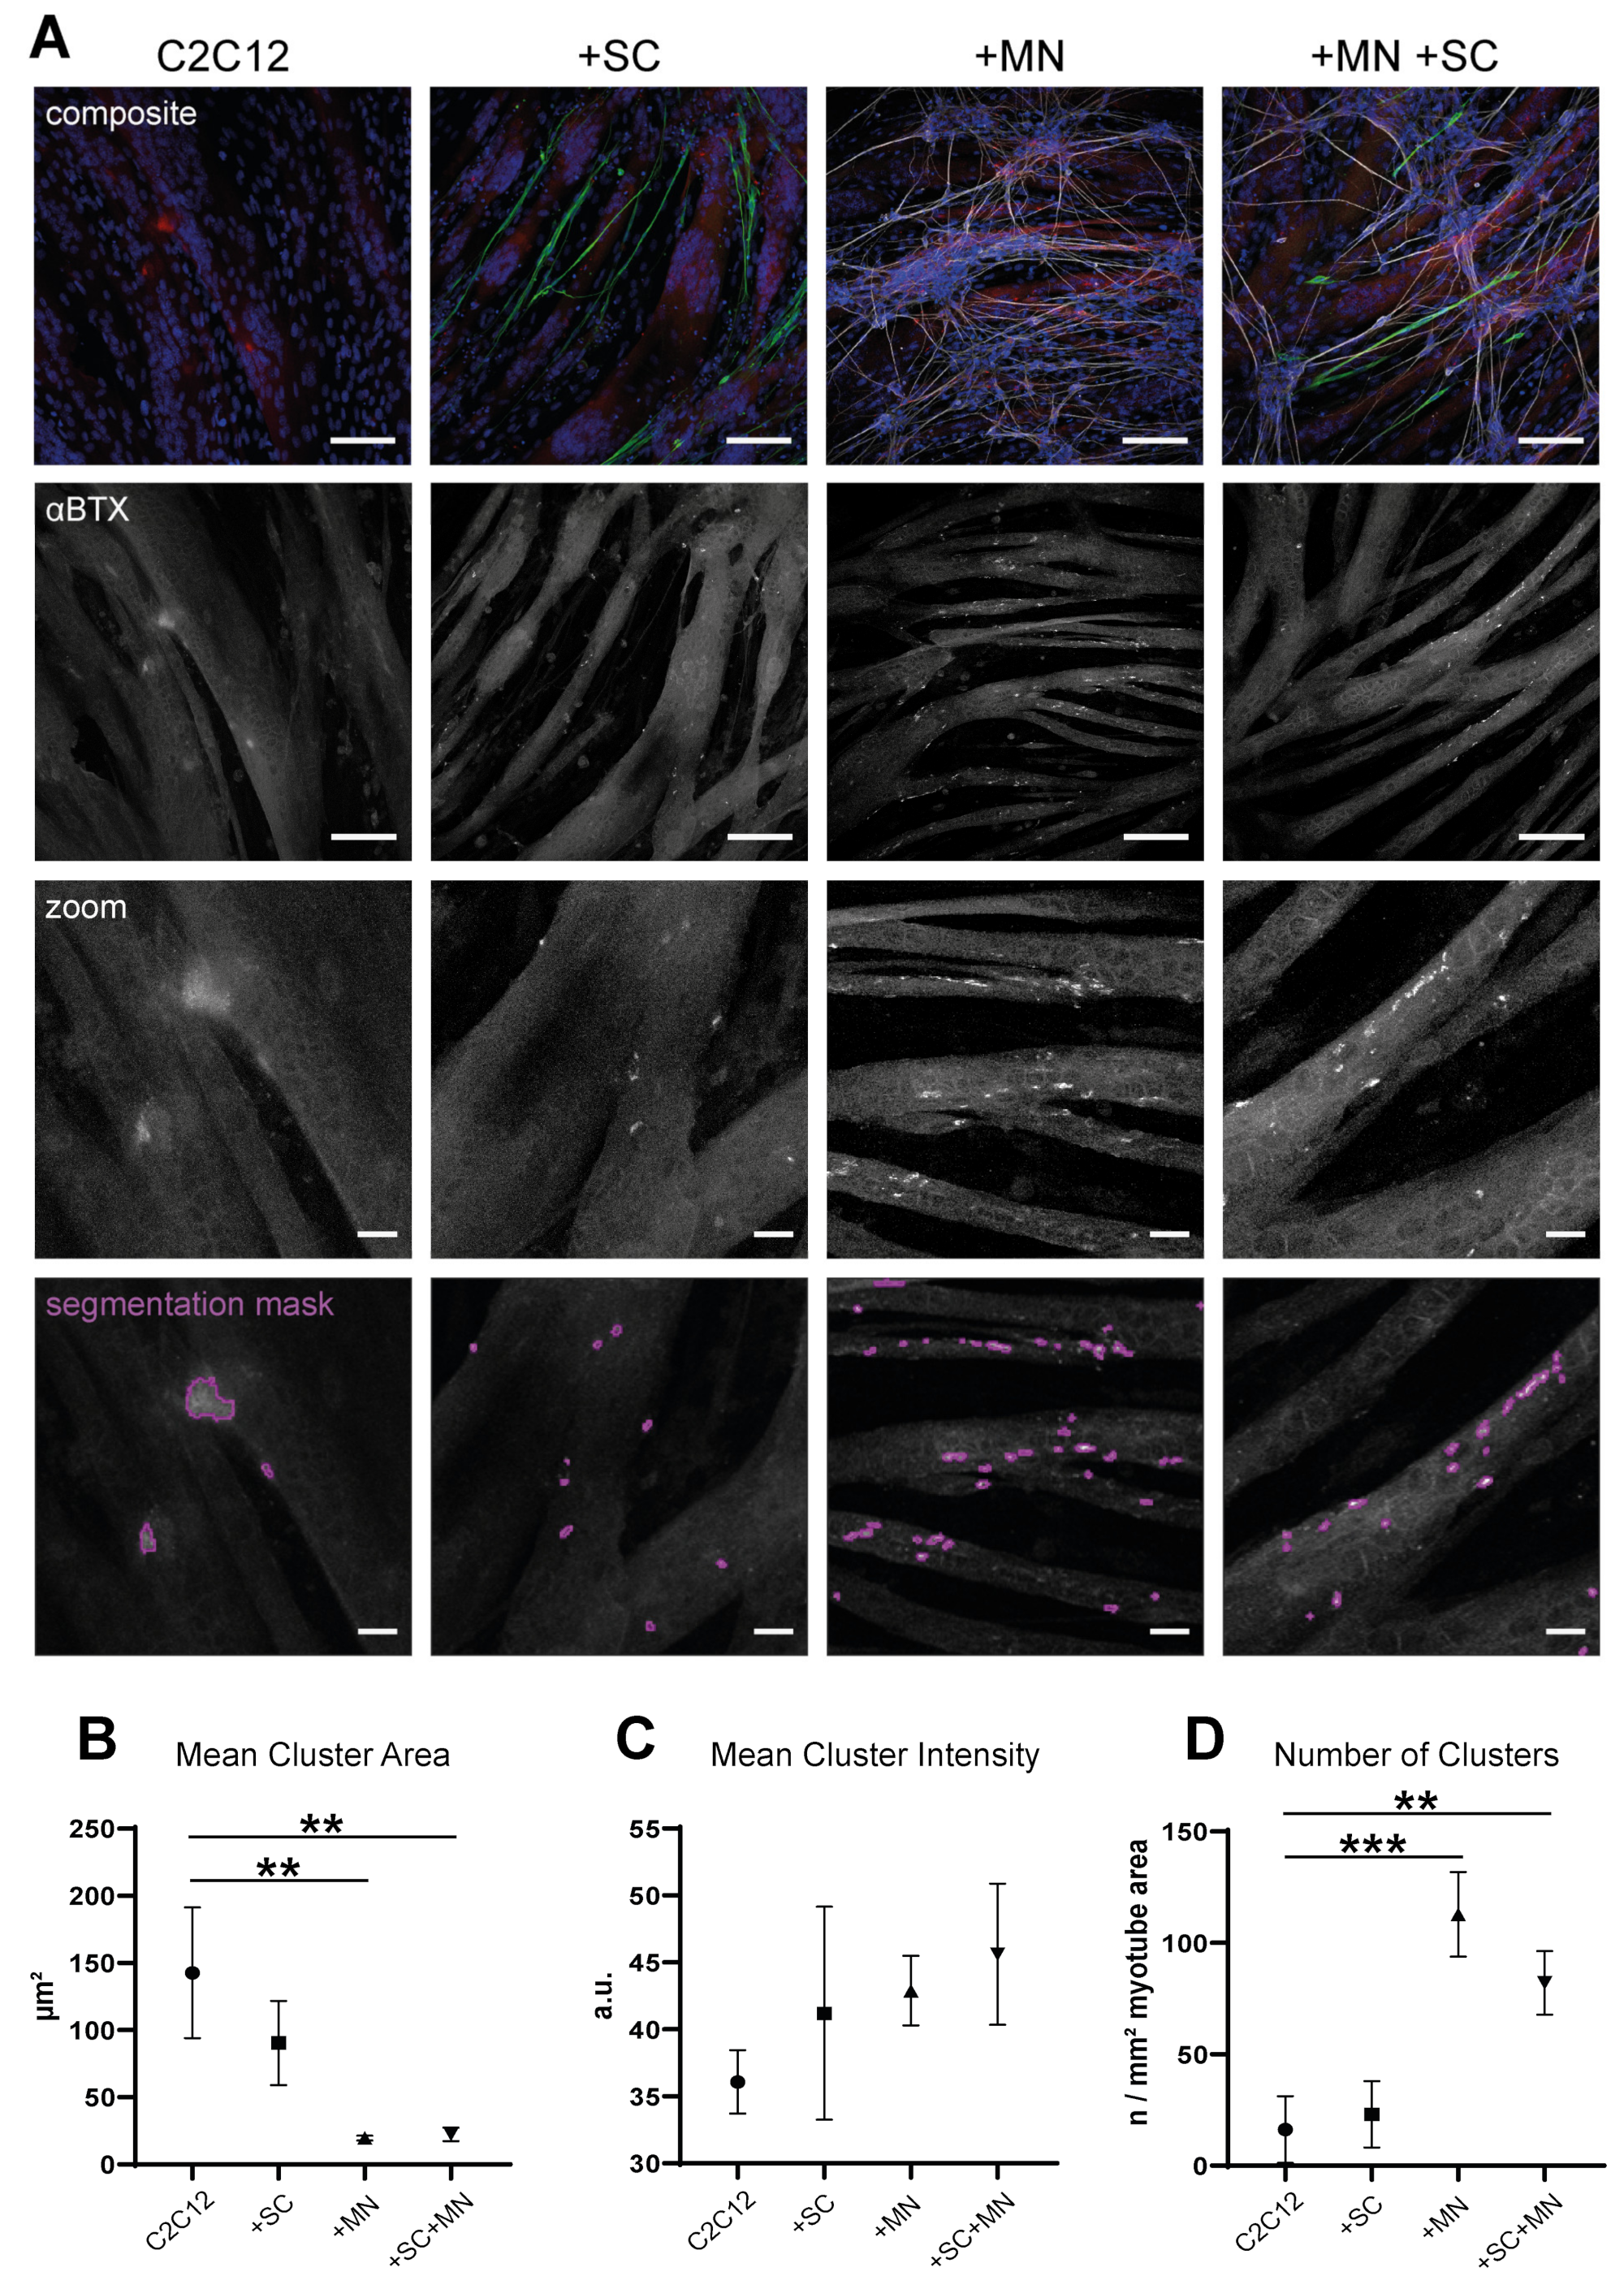
3.6. hiPSC-Derived MN and SC Influence Clustering of AChR on Myotubes In Vitro
4. Discussion
5. Conclusions
Supplementary Materials
Author Contributions
Funding
Institutional Review Board Statement
Informed Consent Statement
Data Availability Statement
Conflicts of Interest
References
- Barbeau, S.; Tahraoui-Bories, J.; Legay, C.; Martinat, C. Building neuromuscular junctions in vitro. Development 2020, 147, dev193920. [Google Scholar] [CrossRef] [PubMed]
- Natarajan, A.; Sethumadhavan, A.; Krishnan, U.M. Toward Building the Neuromuscular Junction: In Vitro Models to Study Synaptogenesis and Neurodegeneration. ACS Omega 2019, 4, 12969–12977. [Google Scholar] [CrossRef] [PubMed]
- Castellanos-Montiel, M.J.; Velasco, I.; Escobedo-Avila, I. Modeling the neuromuscular junction in vitro: An approach to study neuromuscular junction disorders. Ann. N. Y. Acad. Sci. 2020, 14388, 3–15. [Google Scholar] [CrossRef] [PubMed]
- Vila, O.F.; Qu, Y.; Vunjak-Novakovic, G. In vitro models of neuromuscular junctions and their potential for novel drug discovery and development. Expert Opin. Drug Discov. 2020, 15, 307–317. [Google Scholar] [CrossRef] [PubMed]
- Lynch, E.; Peek, E.; Reilly, M.; FitzGibbons, C.; Robertson, S.; Suzuki, M. Current Progress in the Creation, Characterization, and Application of Human Stem Cell-derived in Vitro Neuromuscular Junction Models. Stem Cell Rev. Rep. 2021. [Google Scholar] [CrossRef] [PubMed]
- Luttrell, S.M.; Smith, A.S.T.; Mack, D.L. Creating stem cell-derived neuromuscular junctions in vitro. Muscle Nerve 2021, 64, 388–403. [Google Scholar] [CrossRef]
- Darabid, H.; Perez-Gonzalez, A.P.; Robitaille, R. Neuromuscular synaptogenesis: Coordinating partners with multiple functions. Nat. Rev. Neurosci. 2014, 15, 703–718. [Google Scholar] [CrossRef] [PubMed]
- Feng, Z.; Ko, C.-P. The role of glial cells in the formation and maintenance of the neuromuscular junction. Ann. N. Y. Acad. Sci. 2008, 1132, 19–28. [Google Scholar] [CrossRef]
- Reddy, L.V.; Koirala, S.; Sugiura, Y.; Herrera, A.A.; Ko, C.P. Glial cells maintain synaptic structure and function and promote development of the neuromuscular junction in vivo. Neuron 2003, 40, 563–580. [Google Scholar] [CrossRef]
- Darabid, H.; St-Pierre-See, A.; Robitaille, R. Purinergic-Dependent Glial Regulation of Synaptic Plasticity of Competing Terminals and Synapse Elimination at the Neuromuscular Junction. Cell Rep. 2018, 25, 2070–2082.e6. [Google Scholar] [CrossRef]
- Barik, A.; Li, L.; Sathyamurthy, A.; Xiong, W.-C.; Mei, L. Schwann Cells in Neuromuscular Junction Formation and Maintenance. J. Neurosci. Off. J. Soc. Neurosci. 2016, 36, 9770–9781. [Google Scholar] [CrossRef] [PubMed]
- Darabid, H.; Arbour, D.; Robitaille, R. Glial cells decipher synaptic competition at the mammalian neuromuscular junction. J. Neurosci. Off. J. Soc. Neurosci. 2013, 33, 1297–1313. [Google Scholar] [CrossRef]
- Alvarez-Suarez, P.; Gawor, M.; Prószyński, T.J. Perisynaptic schwann cells—The multitasking cells at the developing neuromuscular junctions. Semin. Cell Dev. Biol. 2020, 104, 31–38. [Google Scholar] [CrossRef]
- Ko, C.-P.; Robitaille, R. Perisynaptic Schwann Cells at the Neuromuscular Synapse: Adaptable, Multitasking Glial Cells. Cold Spring Harb. Perspect. Biol. 2015, 7, a020503. [Google Scholar] [CrossRef] [PubMed]
- Singh, T.; Vazquez, M. Time-Dependent Addition of Neuronal and Schwann Cells Increase Myotube Viability and Length in an In Vitro Tri-culture Model of the Neuromuscular Junction. Regen. Eng. Transl. Med. 2019, 22, 389. [Google Scholar] [CrossRef]
- Vilmont, V.; Cadot, B.; Ouanounou, G.; Gomes, E.R. A system for studying mechanisms of neuromuscular junction development and maintenance. Development 2016, 143, 2464–2477. [Google Scholar] [CrossRef] [PubMed]
- Mars, T.; Yu, K.J.; Tang, X.M.; Miranda, A.F.; Grubic, Z.; Cambi, F.; King, M.P. Differentiation of glial cells and motor neurons during the formation of neuromuscular junctions in cocultures of rat spinal cord explant and human muscle. J. Comp. Neurol. 2001, 438, 239–251. [Google Scholar] [CrossRef] [PubMed]
- Southam, K.A.; King, A.E.; Blizzard, C.A.; McCormack, G.H.; Dickson, T.C. Microfluidic primary culture model of the lower motor neuron-neuromuscular junction circuit. J. Neurosci. Methods 2013, 218, 164–169. [Google Scholar] [CrossRef] [PubMed]
- Faustino Martins, J.-M.; Fischer, C.; Urzi, A.; Vidal, R.; Kunz, S.; Ruffault, P.-L.; Kabuss, L.; Hube, I.; Gazzerro, E.; Birchmeier, C.; et al. Self-Organizing 3D Human Trunk Neuromuscular Organoids. Cell Stem Cell 2020. [Google Scholar] [CrossRef] [PubMed]
- Lin, C.-Y.; Yoshida, M.; Li, L.-T.; Ikenaka, A.; Oshima, S.; Nakagawa, K.; Sakurai, H.; Matsui, E.; Nakahata, T.; Saito, M.K. iPSC-derived functional human neuromuscular junctions model the pathophysiology of neuromuscular diseases. JCI Insight 2019, 4, e124299. [Google Scholar] [CrossRef] [PubMed]
- Huang, Z.; Powell, R.; Phillips, J.B.; Haastert-Talini, K. Perspective on Schwann Cells Derived from Induced Pluripotent Stem Cells in Peripheral Nerve Tissue Engineering. Cells 2020, 9, 2497. [Google Scholar] [CrossRef]
- Liu, Q.; Spusta, S.C.; Mi, R.; Lassiter, R.N.T.; Stark, M.R.; Höke, A.; Rao, M.S.; Zeng, X. Human Neural Crest Stem Cells Derived from Human ESCs and Induced Pluripotent Stem Cells: Induction, Maintenance, and Differentiation into Functional Schwann Cells. STEM CELLS Transl. Med. 2012, 1, 266–278. [Google Scholar] [CrossRef] [PubMed]
- Ziegler, L.; Grigoryan, S.; Yang, I.H.; Thakor, N.V.; Goldstein, R.S. Efficient Generation of Schwann Cells from Human Embryonic Stem Cell-Derived Neurospheres. Stem Cell Rev. 2011, 7, 394–403. [Google Scholar] [CrossRef]
- Kim, H.-S.; Lee, J.; Lee, D.Y.; Kim, Y.-D.; Kim, J.Y.; Lim, H.J.; Lim, S.; Cho, Y.S. Schwann Cell Precursors from Human Pluripotent Stem Cells as a Potential Therapeutic Target for Myelin Repair. Stem Cell Rep. 2017, 8, 1714–1726. [Google Scholar] [CrossRef] [PubMed]
- Chen, H.; Qian, K.; Du, Z.; Cao, J.; Petersen, A.; Liu, H.; Blackbourn, L.W.; Huang, C.-L.; Errigo, A.; Yin, Y.; et al. Modeling ALS with iPSCs Reveals that Mutant SOD1 Misregulates Neurofilament Balance in Motor Neurons. Cell Stem Cell 2014, 14, 796–809. [Google Scholar] [CrossRef]
- Du, Z.-W.; Chen, H.; Liu, H.; Lu, J.; Qian, K.; Huang, C.-L.; Zhong, X.; Fan, F.; Zhang, S.-C. Generation and expansion of highly pure motor neuron progenitors from human pluripotent stem cells. Nat. Commun. 2015, 6, 6626. [Google Scholar] [CrossRef] [PubMed]
- Scherr, T.; Streule, K.; Bartschat, A.; Böhland, M.; Stegmaier, J.; Reischl, M.; Orian-Rousseau, V.; Mikut, R. Bead Net: Deep learning-based bead detection and counting in low-resolution microscopy images. Bioinformatics 2020, 36, 4668–4670. [Google Scholar] [CrossRef]
- Stegmaier, J.; Otte, J.C.; Kobitski, A.; Bartschat, A.; Garcia, A.; Nienhaus, G.U.; Strähle, U.; Mikut, R. Fast segmentation of stained nuclei in terabyte-scale, time resolved 3D microscopy image stacks. PLoS ONE 2014, 9, e90036. [Google Scholar] [CrossRef] [PubMed]
- Bartschat, A.; Hübner, E.; Reischl, M.; Mikut, R.; Stegmaier, J. XPIWIT--an XML pipeline wrapper for the Insight Toolkit. Bioinformatics 2016, 32, 315–317. [Google Scholar] [CrossRef] [PubMed]
- Schindelin, J.; Arganda-Carreras, I.; Frise, E.; Kaynig, V.; Longair, M.; Pietzsch, T.; Preibisch, S.; Rueden, C.; Saalfeld, S.; Schmid, B.; et al. Fiji: An open-source platform for biological-image analysis. Nat. Methods 2012, 9, 676–682. [Google Scholar] [CrossRef] [PubMed]
- Wickham, H.; Francois, R.; Henry, L.; Müller, K.; dplyr: A Grammar of Data Manipulation. R package version 1.0.6. 2021. Available online: https://dplyr.tidyverse.org (accessed on 21 November 2021).
- Wickham, H. ggplot2: Elegant Graphics for Data Analysis. Springer-Verlag New York. 2016. Available online: https://ggplot2.tidyverse.org (accessed on 21 November 2021).
- Wickham, H.; Seidel, D. Scales: Scale Functions for Visualization, R package version 1.1.1; 2020. Available online: https://scales.r-lib.org (accessed on 21 November 2021).
- Bates, D.; Mächler, M.; Bolker, B.; Walker, S. Fitting Linear Mixed-Effects Models Using lme4. J. Stat. Soft. 2015, 67, 1–48. [Google Scholar] [CrossRef]
- Yi, H.; Xie, B.; Liu, B.; Wang, X.; Xu, L.; Liu, J.; Li, M.; Zhong, X.; Peng, F. Derivation and Identification of Motor Neurons from Human Urine-Derived Induced Pluripotent Stem Cells. Stem Cells Int. 2018, 2018, 3628578. [Google Scholar] [CrossRef] [PubMed]
- Hackland, J.O.S.; Frith, T.J.R.; Thompson, O.; Marin Navarro, A.; Garcia-Castro, M.I.; Unger, C.; Andrews, P.W. Top-Down Inhibition of BMP Signaling Enables Robust Induction of hPSCs Into Neural Crest in Fully Defined, Xeno-free Conditions. Stem Cell Rep. 2017, 9, 1043–1052. [Google Scholar] [CrossRef] [PubMed]
- Chal, J.; Al Tanoury, Z.; Hestin, M.; Gobert, B.; Aivio, S.; Hick, A.; Cherrier, T.; Nesmith, A.P.; Parker, K.K.; Pourquié, O. Generation of human muscle fibers and satellite-like cells from human pluripotent stem cells in vitro. Nat. Protoc. 2016, 11, 1833–1850. [Google Scholar] [CrossRef] [PubMed]
- Xing, G.; Xiong, W.-C.; Mei, L. Rapsyn as a signaling and scaffolding molecule in neuromuscular junction formation and maintenance. Neurosci. Lett. 2020, 731, 135013. [Google Scholar] [CrossRef] [PubMed]
- Koirala, S.; Reddy, L.V.; Ko, C.-P. Roles of glial cells in the formation, function, and maintenance of the neuromuscular junction. J. Neurocytol. 2003, 32, 987–1002. [Google Scholar] [CrossRef] [PubMed]
- Petrov, K.A.; Girard, E.; Nikitashina, A.D.; Colasante, C.; Bernard, V.; Nurullin, L.; Leroy, J.; Samigullin, D.; Colak, O.; Nikolsky, E.; et al. Schwann cells sense and control acetylcholine spillover at the neuromuscular junction by α7 nicotinic receptors and butyrylcholinesterase. J. Neurosci. Off. J. Soc. Neurosci. 2014, 34, 11870–11883. [Google Scholar] [CrossRef] [PubMed]
- Griffin, J.W.; Thompson, W.J. Biology and pathology of nonmyelinating Schwann cells. Glia 2008, 56, 1518–1531. [Google Scholar] [CrossRef]
- Negro, S.; Lessi, F.; Duregotti, E.; Aretini, P.; La Ferla, M.; Franceschi, S.; Menicagli, M.; Bergamin, E.; Radice, E.; Thelen, M.; et al. CXCL12α/SDF-1 from perisynaptic Schwann cells promotes regeneration of injured motor axon terminals. EMBO Mol. Med. 2017, 9, 1000–1010. [Google Scholar] [CrossRef] [PubMed]
- Duregotti, E.; Negro, S.; Scorzeto, M.; Zornetta, I.; Dickinson, B.C.; Chang, C.J.; Montecucco, C.; Rigoni, M. Mitochondrial alarmins released by degenerating motor axon terminals activate perisynaptic Schwann cells. Proc. Natl. Acad. Sci. USA 2015, 112, E497–E505. [Google Scholar] [CrossRef] [PubMed]
- Kang, H.; Tian, L.; Mikesh, M.; Lichtman, J.W.; Thompson, W.J. Terminal Schwann cells participate in neuromuscular synapse remodeling during reinnervation following nerve injury. J. Neurosci. 2014, 34, 6323–6333. [Google Scholar] [CrossRef]
- Legay, C.; Mei, L. Moving forward with the neuromuscular junction. J. Neurochem. 2017, 142, 59–63. [Google Scholar] [CrossRef] [PubMed]
- Jones, R.A.; Harrison, C.; Eaton, S.L.; Llavero Hurtado, M.; Graham, L.C.; Alkhammash, L.; Oladiran, O.A.; Gale, A.; Lamont, D.J.; Simpson, H.; et al. Cellular and Molecular Anatomy of the Human Neuromuscular Junction. Cell Rep. 2017, 21, 2348–2356. [Google Scholar] [CrossRef]
- Alhindi, A.; Boehm, I.; Forsythe, R.O.; Miller, J.; Skipworth, R.J.E.; Simpson, H.; Jones, R.A.; Gillingwater, T.H. Terminal Schwann cells at the human neuromuscular junction. Brain Commun. 2021, 3, fcab081. [Google Scholar] [CrossRef] [PubMed]
- Martineau, É.; Arbour, D.; Vallée, J.; Robitaille, R. Properties of Glial Cell at the Neuromuscular Junction Are Incompatible with Synaptic Repair in the SOD1G37R ALS Mouse Model. J. Neurosci. 2020, 40, 7759–7777. [Google Scholar] [CrossRef] [PubMed]
- Arbour, D.; Vande Velde, C.; Robitaille, R. New perspectives on amyotrophic lateral sclerosis: The role of glial cells at the neuromuscular junction. J. Physiol. 2017, 595, 647–661. [Google Scholar] [CrossRef] [PubMed]
- Carrasco, D.I.; Seburn, K.L.; Pinter, M.J. Altered terminal Schwann cell morphology precedes denervation in SOD1 mice. Exp. Neurol. 2016, 275, 172–181. [Google Scholar] [CrossRef] [PubMed]
- Bruneteau, G.; Bauché, S.; Gonzalez de Aguilar, J.L.; Brochier, G.; Mandjee, N.; Tanguy, M.-L.; Hussain, G.; Behin, A.; Khiami, F.; Sariali, E.; et al. Endplate denervation correlates with Nogo-A muscle expression in amyotrophic lateral sclerosis patients. Ann. Clin. Transl. Neurol. 2015, 2, 362–372. [Google Scholar] [CrossRef] [PubMed]
- Liu, J.-X.; Brännström, T.; Andersen, P.M.; Pedrosa-Domellöf, F. Distinct changes in synaptic protein composition at neuromuscular junctions of extraocular muscles versus limb muscles of ALS donors. PLoS ONE 2013, 8, e57473. [Google Scholar] [CrossRef] [PubMed]
- Alhindi, A.; Boehm, I.; Chaytow, H. Small junction, big problems: Neuromuscular junction pathology in mouse models of amyotrophic lateral sclerosis (ALS). J. Anat. 2021, 1–19. [Google Scholar] [CrossRef] [PubMed]
- Benatar, M. Lost in translation: Treatment trials in the SOD1 mouse and in human ALS. Neurobiol. Dis. 2007, 26, 1–13. [Google Scholar] [CrossRef] [PubMed]
- Kastriti, M.E.; Adameyko, I. Specification, plasticity and evolutionary origin of peripheral glial cells. Curr. Opin. Neurobiol. 2017, 47, 196–202. [Google Scholar] [CrossRef] [PubMed]
- Cimadamore, F.; Fishwick, K.; Giusto, E.; Gnedeva, K.; Cattarossi, G.; Miller, A.; Pluchino, S.; Brill, L.M.; Bronner-Fraser, M.; Terskikh, A.V. Human ESC-derived neural crest model reveals a key role for SOX2 in sensory neurogenesis. Cell Stem Cell 2011, 8, 538–551. [Google Scholar] [CrossRef] [PubMed]
- Menendez, L.; Yatskievych, T.A.; Antin, P.B.; Dalton, S. Wnt signaling and a Smad pathway blockade direct the differentiation of human pluripotent stem cells to multipotent neural crest cells. Proc. Natl. Acad. Sci. USA 2011, 108, 19240–19245. [Google Scholar] [CrossRef] [PubMed]
- Ma, M.-S.; Boddeke, E.; Copray, S. Pluripotent stem cells for Schwann cell engineering. Stem Cell Rev. Rep. 2015, 11, 205–218. [Google Scholar] [CrossRef] [PubMed]
- Francis, G.L. Albumin and mammalian cell culture: Implications for biotechnology applications. Cytotechnology 2010, 62, 1–16. [Google Scholar] [CrossRef] [PubMed]
- Li, W.; Sun, W.; Zhang, Y.; Wei, W.; Ambasudhan, R.; Xia, P.; Talantova, M.; Lin, T.; Kim, J.; Wang, X.; et al. Rapid induction and long-term self-renewal of primitive neural precursors from human embryonic stem cells by small molecule inhibitors. Proc. Natl. Acad. Sci. USA 2011, 108, 8299–8304. [Google Scholar] [CrossRef] [PubMed]
- Leung, A.W.; Murdoch, B.; Salem, A.F.; Prasad, M.S.; Gomez, G.A.; García-Castro, M.I. WNT/β-catenin signaling mediates human neural crest induction via a pre-neural border intermediate. Development 2016, 143, 398–410. [Google Scholar] [CrossRef] [PubMed]
- Huang, M.; Miller, M.L.; McHenry, L.K.; Zheng, T.; Zhen, Q.; Ilkhanizadeh, S.; Conklin, B.R.; Bronner, M.E.; Weiss, W.A. Generating trunk neural crest from human pluripotent stem cells. Sci. Rep. 2016, 6, 19727. [Google Scholar] [CrossRef]
- Villanueva, S.; Glavic, A.; Ruiz, P.; Mayor, R. Posteriorization by FGF, Wnt, and retinoic acid is required for neural crest induction. Dev. Biol. 2002, 241, 289–301. [Google Scholar] [CrossRef]
- Kitada, M.; Murakami, T.; Wakao, S.; Li, G.; Dezawa, M. Direct conversion of adult human skin fibroblasts into functional Schwann cells that achieve robust recovery of the severed peripheral nerve in rats. Glia 2019, 67, 950–966. [Google Scholar] [CrossRef]
- Gao, S.; Zheng, Y.; Cai, Q.; Wu, X.; Yao, W.; Wang, J. Different methods for inducing adipose-derived stem cells to differentiate into Schwann-like cells. Arch. Med. Sci. 2015, 11, 886–892. [Google Scholar] [CrossRef] [PubMed]
- Dezawa, M.; Takahashi, I.; Esaki, M.; Takano, M.; Sawada, H. Sciatic nerve regeneration in rats induced by transplantation of in vitro differentiated bone-marrow stromal cells. Eur. J. Neurosci. 2001, 14, 1771–1776. [Google Scholar] [CrossRef] [PubMed]
- Latasa, M.-J.; Cosgaya, J.M. Regulation of Retinoid Receptors by Retinoic Acid and Axonal Contact in Schwann Cells. PLoS ONE 2011, 6, e17023. [Google Scholar] [CrossRef] [PubMed]
- Huff, T.C.; Sant, D.W.; Camarena, V.; van Booven, D.; Andrade, N.S.; Mustafi, S.; Monje, P.V.; Wang, G. Vitamin C regulates Schwann cell myelination by promoting DNA demethylation of pro-myelinating genes. J. Neurochem. 2021, 157, 1759–1773. [Google Scholar] [CrossRef] [PubMed]
- Eldridge, C.F.; Bunge, M.B.; Bunge, R.P.; Wood, P.M. Differentiation of axon-related Schwann cells in vitro. I. Ascorbic acid regulates basal lamina assembly and myelin formation. J. Cell Biol. 1987, 105, 1023–1034. [Google Scholar] [CrossRef] [PubMed]
- Park, S.E.; Ahn, J.; Jeong, H.-E.; Youn, I.; Huh, D.; Chung, S. A three-dimensional in vitro model of the peripheral nervous system. NPG Asia Mater 2021, 13, 1–11. [Google Scholar] [CrossRef]
- Bacallao, K.; Monje, P.V. Requirement of cAMP signaling for Schwann cell differentiation restricts the onset of myelination. PLoS ONE 2015, 10, e0116948. [Google Scholar] [CrossRef] [PubMed]
- Callizot, N.; Combes, M.; Steinschneider, R.; Poindron, P. A new long term in vitro model of myelination. Exp. Cell Res. 2011, 317, 2374–2383. [Google Scholar] [CrossRef] [PubMed]
- Latasa, M.-J.; Ituero, M.; Moran-Gonzalez, A.; Aranda, A.; Cosgaya, J.M. Retinoic acid regulates myelin formation in the peripheral nervous system. Glia 2010, 58, 1451–1464. [Google Scholar] [CrossRef] [PubMed]
- Latasa, M.-J.; Jiménez-Lara, A.M.; Cosgaya, J.M. Retinoic acid regulates Schwann cell migration via NEDD9 induction by transcriptional and post-translational mechanisms. Biochim. Biophys. Acta 2016, 1863, 1510–1518. [Google Scholar] [CrossRef] [PubMed]
- Chevrel, G.; Hohlfeld, R.; Sendtner, M. The role of neurotrophins in muscle under physiological and pathological conditions. Muscle Nerve 2006, 33, 462–476. [Google Scholar] [CrossRef] [PubMed]
- Sakuma, K.; Yamaguchi, A. The recent understanding of the neurotrophin’s role in skeletal muscle adaptation. J. Biomed. Biotechnol. 2011, 2011, 201696. [Google Scholar] [CrossRef]
- Gonzalez, M.; Ruggiero, F.P.; Chang, Q.; Shi, Y.-J.; Rich, M.M.; Kraner, S.; Balice-Gordon, R.J. Disruption of TrkB-Mediated Signaling Induces Disassembly of Postsynaptic Receptor Clusters at Neuromuscular Junctions. Neuron 1999, 24, 567–583. [Google Scholar] [CrossRef]
- Griesbeck, O.; Parsadanian, A.S.; Sendtner, M.; Thoenen, H. Expression of neurotrophins in skeletal muscle: Quantitative comparison and significance for motoneuron survival and maintenance of function. J. Neurosci. Res. 1995, 42, 21–33. [Google Scholar] [CrossRef] [PubMed]
- Klein, R.; Silos-Santiago, I.; Smeyne, R.J.; Lira, S.A.; Brambilla, R.; Bryant, S.; Zhang, L.; Snider, W.D.; Barbacid, M. Disruption of the neurotrophin-3 receptor gene trkC eliminates la muscle afferents and results in abnormal movements. Nature 1994, 368, 249–251. [Google Scholar] [CrossRef]
- Ernfors, P.; Lee, K.-F.; Kucera, J.; Jaenisch, R. Lack of neurotrophin-3 leads to deficiencies in the peripheral nervous system and loss of limb proprioceptive afferents. Cell 1994, 77, 503–512. [Google Scholar] [CrossRef]
- Colombo, E.; Bedogni, F.; Lorenzetti, I.; Landsberger, N.; Previtali, S.C.; Farina, C. Autocrine and immune cell-derived BDNF in human skeletal muscle: Implications for myogenesis and tissue regeneration. J. Pathol. 2013, 231, 190–198. [Google Scholar] [CrossRef]
- Clow, C.; Jasmin, B.J. Brain-derived neurotrophic factor regulates satellite cell differentiation and skeltal muscle regeneration. MBoC 2010, 21, 2182–2190. [Google Scholar] [CrossRef]
- Kulakowski, S.A.; Parker, S.D.; Personius, K.E. Reduced TrkB expression results in precocious age-like changes in neuromuscular structure, neurotransmission, and muscle function. J. Appl. Physiol. 2011, 111, 844–852. [Google Scholar] [CrossRef] [PubMed]
- Delezie, J.; Weihrauch, M.; Maier, G.; Tejero, R.; Ham, D.J.; Gill, J.F.; Karrer-Cardel, B.; Rüegg, M.A.; Tabares, L.; Handschin, C. BDNF is a mediator of glycolytic fiber-type specification in mouse skeletal muscle. Proc. Natl. Acad. Sci. USA 2019, 116, 16111–16120. [Google Scholar] [CrossRef] [PubMed]
- Ruberti, F.; Capsoni, S.; Comparini, A.; Di Daniel, E.; Franzot, J.; Gonfloni, S.; Rossi, G.; Berardi, N.; Cattaneo, A. Phenotypic Knockout of Nerve Growth Factor in Adult Transgenic Mice Reveals Severe Deficits in Basal Forebrain Cholinergic Neurons, Cell Death in the Spleen, and Skeletal Muscle Dystrophy. J. Neurosci. 2000, 20, 2589–2601. [Google Scholar] [CrossRef]
- Capsoni, S.; Ruberti, F.; Di Daniel, E.; Cattaneo, A. Muscular dystrophy in adult and aged anti-NGF transgenic mice resembles an inclusion body myopathy. J. Neurosci. Res. 2000, 59, 553–560. [Google Scholar] [CrossRef]
- Wu, H.; Xiong, W.C.; Mei, L. To build a synapse: Signaling pathways in neuromuscular junction assembly. Development 2010, 137, 1017–1033. [Google Scholar] [CrossRef] [PubMed]
- Ruegg, M.A.; Bixby, J.L. Agrin orchestrates synaptic differentiation at the vertebrate neuromuscular junction. Trends Neurosci. 1998, 21, 22–27. [Google Scholar] [CrossRef]
- Luo, S.; Zhang, B.; Dong, X.; Tao, Y.; Ting, A.; Zhou, Z.; Meixiong, J.; Luo, J.; Chiu, F.C.A.; Xiong, W.C.; et al. HSP90 beta regulates rapsyn turnover and subsequent AChR cluster formation and maintenance. Neuron 2008, 60, 97–110. [Google Scholar] [CrossRef]
- Bruneau, E.; Akaaboune, M. The dynamics of the rapsyn scaffolding protein at individual acetylcholine receptor clusters. J. Biol. Chem. 2007, 282, 9932–9940. [Google Scholar] [CrossRef] [PubMed]
- Moransard, M.; Borges, L.S.; Willmann, R.; Marangi, P.A.; Brenner, H.R.; Ferns, M.J.; Fuhrer, C. Agrin regulates rapsyn interaction with surface acetylcholine receptors, and this underlies cytoskeletal anchoring and clustering. J. Biol. Chem. 2003, 278, 7350–7359. [Google Scholar] [CrossRef] [PubMed]
- Mittaud, P.; Marangi, P.A.; Erb-Vögtli, S.; Fuhrer, C. Agrin-induced activation of acetylcholine receptor-bound Src family kinases requires Rapsyn and correlates with acetylcholine receptor clustering. J. Biol. Chem. 2001, 276, 14505–14513. [Google Scholar] [CrossRef]
- Yang, J.-F.; Cao, G.; Koirala, S.; Reddy, L.V.; Ko, C.-P. Schwann Cells Express Active Agrin and Enhance Aggregation of Acetylcholine Receptors on Muscle Fibers. J. Neurosci. Off. J. Soc. Neurosci. 2001, 21, 9572–9584. [Google Scholar] [CrossRef]
- Castro, R.; Taetzsch, T.; Vaughan, S.K.; Godbe, K.; Chappell, J.; Settlage, R.E.; Valdez, G. Specific labeling of synaptic schwann cells reveals unique cellular and molecular features. Elife 2020, 9, e56935. [Google Scholar] [CrossRef]
- Ferns, M.J.; Campanelli, J.T.; Hoch, W.; Scheller, R.H.; Hall, Z. The ability of agrin to cluster AChRs depends on alternative splicing and on cell surface proteoglycans. Neuron 1993, 11, 491–502. [Google Scholar] [CrossRef]
- Jung, J.H.; Smith, I.; Mikesh, M. Terminal Schwann cell and vacant site mediated synapse elimination at developing neuromuscular junctions. Sci. Rep. 2019, 9, 18594. [Google Scholar] [CrossRef] [PubMed]
- Lee, Y.I.; Li, Y.; Mikesh, M.; Smith, I.; Nave, K.-A.; Schwab, M.H.; Thompson, W.J. Neuregulin1 displayed on motor axons regulates terminal Schwann cell-mediated synapse elimination at developing neuromuscular junctions. Proc. Natl. Acad. Sci. USA 2016, 113, E479–E487. [Google Scholar] [CrossRef] [PubMed]
- Zelada, D.; Bermedo-García, F.; Collao, N.; Henríquez, J.P. Motor function recovery: Deciphering a regenerative niche at the neuromuscular synapse. Biol. Rev. Camb. Philos. Soc. 2021, 96, 752–766. [Google Scholar] [CrossRef] [PubMed]
- VanSaun, M.; Humburg, B.C.; Arnett, M.G.; Pence, M.; Werle, M.J. Activation of Matrix Metalloproteinase-3 is altered at the frog neuromuscular junction following changes in synaptic activity. Dev. Neurobiol. 2007, 67, 1488–1497. [Google Scholar] [CrossRef] [PubMed]
- VanSaun, M.; Werle, M.J. Matrix metalloproteinase-3 removes agrin from synaptic basal lamina. J. Neurobiol. 2000, 43, 140–149. [Google Scholar] [CrossRef]
- Chao, T.; Frump, D.; Lin, M.; Caiozzo, V.J.; Mozaffar, T.; Steward, O.; Gupta, R. Matrix metalloproteinase 3 deletion preserves denervated motor endplates after traumatic nerve injury. Ann. Neurol. 2013, 73, 210–223. [Google Scholar] [CrossRef]
- VanSaun, M.; Herrera, A.A.; Werle, M.J. Structural alterations at the neuromuscular junctions of matrix metalloproteinase 3 null mutant mice. J. Neurocytol. 2003, 32, 1129–1142. [Google Scholar] [CrossRef]
- Peng, H.B.; Yang, J.-F.; Dai, Z.; Lee, C.W.; Hung, H.W.; Feng, Z.H.; Ko, C.-P. Differential effects of neurotrophins and schwann cell-derived signals on neuronal survival/growth and synaptogenesis. J. Neurosci. Off. J. Soc. Neurosci. 2003, 23, 5050–5060. [Google Scholar] [CrossRef]
- Wells, D.G.; McKechnie, B.A.; Kelkar, S.; Fallon, J.R. Neurotrophins regulate agrin-induced postsynaptic differentiation. Proc. Natl. Acad. Sci. USA 1999, 96, 1112–1117. [Google Scholar] [CrossRef] [PubMed]
- Lin, W.; Dominguez, B.; Yang, J.; Aryal, P.; Brandon, E.P.; Gage, F.H.; Lee, K.-F. Neurotransmitter acetylcholine negatively regulates neuromuscular synapse formation by a Cdk5-dependent mechanism. Neuron 2005, 46, 569–579. [Google Scholar] [CrossRef] [PubMed]
- Misgeld, T.; Burgess, R.W.; Lewis, R.M.; Cunningham, J.M.; Lichtman, J.W.; Sanes, J.R. Roles of Neurotransmitter in Synapse Formation. Neuron 2002, 36, 635–648. [Google Scholar] [CrossRef]
- Rimington, R.P.; Fleming, J.W.; Capel, A.J.; Wheeler, P.C.; Lewis, M.P. Bioengineered model of the human motor unit with physiologically functional neuromuscular junctions. Sci. Rep. 2021, 11, 11695. [Google Scholar] [CrossRef] [PubMed]
- Guo, X.; Badu-Mensah, A.; Thomas, M.C.; McAleer, C.W.; Hickman, J.J. Characterization of Functional Human Skeletal Myotubes and Neuromuscular Junction Derived-From the Same Induced Pluripotent Stem Cell Source. Bioengineering 2020, 7, 133. [Google Scholar] [CrossRef] [PubMed]
- Uzel, S.G.M.; Platt, R.J.; Subramanian, V.; Pearl, T.M.; Rowlands, C.J.; Chan, V.; Boyer, L.A.; So, P.T.C.; Kamm, R.D. Microfluidic device for the formation of optically excitable, three-dimensional, compartmentalized motor units. Sci. Adv. 2016, 2, 8. [Google Scholar] [CrossRef] [PubMed]
- Yamamoto, K.; Yamaoka, N.; Imaizumi, Y.; Nagashima, T.; Furutani, T.; Ito, T.; Okada, Y.; Honda, H.; Shimizu, K. Development of a human neuromuscular tissue-on-a-chip model on a 24-well-plate-format compartmentalized microfluidic device. Lab A Chip 2021, 21, 1897–1907. [Google Scholar] [CrossRef]
- Afshar Bakooshli, M.; Lippmann, E.S.; Mulcahy, B.; Iyer, N.; Nguyen, C.T.; Tung, K.; Stewart, B.A.; van den Dorpel, H.; Fuehrmann, T.; Shoichet, M.; et al. A 3D culture model of innervated human skeletal muscle enables studies of the adult neuromuscular junction. Elife 2019, 8, e44530. [Google Scholar] [CrossRef] [PubMed]
- Steinbeck, J.A.; Jaiswal, M.K.; Calder, E.L.; Kishinevsky, S.; Weishaupt, A.; Toyka, K.V.; Goldstein, P.A.; Studer, L. Functional Connectivity under Optogenetic Control Allows Modeling of Human Neuromuscular Disease. Cell Stem Cell 2016, 18, 134–143. [Google Scholar] [CrossRef] [PubMed]
- Osaki, T.; Uzel, S.G.M.; Kamm, R.D. Microphysiological 3D model of amyotrophic lateral sclerosis (ALS) from human iPS-derived muscle cells and optogenetic motor neurons. Sci. Adv. 2018, 4, eaat5847. [Google Scholar] [CrossRef]
- Smith, A.; Long, C.J.; Pirozzi, K.; Hickman, J.J. A functional system for high-content screening of neuromuscular junctions in vitro. Technology 2013, 1, 37–48. [Google Scholar] [CrossRef]
- Santhanam, N.; Kumanchik, L.; Guo, X.; Sommerhage, F.; Cai, Y.; Jackson, M.; Martin, C.; Saad, G.; McAleer, C.W.; Wang, Y.; et al. Stem cell derived phenotypic human neuromuscular junction model for dose response evaluation of therapeutics. Biomaterials 2018, 166, 64–78. [Google Scholar] [CrossRef] [PubMed]
- Osaki, T.; Uzel, S.G.M.; Kamm, R.D. On-chip 3D neuromuscular model for drug screening and precision medicine in neuromuscular disease. Nat. Protoc. 2020, 15, 421–449. [Google Scholar] [CrossRef]
- Wang, P.-Y.; Thissen, H.; Tsai, W.-B. The roles of RGD and grooved topography in the adhesion, morphology, and differentiation of C2C12 skeletal myoblasts. Biotechnol. Bioeng. 2012, 109, 2104–2115. [Google Scholar] [CrossRef] [PubMed]
- Thomson, S.R.; Wishart, T.M.; Patani, R.; Chandran, S.; Gillingwater, T.H. Using induced pluripotent stem cells (iPSC) to model human neuromuscular connectivity: Promise or reality? J. Anat. 2012, 220, 122–130. [Google Scholar] [CrossRef] [PubMed]
- Negro, S.; Bergamin, E.; Rodella, U.; Duregotti, E.; Scorzeto, M.; Jalink, K.; Montecucco, C.; Rigoni, M. ATP Released by Injured Neurons Activates Schwann Cells. Front. Cell. Neurosci. 2016, 10, 134. [Google Scholar] [CrossRef] [PubMed]


Publisher’s Note: MDPI stays neutral with regard to jurisdictional claims in published maps and institutional affiliations. |
© 2021 by the authors. Licensee MDPI, Basel, Switzerland. This article is an open access article distributed under the terms and conditions of the Creative Commons Attribution (CC BY) license (https://creativecommons.org/licenses/by/4.0/).
Share and Cite
Hörner, S.J.; Couturier, N.; Bruch, R.; Koch, P.; Hafner, M.; Rudolf, R. hiPSC-Derived Schwann Cells Influence Myogenic Differentiation in Neuromuscular Cocultures. Cells 2021, 10, 3292. https://doi.org/10.3390/cells10123292
Hörner SJ, Couturier N, Bruch R, Koch P, Hafner M, Rudolf R. hiPSC-Derived Schwann Cells Influence Myogenic Differentiation in Neuromuscular Cocultures. Cells. 2021; 10(12):3292. https://doi.org/10.3390/cells10123292
Chicago/Turabian StyleHörner, Sarah Janice, Nathalie Couturier, Roman Bruch, Philipp Koch, Mathias Hafner, and Rüdiger Rudolf. 2021. "hiPSC-Derived Schwann Cells Influence Myogenic Differentiation in Neuromuscular Cocultures" Cells 10, no. 12: 3292. https://doi.org/10.3390/cells10123292
APA StyleHörner, S. J., Couturier, N., Bruch, R., Koch, P., Hafner, M., & Rudolf, R. (2021). hiPSC-Derived Schwann Cells Influence Myogenic Differentiation in Neuromuscular Cocultures. Cells, 10(12), 3292. https://doi.org/10.3390/cells10123292