
Engineered Pullulan-Collagen-Gold Nano Composite Improves Mesenchymal Stem Cells Neural Differentiation and Inflammatory Regulation

 , , and
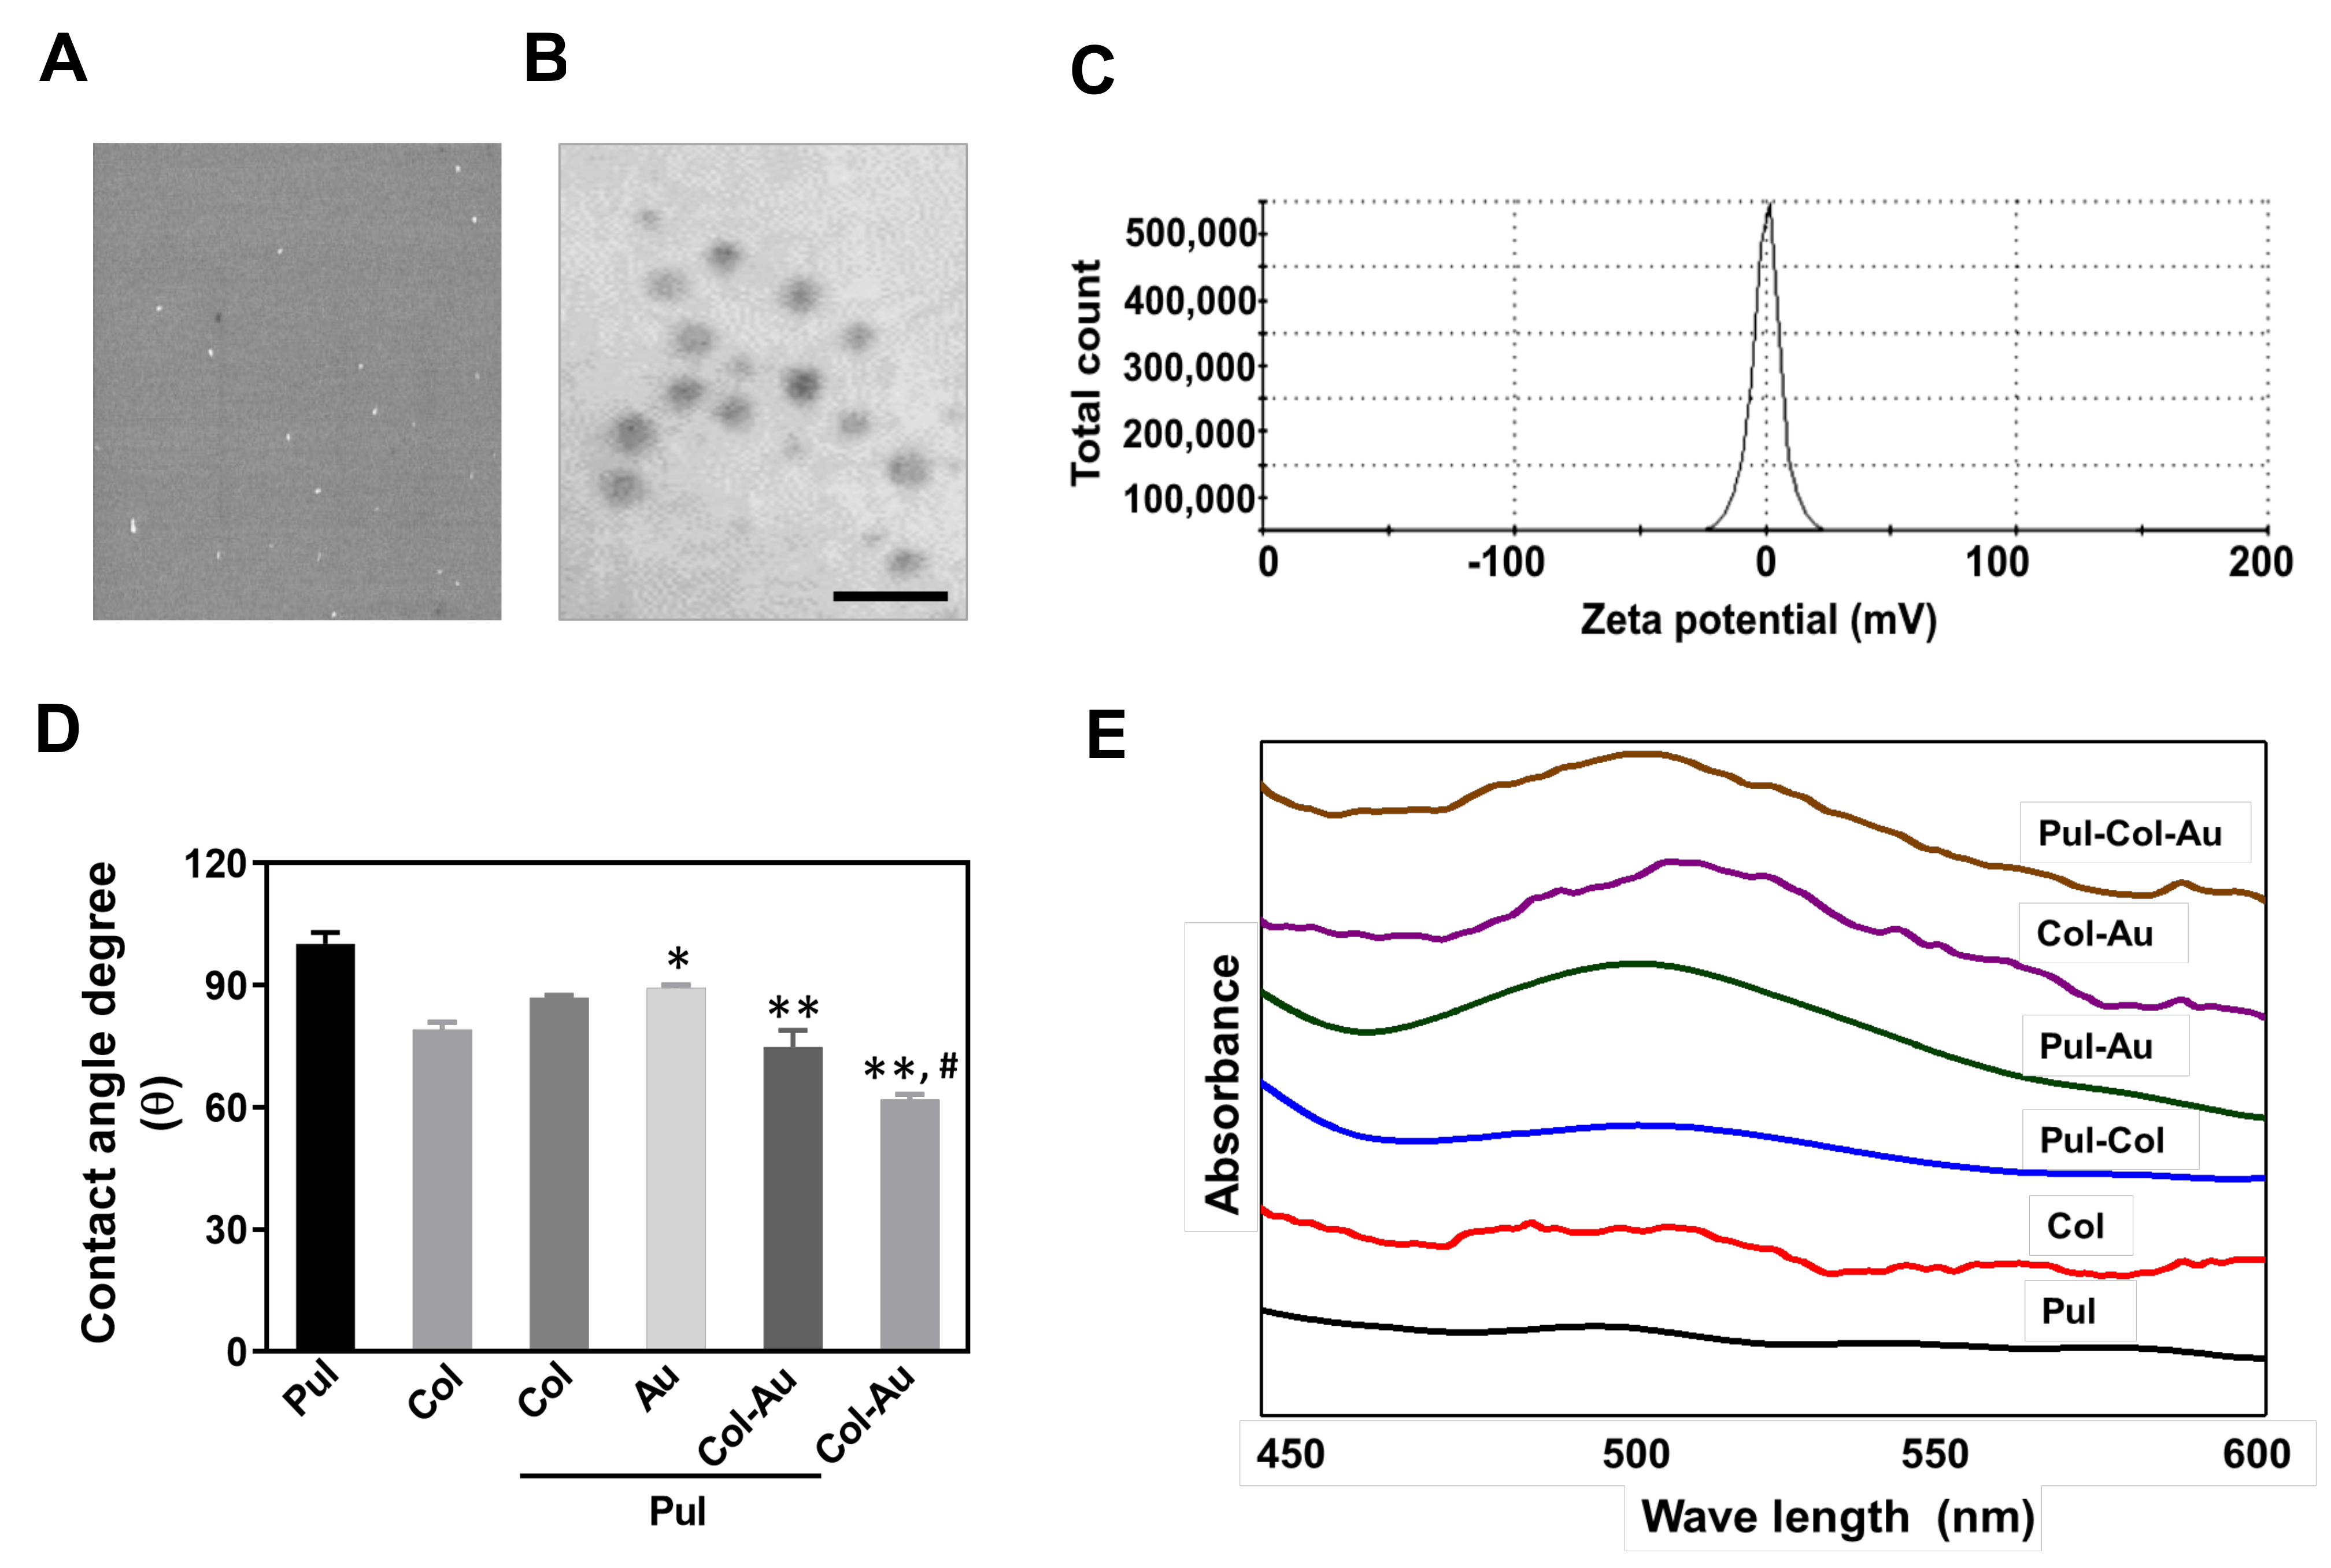
Abstract
1. Introduction
2. Materials and Methods
2.1. Material Synthesis
2.1.1. Preparation of Pullulan Solution (Pul)
2.1.2. Preparation of Collagen (Col)
2.1.3. Preparation of Pullulan–Gold Nanoparticles (Pul–Au)
2.1.4. Preparation of Pullulan–Collagen (Pul–Col)
2.1.5. Preparation of Pullulan–Collagen–Gold Nanoparticles (Pul–Col–Au)
2.1.6. Preparation of Collagen–Gold Nanoparticles (Col–Au)
2.2. Material Characterization
2.2.1. Scanning Electron Microcopy (SEM)
2.2.2. Transmission Electron Microscope (TEM)
2.2.3. Dynamic Light Scattering (DLS)
2.2.4. Hydrophilicity Property Examination
2.2.5. UV-Visible Spectroscopy (UV-Vis)
2.2.6. Fourier Transform Infrared Spectroscopy (FTIR)
2.2.7. Surface-Enhanced Raman Spectroscopy (SERS) and X-ray Photoelectron Spectroscopy (XPS)
2.3. Cell Culture
2.3.1. Wharton’s Jelly-Derived Mesenchymal Stem Cells
2.3.2. Human Skin Fibroblasts (HSFs)
2.4. Biocompatibility Assessments
2.4.1. MTT Assay
2.4.2. Intracellular Reactive Oxygen Species (ROS) Generation
2.4.3. Examination of Monocyte and Platelet Activities
2.4.4. Assessments of Cell Apoptosis Induced by Various Nanomaterials
2.5. Investigation of Biological Functions
2.5.1. Cell Migration
2.5.2. Immunofluorescence Analysis
2.5.3. Enzyme-Linked Immunosorbent Assay (ELISA)
2.5.4. Assessment of Matrix Metalloproteinase (MMP) Activities
2.5.5. Real-Time PCR assay
2.6. Rat Subcutaneous In Vivo Model
2.7. Statistical Analysis
3. Results
3.1. Characterization of Pul-Derived Nanocomposites
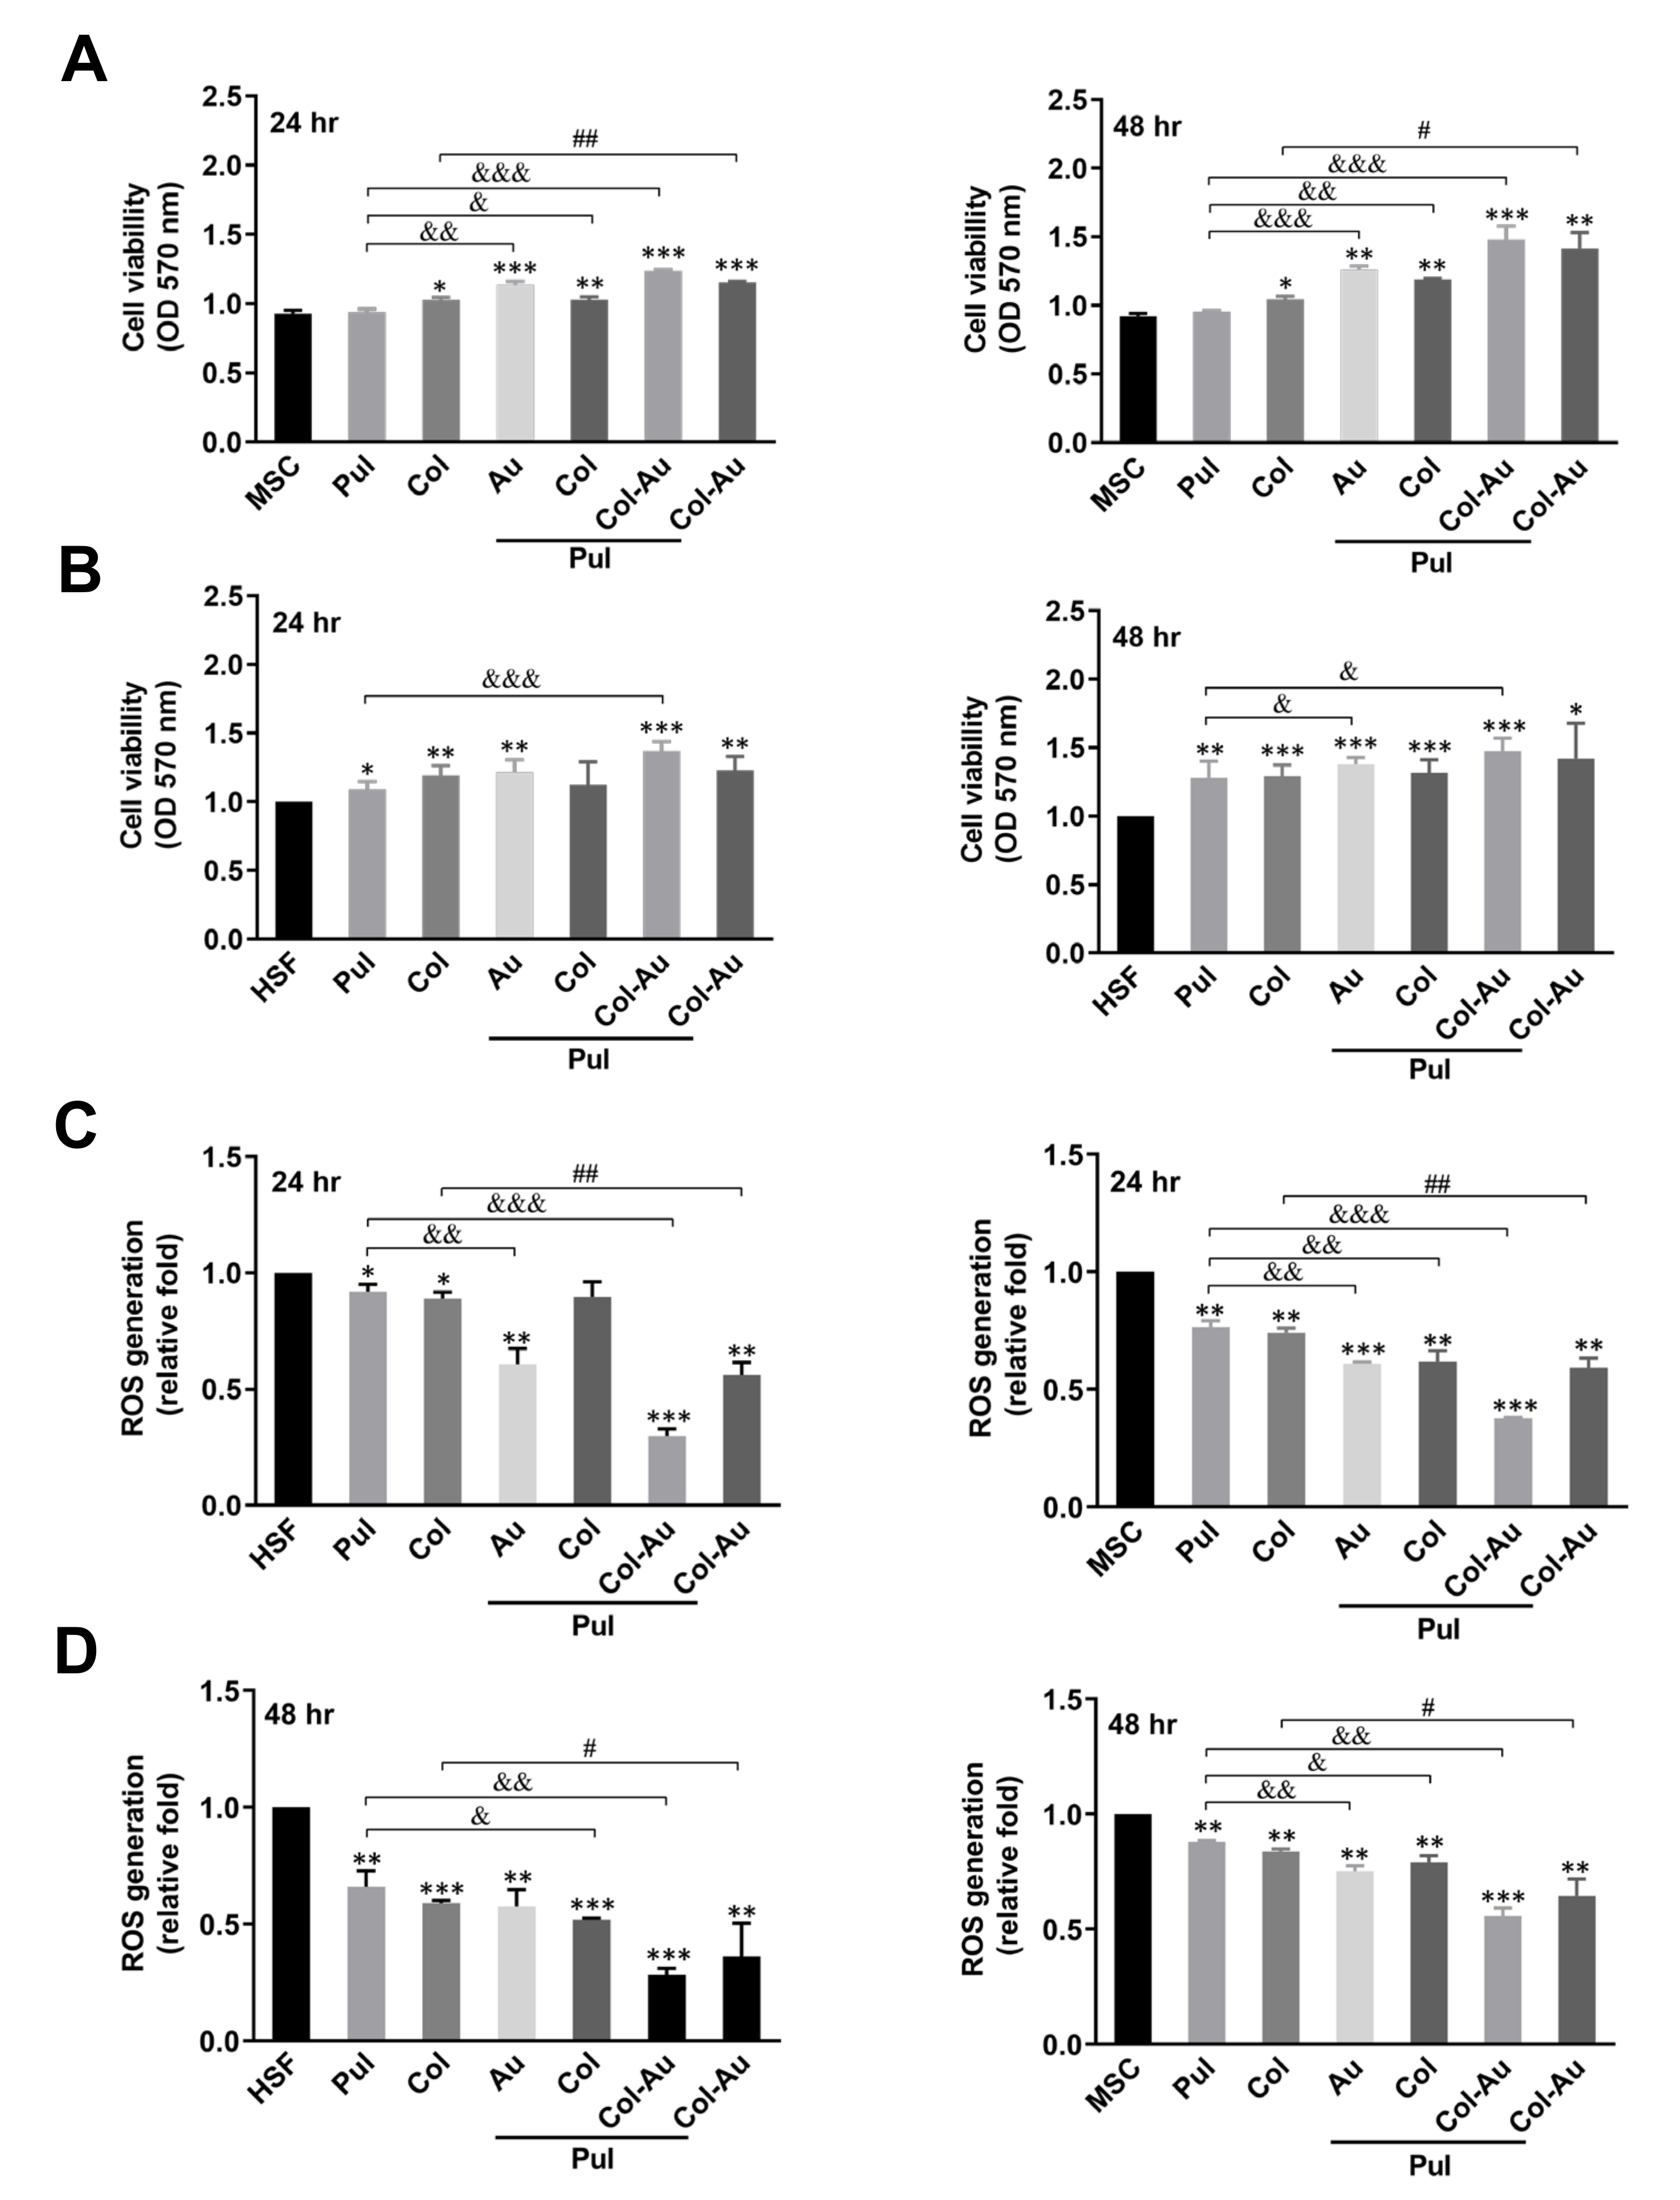
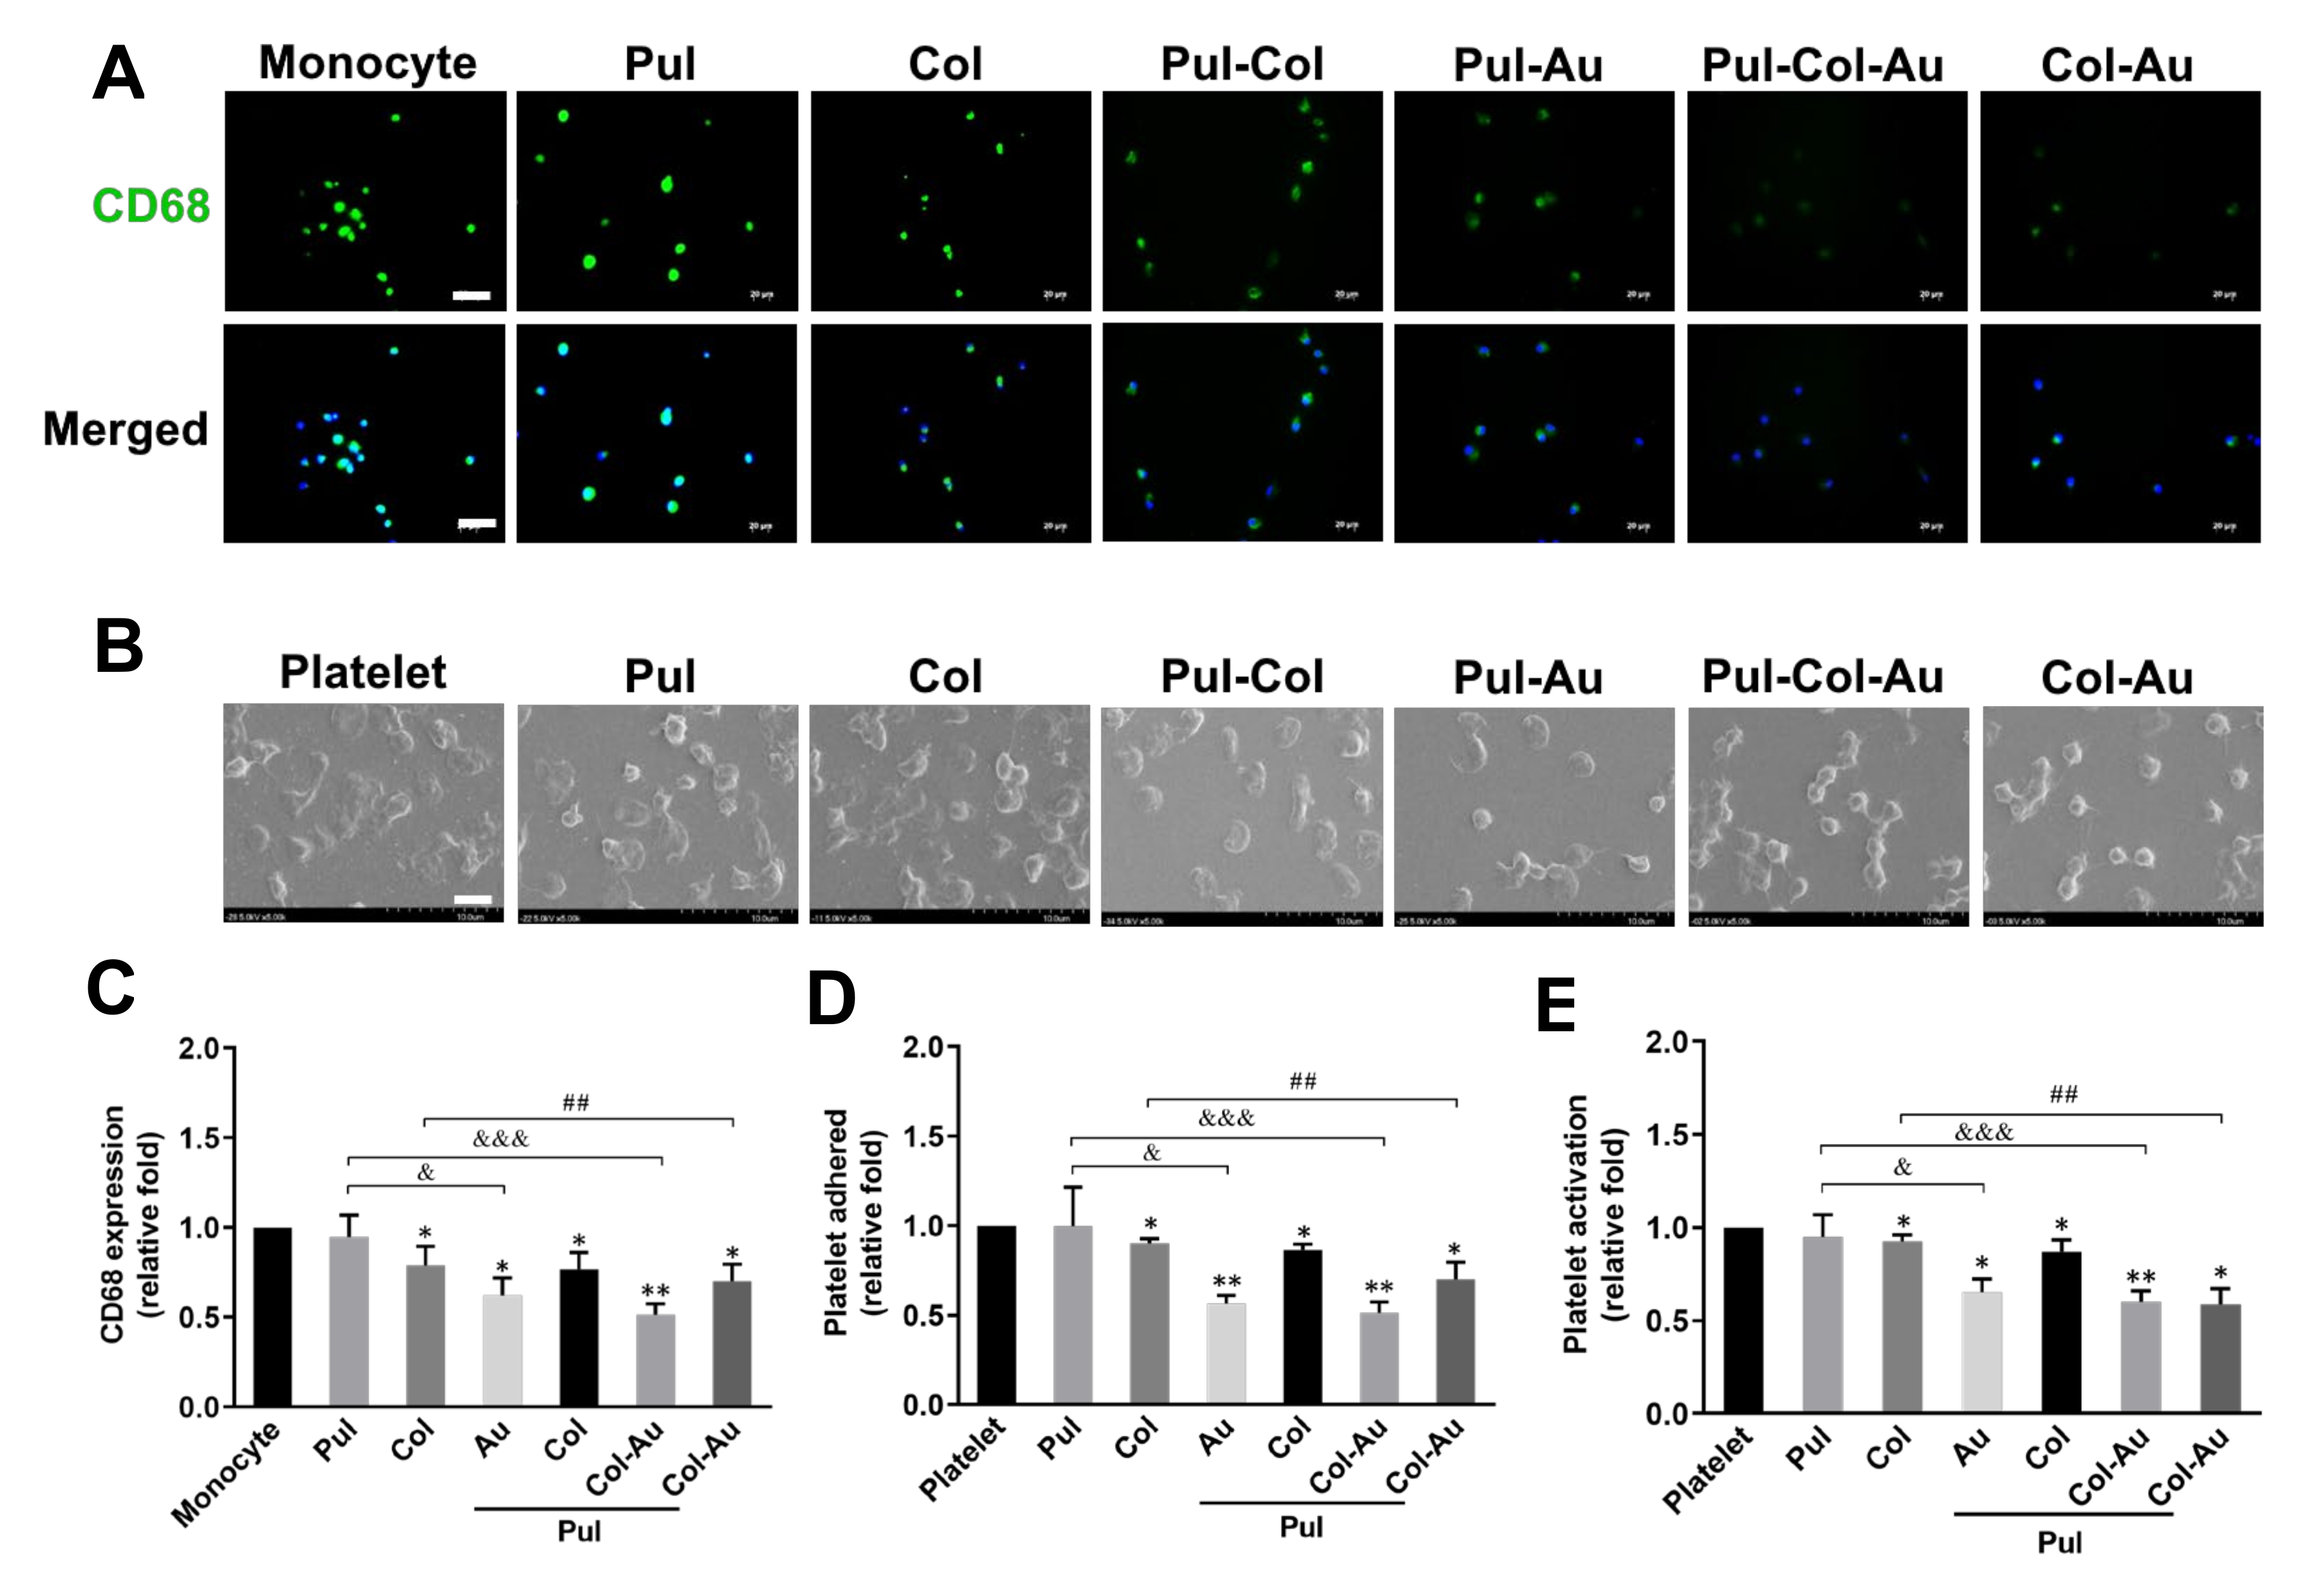
3.2. Biocompatibility Assessments of Pul-Derived Nanocomposites for MSCs and HSFs
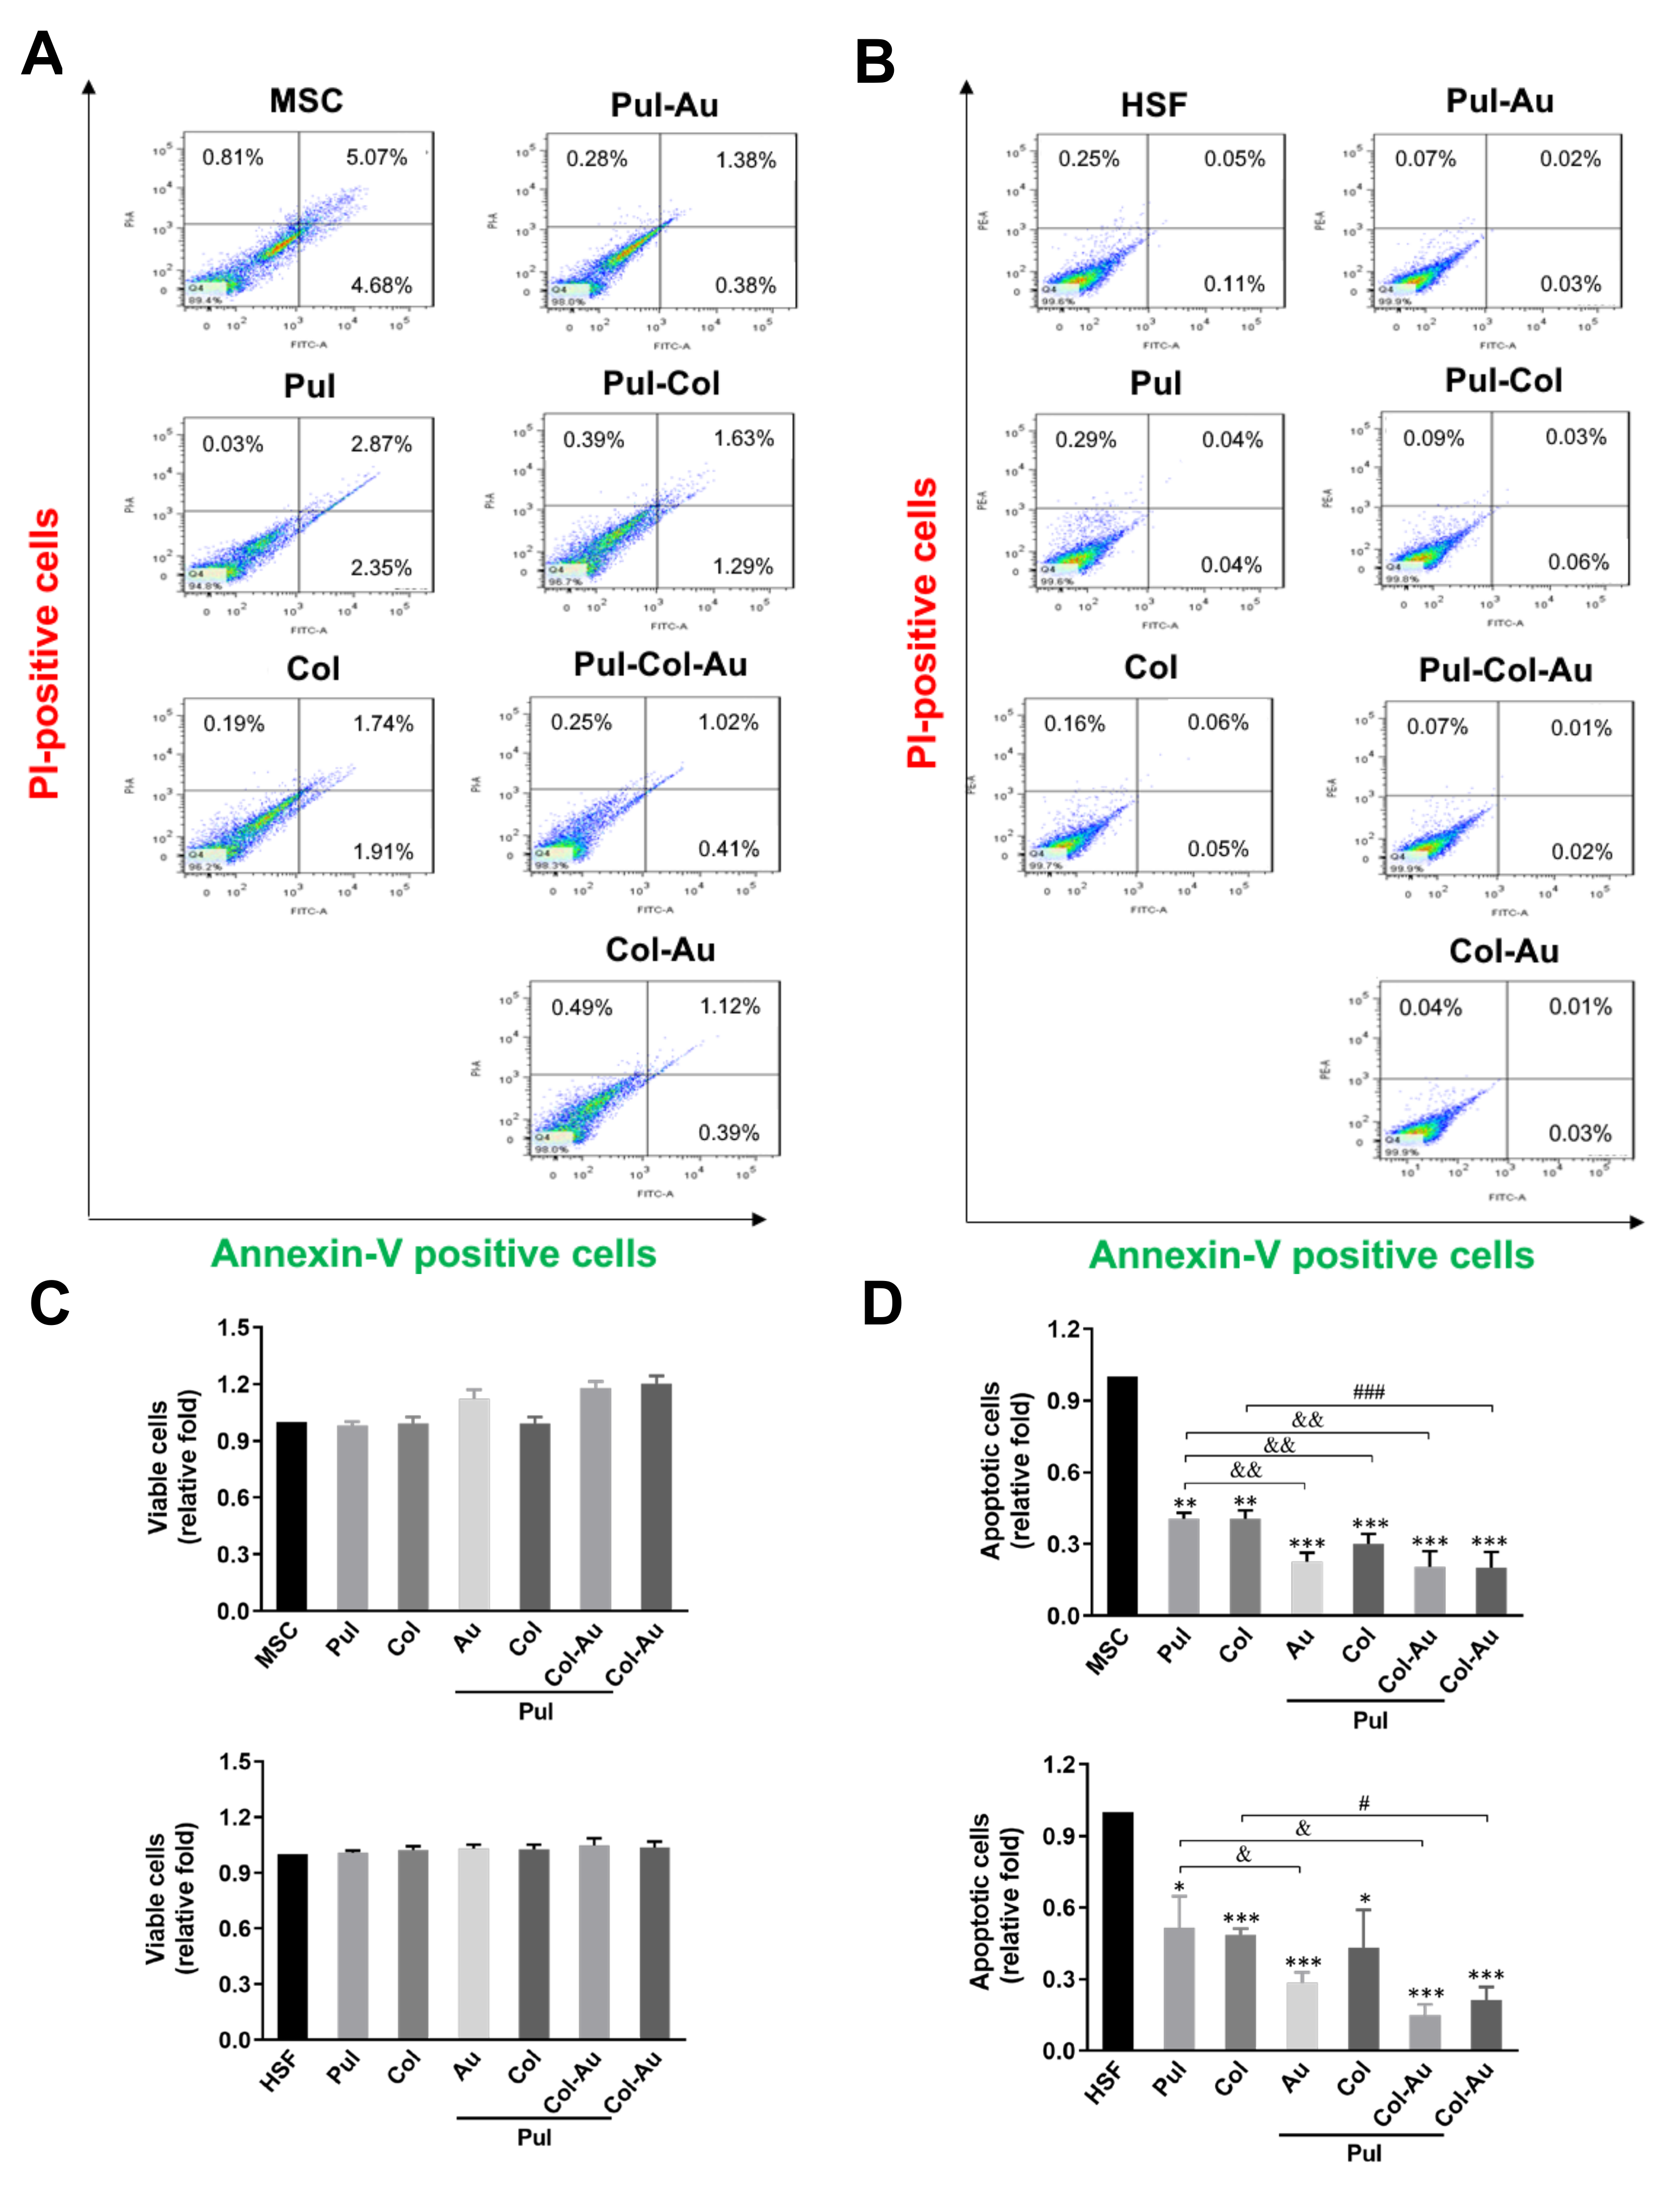
3.3. Cell Apoptosis Induced by Pul-Derived Nanocomposites
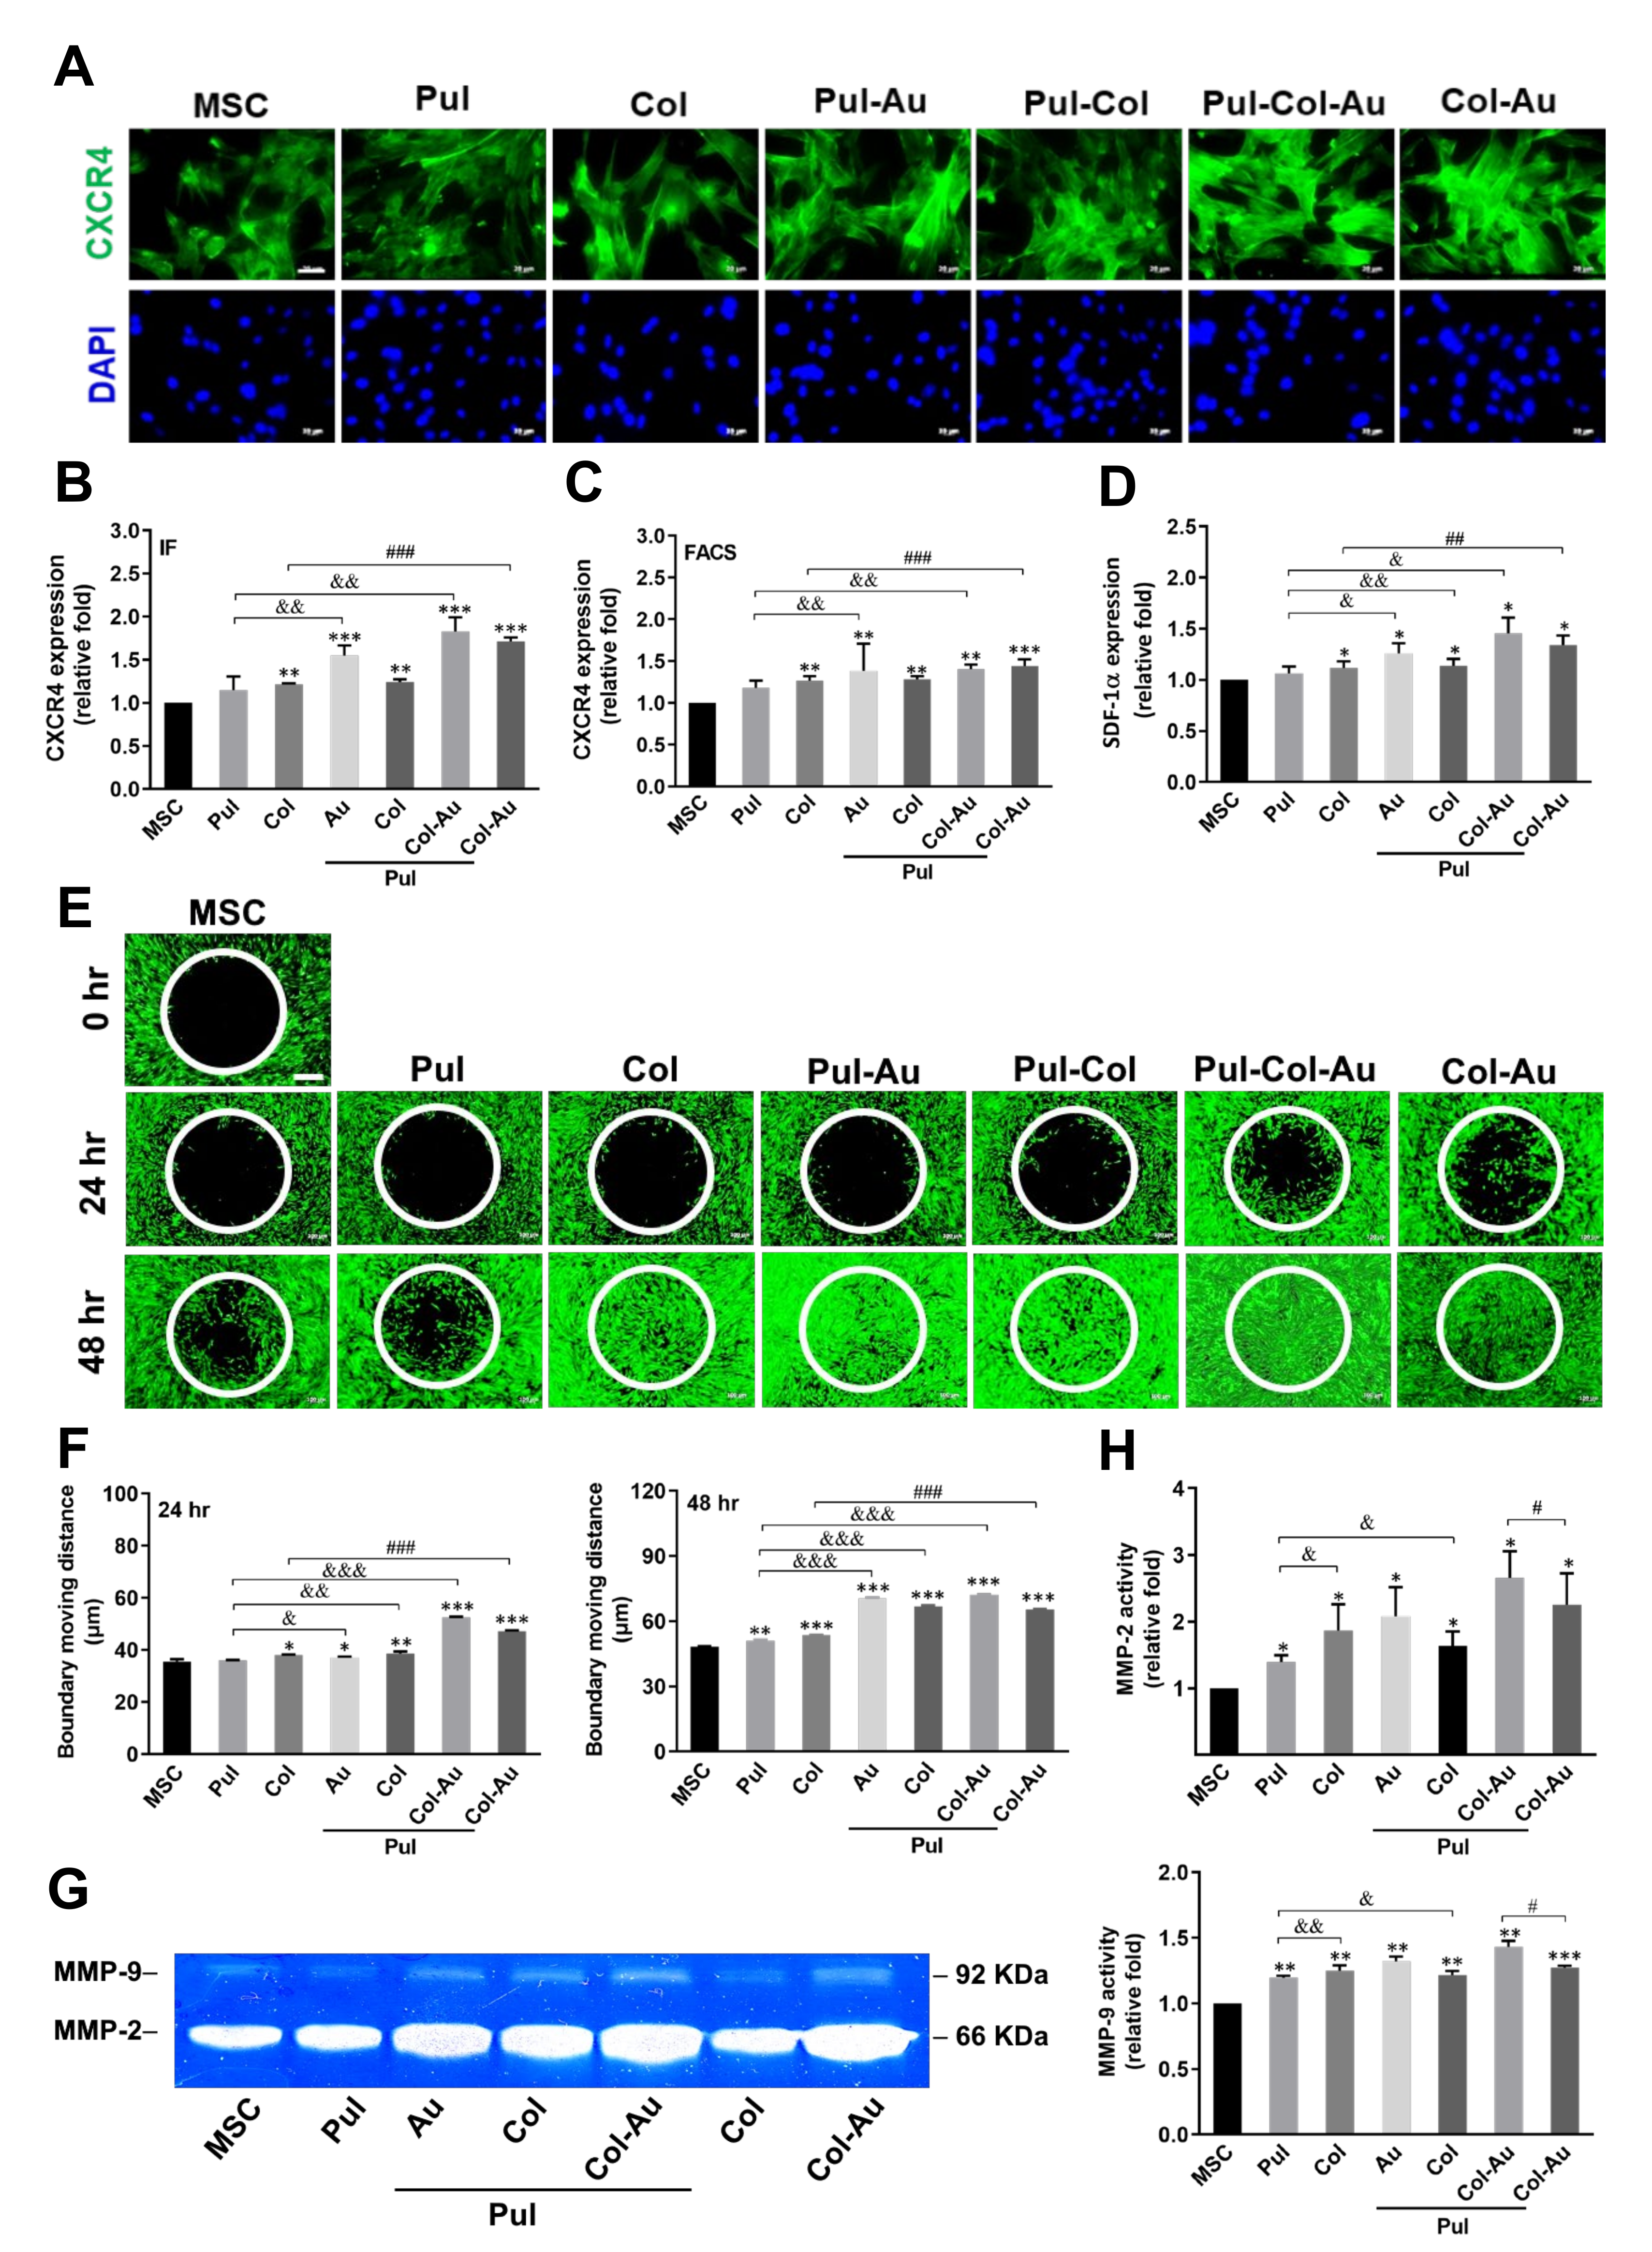
3.4. Cell Migration Affected by Pul-Derived Nanocomposites
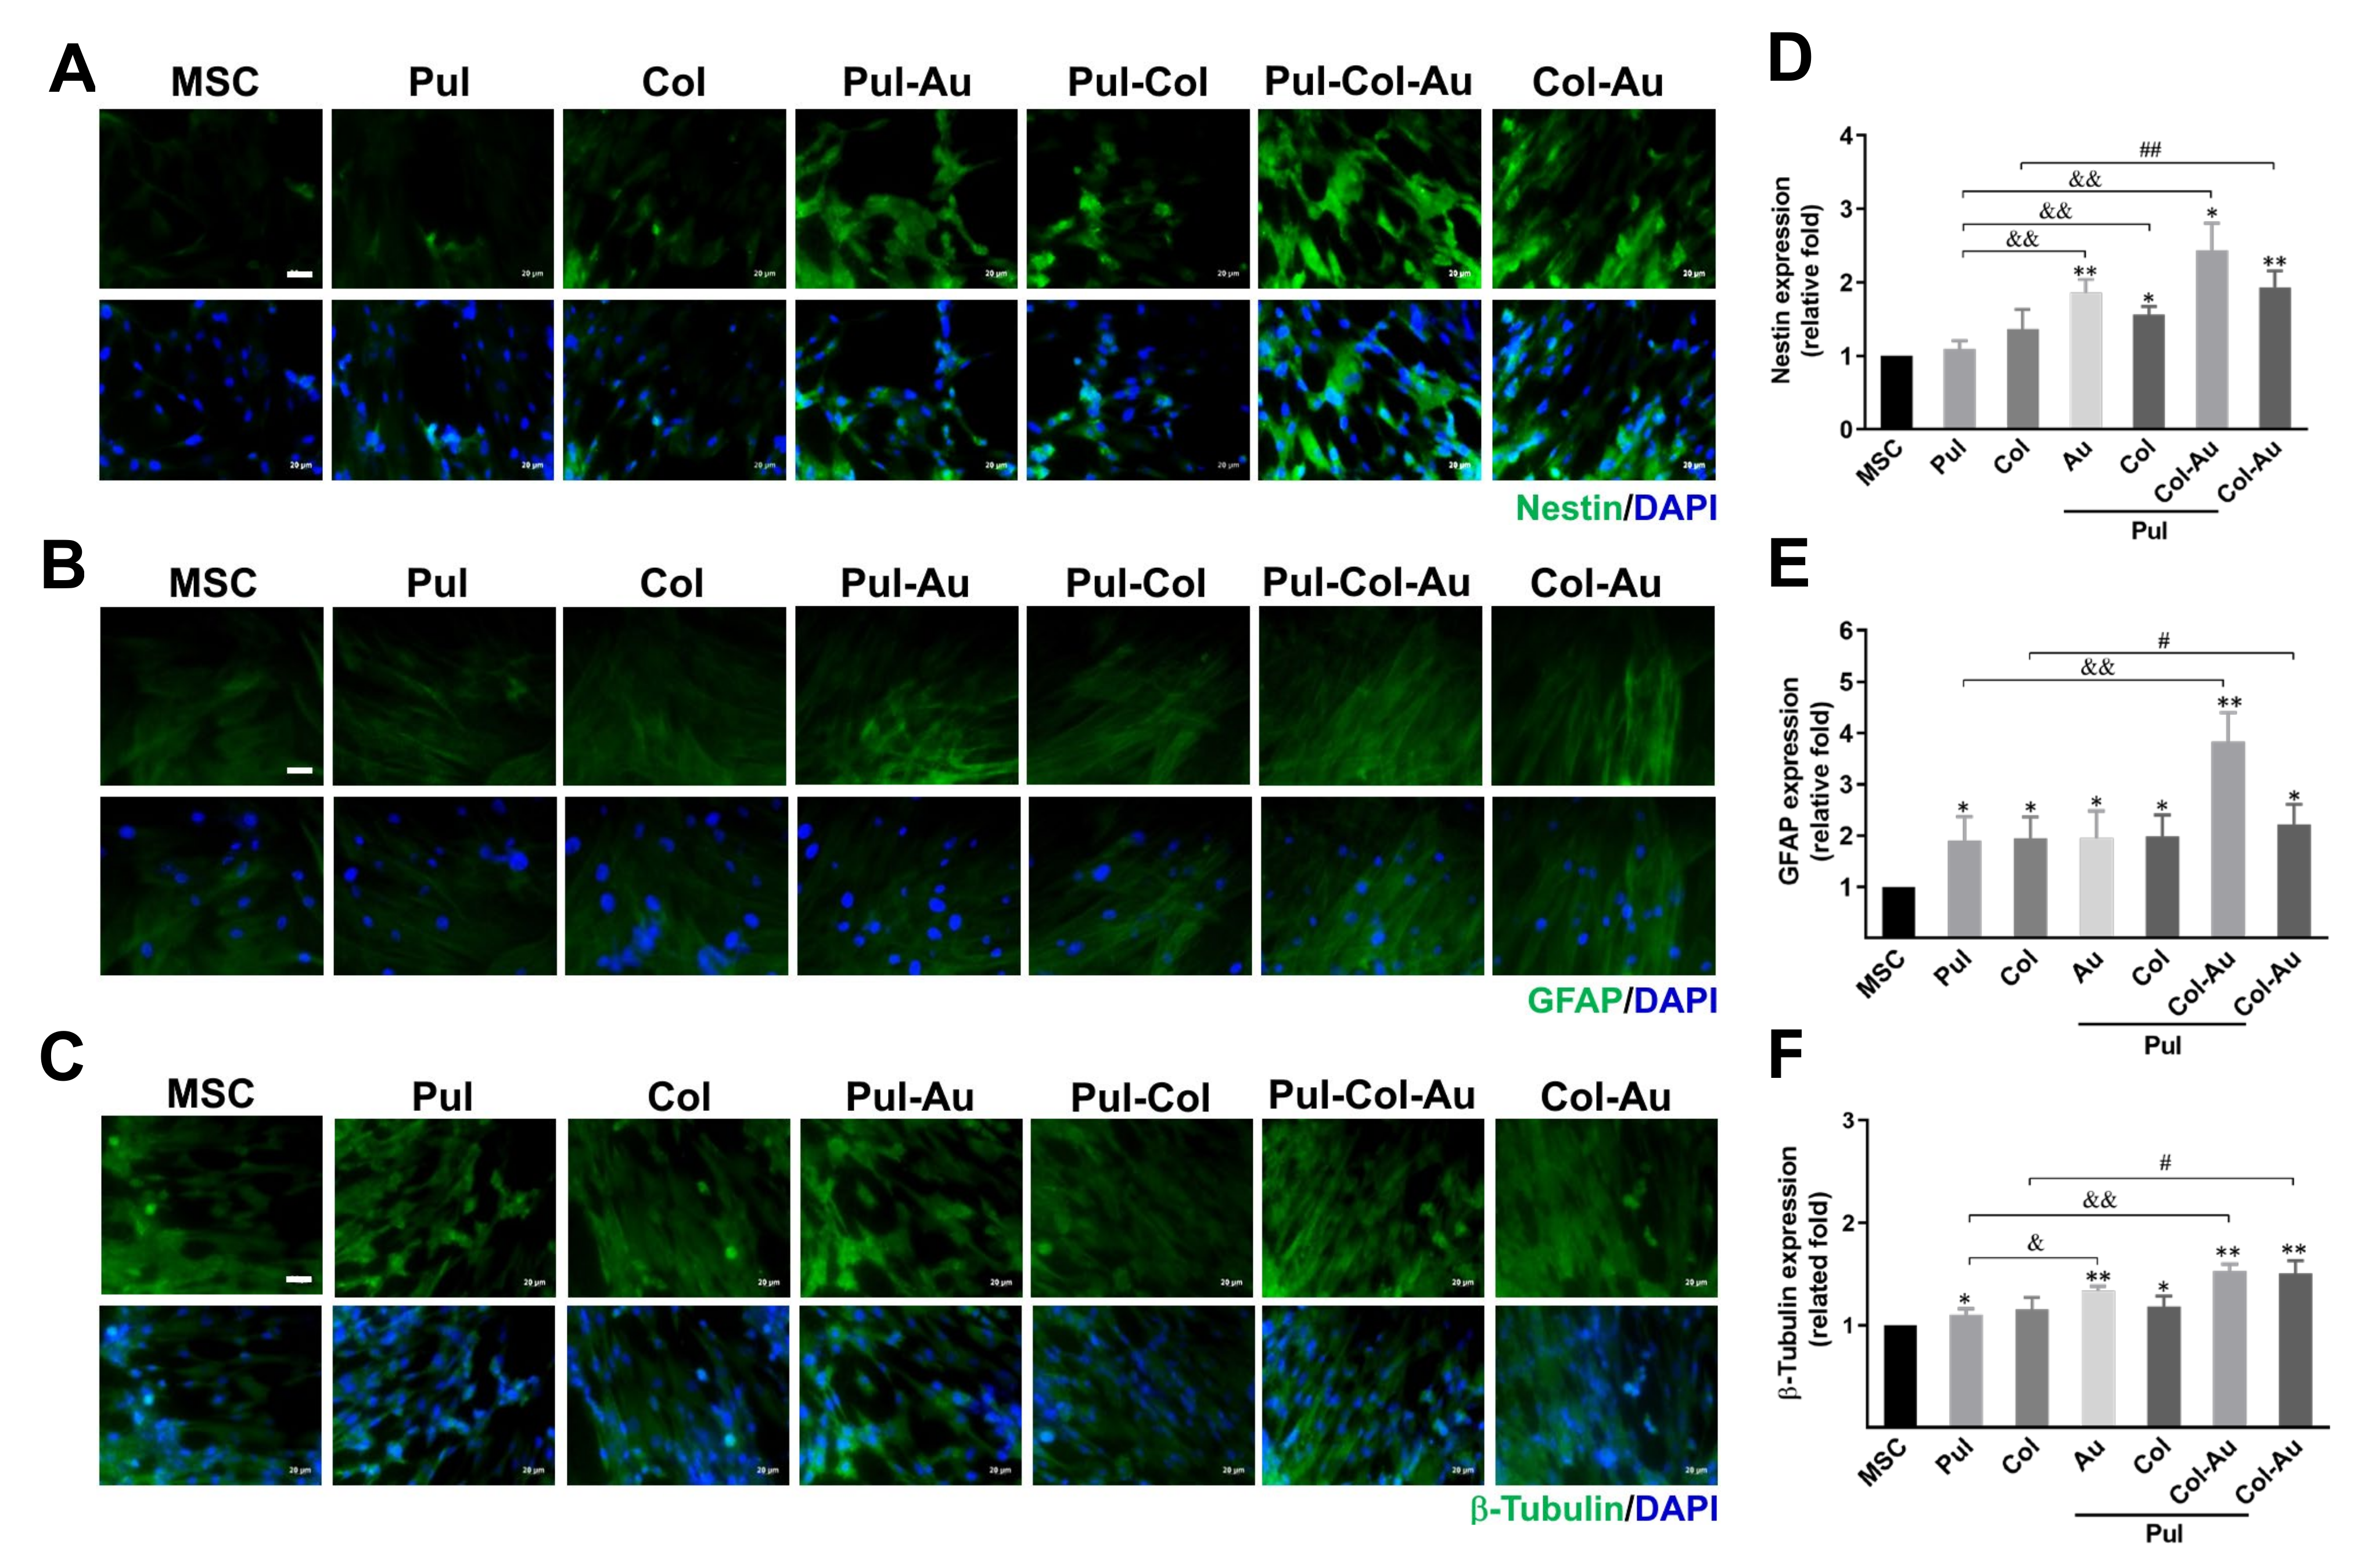
3.5. Neuronal Differentiation Capacity Induced by Pul–Col–Au Nanocomposites
3.6. Subcutaneous Implantation for Pul–Col–Au Nanocomposites
4. Discussion
5. Conclusions
Supplementary Materials
Author Contributions
Funding
Institutional Review Board Statement
Informed Consent Statement
Data Availability Statement
Acknowledgments
Conflicts of Interest
References
- Dąbrowska, A.; Spano, F.; Derler, S.; Adlhart, C.; Spencer, N.D.; Rossi, R.M.J.S.R. The relationship between skin function, barrier properties, and body-dependent factors. Skin Res. Technol. 2018, 24, 165–174. [Google Scholar] [CrossRef] [PubMed]
- Proksch, E.; Brandner, J.M.; Jensen, J.M.J. The skin: An indispensable barrier. Exp. Dermatol. 2008, 17, 1063–1072. [Google Scholar] [CrossRef] [PubMed]
- Yu, C.; Hu, Z.-Q.; Peng, R.-Y.J. Effects and mechanisms of a microcurrent dressing on skin wound healing: A review. Mil. Med. Res. 2014, 1, 1–8. [Google Scholar] [CrossRef]
- Costa, C.; De Pasquale, R.; Silvari, V.; Barbaro, M.; Catania, S. In vitro evaluation of oxidative damage from organic solvent vapours on human skin. Toxicol. In Vitro 2006, 20, 324–331. [Google Scholar] [CrossRef]
- Weng, T.; Wu, P.; Zhang, W.; Zheng, Y.; Li, Q.; Jin, R.; Chen, H.; You, C.; Guo, S.; Han, C. Regeneration of skin appendages and nerves: Current status and further challenges. J. Transl. Med. 2020, 18, 1–17. [Google Scholar] [CrossRef] [PubMed]
- Yang, S.; Leong, K.-F.; Du, Z.; Chua, C.-K. The design of scaffolds for use in tissue engineering. Part, I. Traditional factors. Tissue Eng. 2001, 7, 679–689. [Google Scholar] [CrossRef] [PubMed]
- Harrison, C.A.; MacNeil, S.J.B. The mechanism of skin graft contraction: An update on current research and potential future therapies. Burns 2008, 34, 153–163. [Google Scholar] [CrossRef] [PubMed]
- Leon-Villapalos, J.; Eldardiri, M.; Dziewulski, P.J.C.; Banking, T. The use of human deceased donor skin allograft in burn care. Cell Tissue Bank. 2010, 11, 99–104. [Google Scholar] [CrossRef] [PubMed]
- Priya, S.G.; Jungvid, H.; Kumar, A. Skin tissue engineering for tissue repair and regeneration. Tissue Eng. Part B Rev. 2008, 14, 105–118. [Google Scholar] [CrossRef] [PubMed]
- Boyce, S.T.; Kagan, R.J.; Meyer, N.A.; Yakuboff, K.P.; Warden, G.D. The 1999 clinical research award cultured skin substitutes combined with integra artificial skin to replace native skin autograft and allograft for the closure of excised full–thickness burns. J. Burn Care Rehabil. 1999, 20, 453–461. [Google Scholar] [CrossRef] [PubMed]
- Raghavan, K.V.; Babu, M.; Rajaram, R.; Purna Sai, K. Efficacy of frog skin lipids in wound healing. Lipids Health Dis. 2010, 9, 1–7. [Google Scholar] [CrossRef] [PubMed]
- Alibardi, L. Immunolocalization of keratin-associated beta-proteins (beta-keratins) in the regenerating lizard epidermis indicates a new process for the differentiation of the epidermis in lepidosaurians. J. Morphol. 2012, 273, 1272–1279. [Google Scholar] [CrossRef] [PubMed]
- Ge, L.; Zhang, X.; Cao, C.; Gu, Z.; Liu, Z.; Liu, L.; Lin, B. Feasibility study of the sterilization of pigskin used as wound dressings by neutral electrolyzed water. J. Trauma. Acute Care Surg. 2012, 72, 1584–1587. [Google Scholar] [CrossRef] [PubMed]
- Griffith, L.G.; Naughton, G. Tissue engineering-Current challenges and expanding opportunities. Science 2002, 295, 1009–1014. [Google Scholar] [CrossRef]
- Fan, X.; Chen, K.; He, X.; Li, N.; Huang, J.; Tang, K.; Li, Y.; Wang, F. Nano-TiO2/collagen-chitosan porous scaffold for wound repairing. Int. J. Biol. Macromol. 2016, 91, 15–22. [Google Scholar] [CrossRef]
- MacNeil, S. Progress and opportunities for tissue-engineered skin. Nature 2007, 445, 874–880. [Google Scholar] [CrossRef] [PubMed]
- Ahangar, P.; Woodward, M.; Cowin, A.J. Advanced wound therapies. Wound Pract. Res. J. Aust. Wound Manag. Assoc. 2018, 26, 58–68. [Google Scholar]
- Bello, Y.M.; Falabella, A.F.; Eaglstein, W.H. Tissue-engineered skin. Am. J. Clin. Dermatol. 2001, 2, 305–313. [Google Scholar] [CrossRef] [PubMed]
- Noordenbos, J.; Doré, C.; Hansbrough, J.F. Safety and efficacy of TransCyte* for the treatment of partial-thickness burns. J. Burn Care Rehabil. 1999, 20, 275–281. [Google Scholar] [CrossRef] [PubMed]
- Hansen, S.L.; Voigt, D.W.; Wiebelhaus, P.; Paul, C.N. Using skin replacement products to treat burns and wounds. Adv. Ski. Wound Care 2001, 14, 37–46. [Google Scholar] [CrossRef] [PubMed]
- Hart, C.E.; Loewen-Rodriguez, A.; Lessem, J. Dermagraft: Use in the treatment of chronic wounds. Adv. Wound Care 2012, 1, 138–141. [Google Scholar] [CrossRef] [PubMed]
- Pastar, I.; Stojadinovic, O.; Yin, N.C.; Ramirez, H.; Nusbaum, A.G.; Sawaya, A.; Patel, S.B.; Khalid, L.; Isseroff, R.R.; Tomic-Canic, M. Epithelialization in wound healing: A comprehensive review. Adv. Wound Care 2014, 3, 445–464. [Google Scholar] [CrossRef] [PubMed]
- Moustafa, M.; Simpson, C.; Glover, M.; Dawson, R.; Tesfaye, S.; Creagh, F.; Haddow, D.; Short, R.; Heller, S.; MacNeil, S. A new autologous keratinocyte dressing treatment for non-healing diabetic neuropathic foot ulcers. Diabet. Med. 2004, 21, 786–789. [Google Scholar] [CrossRef]
- Caplan, A.I. Mesenchymal stem cells. J. Orthop. Res. 1991, 9, 641–650. [Google Scholar] [CrossRef] [PubMed]
- Caplan, A.I.; Bruder, S.P. Mesenchymal stem cells: Building blocks for molecular medicine in the 21st century. Trends Mol. Med. 2001, 7, 259–264. [Google Scholar] [CrossRef]
- Hung, H.-S.; Chang, C.-H.; Chang, C.-J.; Tang, C.-M.; Kao, W.-C.; Lin, S.-Z.; Hsieh, H.-H.; Chu, M.-Y.; Sun, W.-S.; Hsu, S.-h. In vitro study of a novel nanogold-collagen composite to enhance the mesenchymal stem cell behavior for vascular regeneration. PLoS ONE 2014, 9, e104019. [Google Scholar] [CrossRef] [PubMed]
- Hung, H.-S.; Tang, C.-M.; Lin, C.-H.; Lin, S.-Z.; Chu, M.-Y.; Sun, W.-S.; Kao, W.-C.; Hsien-Hsu, H.; Huang, C.-Y.; Hsu, S.-h. Biocompatibility and favorable response of mesenchymal stem cells on fibronectin-gold nanocomposites. PLoS ONE 2013, 8, e65738. [Google Scholar] [CrossRef] [PubMed]
- Pannu, J.; Trojanowska, M. Recent advances in fibroblast signaling and biology in scleroderma. Curr. Opin. Rheumatol. 2004, 16, 739–745. [Google Scholar] [CrossRef]
- Darby, I.A.; Hewitson, T.D. Fibroblast differentiation in wound healing and fibrosis. Int. Rev. Cytol. 2007, 257, 143–179. [Google Scholar]
- Zimmerman, A.; Bai, L.; Ginty, D.D. The gentle touch receptors of mammalian skin. Science 2014, 346, 950–954. [Google Scholar] [CrossRef] [PubMed]
- Singh, R.; Saini, G. Pullulan-hyperproducing color variant strain of Aureobasidium pullulans FB-1 newly isolated from phylloplane of Ficus sp. Bioresour. Technol. 2008, 99, 3896–3899. [Google Scholar] [CrossRef] [PubMed]
- Lack, S.; Dulong, V.; Le Cerf, D.; Picton, L.; Argillier, J.F.; Muller, G. Hydrogels based on pullulan crosslinked with sodium trimetaphosphate (STMP): Rheological study. Polym. Bull. 2004, 52, 429–436. [Google Scholar] [CrossRef]
- Nicholas, M.N.; Jeschke, M.G.; Amini-Nik, S. Cellularized bilayer pullulan-gelatin hydrogel for skin regeneration. Tissue Eng. Part A 2016, 22, 754–764. [Google Scholar] [CrossRef]
- Di Lullo, G.A.; Sweeney, S.M.; Korkko, J.; Ala-Kokko, L.; San Antonio, J.D. Mapping the ligand-binding sites and disease-associated mutations on the most abundant protein in the human, type I collagen. J. Biol. Chem. 2002, 277, 4223–4231. [Google Scholar] [CrossRef] [PubMed]
- Cummings, C.L.; Gawlitta, D.; Nerem, R.M.; Stegemann, J.P. Properties of engineered vascular constructs made from collagen, fibrin, and collagen–fibrin mixtures. Biomaterials 2004, 25, 3699–3706. [Google Scholar] [CrossRef] [PubMed]
- Shen, Y.H.; Shoichet, M.S.; Radisic, M. Vascular endothelial growth factor immobilized in collagen scaffold promotes penetration and proliferation of endothelial cells. Acta Biomater. 2008, 4, 477–489. [Google Scholar] [CrossRef]
- Wong, V.W.; Rustad, K.C.; Galvez, M.G.; Neofytou, E.; Glotzbach, J.P.; Januszyk, M.; Major, M.R.; Sorkin, M.; Longaker, M.T.; Rajadas, J. Engineered pullulan–collagen composite dermal hydrogels improve early cutaneous wound healing. Tissue Eng. Part A 2011, 17, 631–644. [Google Scholar] [CrossRef] [PubMed]
- Gu, H.-Y.; Chen, Z.; Sa, R.-X.; Yuan, S.-S.; Chen, H.-Y.; Ding, Y.-T.; Yu, A.-M. The immobilization of hepatocytes on 24 nm-sized gold colloid for enhanced hepatocytes proliferation. Biomaterials 2004, 25, 3445–3451. [Google Scholar] [CrossRef] [PubMed]
- Hu, M.; Chen, J.; Li, Z.-Y.; Au, L.; Hartland, G.V.; Li, X.; Marquez, M.; Xia, Y. Gold nanostructures: Engineering their plasmonic properties for biomedical applications. Chem. Soc. Rev. 2006, 35, 1084–1094. [Google Scholar] [CrossRef]
- Hung, H.-S.; Yang, Y.-C.; Lin, Y.-C.; Lin, S.-Z.; Kao, W.-C.; Hsieh, H.-H.; Chu, M.-Y.; Fu, R.-H.; Hsu, S.-h. Regulation of human endothelial progenitor cell maturation by polyurethane nanocomposites. Biomaterials 2014, 35, 6810–6821. [Google Scholar] [CrossRef] [PubMed]
- Ding, D.-C.; Shyu, W.-C.; Chiang, M.-F.; Lin, S.-Z.; Chang, Y.-C.; Wang, H.-J.; Su, C.-Y.; Li, H. Enhancement of neuroplasticity through upregulation of β1-integrin in human umbilical cord-derived stromal cell implanted stroke model. Neurobiol. Dis. 2007, 27, 339–353. [Google Scholar] [CrossRef]
- Huang, C.-Y.; Lin, C.-H.; Ho, T.-T.; Chen, H.-C.; Chu, M.-Y.; Sun, W.-S.; Kao, W.-C.; Hung, H.-S.; Hsu, S.-h. Enhanced migration of wharton’s jelly mesenchymal stem cells grown on polyurethane nanocomposites. J. Med. Biol. Eng 2013, 33, 139–148. [Google Scholar] [CrossRef]
- Hung, H.S.; Chu, M.Y.; Lin, C.H.; Wu, C.C.; Hsu, S.h. Mediation of the migration of endothelial cells and fibroblasts on polyurethane nanocomposites by the activation of integrin-focal adhesion kinase signaling. J. Biomed. Mater. Res. Part A 2012, 100, 26–37. [Google Scholar] [CrossRef]
- Chou, C.W.; Hsu, S.h.; Wang, P.H. Biostability and biocompatibility of poly (ether) urethane containing gold or silver nanoparticles in a porcine model. J. Biomed. Mater. Res. Part A 2008, 84, 785–794. [Google Scholar]
- Charbonneau, H.; Tonks, N.K.; Walsh, K.A.; Fischer, E.H. The leukocyte common antigen (CD45): A putative receptor-linked protein tyrosine phosphatase. Proc. Natl. Acad. Sci. 1988, 85, 7182–7186. [Google Scholar] [CrossRef] [PubMed]
- Soldano, S.; Trombetta, A.C.; Contini, P.; Tomatis, V.; Ruaro, B.; Brizzolara, R.; Montagna, P.; Sulli, A.; Paolino, S.; Pizzorni, C. Increase in circulating cells coexpressing M1 and M2 macrophage surface markers in patients with systemic sclerosis. Ann. Rheum. Dis. 2018, 77, 1842–1845. [Google Scholar] [CrossRef] [PubMed]
- Li, X.; Wang, L.; Fan, Y.; Feng, Q.; Cui, F.-z. Biocompatibility and toxicity of nanoparticles and nanotubes. J. Nanomater. 2012, 2012. [Google Scholar] [CrossRef]
- Shukla, R.; Bansal, V.; Chaudhary, M.; Basu, A.; Bhonde, R.R.; Sastry, M. Biocompatibility of gold nanoparticles and their endocytotic fate inside the cellular compartment: A microscopic overview. Langmuir 2005, 21, 10644–10654. [Google Scholar] [CrossRef]
- Phadtare, S.; Kumar, A.; Vinod, V.; Dash, C.; Palaskar, D.V.; Rao, M.; Shukla, P.G.; Sivaram, S.; Sastry, M. Direct assembly of gold nanoparticle “shells” on polyurethane microsphere “cores” and their application as enzyme immobilization templates. Chem. Mater. 2003, 15, 1944–1949. [Google Scholar] [CrossRef]
- Nejati, K.; Dadashpour, M.; Gharibi, T.; Mellatyar, H.; Akbarzadeh, A. Biomedical Applications of Functionalized Gold Nanoparticles: A Review. J. Clust. Sci. 2021, 1–16. [Google Scholar] [CrossRef]
- Borzenkov, M.; Chirico, G.; d’Alfonso, L.; Sironi, L.; Collini, M.; Cabrini, E.; Dacarro, G.; Milanese, C.; Pallavicini, P.; Taglietti, A. Thermal and chemical stability of thiol bonding on gold nanostars. Langmuir 2015, 31, 8081–8091. [Google Scholar] [CrossRef] [PubMed]
- Fortini, C.; Toffoletto, B.; Fucili, A.; Puppato, E.; Olivares, A.; Beltrami, A.P.; Fiorelli, V.; Bergamin, N.; Cesselli, D.; Morelli, C. Circulating stem cell vary with NYHA stage in heart failure patients. J. Cell. Mol. Med. 2011, 15, 1726–1736. [Google Scholar] [CrossRef] [PubMed]
- Liu, L.; Yu, Q.; Lin, J.; Lai, X.; Cao, W.; Du, K.; Wang, Y.; Wu, K.; Hu, Y.; Zhang, L. Hypoxia-inducible factor-1α is essential for hypoxia-induced mesenchymal stem cell mobilization into the peripheral blood. Stem Cells Dev. 2011, 20, 1961–1971. [Google Scholar] [CrossRef] [PubMed]
- Weidt, C.; Niggemann, B.; Kasenda, B.; Drell, T.L.; Zanker, K.S.; Dittmar, T. Stem cell migration: A quintessential stepping stone to successful therapy. Curr. Stem Cell Res. Ther. 2007, 2, 89–103. [Google Scholar] [CrossRef]
- Caplan, A.I.; Dennis, J.E. Mesenchymal stem cells as trophic mediators. J. Cell. Biochem. 2006, 98, 1076–1084. [Google Scholar] [CrossRef]
- Rosada, C.; Justesen, J.; Melsvik, D.; Ebbesen, P.; Kassem, M. The human umbilical cord blood: A potential source for osteoblast progenitor cells. Calcif. Tissue Int. 2003, 72, 135–142. [Google Scholar] [CrossRef]
- Gronthos, S.; Franklin, D.M.; Leddy, H.A.; Robey, P.G.; Storms, R.W.; Gimble, J.M. Surface protein characterization of human adipose tissue-derived stromal cells. J. Cell. Physiol. 2001, 189, 54–63. [Google Scholar] [CrossRef] [PubMed]
- Noort, W.; Scherjon, S.; Kleijburg-Van Der Keur, C.; Kruisselbrink, A.; Van Bezooijen, R.; Beekhuizen, W.; Willemze, R.; Kanhai, H.; Fibbe, W. Mesenchymal stem cells in human second-trimester bone marrow, liver, lung, and spleen exhibit a similar immunophenotype but a heterogeneous multilineage differentiation potential. Haematologica 2003, 88, 845–852. [Google Scholar]
- Wislet-Gendebien, S.; Bruyère, F.; Hans, G.; Leprince, P.; Moonen, G.; Rogister, B. Nestin-positive mesenchymal stem cells favour the astroglial lineage in neural progenitors and stem cells by releasing active BMP4. BMC Neurosci. 2004, 5, 33. [Google Scholar] [CrossRef]
- Guérette, D.; Khan, P.A.; Savard, P.E.; Vincent, M. Molecular evolution of type VI intermediate filament proteins. BMC Evol. Biol. 2007, 7, 164. [Google Scholar] [CrossRef]
- Jacque, C.; Vinner, C.; Kujas, M.; Raoul, M.; Racadot, J.; Baumann, N. Determination of glial fibrillary acidic protein (GFAP) in human brain tumors. J. Neurol. Sci. 1978, 35, 147–155. [Google Scholar] [CrossRef]
- Kobayashi, N.; Mundel, P. A role of microtubules during the formation of cell processes in neuronal and non-neuronal cells. Cell Tissue Res. 1998, 291, 163–174. [Google Scholar] [CrossRef]
- Woo, Y.I.; Park, B.J.; Kim, H.-L.; Lee, M.H.; Kim, J.; Yang, Y.-I.; Kim, J.K.; Tsubaki, K.; Han, D.-W.; Park, J.-C. The biological activities of (1, 3)-(1, 6)-β-D-glucan and porous electrospun PLGA membranes containing β-glucan in human dermal fibroblasts and adipose tissue-derived stem cells. Biomed. Mater. 2010, 5, 044109. [Google Scholar] [CrossRef]
- Lee, S.B.; Jeon, H.W.; Lee, Y.W.; Lee, Y.M.; Song, K.W.; Park, M.H.; Nam, Y.S.; Ahn, H.C. Bio-artificial skin composed of gelatin and (1→ 3),(1→ 6)-β-glucan. Biomaterials 2003, 24, 2503–2511. [Google Scholar] [CrossRef]
- Murray, P.J. Macrophage polarization. Annu. Rev. Physiol. 2017, 79, 541–566. [Google Scholar] [CrossRef] [PubMed]
- Krzyszczyk, P.; Schloss, R.; Palmer, A.; Berthiaume, F. The role of macrophages in acute and chronic wound healing and interventions to promote pro-wound healing phenotypes. Front. Physiol. 2018, 9, 419. [Google Scholar] [CrossRef] [PubMed]
- Assani, K. M1 to M2 Macrophage Induction Using Retinoic Acid and Mesenchymal Stem Cells Loaded on an Electrospun Pullulan/Gelatin Scaffold To Promote Healing of Chronic Wounds. Master’s Thesis, Wright State University, Dayton, OH, USA, 2018. [Google Scholar]
- Seo, S.; Na, K. Use of growth factor-loaded acetylated polysaccharide as a coating material to improve endothelialization of vascular stents. Macromol. Res. 2011, 19, 1097–1103. [Google Scholar] [CrossRef]
- Shahriari-Khalaji, M.; Hu, G.; Chen, L.; Cao, Z.; Andreeva, T.; Xiong, X.; Krastev, R.; Hong, F.F. Functionalization of Aminoalkylsilane-Grafted Bacterial Nanocellulose with ZnO-NPs-Doped Pullulan Electrospun Nanofibers for Multifunctional Wound Dressing. ACS Biomater. Sci. Eng. 2021, 7, 3933–3946. [Google Scholar] [CrossRef] [PubMed]
- Duan, Y.; Li, K.; Wang, H.; Wu, T.; Zhao, Y.; Li, H.; Tang, H.; Yang, W. Preparation and evaluation of curcumin grafted hyaluronic acid modified pullulan polymers as a functional wound dressing material. Carbohydr. Polym. 2020, 238, 116195. [Google Scholar] [CrossRef] [PubMed]
- Soubhagya, A.; Balagangadharan, K.; Selvamurugan, N.; Sathya Seeli, D.; Prabaharan, M. Preparation and characterization of chitosan/carboxymethyl pullulan/bioglass composite films for wound healing. J. Biomater. Appl. 2021, 24, 8853282211050161. [Google Scholar] [CrossRef] [PubMed]
- Barrera, J.A.; Trotsyuk, A.A.; Maan, Z.N.; Bonham, C.A.; Larson, M.R.; Mittermiller, P.A.; Henn, D.; Chen, K.; Mays, C.J.; Mittal, S. Adipose-derived stromal cells seeded in pullulan-collagen hydrogels improve healing in murine burns. Tissue Eng. Part A 2021, 27, 844–856. [Google Scholar] [CrossRef] [PubMed]
- Hung, H.-S.; Chang, K.-B.; Tang, C.-M.; Ku, T.-R.; Kung, M.-L.; Yu, A.Y.-H.; Shen, C.-C.; Yang, Y.-C.; Hsieh, H.-H.; Hsu, S.-h. Anti-Inflammatory Fibronectin-AgNP for Regulation of Biological Performance and Endothelial Differentiation Ability of Mesenchymal Stem Cells. Int. J. Mol. Sci. 2021, 22, 9262. [Google Scholar] [CrossRef] [PubMed]
- Hung, H.-S.; Kung, M.-L.; Chen, F.-C.; Ke, Y.-C.; Shen, C.-C.; Yang, Y.-C.; Tang, C.-M.; Yeh, C.-A.; Hsieh, H.-H.; Hsu, S.-h. Nanogold-Carried Graphene Oxide: Anti-Inflammation and Increased Differentiation Capacity of Mesenchymal Stem Cells. Nanomaterials 2021, 11, 2046. [Google Scholar] [CrossRef] [PubMed]
- Hung, H.-S.; Kao, W.-C.; Shen, C.-C.; Chang, K.-B.; Tang, C.-M.; Yang, M.-Y.; Yang, Y.-C.; Yeh, C.-A.; Li, J.-J.; Hsieh, H.-H. Inflammatory Modulation of Polyethylene GlyCol–AuNP for Regulation of the Neural Differentiation Capacity of Mesenchymal Stem Cells. Cells 2021, 10, 2854. [Google Scholar] [CrossRef]


Publisher’s Note: MDPI stays neutral with regard to jurisdictional claims in published maps and institutional affiliations. |
© 2021 by the authors. Licensee MDPI, Basel, Switzerland. This article is an open access article distributed under the terms and conditions of the Creative Commons Attribution (CC BY) license (https://creativecommons.org/licenses/by/4.0/).
Share and Cite
Yang, M.-Y.; Liu, B.-S.; Huang, H.-Y.; Yang, Y.-C.; Chang, K.-B.; Kuo, P.-Y.; Deng, Y.-H.; Tang, C.-M.; Hsieh, H.-H.; Hung, H.-S. Engineered Pullulan-Collagen-Gold Nano Composite Improves Mesenchymal Stem Cells Neural Differentiation and Inflammatory Regulation. Cells 2021, 10, 3276. https://doi.org/10.3390/cells10123276
Yang M-Y, Liu B-S, Huang H-Y, Yang Y-C, Chang K-B, Kuo P-Y, Deng Y-H, Tang C-M, Hsieh H-H, Hung H-S. Engineered Pullulan-Collagen-Gold Nano Composite Improves Mesenchymal Stem Cells Neural Differentiation and Inflammatory Regulation. Cells. 2021; 10(12):3276. https://doi.org/10.3390/cells10123276
Chicago/Turabian StyleYang, Meng-Yin, Bai-Shuan Liu, Hsiu-Yuan Huang, Yi-Chin Yang, Kai-Bo Chang, Pei-Yeh Kuo, You-Hao Deng, Cheng-Ming Tang, Hsien-Hsu Hsieh, and Huey-Shan Hung. 2021. "Engineered Pullulan-Collagen-Gold Nano Composite Improves Mesenchymal Stem Cells Neural Differentiation and Inflammatory Regulation" Cells 10, no. 12: 3276. https://doi.org/10.3390/cells10123276
APA StyleYang, M.-Y., Liu, B.-S., Huang, H.-Y., Yang, Y.-C., Chang, K.-B., Kuo, P.-Y., Deng, Y.-H., Tang, C.-M., Hsieh, H.-H., & Hung, H.-S. (2021). Engineered Pullulan-Collagen-Gold Nano Composite Improves Mesenchymal Stem Cells Neural Differentiation and Inflammatory Regulation. Cells, 10(12), 3276. https://doi.org/10.3390/cells10123276