Article

NK and T Cell Immunological Signatures in Hospitalized Patients with COVID-19

Respiratory Diseases Unit, Department of Medical Sciences, University Hospital of Siena (Azienda Ospedaliera Universitaria Senese. AOUS), Viale Bracci, 53100 Siena, Italy
*
Author to whom correspondence should be addressed.
These authors equally contributed to the study.
Cells 2021, 10(11), 3182; https://doi.org/10.3390/cells10113182
Submission received: 19 October 2021 / Revised: 9 November 2021 / Accepted: 11 November 2021 / Published: 15 November 2021
(This article belongs to the Special Issue New Developments of Natural Killer (NK) Cells in Immunotherapy)

Abstract

:
Severe acute respiratory syndrome caused by coronavirus 2 emerged in Wuhan (China) in December 2019 and has severely challenged the human population. NK and T cells are involved in the progression of COVID-19 infection through the ability of NK cells to modulate T-cell responses, and by the stimulation of cytokine release. No detailed investigation of the NK cell landscape in clinical SARS-CoV-2 infection has yet been reported. A total of 35 COVID-19 hospitalised patients were stratified for clinical severity and 17 healthy subjects were enrolled. NK cell subsets and T cell subsets were analysed with flow cytometry. Serum cytokines were detected with a bead-based multiplex assay. Fewer CD56dimCD16brightNKG2A+NK cells and a parallel increase in the CD56+CD69+NK, CD56+PD-1+NK, CD56+NKp44+NK subset were reported in COVID-19 than HC. A significantly higher adaptive/memory-like NK cell frequency in patients with severe disease than in those with mild and moderate phenotypes were reported. Moreover, adaptive/memory-like NK cell frequencies were significantly higher in patients who died than in survivors. Severe COVID-19 patients showed higher serum concentrations of IL-6 than mild and control groups. Direct correlation emerged for IL-6 and adaptive/memory-like NK. All these findings provide new insights into the immune response of patients with COVID-19. In particular, they demonstrate activation of NK through overexpression of CD69 and CD25 and show that PD-1 inhibitory signalling maintains an exhausted phenotype in NK cells. These results suggest that adaptive/memory-like NK cells could be the basis of promising targeted therapy for future viral infections.

Graphical Abstract

1. Introduction

Severe acute respiratory syndrome caused by coronavirus 2 (SARS-CoV-2) emerged in Wuhan (China) in December 2019 [1] and has severely challenged the human population [2]. Patients with COVID-19 show various clinical patterns, ranging from mild to severe forms, the latter characterised by acute respiratory distress syndrome (ARDS), multi-organ failure and high risk of death [3]. Immune dysregulation and hyperactivation caused by the infection, in particular overproduction of cytokines known as the “cytokine storm”, leading to systemic hyper-inflammatory status, were extensively studied [4,5,6,7,8]. Although several studies have investigated the role of cytokines and related cell-mediated responses, little data is yet available on the role of innate immunity and its possible contribution to host responses and disease progression.
NK cells are large granular lymphocytes, considered as the cells of the innate immune system with cytolytic activity against different targets such as tumour-derived or virus-infected cells [7]. These cells release granules that contain different acid hydrolases, such as acid phosphatase, naphthyl acetate-esterase and glucuronidase [8].
Specific aspects of NK cell biology, such as maturation, diversity and adaptive capacity, have become much clearer in the last few years [9], supporting their crucial role in first-line defence against viral infections and cancer [10,11,12,13,14]. NK cells are typically classified into cytokine-producing CD56bright NK cells and cytotoxic CD56dim NK cells [11]. These cells are activated when their target cells do not express MHC-I molecules. In the last year, activating receptors, including NKG2C, NKG2D and DNAM-1, and natural cytotoxicity receptors, including NKp30, NKp44 and NKp46, were characterised [15,16,17,18,19,20,21]. Other receptors, including killer Ig-like receptors (KIRs) and the CD94:NKG2A heterodimer, as well as immune checkpoints, such as PD-1, express inhibition [13]. NK cells not only have the capacity to directly target and kill infected cells but can also influence adaptive T-cell responses [18,19]. The ability of NK cells to modulate T-cell responses can be mediated through direct T–NK interactions, cytokine production, or indirectly through dendritic cells and other cell types [18].
No detailed investigation of the NK cell landscape in clinical SARS-CoV-2 infection has yet been reported. Like T and B cells, NK cells appear to be fewer in number in patients developing severe COVID-19 and to overexpress NKG2A inhibitory receptor and PD-1 on the cell surface [22,23,24,25]. The aim of the present study was to clarify the role of NK cell and T cell subsets during SARS-CoV-2 infection in hospitalised patients with COVID-19, in an endeavour to discover potential relationships within the severity of the disease.

2. Materials and Methods

2.1. Study Population

Thirty-five patients hospitalised with COVID-19, confirmed by SARS-CoV-2 RNA-positive nasopharyngeal swab and seventeen healthy sex- and age-matched controls were enrolled in the study. Demographic and clinical data and radiological and immunological features, as well as serum concentrations of inflammatory biomarkers, were entered in a pre-specified electronic database. The study population was stratified into three subgroups (mild, moderate and severe) according to COVID-19 severity. The mild subgroup required pharmacological treatment and only low-flow oxygen therapy; the moderate subgroup needed high-flow oxygen therapy and/or non-invasive mechanical ventilation; severe patients were admitted to intensive care and underwent mechanical ventilation with orotracheal intubation. A key inclusion criterion for the study population was documentation of monolateral or bilateral pneumonia by chest X-ray or high resolution computed tomography (HRCT).
Blood samples for immunological studies were collected within 24–48 h of emergency room admission and before administration of any antiviral agents, steroids and/or immunosuppressants. Serum aliquots and peripheral blood were stored at −80 °C until assay.
All patients gave their written informed consent to the study that was approved by our local ethics committee (BIOBANCA-MIU-2010. MARKERLUNG 17431).

2.2. Preparation and Storage of PBMCs

Cytofluorimetric analysis was performed at Siena University respiratory diseases laboratory in the period April 2020 to April 2021. Briefly, the peripheral blood samples were collected and processed within 8 h Ficoll density gradient separation was performed through Ficoll Histopaque®-1077 (Sigma-Aldrich, Burlington, MA, USA) as previously reported Live cell counts were performed in a Burker chamber. Aliquots of 3 × 10⁶ cells were stored in liquid nitrogen in a standardised manner as previously reported [26,27,28,29,30]. All experiments were performed after thawing under the same conditions.

2.3. Antibodies

The following mAbs were used to detect surface markers: anti-CD3 APC-Cy7 (clone: UCHT1), CD14 APC-Cy7 (HCD14), CD16 BV510 (3G8), CD19 APC-Cy7 (HIB19), CD25 BV421 (BC96), CD69 BV421 (FN50), CD56 PE-Cy7 (HCD56), CD4 FITC (RPAT4) and CD62L (DREG-56), all IgG1 isotypes from Biolegend. CD57 VioBlue (TB03. isotype IgM) CD159C PE (REA 205, isotype IgG1), CD279 PE (PD1.3.1.3. isotype: IgG2B), CD8 Vioblue (REA734 isotype IgG1) and CD45RA PE-Vio770 (REA 562. isotype IgG1) were from Miltenyi Biotech Bergisch, Gladbach, Germany, CD158a FITC (HP-3E4 isotype IgM), CD158b FITC (CH-L. isotype IgG2b) and CD27 BV510 (L128. isotype IgG1) were from BD Biosciences. CA. USA. CD159a APC (Z199. isotype IgG2b) and CD336 PE (Z231. Isotype IgG1) were from Beckman Coulter, (Beckman Coulter. 250 S. Kraemer Blvd, Brea, CA 92821, USA).

2.4. Flow Cytometry Analysis of NK and T Cells

For multiparametric flow cytometry analysis, we used a standard staining protocol for extracellular markers [26]. Briefly, cells were washed with wash buffer (HBSS−/− with 2% FBS) and incubated with Ab mix for 30 min in the dark at RT. Samples were acquired using BD FACS Canto II (BD Biosciences). The optimal concentration of all Abs used in the study was defined by titration. In line with the guidelines for accurate multicolour flow cytometry analysis, we used fluorescence minus one (FMO) controls.
For analysis of NK cells, three tubes were processed. All tubes contained the following mix of mAbs: CD3APC-Cy7, CD14APC-Cy7, CD16BV510, CD19APC-Cy7. CD56PE-Cy7 (HCD56), KIR2DL1 (CD158a) FITC, KIR2DL2 (CD158b) FITC and NKG2A (CD159a) APC.
CD57 VioBlue and NKG2C (CD159C) PE. CD69 BV421 and PD-1 (CD279) PE, and CD25 BV421 and NKp44 (CD336) PE were added to the first, second and third tubes. respectively. We used a panel of anti-CD3 APC-Cy7. CD4 FITC. CD62L PE. CD8 Vioblue. CD45RA PE-Vio770 and CD27 BV510 to detect T-cell maturation.
We studied maturation of CD4+ and CD8+ T cells. A first gate was set to “forward” and “side” scatter, and a second gate was set to separate CD3+ cells. Among CD3+ we identified CD4+ and CD8+ lymphocytes. From the CD4+ population, we selected CD45RA cells. T central memory (Tcm) phenotypes (CD4+CD62L++CD27++) and T effector cells (CD4+CD62LCD27+/−). From the CD8+ population, we selected CD45RA cells. T central memory (Tcm) phenotypes (CD8+ CD62L++CD27++) and T effector cells (CD8+ CD62LCD27+/−). As well, CD4+ T and CD8+ T cells clustered as T naive (Tn) and T stem cell memory (TSCM) based on expression of CD45RA: CD4+CD45RA+CD27+++CD62L+++ (CD4Tn/scm) and CD8+CD45RA+CD27+++CD62L+++ (CD8Tn/scm). All gate strategy were reported in Supplementary Figure S1.

2.5. Immunoassay

Serum concentrations of biomarkers including IL-6, sFAS, sFASL, granzyme A, granzyme B, perforin and granulysin were quantified by bead-based multiplex LEGENDplex™ analysis (LEGENDplex™ Custom Human Assay Biolegend. 8999 BioLegend Way, San Diego, CA 92121, USA) according to the manufacturer’s instructions. Reactions were run in duplicate with a BD FACSCantoII flow cytometer (BD Biosciences, San Jose, CA, USA). The data were processed with Legendplex V8.0 software (Biolegend) and concentrations were expressed in pg/mL.

3. Statistical Analysis

The results were expressed as means and standard deviations (SD) or medians and quartiles (25th and 75th percentiles) for continuous variables, as appropriate. One-way ANOVA nonparametric test (Kruskal–Wallis test) and Dunn test were used for multiple comparisons, while the Mann–Whitney U test was used for two-group comparisons. The Chi-squared test was used for categorical variables. Sensitivity and specificity by ROC curve were used to describe accuracy for the different cell subsets. The Youden index (J = max (sensitivity+specificity-1)) was used to establish the best cut-offs. The Spearman test was used to look for correlations between immunological and clinical data. A p-value less than 0.05 was considered statistically significant. Statistical analysis and graphic representation of the data were performed by GraphPad Prism 9.0 software.
Principal Components Analysis with heatmap was performed using BioVinci software (BioTuring Inc., San Diego, CA, USA). PCA was used to reduce the dimensionality of the data hyperspace and Hierarchical Heatmaps was used for sample clustering based on cell composition. The cell subsets of patients were used to create a decision tree model to determine the best clustering variables according to the Gini criterion.

4. Results

4.1. Data of Patients

Demographic data, blood cell count, clinical data, radiological features and immunological findings are reported in Table 1. There was a prevalence of males in the groups of patients (28/35).
Regarding clinical status. 85% of patients showed at least two symptoms at onset. fever being the most common (86%). Only four patients (12.5%) did not have a history of any medical or surgical comorbidity.
Regarding blood parameters, neutrophil and lymphocyte counts were significantly lower in severe COVID-19 patients than in the other groups (p = 0.002 and p = 0.03. respectively), whereas CRP was significantly higher in severe patients than in the other severity groups (p = 0.012).

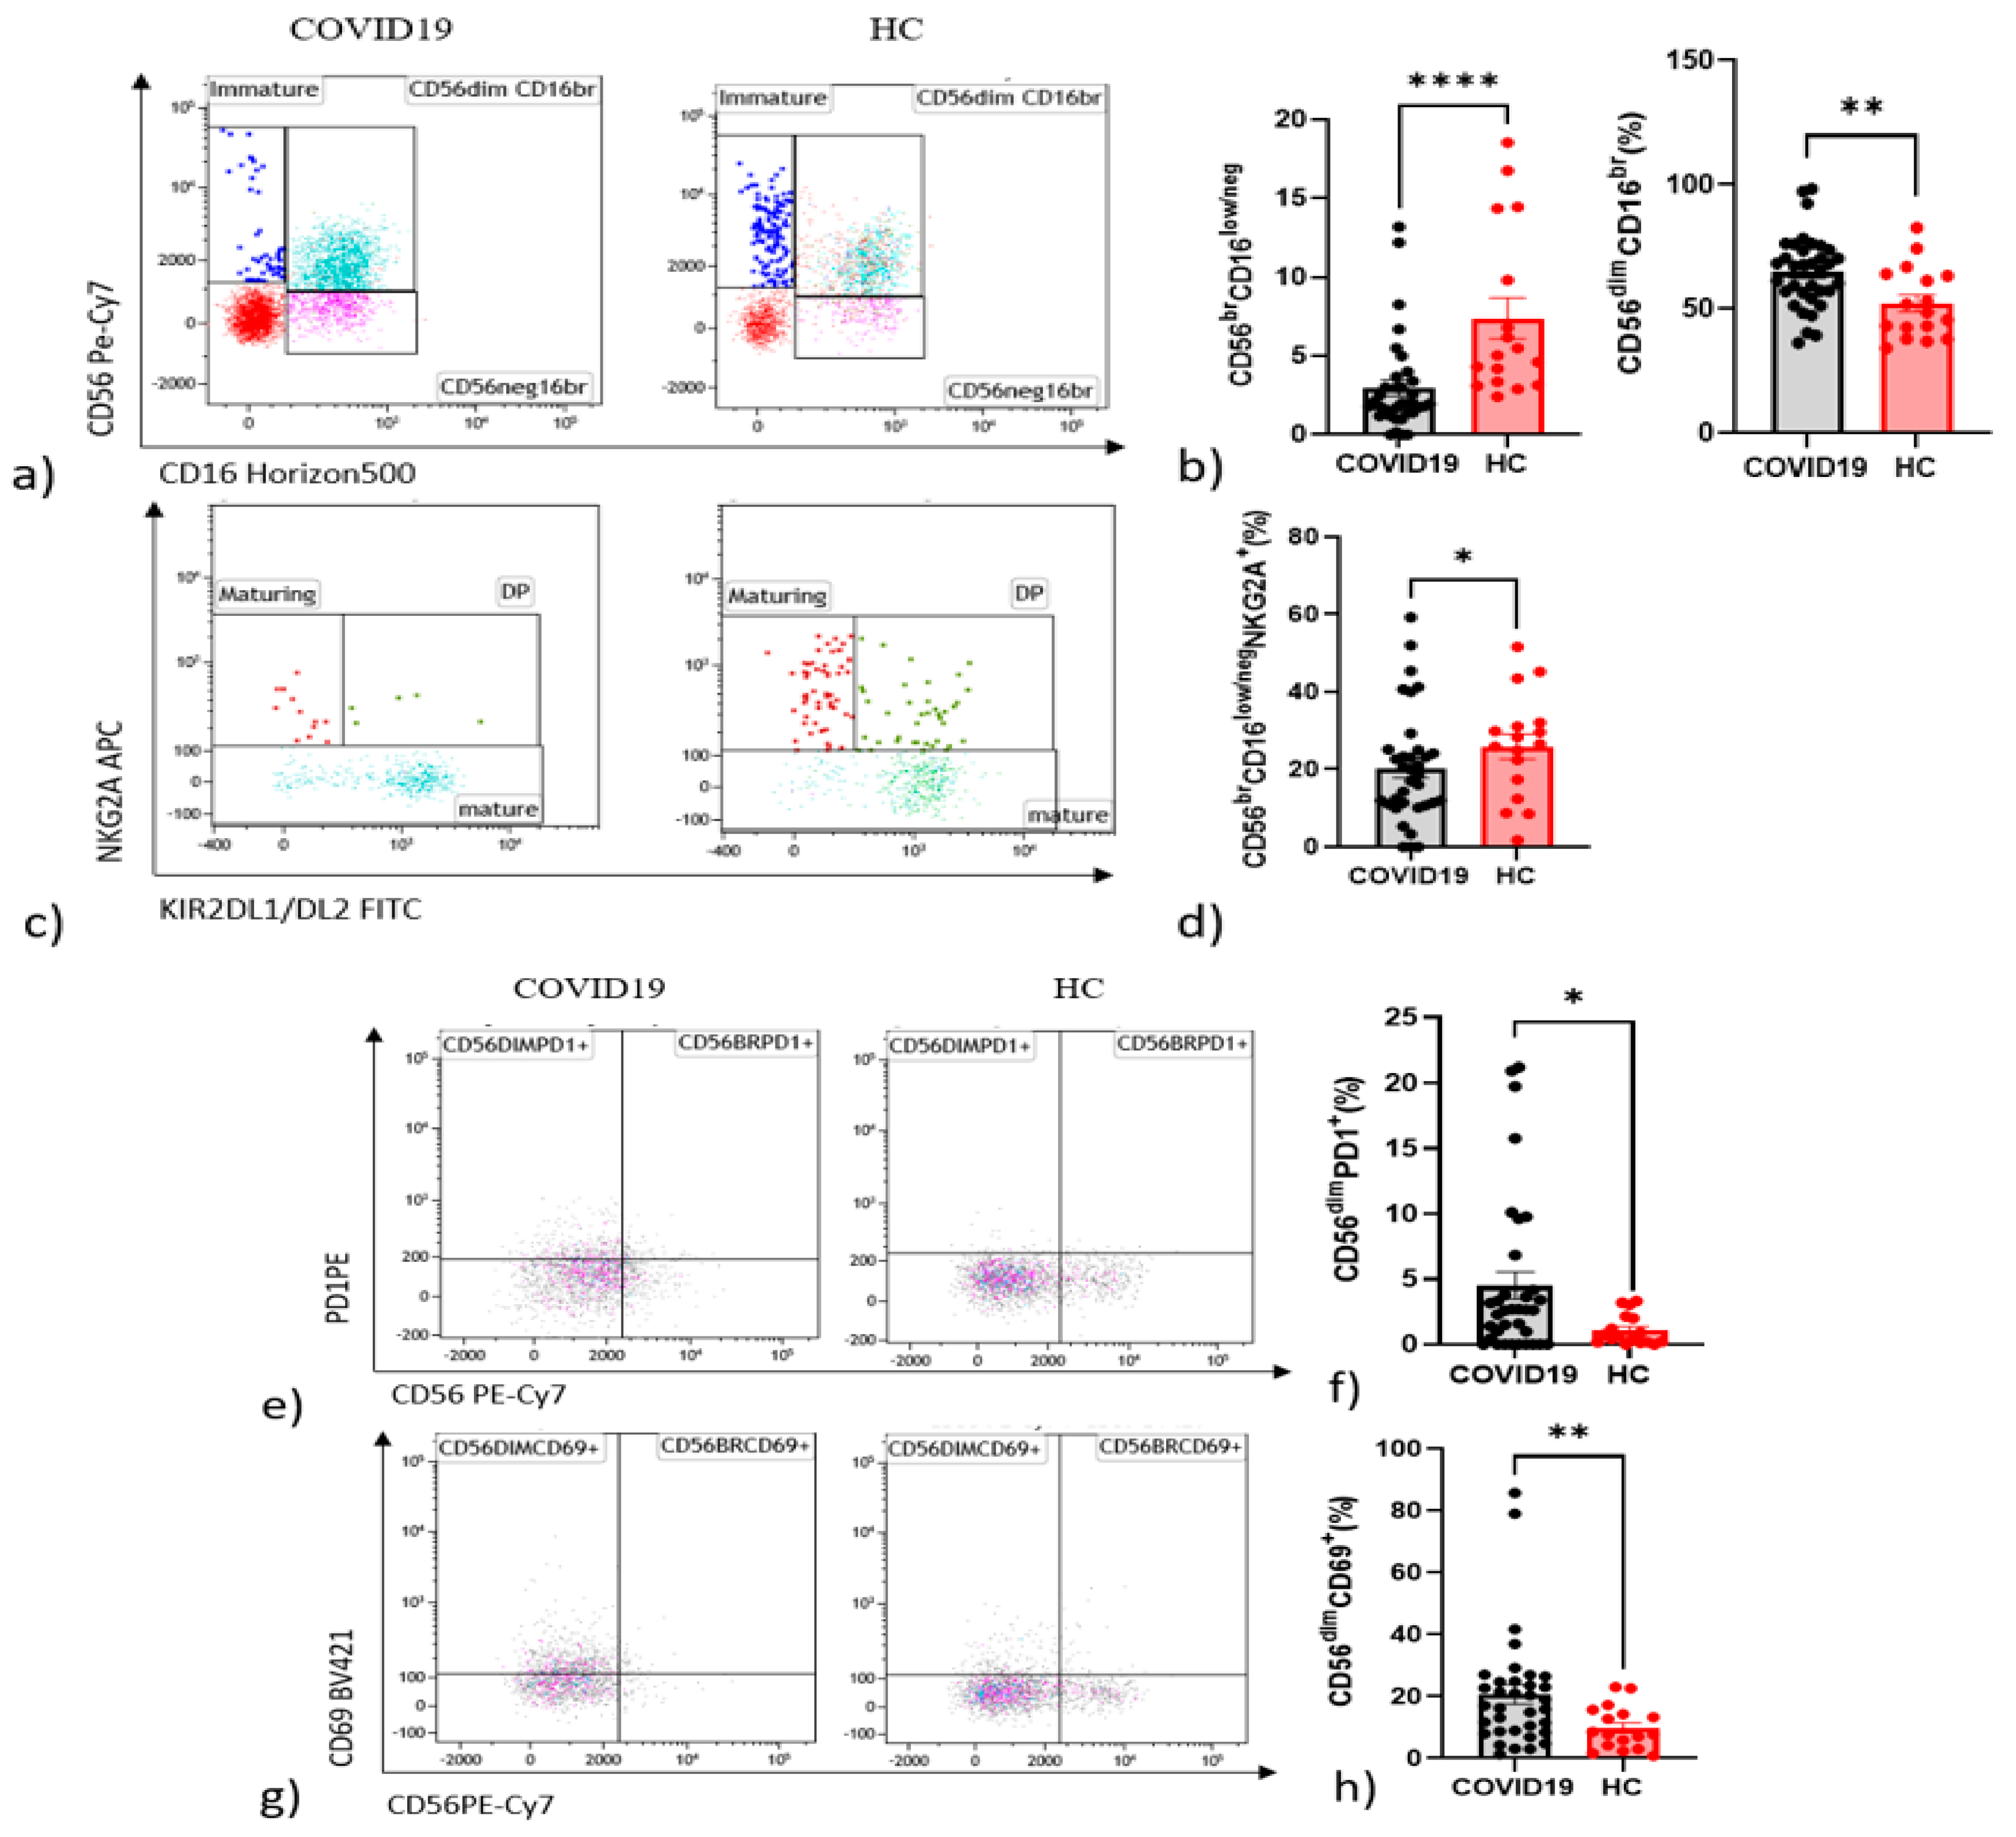
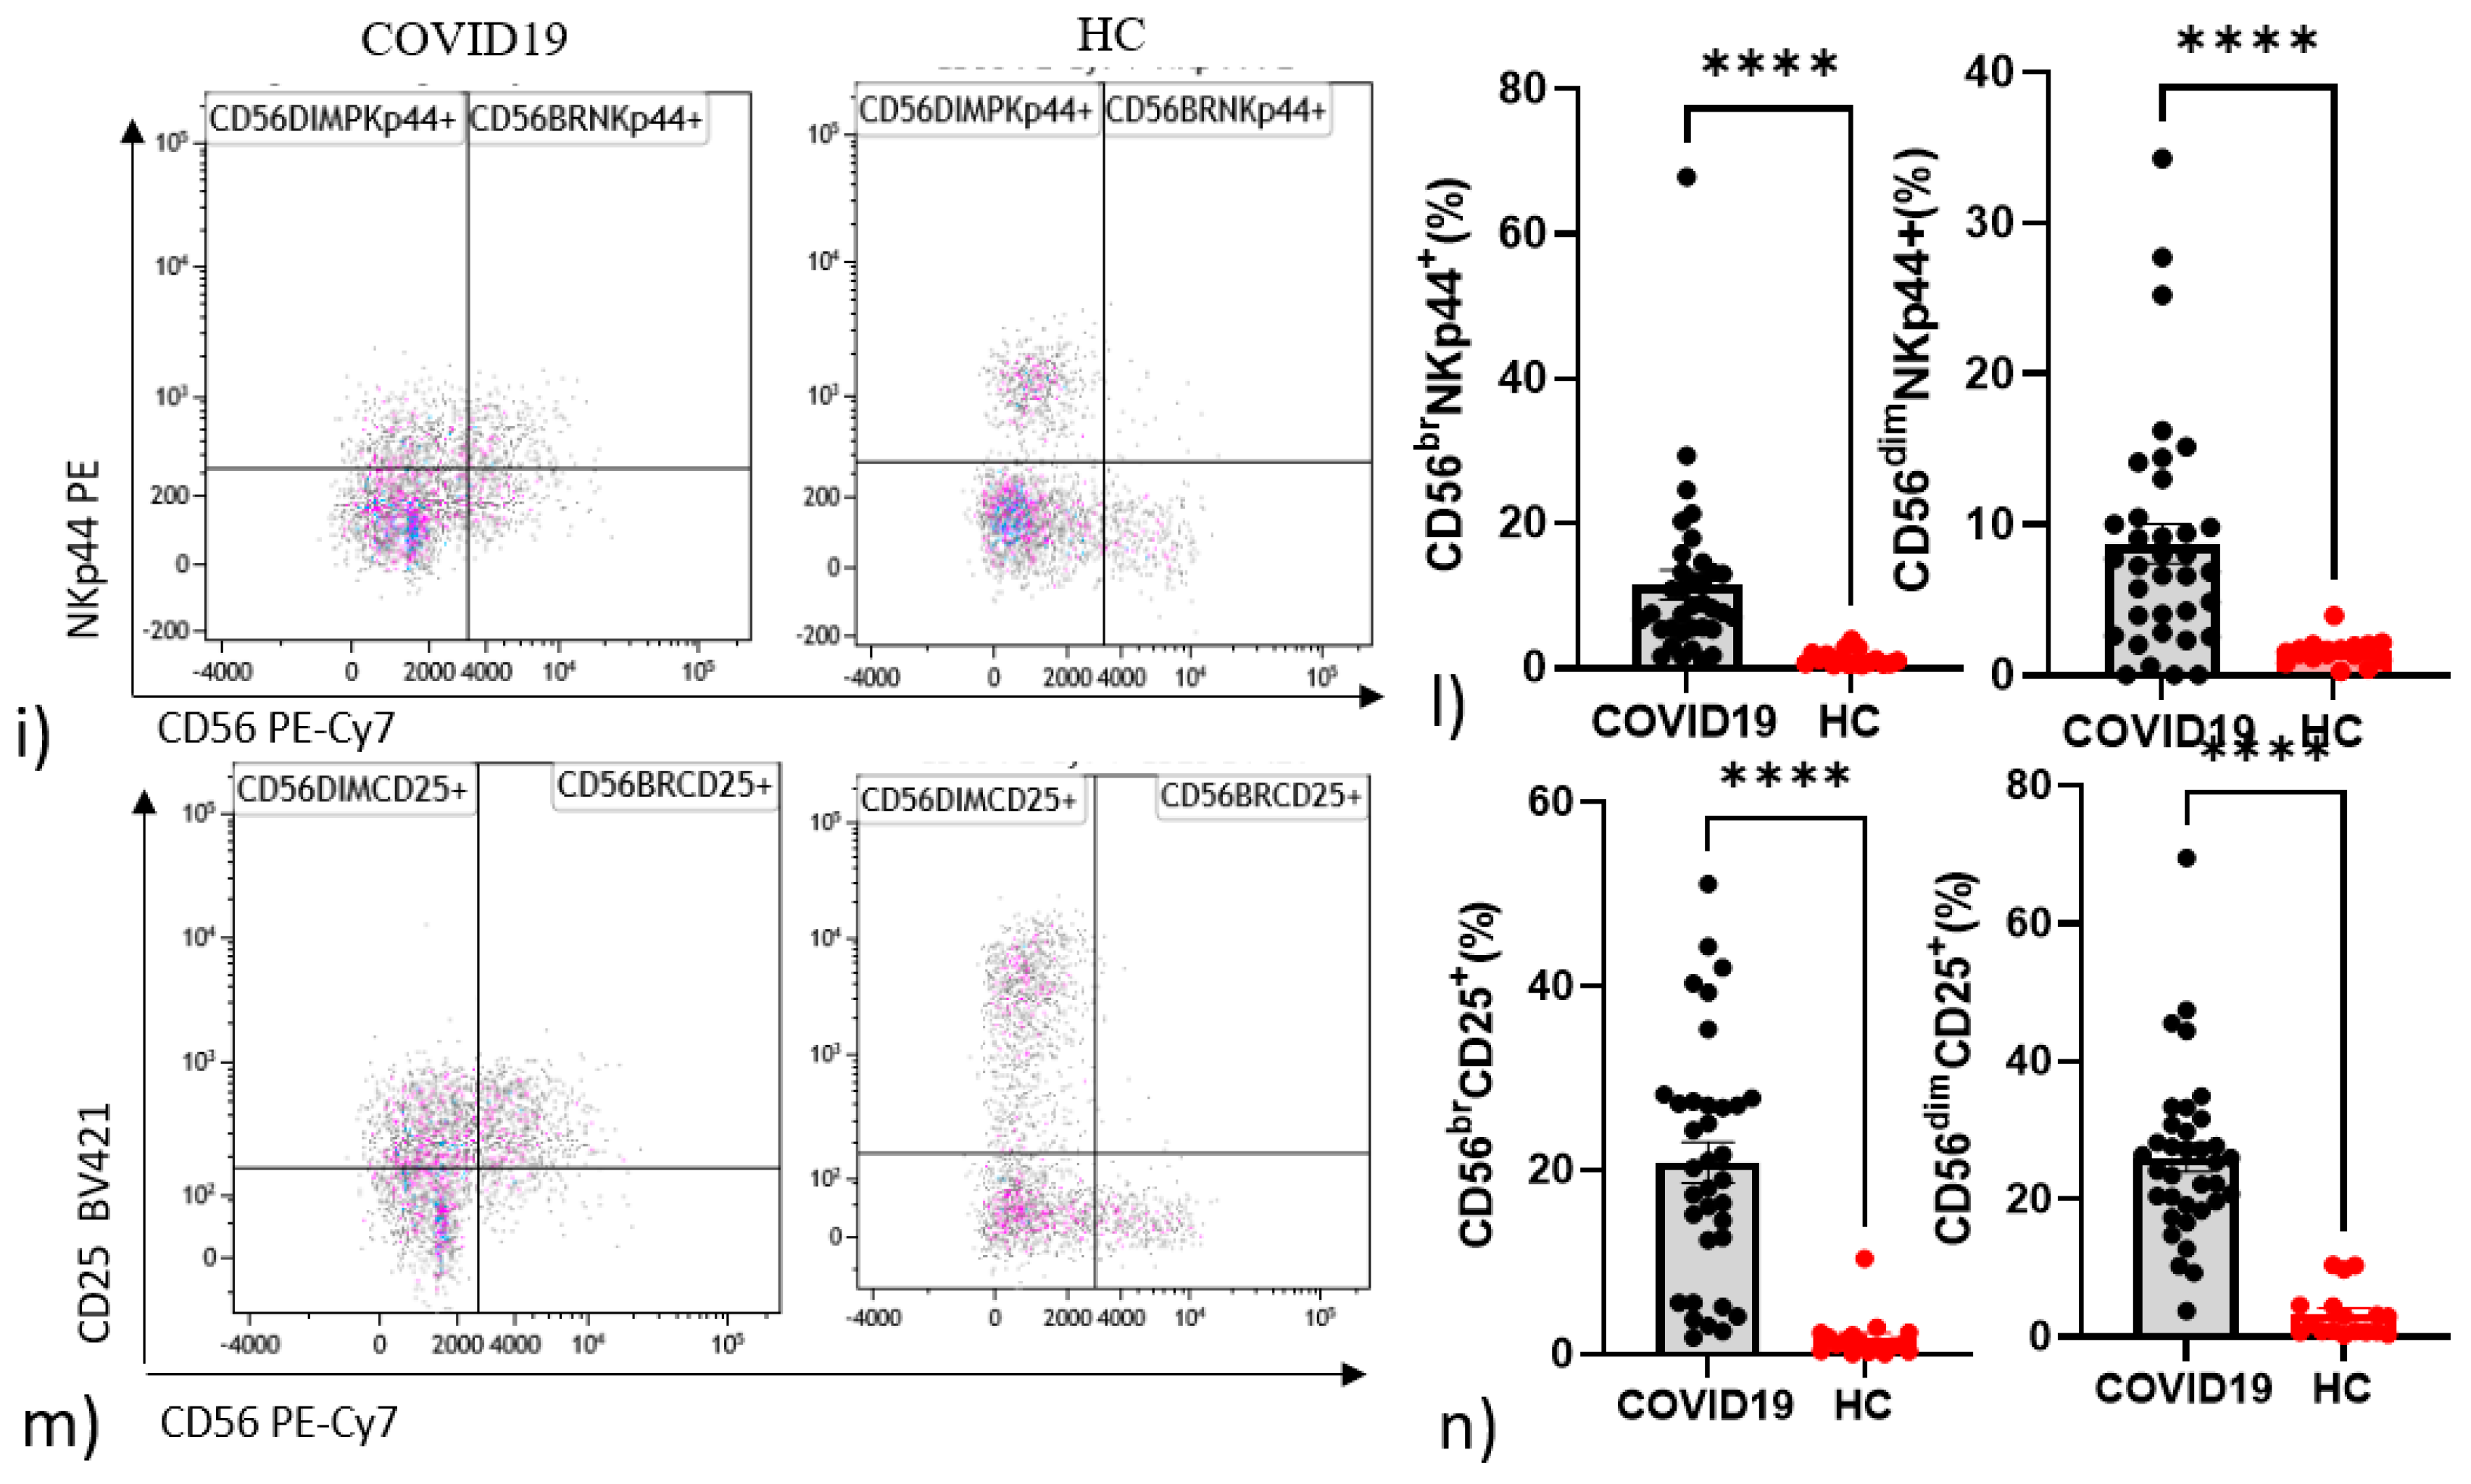
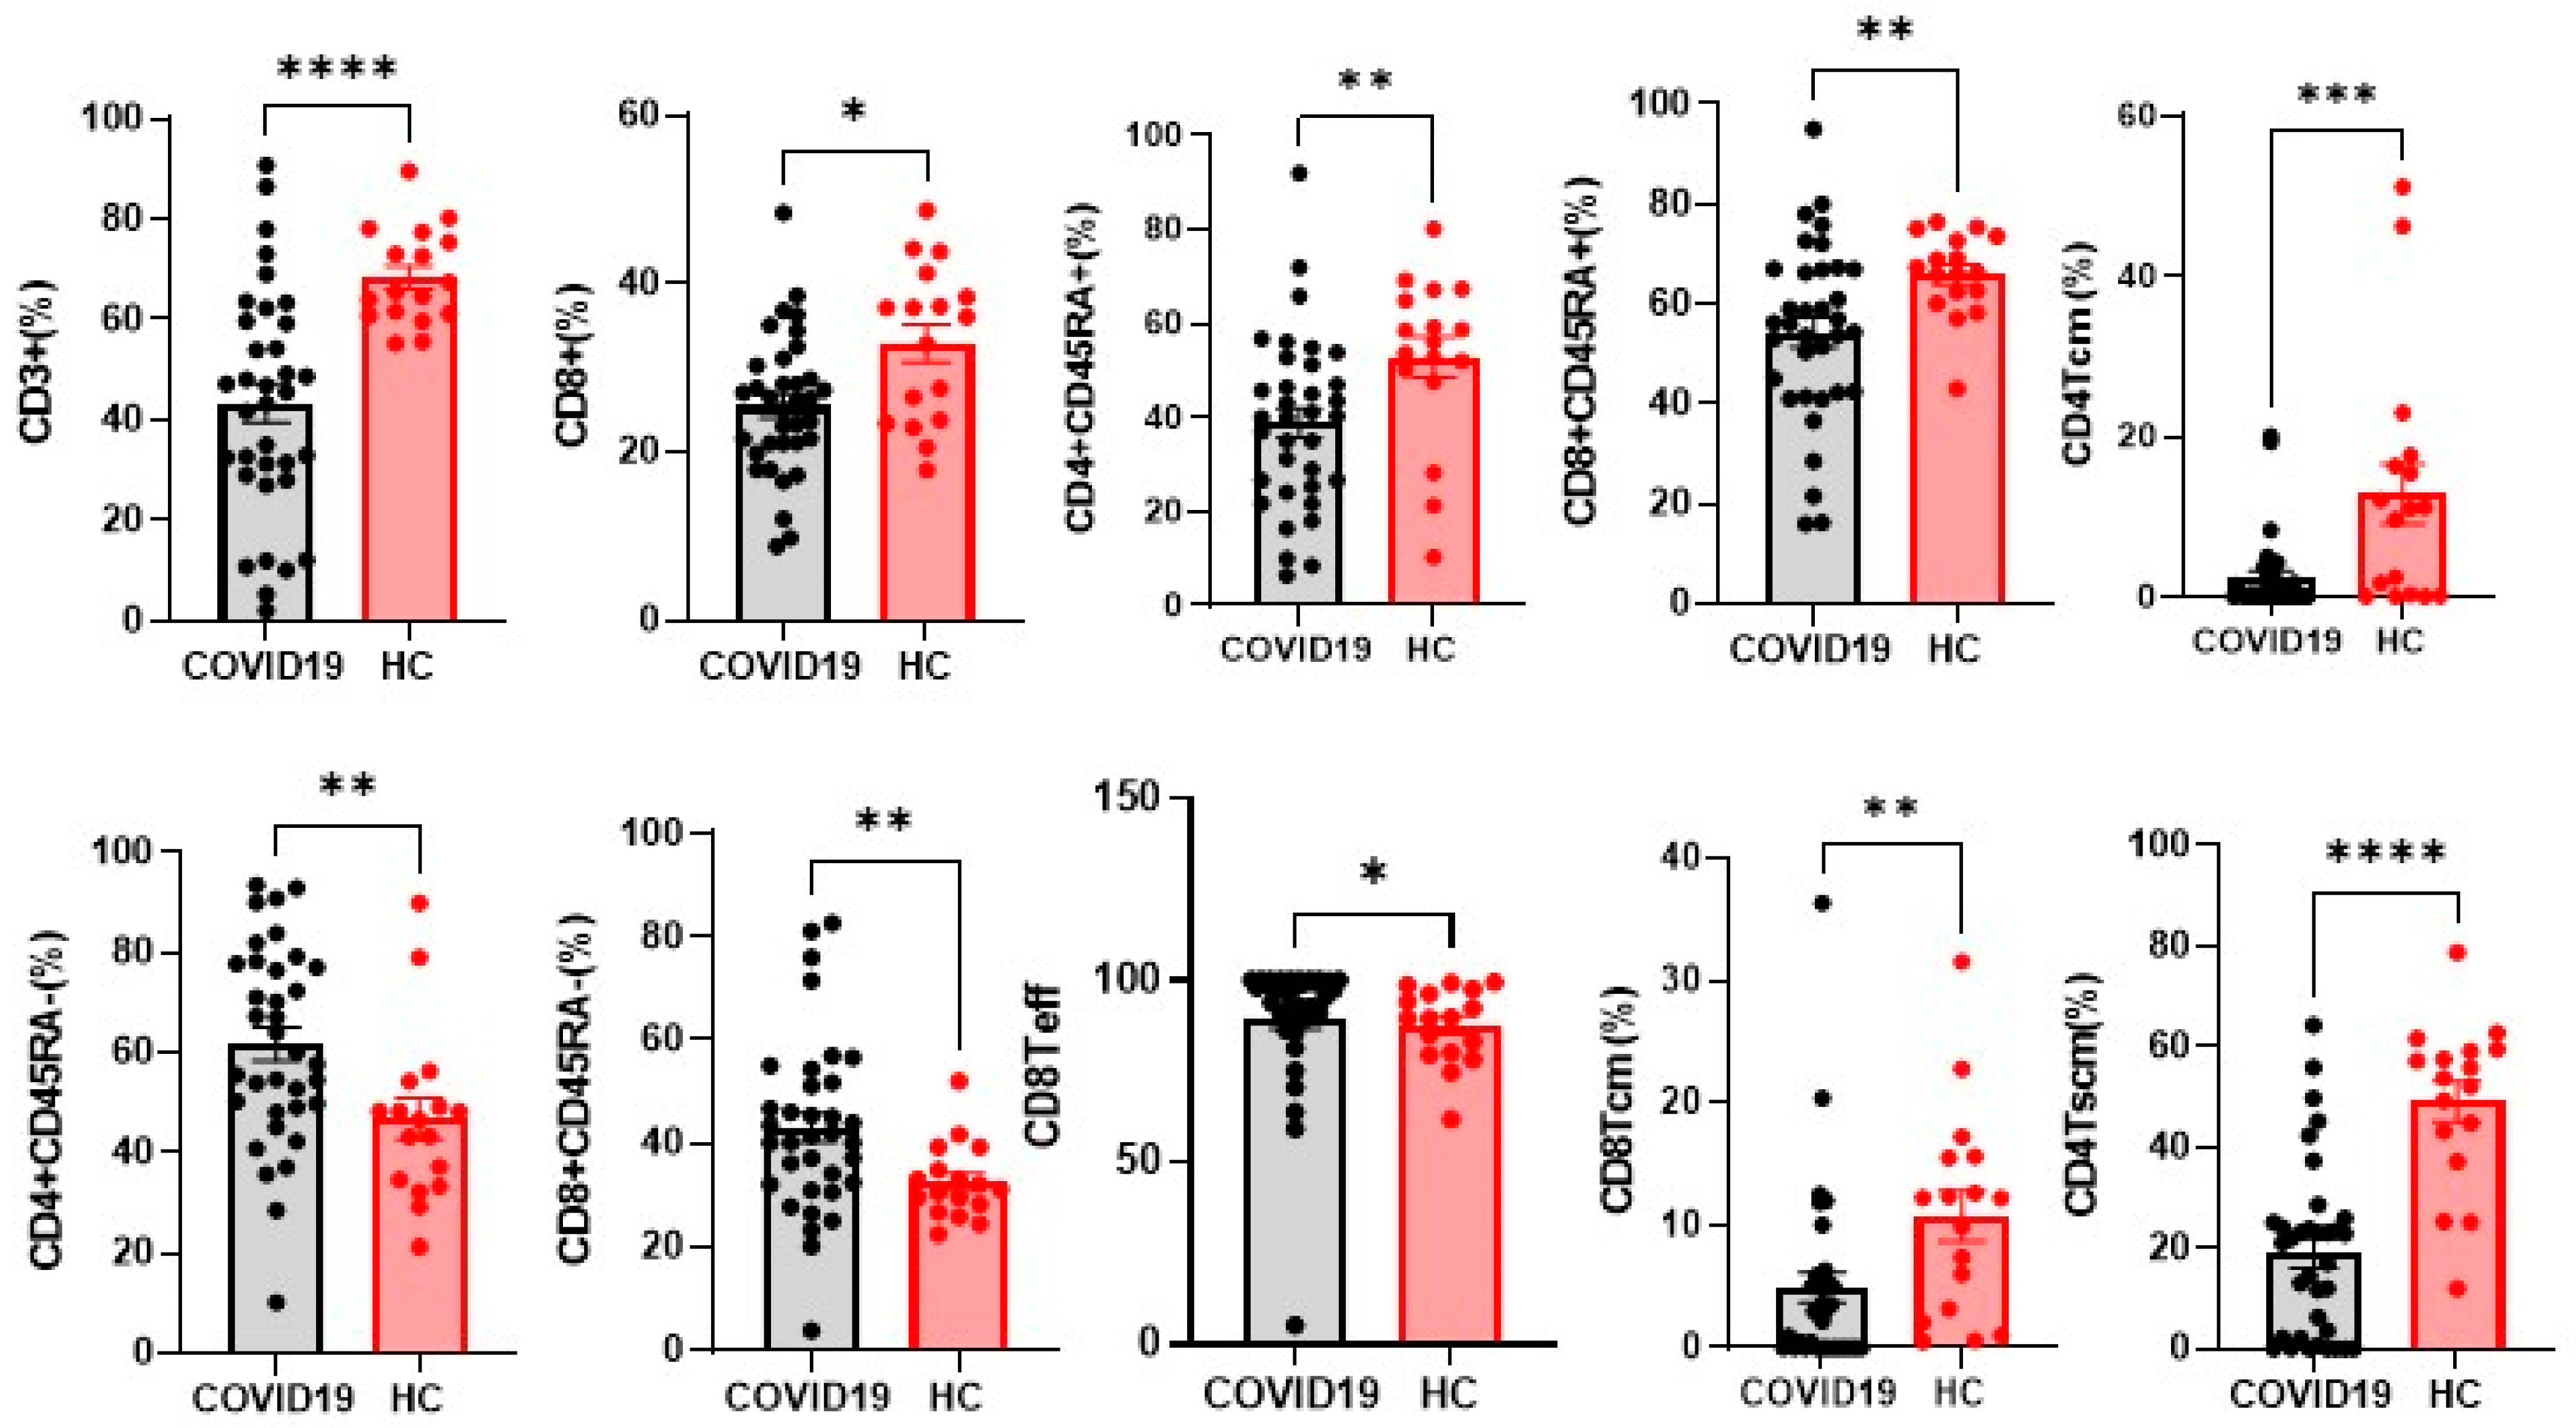
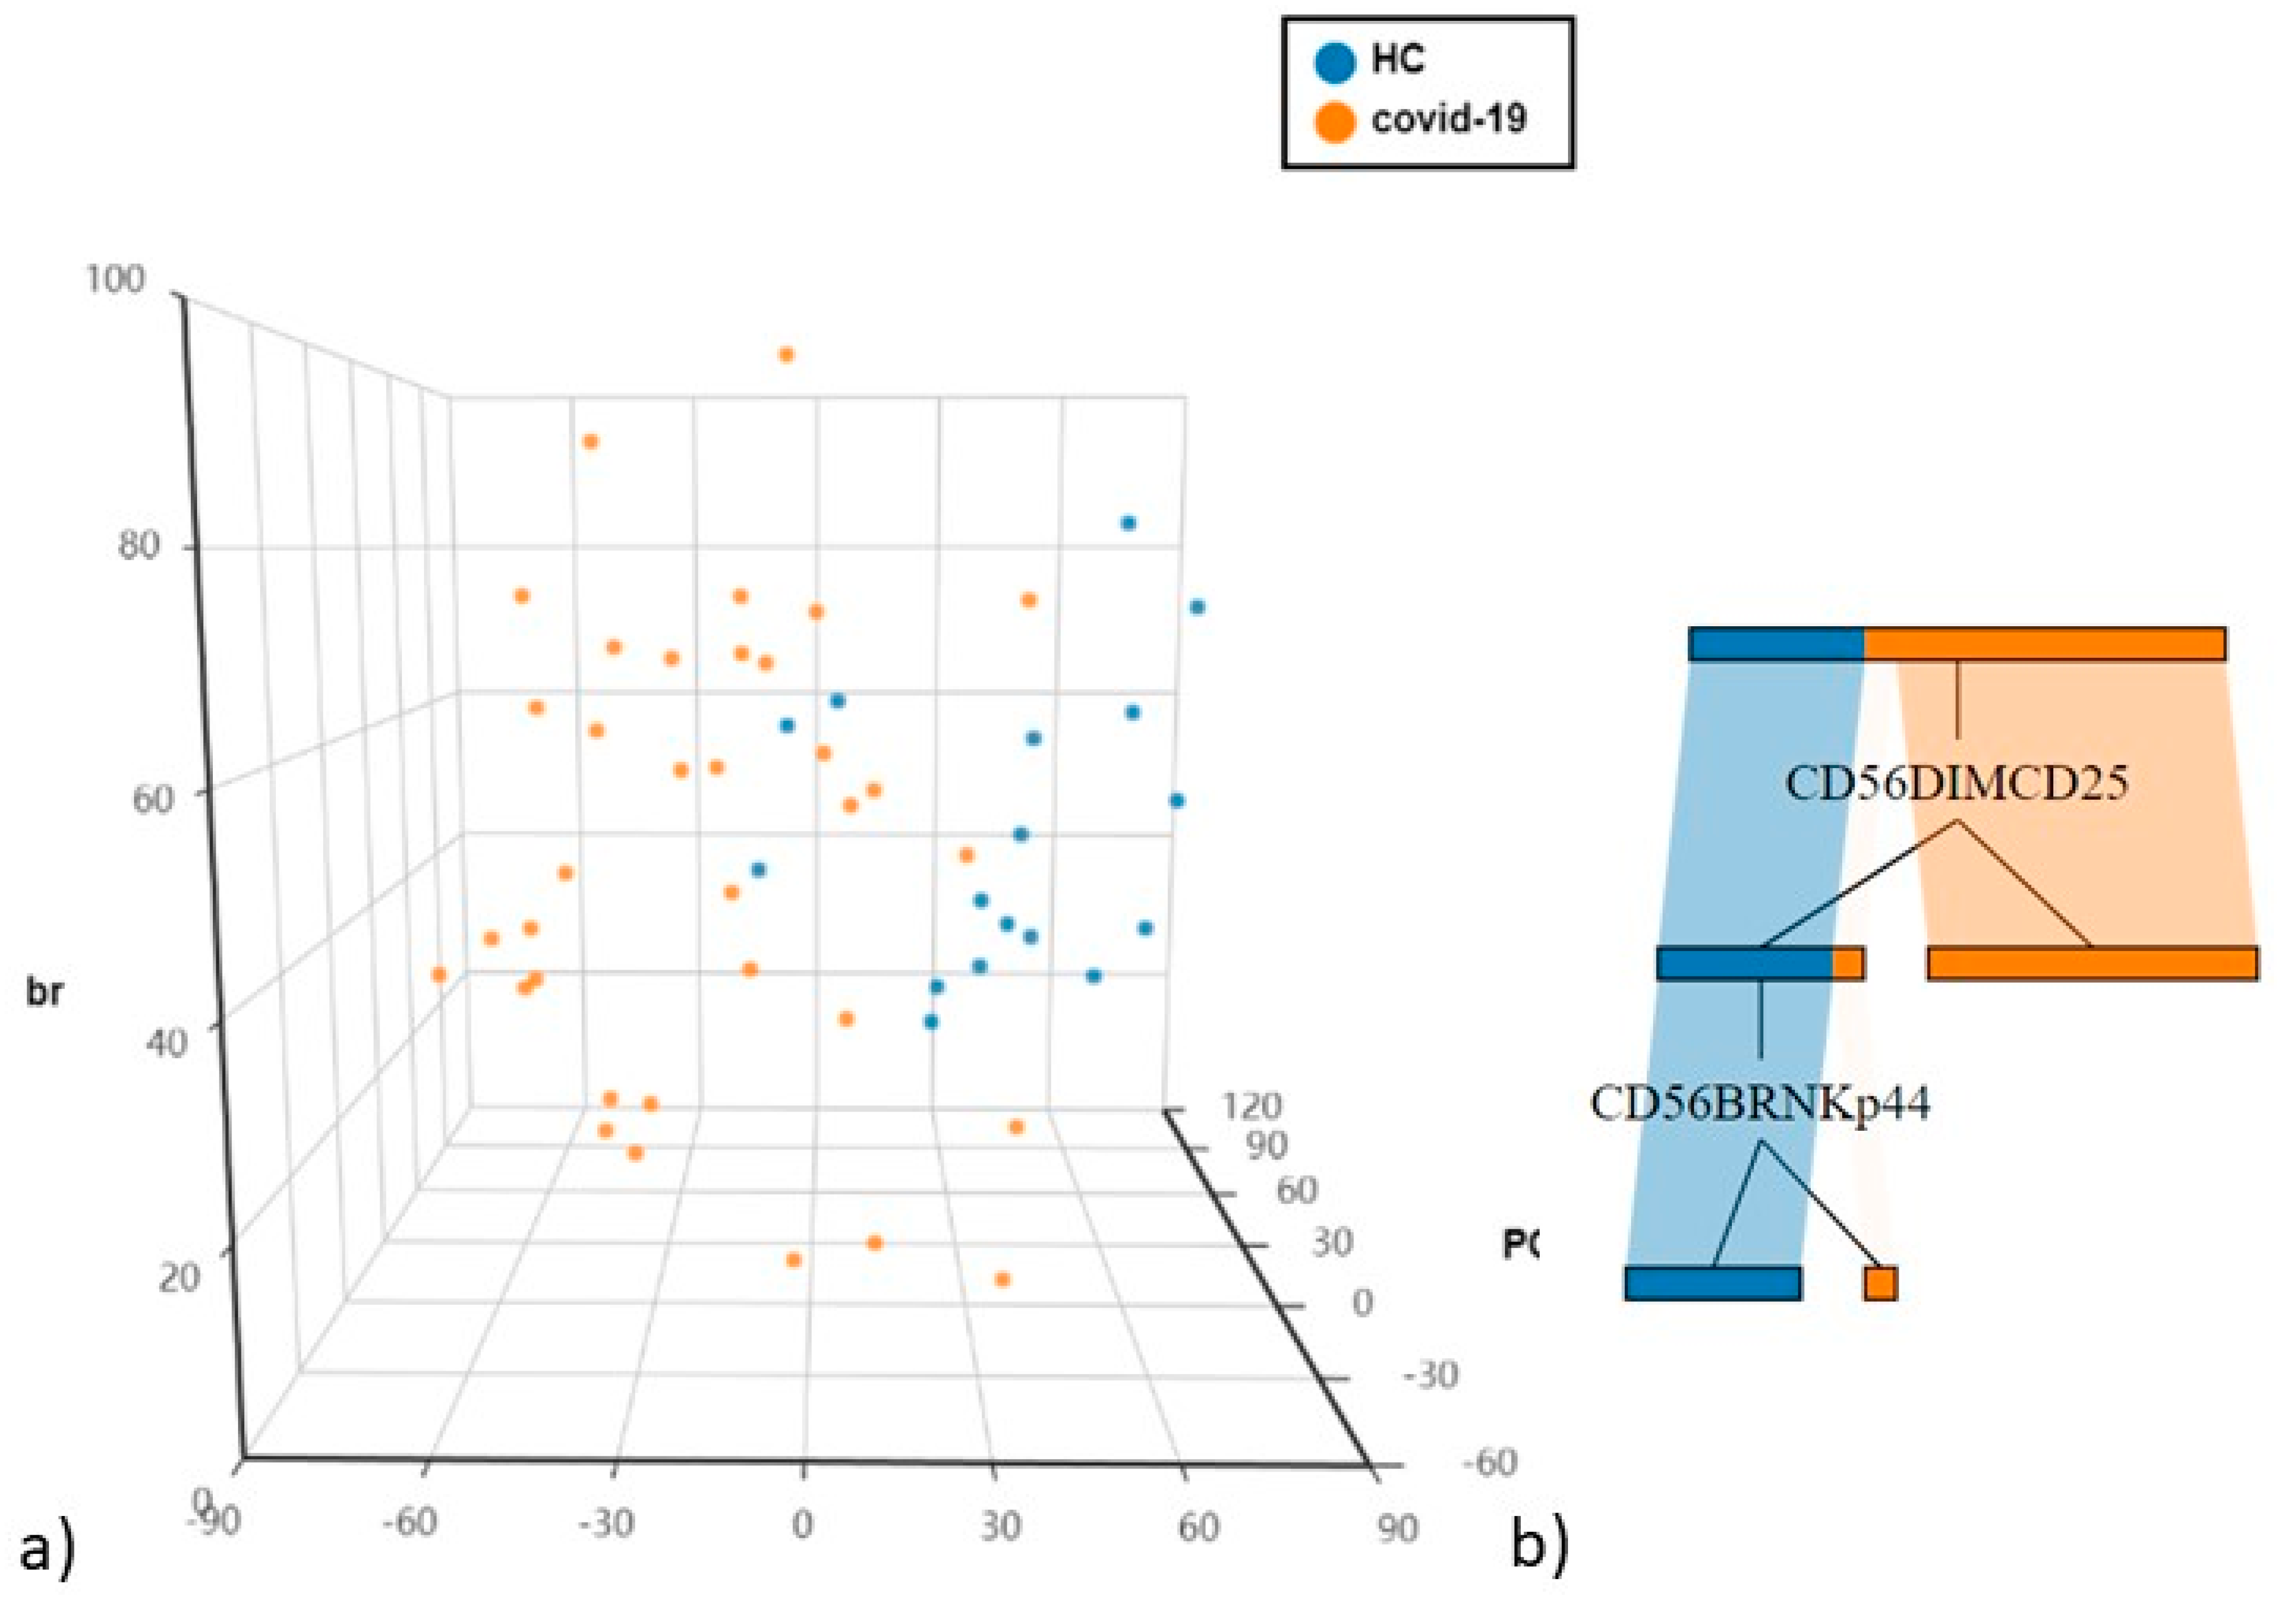
4.2. Differences in NK and T Cells in Hospitalised Patients with COVID-19 and Controls

Regarding NK cell phenotype compared with healthy controls, patients with COVID-19 showed fewer immature CD56brightCD16neg NK cells (p < 0.0001) and maturing CD56dimCD16brightNKG2A+NK cells (p = 0.0437) (Figure 1a,b) and a parallel increase in the CD56dimCD16bright NK subset (p = 0.0057) (Figure 1c,d).
Interestingly, there were statistically significant increments in CD56dim NK cell activation marker CD69 C-type lectin (p = 0.038) (Figure 1e,f) and in CD56dim NK cells expressing the checkpoint molecule PD-1 (p = 0.040) in COVID-19 patients with respect to controls (Figure 1g,h). Higher percentages of CD25 in CD56bright (p < 0.0001) and CD56dim (p < 0.0001) were found in patients (Figure 1i,l). The same pattern emerged for NKp44 in CD56bright (p < 0.0001) and CD56dim (p < 0.0001) in patients (Figure 1m).
Frequencies of CD3+ T cells and different clusters of T-cell differentiation were also explored. Notably, CD3+ and CD8+ T cells were significantly fewer in COVID-19 patients than controls, (p < 0.0001 and p = 0.0104 respectively). The same trend was recorded for CD4+CD45RA+, CD4+TCM, CD4+TSCM, CD8+CD45RA+ and CD8+TCM (p = 0.0036. p = 0.0007. p < 0.0001. p = 0.0058. p = 0.0014. respectively). On the contrary, CD4+CD45RA, CD8+CD45RA and CD8+Teff were significantly more abundant (p = 0.0045. p = 0.0061 and p = 0.0470) in patients than controls (Figure 2).
Differently expressed immunological cell subsets were added to the PCA analysis in order to highlight populations differentiating COVID-19 patients from controls.
The first and second principal components explained 33.12% and 13.98% of the total variance. CD56dimCD25+ being the most discriminatory variable, as confirmed by decision tree analysis to determine which variables clustered best by the Gini criterion (Figure 3a,b).

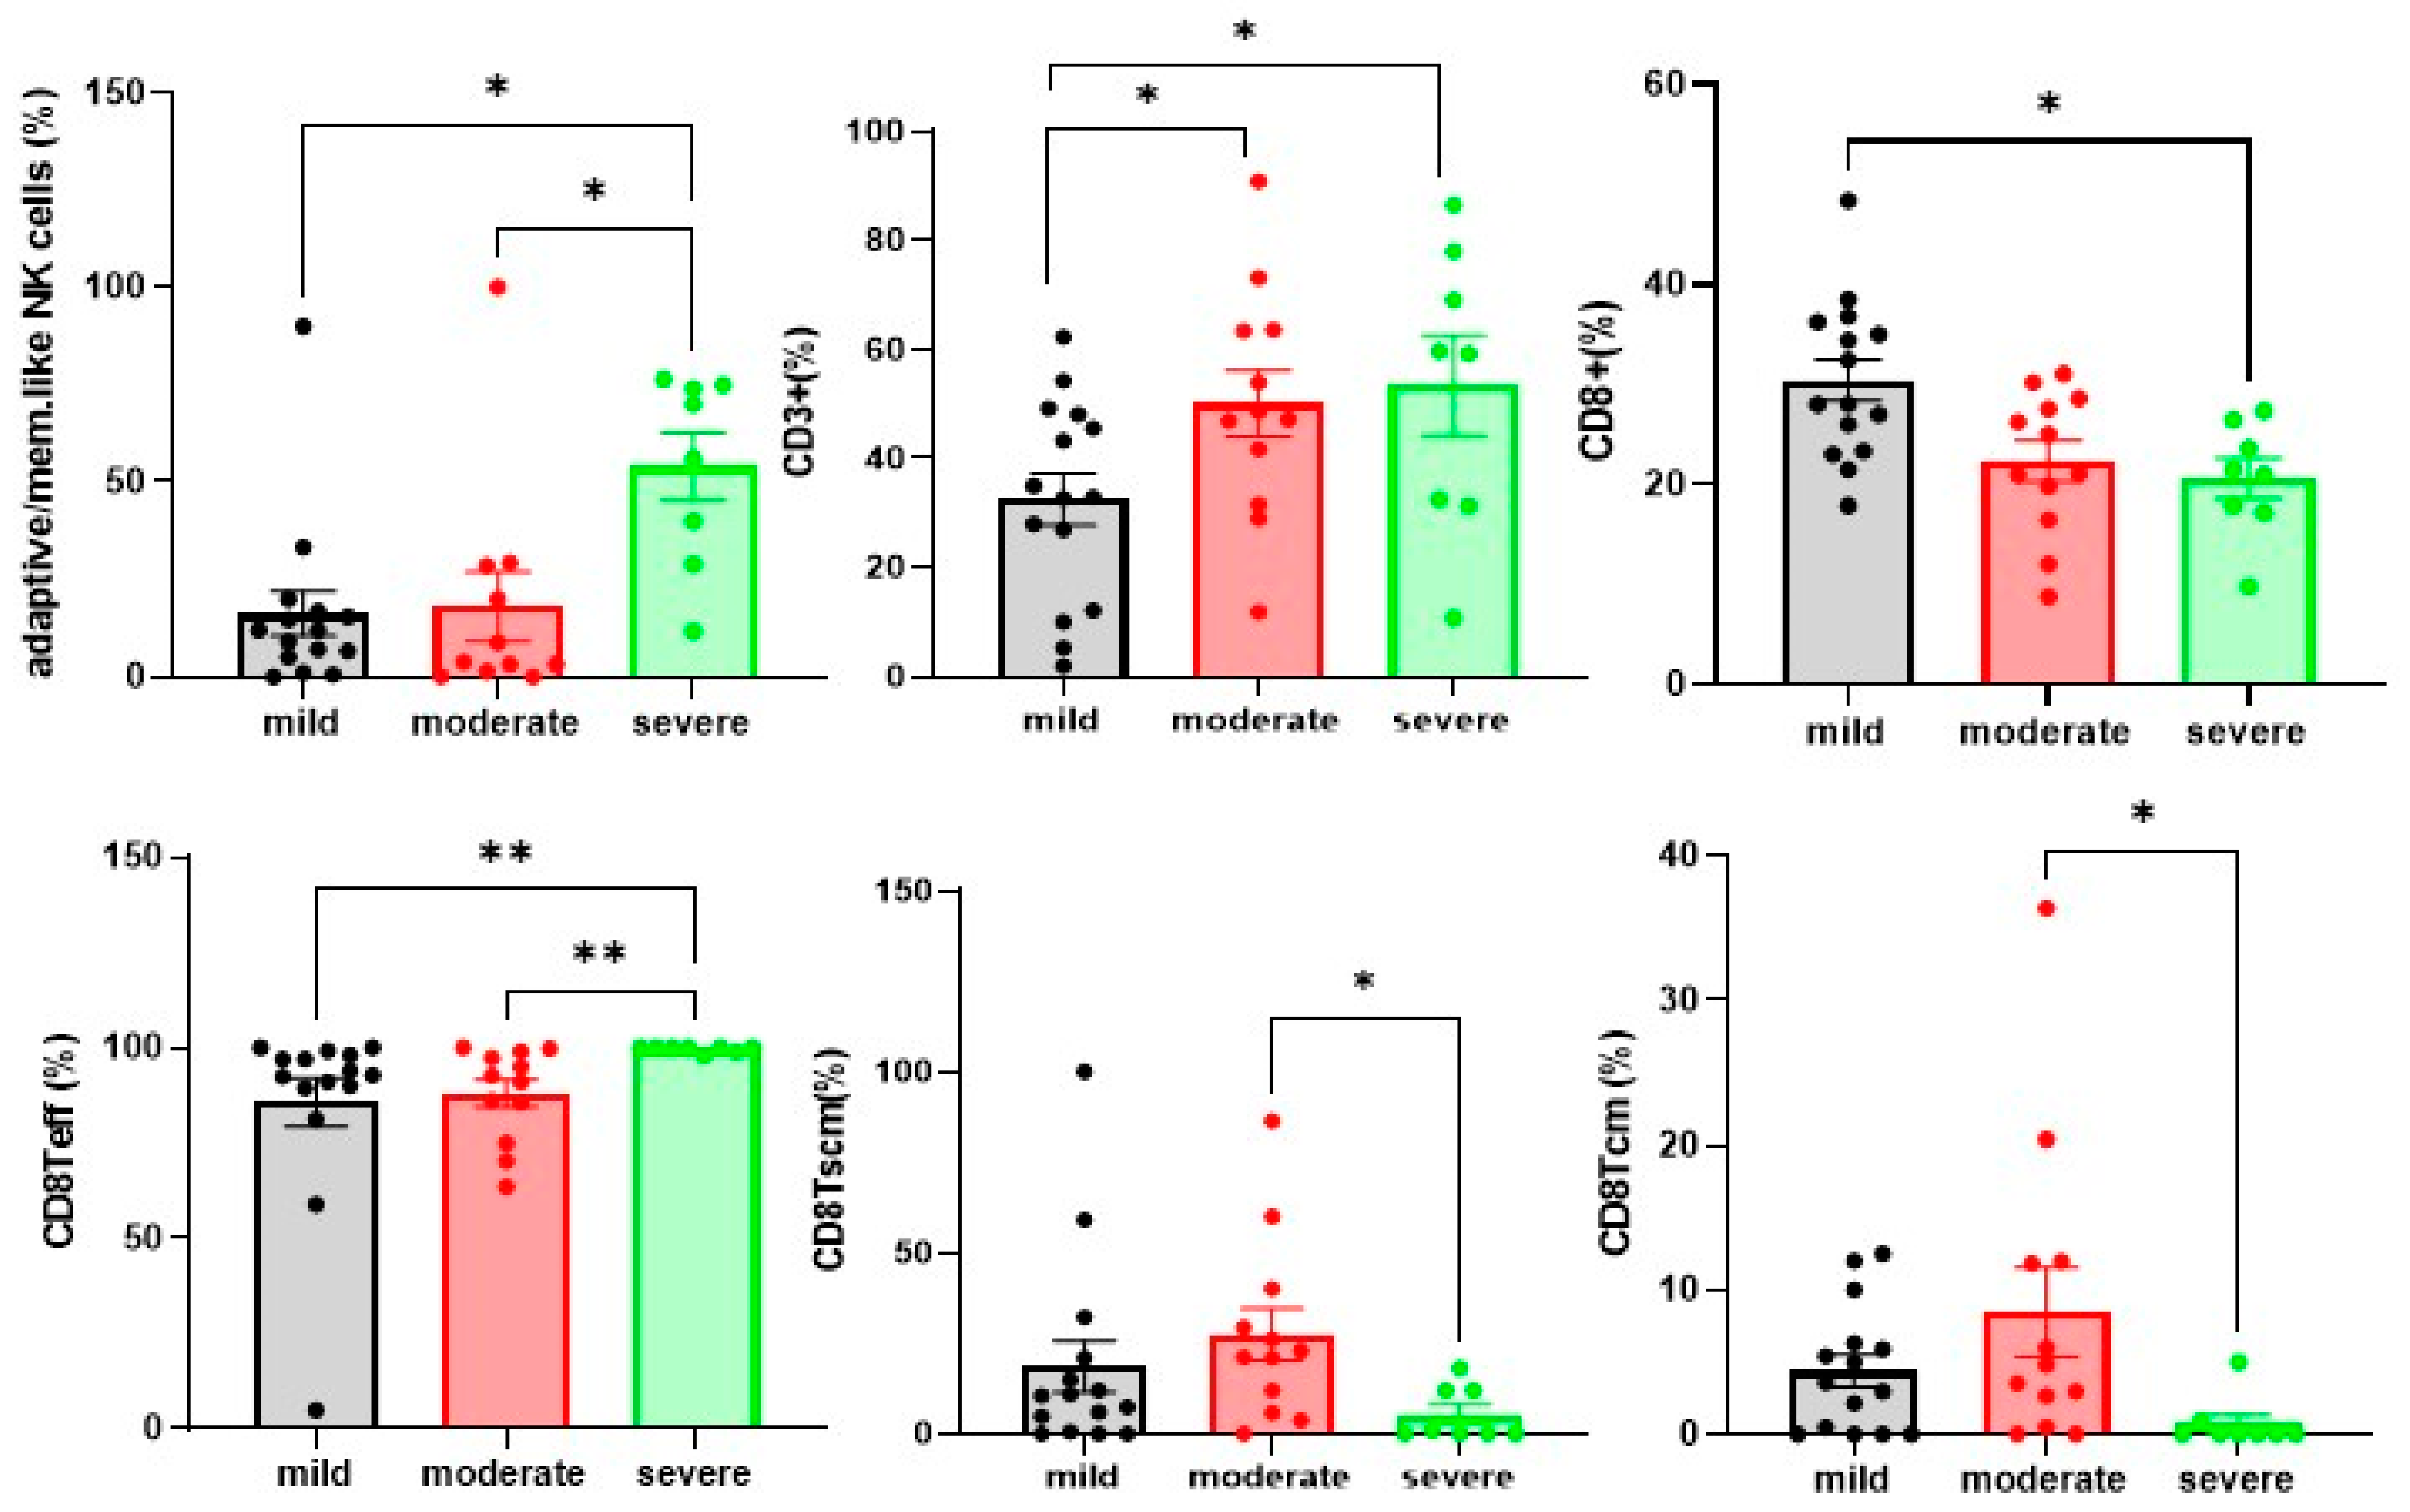
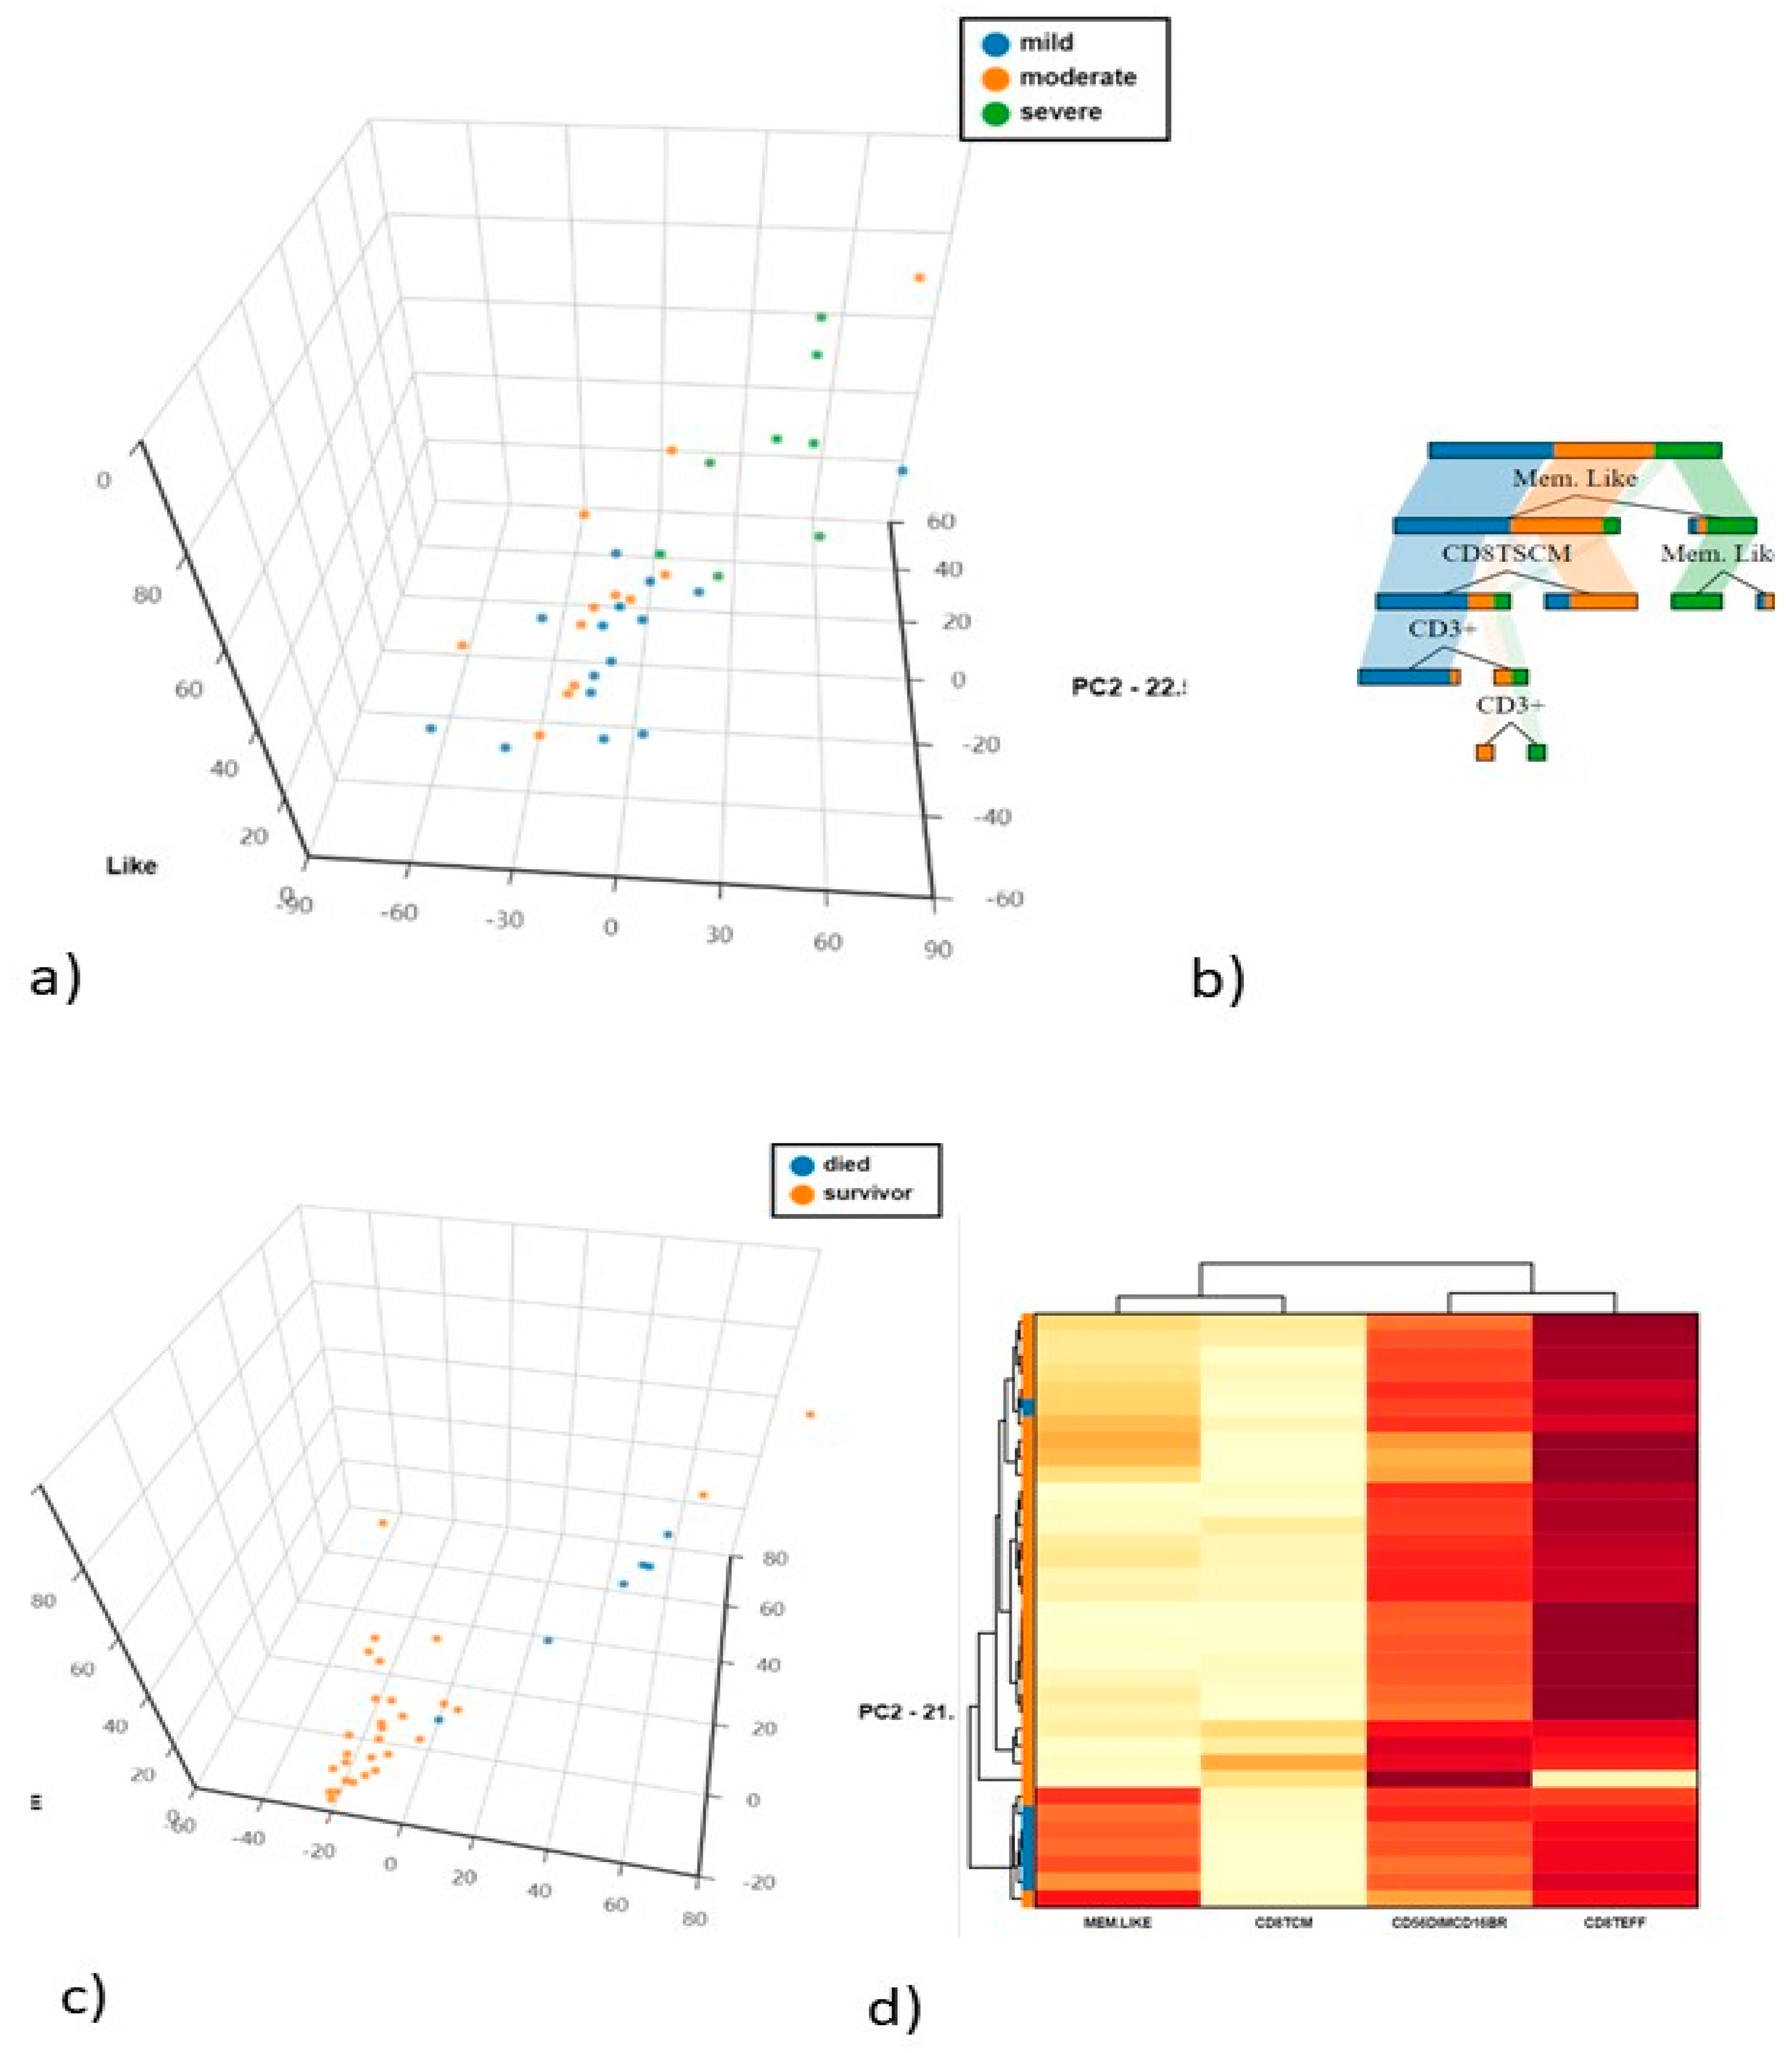
4.3. Differences in NK and T Cells in Mild. Moderate and Severe Hospitalised Patients with COVID-19

After stratification of our cohort according to the clinical severity criteria described in Methods. we observed significantly higher adaptive/memory-like NK cell frequencies in patients with severe disease than in those with mild and moderate phenotypes (p = 0.0080) (Figure 4). Concerning T cell analysis CD3+. CD8TCM and CD8TSCM cells were significantly less frequent in severe COVID-19 patients than in the mild and moderate groups (p = 0.0476. p = 0.0236 and 0.0331), whereas CD8Teff cell percentages were significantly more frequent in severe COVID-19 patients than in the mild and moderate groups (p = 0.0024) (Figure 4).
Unsupervised PCA analysis was applied to discriminate the mild. moderate and severe COVID-19 populations. The first and second principal components explained 44.14% and 22.55% of the total variance, adaptive/memory-like NK cells being the most discriminatory variable. as confirmed by decision tree analysis to determine which variables clustered best by the Gini criterion (Figure 5a,b).

4.4. Differences in NK and T Cells in Hospitalised Patients in Relation to Death and Survival

Six of the 35 patients enrolled in the study died. CD56dimCD16bright (p = 0.0301) and adaptive/memory-like NK cell frequencies were significantly higher in patients who died than in survivors (p = 0.0007). Regarding T cells, CD8TCM were less frequent (p = 0.048) and CD8Teff were more frequent (p = 0.0044) in patients who died than in survivors. Supervised PCA on these cell subsets showed that the first and second principal components explained 63% and 21.5% of the total variance, adaptive/memory-like NK cells being the most discriminatory variable, as confirmed by decision tree analysis to determine which variables clustered best according to the Gini criterion and by heatmap analysis (Figure 5c,d).
ROC curves were plotted to assess the discriminatory values of cell percentages and to determine sufficiently sensitive and specific cut-off values. CD56dimCD16bricht NK cells showed the best areas under the curve (AUC) when we compared surviving and non-surviving COVID-19 patients (AUC = 0.78. 95%CI: 0.62–0.93; Cut-off: 67.7% spec.:65.5% sens.:100% p = 0.0320). The same pattern was recorded for memory-like NK cells (AUC = 0.91. 95%CI: 0.80–1; Cut-off: 28.79% spec.:82% sens.:100% p = 0.0018) and CD8Teff (AUC = 0.85. 95%CI: 0.72–0.98; Cut-off: 97.6% spec.:69% sens.:100% p = 0.0071).

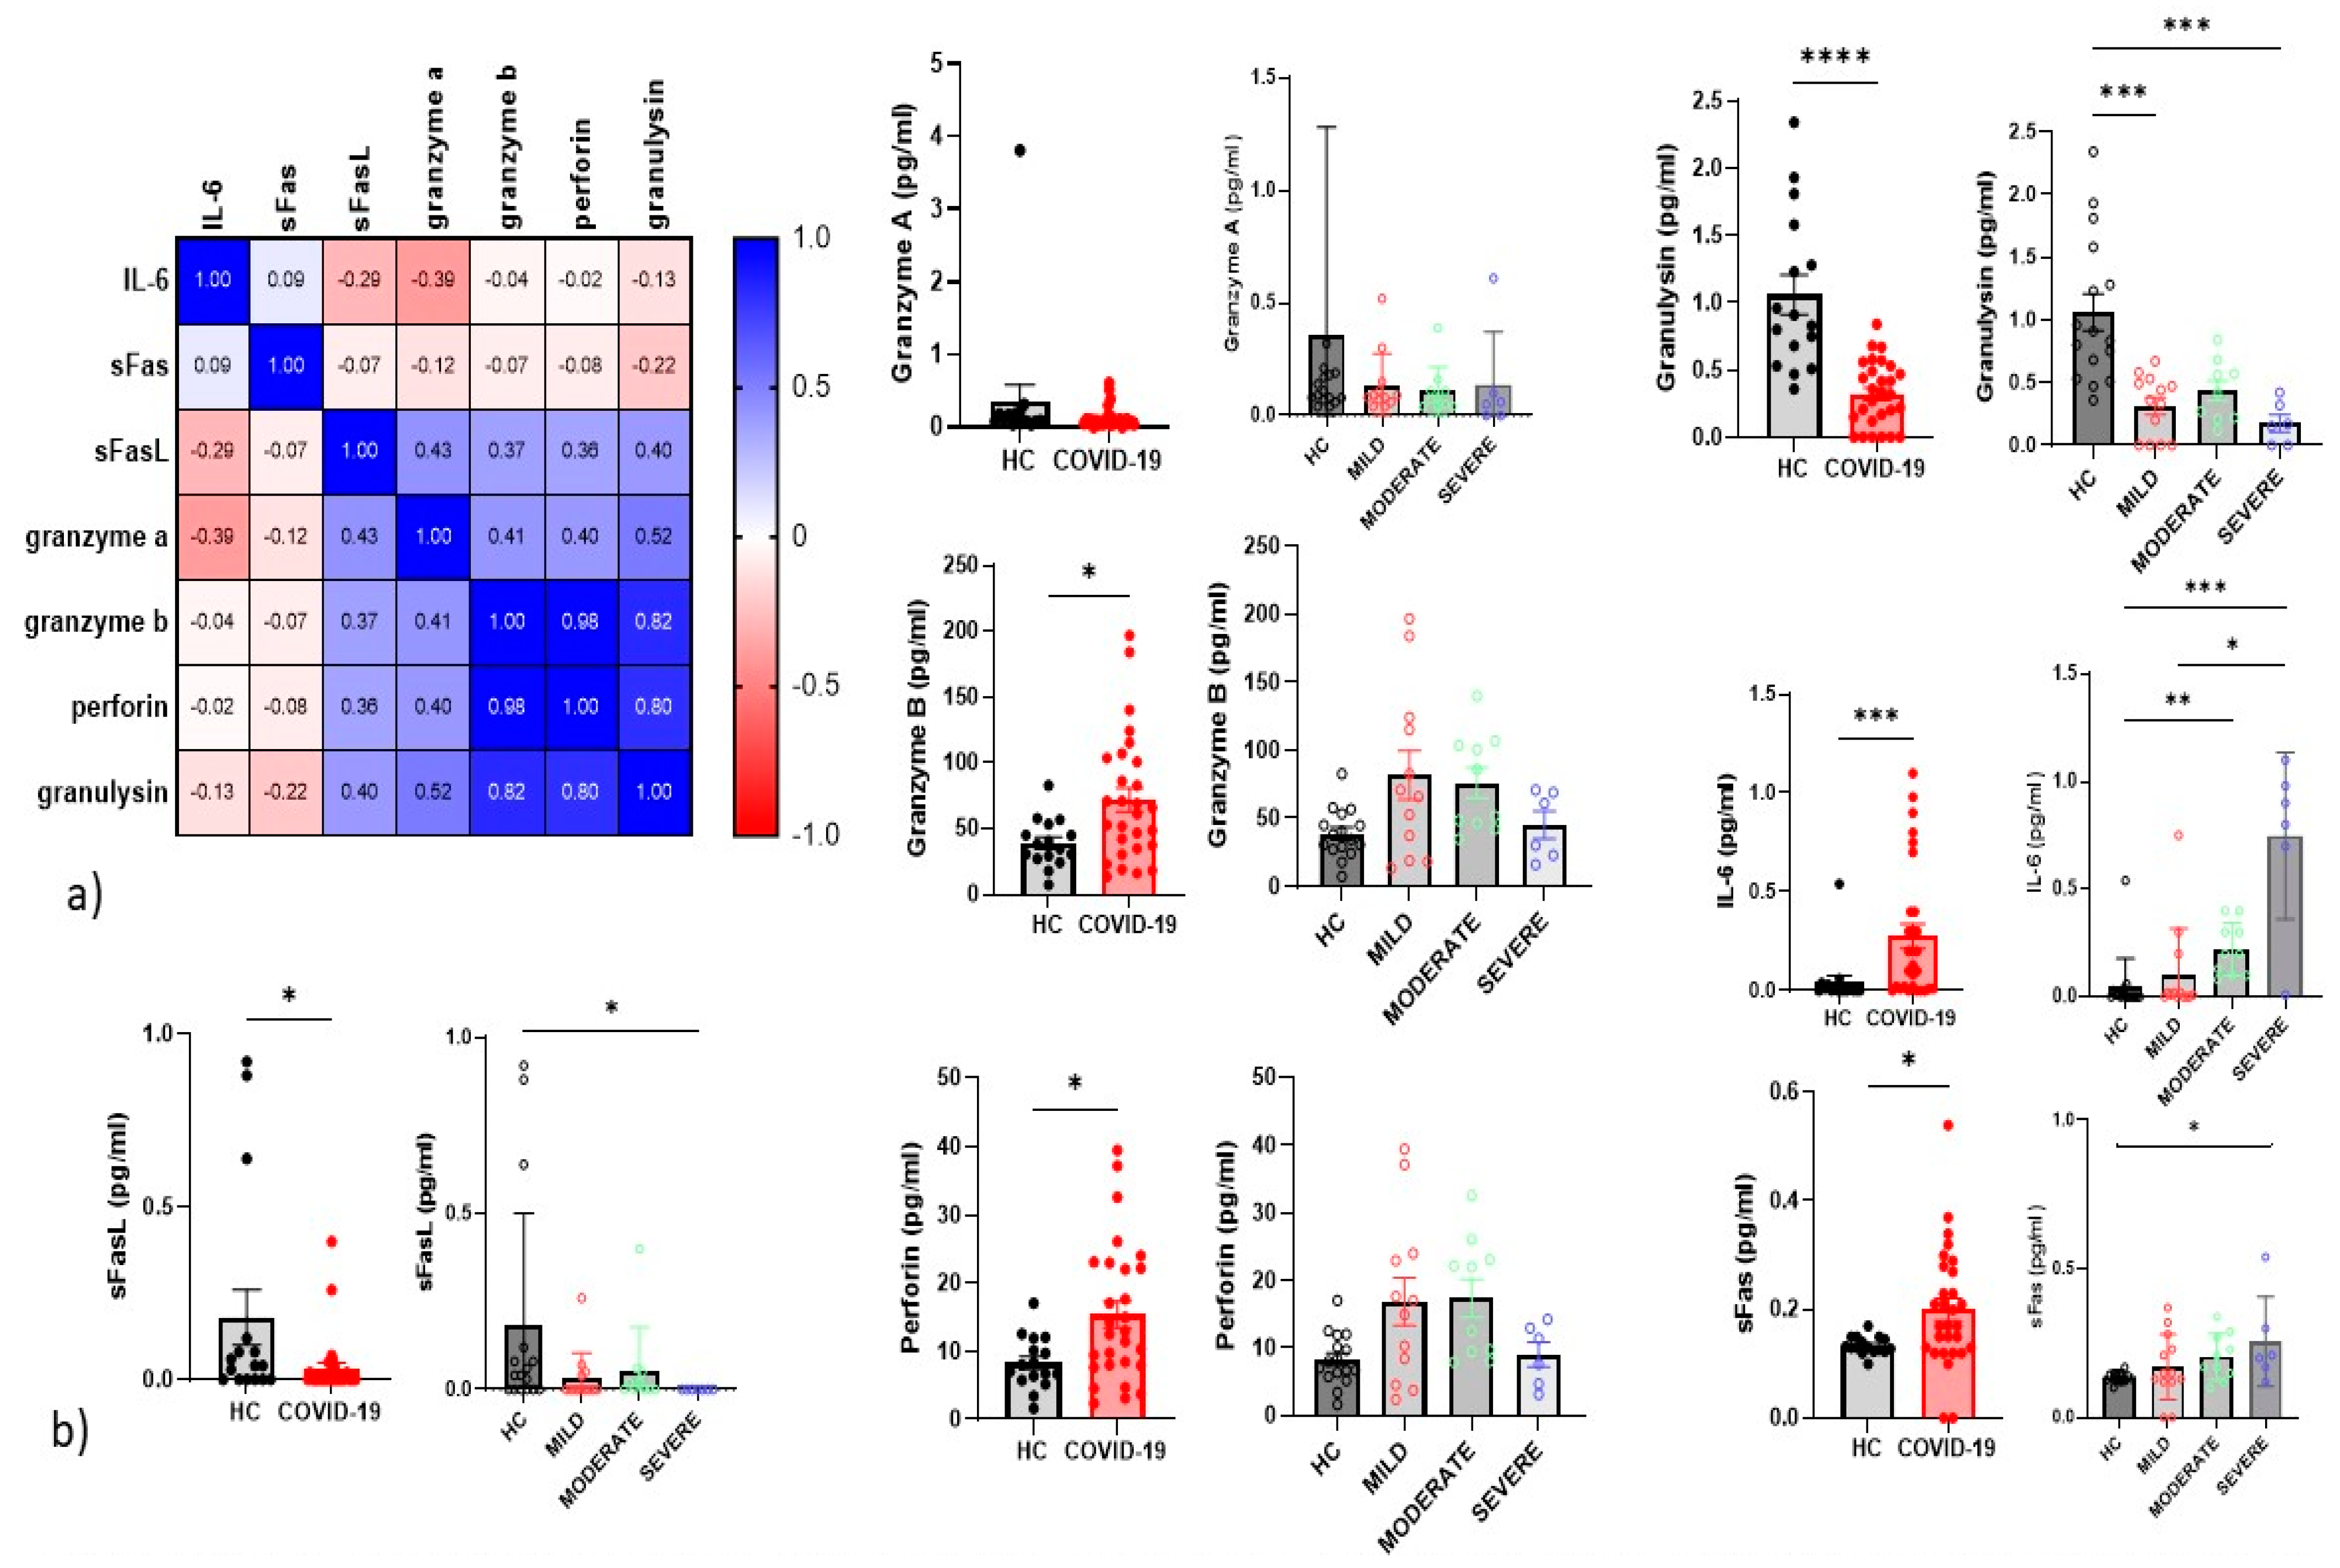
4.5. Serum Inflammatory Cytokines

We examined inflammatory cytokines in the serum of all patients and controls enrolled in the study. The correlations between cytokines are reported in a correlation matrix (Figure 6a). where we observe a direct correlation between perforin and granzyme b (p < 0.0001 r = 0.97) and granulysin (p < 0.0001 r = 0.97). The only significant inverse correlation was between granzyme A and IL-6 (p = 0.037 r = -0.4). Severe COVID-19 patients showed higher serum concentrations of IL-6 than mild and control groups (Figure 6b). We found significantly higher serum concentrations of IL-6, sFas, granzyme B and perforin in patients than controls, and lower sFasL and granulysin (Figure 6a). Serum concentrations of sFas were higher in severe patients than controls. whereas those of sFasL and granulysin were lower in severe COVID-19 patients than controls.
Regarding correlations between serum concentrations of cytokines and cell percentages. direct correlations emerged for IL-6 and adaptive/memory-like NK (p = 0.02 r = 0.41). CD3+ (p = 0.02 r = 0.42) and CD8Teff (p = 0.039 r = 0.38). Immature NK percentages showed a direct correlation with serum concentrations of granzyme B and perforin (p = 0.01 r = 0.47 and p = 0.01 r = 0.45. respectively). Serum concentrations of sFasL showed a direct correlation with maturing NK (p = 0.04 r = 0.37) and CD56+NKp44 (p = 0.01 r = 0.42) cell percentages.

5. Discussion

The immune responses caused by SARS-CoV-2 infection are not yet fully understood, but a major alteration in lymphocyte number and activity has repeatedly been reported in patients with severe disease. The aim of the present study was to obtain further insights into the dysregulation of lymphocyte subsets, including NK and T cell maturation and progression in patients with different severities of COVID-19. Our results provide new details on NK and T cell responses in hospitalised patients with SARS-CoV-2 infection.
Our study demonstrated dysregulation of immune responses in our patients, which suggests that surveillance of lymphocyte subsets may be useful in the clinical management of COVID-19 patients. These data are also in agreement with the immunological changes recently described in a patient with mild-to-moderate COVID-19 patient that required hospitalisation and showed a significant increase in activated T cells [31,32,33]. Moreover, NK cells in COVID-19 patients resulted highly activated. This is demonstrated through the overexpression of CD25, CD69 and NKp44 on the cell surface. While for T cells, CD8 plays a crucial role, demonstrating a lower proportion in severe COVID-19 patients than in mild to moderate, although the behaviour of Teff is the opposite, suggesting that different behaviour define the different progression of diseases.
Unsupervised high-dimensional PCA cluster analysis of NK and T cells identified CD56dimCD25+ as the best variable for distinguishing COVID-19 patients and controls, as confirmed by decision tree analysis. In COVID-19 patients, high serum concentrations of CD25 contribute to lymphopenia [34] and therefore serum concentrations of soluble CD25 were also high, leading to the proliferation of pro-inflammatory T cells that aggravate disease severity [35].
Interestingly. CD56brightCD16neg/dim NK cells are considered to be efficient cytokine producers with immunoregulatory properties [36], whereas CD56dimCD16bright NK cells have essentially cytotoxic functions [37]. In line with previously published paper [32], we observed an increase in these cytotoxic CD56dimCD16bright cell phenotypes, associated with a decrease in immunoregulatory subsets of CD56brightCD16neg/dim NK cells in COVID-19 patients. This evidence of enhanced expression of cytotoxic NK subpopulations was further supported by elevated serum levels of sFas granzyme B and perforin that we found in our COVID-19 cohort. Lorente et al. reported that soluble levels of sFas, a proapoptotic protein of the extrinsic pathway. were lower in patients who survived COVID-19 [38]. Interestingly, in line with our data, Cifaldi et al. demonstrated that IL-6 directly reduced the expression of perforin and granzyme B [39]. As already demonstrated by Mazzoni et al. we also found an inverse correlation between serum levels of IL-6 and granzyme A, particularly in intensive-care patients [40].
Our results also sustain the hypothesis of a hyperactivation state of NK cells due to overexpression of CD25 and CD69 on the cell surface. The human CD69 antigen is one of the first cell-surface molecules expressed after activation of T, B and NK lymphocytes. CD69 is rapidly induced in NK cells shortly after activation and its role in NK cytotoxicity was demonstrated [41].
Higher percentages of adaptive/memory-like NK cells in patients with severe phenotypes compared to those with mild and moderate disease emerged from our data. In particular, cytotoxic CD56dimCD16bright and adaptive/memory-like NK cells were significantly more frequent in patients who died than in survivors. Adaptive/memory-like NK cell proliferation, characterised by high expression of NKG2C CD57, was originally described in response to cytomegalovirus infection [42]. Interestingly, our results also appear to confirm a reliable increase in these subsets of NK cells in patients with SARS-CoV-2 infection, suggesting intriguing insights into the role of these cells in the modulation of the immune response against viral infection.
Soleimanian et al. suggested that adaptive/memory-like NK cells, in particular NKG2C, could be exploited in future viral immunotherapy for COVID-19 [43], while Maucourant et al. also reported that the hallmarks of different immunotypes of patients were a high expression of perforin, NKG2C and Ksp37 reflecting the increased presence of adaptive NK cells in the bloodstream of patients with severe disease [44]. However, further studies are needed to determine the specific contribution of adaptive/memory-like NK cell proliferation to COVID-19 pathogenesis [45].
We also observed enhanced expression of programmed death-1 (PD-1) in CD56dim NK cells. PD-1 is an immunoregulatory receptor that may be expressed by different immune cell subtypes, including NK cells and T cells [46]. Dysregulation of PD-1 on the surface of T cells has been widely investigated [47], but little data is yet available about the expression of checkpoint inhibitors on the NK cell surface. In any case, there is evidence that PD-1 inhibitory signalling properties maintain an exhausted phenotype in NK cells and T cells in chronic infection and cancer [48]. In line with Li et al. our study found that expression levels of PD-1 on NK cells were significantly elevated in patients with COVID-19 compared to healthy controls, which implies an exhausted state of NK cells in patients with COVID-19 [37].
The natural cytotoxicity receptor NKp44 is another activating receptor that plays a crucial role in most functions exerted by activated NK cells [49]. Its role in COVID-19 has not previously been investigated. Here for the first time, we show higher percentages of this molecule in COVID-19 patients than controls, demonstrating important activation of NK cell cytotoxicity in this infection.
As Influenza Virus. SARS-CoV-2 directly affects NK cells. Peripheral blood CD56dimCD16+ and CD56brightCD16− NK cells were primed during influenza A infection [50]. As in SARS-CoV-2, Influenza-specific memory NK cells in humans suggest influenza-specific responses mediated by different subsets of NK cells [51].
Regarding T cells, a key role was performed by CD8, CD8 T cells and their various subsets, including CD8Teff and CD8Tscm, were higher in controls and in patients with mild COVID-19 than in patients with moderate or severe disease. This interesting finding is in line with Uzhachenko et al. who demonstrated that cytotoxic NK and adaptive CD8+ T lymphocytes (CTL) interact to elicit specific cytolytic outcomes in viral infection [52] and may therefore significantly influence the clinical course of COVID-19. Jiang reported that although CD8+ T and NK cells decreased in absolute number they increased in cytotoxic potential [53].
Regarding comorbidities, several pieces of evidence showed that immunometobolic dysregulation exaggerated by both obesity and viral infection can affect the progression of COVID-19, leading to a severe course [54,55]. Although the HC cohort was sex-matched, these subjects do not show any comorbidities or chronic diseases and this can be considered a bias of the study.
In conclusion, all these findings provide new insights into the immune response of patients with COVID-19. In particular, they demonstrate activation of NK through overexpression of CD69 and CD25 and show that PD-1 inhibitory signalling maintains an exhausted phenotype in NK cells. These results suggest that adaptive/memory-like NK cells could be the basis of promising targeted therapy for future viral infections.

Supplementary Materials

The following are available online at https://www.mdpi.com/article/10.3390/cells10113182/s1, Figure S1: Gate strategy of NK cellstube 1 (a), 2 (b) and 3 (c) and T maturation.

Author Contributions

Conceptualization, L.B. and M.d. methodology, S.G., D.C. and P.C.; software, L.B. validation, M.d. and P.C.; formal analysis, L.B. data curation, B.C.; writing—original draft preparation, M.d. and L.B.; writing—review and editing, E.B. and P.S.; supervision, E.B. and P.S. All authors have read and agreed to the published version of the manuscript.

Funding

The present study was unfunded.

Institutional Review Board Statement

The study was conducted according to the guidelines of the Declaration of Helsinki, and approved by the Institutional Review Board of CEAVSE (BIOBANCA-MIU-2010. MARKERLUNG 17431).

Informed Consent Statement

Informed consent was obtained from all subjects involved in the study.

Data Availability Statement

The data presented in this study are available on request from the corresponding author.

Conflicts of Interest

The authors declare no conflict of interest.

Abbreviations

Natural Killer (NK). T central memory (Tcm). T effector cells (Teff). Peripheral blood mononuclear cells (PBMCs). Forced vital capacity (FVC). Forced expiratory volume in the first second (FEV1). Diffusing capacity of the lung for carbon monoxide (DLCO).

References

  1. Bergantini, L.; Bargagli, E.; d’Alessandro, M.; Refini, R.M.; Cameli, P.; Galasso, L.; Scapellato, C.; Montagnani, F.; Scolletta, S.; Franchi, F.; et al. Prognostic bioindicators in severe COVID-19 patients. Cytokine 2021, 141, 155455. [Google Scholar] [CrossRef]
  2. Maucourant, C.; Filipovic, I.; Ponzetta, A.; Aleman, S.; Cornillet, M.; Hertwig, L.; Strunz, B.; Lentini, A.; Reinius, B.; Brownlie, D.; et al. Natural Killer Cell Activation Related to Clinical Outcome of COVID-19. 2020. Available online: https://www.medrxiv.org/content/10.1101/2020.07.07.20148478v1 (accessed on 15 October 2021).
  3. Guan, W.; Ni, Z.; Hu, Y.; Liang, W.; Ou, C.; He, J.; Liu, L.; Shan, H.; Lei, C.; Hui, D.S.C.; et al. Clinical Characteristics of Coronavirus Disease 2019 in China. N. Engl. J. Med. 2020. Available online: https://www.nejm.org/doi/10.1056/nejmoa2002032 (accessed on 15 October 2021).
  4. Mehta, P.; McAuley, D.F.; Brown, M.; Sanchez, E.; Tattersall, R.S.; Manson, J.J. COVID-19: Consider cytokine storm syndromes and immunosuppression. Lancet 2020, 395, 1033–1034. [Google Scholar] [CrossRef]
  5. Giamarellos-Bourboulis, E.J.; Netea, M.G.; Rovina, N.; Akinosoglou, K.; Antoniadou, A.; Antonakos, N.; Damoraki, G.; Gkavogianni, T.; Adami, M.-E.; Katsaounou, P.; et al. Complex Immune Dysregulation in COVID-19 Patients with Severe Respiratory Failure. Cell Host Microbe 2020, 27, 992–1000.e3. [Google Scholar] [CrossRef] [PubMed]
  6. Chen, G.; Wu, D.; Guo, W.; Cao, Y.; Huang, D.; Wang, H.; Wang, T.; Zhang, X.; Chen, H.; Yu, H.; et al. Clinical and immunological features of severe and moderate coronavirus disease 2019. J. Clin. Investig. 2020, 130, 2620–2629. [Google Scholar] [CrossRef] [PubMed] [Green Version]
  7. Cameli, P.; Bergantini, L.; d’Alessandro, M.; Bargagli, E. High-dose steroids for the treatment of severe COVID-19: A new therapeutic tool? Intern. Emerg. Med. 2021, 16, 1329–1330. [Google Scholar] [CrossRef] [PubMed]
  8. d’Alessandro, M.; Cameli, P.; Refini, R.M.; Bergantini, L.; Alonzi, V.; Lanzarone, N.; Bennett, D.; Rana, G.D.; Montagnani, F.; Scolletta, S.; et al. Serum KL-6 concentrations as a novel biomarker of severe COVID-19. J. Med. Virol. 2020, 92, 2216–2220. [Google Scholar] [CrossRef]
  9. Ghasemzadeh, M.; Ghasemzadeh, A.; Hosseini, E. Exhausted NK cells and cytokine storms in COVID-19: Whether NK celtherapy could be a therapeutic choice. Hum. Immunol. 2021, in press. [Google Scholar] [CrossRef] [PubMed]
  10. Hervier, B.; Russick, J.; Cremer, I.; Vieillard, V. NK Cells in the Human Lungs. Front. Immunol. 2019, 10, 1263. [Google Scholar] [CrossRef] [Green Version]
  11. Del Zotto, G.; Antonini, F.; Pesce, S.; Moretta, F.; Moretta, L.; Marcenaro, E. Comprehensive Phenotyping of Human PB NK Cells by Flow Cytometry. Cytometry A 2020, 97, 891–899. [Google Scholar] [CrossRef]
  12. Bergantini, L.; d’Alessandro, M.; Cameli, P.; Otranto, A.; Finco, T.; Curatola, G.; Sestini, P.; Bargagli, E. Prognostic role of NK cell percentages in bronchoalveolar lavage from patients with different fibrotic interstitial lung diseases. Clin. Immunol. 2021, 230, 108827. [Google Scholar] [CrossRef]
  13. Bergantini, L.; Cameli, P.; d’Alessandro, M.; Vagaggini, C.; Refini, R.M.; Landi, C.; Pieroni, M.G.; Sestini, P.; Bargagli, E. NK and NKT-like cells in granulomatous and fibrotic lung diseases. Clin. Exp. Med. 2019, 19, 487–494. [Google Scholar] [CrossRef] [PubMed]
  14. Balato, A.; Unutmaz, D.; Gaspari, A.A. Natural killer T cells: An unconventional T-cell subset with diverse effector and regulatory functions. J. Investig. Dermatol. 2009, 129, 1628–1642. [Google Scholar] [CrossRef] [PubMed] [Green Version]
  15. Vitale, M.; Bottino, C.; Sivori, S.; Sanseverino, L.; Castriconi, R.; Marcenaro, E.; Augugliaro, R.; Moretta, L.; Moretta, A. NKp44, a novel triggering surface molecule specifically expressed by activated natural killer cells, is involved in non-major histocompatibility complex-restricted tumor cell lysis. J. Exp. Med. 1998, 187, 2065–2072. [Google Scholar] [CrossRef]
  16. Pesce, S.; Belgrano, V.; Greppi, M.; Carlomagno, S.; Squillario, M.; Barla, A.; Della Chiesa, M.; Di Domenico, S.; Mavilio, D.; Moretta, L.; et al. Different Features of Tumor-Associated NK Cells in Patients with Low-Grade or High-Grade Peritoneal Carcinomatosis. Front. Immunol. 2019, 10, 1963. [Google Scholar] [CrossRef] [Green Version]
  17. Sun, J.C.; Lanier, L.L. NK cell development, homeostasis and function: Parallels with CD8+ T cells. Nat. Rev. Immunol. 2011, 11, 645–657. [Google Scholar] [CrossRef]
  18. Brandt, C.S.; Baratin, M.; Yi, E.C.; Kennedy, J.; Gao, Z.; Fox, B.; Haldeman, B.; Ostrander, C.D.; Kaifu, T.; Chabannon, C.; et al. The B7 family member B7-H6 is a tumor cell ligand for the activating natural killer cell receptor NKp30 in humans. J. Exp. Med. 2009, 206, 1495–1503. [Google Scholar] [CrossRef] [Green Version]
  19. Gaggero, S.; Bruschi, M.; Petretto, A.; Parodi, M.; Del Zotto, G.; Lavarello, C.; Prato, C.; Santucci, L.; Barbuto, A.; Bottino, C.; et al. Nidogen-1 is a novel extracellular ligand for the NKp44 activating receptor. Oncoimmunology 2018, 7, e1470730. [Google Scholar] [CrossRef]
  20. Narni-Mancinelli, E.; Gauthier, L.; Baratin, M.; Guia, S.; Fenis, A.; Deghmane, A.-E.; Rossi, B.; Fourquet, P.; Escalière, B.; Kerdiles, Y.M.; et al. Complement factor P is a ligand for the natural killer cell-activating receptor NKp46. Sci. Immunol. 2017, 2, eaam9628. [Google Scholar] [CrossRef] [PubMed] [Green Version]
  21. d’Alessandro, M.; Bennett, D.; Montagnani, F.; Cameli, P.; Perrone, A.; Bergantini, L.; Franchi, F.; Scolletta, S.; Mazzei, M.; Volterrani, L.; et al. Peripheral lymphocyte subset monitoring in COVID-19 Italian patients. Minerva Med. 2021, 112, 423–426. [Google Scholar] [CrossRef]
  22. Cook, K.D.; Waggoner, S.N.; Whitmire, J.K. NK cells and their ability to modulate T cells during virus infections. Crit. Rev. Immunol. 2014, 34, 359–388. [Google Scholar] [CrossRef] [PubMed]
  23. Barrow, A.D.; Edeling, M.A.; Trifonov, V.; Luo, J.; Goyal, P.; Bohl, B.; Bando, J.K.; Kim, A.H.; Walker, J.; Andahazy, M.; et al. Natural Killer Cells Control Tumor Growth by Sensing a Growth Factor. Cell 2018, 172, 534–548.e19. [Google Scholar] [CrossRef] [PubMed] [Green Version]
  24. Demaria, O.; Carvelli, J.; Batista, L.; Thibult, M.-L.; Morel, A.; André, P.; Morel, Y.; Vély, F.; Vivier, E. Identification of druggable inhibitory immune checkpoints on Natural Killer cells in COVID-19. Cell Mol. Immunol. 2020, 17, 995–997. [Google Scholar] [CrossRef] [PubMed]
  25. Daga, S.; Fallerini, C.; Baldassarri, M.; Fava, F.; Valentino, F.; Doddato, G.; Benetti, E.; Furini, S.; Giliberti, A.; Tita, R.; et al. Employing a systematic approach to biobanking and analyzing clinical and genetic data for advancing COVID-19 research. Eur. J. Hum. Genet. 2021, 29, 745–759. [Google Scholar] [CrossRef] [PubMed]
  26. Bergantini, L.; d’Alessandro, M.; Cameli, P.; Pianigiani, T.; Fanetti, M.; Sestini, P.; Bargagli, E. Follicular T Helper and Breg Cell Balance in Severe Allergic Asthma Before and After Omalizumab Therapy. Mol. Diagn. Ther. 2021, 25, 593–605. [Google Scholar] [CrossRef] [PubMed]
  27. Bergantini, L.; d’Alessandro, M.; Cameli, P.; Bono, C.; Perruzza, M.; Biagini, M.; Pini, L.; Bigliazzi, C.; Sestini, P.; Dotta, F.; et al. Regulatory T cell monitoring in severe eosinophilic asthma patients treated with mepolizumab. Scand. J. Immunol. 2021, 94, e13031. [Google Scholar] [CrossRef]
  28. Bergantini, L.; d’Alessandro, M.; Cameli, P.; Bianchi, F.; Sestini, P.; Bargagli, E.; Refini, R.M. Personalized Approach of Severe Eosinophilic Asthma Patients Treated with Mepolizumab and Benralizumab. IAA 2020, 181, 746–753. [Google Scholar] [CrossRef] [PubMed]
  29. d’Alessandro, M.; Bergantini, L.; Cameli, P.; Mezzasalma, F.; Refini, R.M.; Pieroni, M.; Sestini, P.; Bargagli, E. Adaptive immune system in pulmonary sarcoidosis-Comparison of peripheral and alveolar biomarkers. Clin. Exp. Immunol. 2021, 205, 406–416. [Google Scholar] [CrossRef] [PubMed]
  30. Bergantini, L.; d’Alessandro, M.; De Vita, E.; Perillo, F.; Fossi, A.; Luzzi, L.; Paladini, P.; Perrone, A.; Rottoli, P.; Sestini, P.; et al. Regulatory and Effector Cell Disequilibrium in Patients with Acute Cellular Rejection and Chronic Lung Allograft Dysfunction after Lung Transplantation: Comparison of Peripheral and Alveolar Distribution. Cells 2021, 10, 780. [Google Scholar] [CrossRef]
  31. Maecker, H.T. Multiparameter Flow Cytometry Monitoring of T Cell Responses. Methods Mol. Biol. 2009, 485, 375–391. [Google Scholar]
  32. Breadth of Concomitant Immune Responses Prior to Patient Recovery: A Case Report of Non-Severe COVID-19. Nat. Med. 2020, 26, 453–455. Available online: https://www.nature.com/articles/s41591-020-0819-2 (accessed on 4 November 2021).
  33. Zhang, Y.; Wang, X.; Li, X.; Xi, D.; Mao, R.; Wu, X.; Cheng, S.; Sun, X.; Yi, C.; Ling, Z.; et al. Potential contribution of increased soluble IL-2R to lymphopenia in COVID-19 patients. Cell Mol. Immunol. 2020, 17, 878–880. [Google Scholar] [CrossRef]
  34. Xie, M.; Yunis, J.; Yao, Y.; Shi, J.; Yang, Y.; Zhou, P.; Liang, K.; Wan, Y.; Mehdi, A.; Chen, Z.; et al. High levels of soluble CD25 in COVID-19 severity suggest a divergence between anti-viral and pro-inflammatory T-cell responses. Clin. Transl. Immunol. 2021, 10, e1251. [Google Scholar] [CrossRef]
  35. Michel, T.; Poli, A.; Cuapio, A.; Briquemont, B.; Iserentant, G.; Ollert, M.; Zimmer, J. Human CD56bright NK Cells: An Update. J. Immunol. 2016, 196, 2923–2931. [Google Scholar] [CrossRef] [PubMed] [Green Version]
  36. Carson, W.E.; Fehniger, T.A.; Caligiuri, M.A. CD56bright natural killer cell subsets: Characterization of distinct functional responses to interleukin-2 and the c-kit ligand. Eur. J. Immunol. 1997, 27, 354–360. [Google Scholar] [CrossRef] [PubMed]
  37. Li, M.; Guo, W.; Dong, Y.; Wang, X.; Dai, D.; Liu, X.; Wu, Y.; Li, M.; Zhang, W.; Zhou, H.; et al. Elevated Exhaustion Levels of NK and CD8+ T Cells as Indicators for Progression and Prognosis of COVID-19 Disease. Front. Immunol. 2020, 11, 2681. [Google Scholar] [CrossRef]
  38. Lorente, L.; Martín, M.M.; González-Rivero, A.F.; Pérez-Cejas, A.; Argueso, M.; Perez, A.; Ramos-Gómez, L.; Solé-Violán, J.; Marcos Y Ramos, J.A.; Ojeda, N.; et al. Blood concentrations of proapoptotic sFas and antiapoptotic Bcl2 and COVID-19 patient mortality. Expert Rev. Mol. Diagn. 2021, 21, 837–844. [Google Scholar] [CrossRef]
  39. Cifaldi, L.; Prencipe, G.; Caiello, I.; Bracaglia, C.; Locatelli, F.; De Benedetti, F.; Strippoli, R. Inhibition of natural killer cell cytotoxicity by interleukin-6: Implications for the pathogenesis of macrophage activation syndrome. Arthritis Rheumatol. 2015, 67, 3037–3046. [Google Scholar] [CrossRef]
  40. Mazzoni, A.; Salvati, L.; Maggi, L.; Capone, M.; Vanni, A.; Spinicci, M.; Mencarini, J.; Caporale, R.; Peruzzi, B.; Antonelli, A.; et al. Impaired immune cell cytotoxicity in severe COVID-19 is IL-6 dependent. J. Clin. Investig. 2020, 130, 4694–4703. [Google Scholar] [CrossRef] [PubMed]
  41. Borrego, F.; Robertson, M.J.; Ritz, J.; Peña, J.; Solana, R. CD69 is a stimulatory receptor for natural killer cell and its cytotoxic effect is blocked by CD94 inhibitory receptor. Immunology 1999, 97, 159–165. [Google Scholar] [CrossRef]
  42. Gumá, M.; Angulo, A.; Vilches, C.; Gómez-Lozano, N.; Malats, N.; López-Botet, M. Imprint of human cytomegalovirus infection on the NK cell receptor repertoire. Blood 2004, 104, 3664–3671. [Google Scholar] [CrossRef] [PubMed] [Green Version]
  43. Soleimanian, S.; Yaghobi, R. Harnessing Memory NK Cell to Protect Against COVID-19. Front. Pharmacol. 2020, 11, 1309. [Google Scholar] [CrossRef]
  44. Maucourant, C.; Filipovic, I.; Ponzetta, A.; Aleman, S.; Cornillet, M.; Hertwig, L.; Strunz, B.; Lentini, A.; Reinius, B.; Brownlie, D.; et al. Natural killer cell immunotypes related to COVID-19 disease severity. Sci. Immunol. 2020, 5, eabd6832. [Google Scholar] [CrossRef]
  45. Le Balc’h, P.; Pinceaux, K.; Pronier, C.; Seguin, P.; Tadié, J.-M.; Reizine, F. Herpes simplex virus and cytomegalovirus reactivations among severe COVID-19 patients. Crit. Care 2020, 24, 530. [Google Scholar] [CrossRef]
  46. Wherry, E.J.; Kurachi, M. Molecular and cellular insights into T cell exhaustion. Nat. Rev. Immunol. 2015, 15, 486–499. [Google Scholar] [CrossRef] [PubMed]
  47. Aghbash, P.S.; Eslami, N.; Shamekh, A.; Entezari-Maleki, T.; Baghi, H.B. SARS-CoV-2 infection: The role of PD-1/PD-L1 and CTLA-4 axis. Life Sci. 2021, 270, 119124. [Google Scholar] [CrossRef]
  48. McKinney, E.F.; Lee, J.C.; Jayne, D.R.W.; Lyons, P.A.; Smith, K.G.C. T-cell exhaustion, co-stimulation and clinical outcome in autoimmunity and infection. Nature 2015, 523, 612–616. [Google Scholar] [CrossRef] [PubMed] [Green Version]
  49. Parodi, M.; Favoreel, H.; Candiano, G.; Gaggero, S.; Sivori, S.; Mingari, M.C.; Moretta, L.; Vitale, M.; Cantoni, C. NKp44-NKp44 Ligand Interactions in the Regulation of Natural Killer Cells and Other Innate Lymphoid Cells in Humans. Front. Immunol. 2019, 10, 719. [Google Scholar] [CrossRef] [PubMed]
  50. Scharenberg, M.; Vangeti, S.; Kekäläinen, E.; Bergman, P.; Al-Ameri, M.; Johansson, N.; Sondén, K.; Falck-Jones, S.; Färnert, A.; Ljunggren, H.-G.; et al. Influenza A Virus Infection Induces Hyperresponsiveness in Human Lung Tissue-Resident and Peripheral Blood NK Cells. Front. Immunol. 2019, 10, 1116. [Google Scholar] [CrossRef] [PubMed] [Green Version]
  51. Jost, S.; Lucar, O.; Yoder, T.; Werner, A.; Ghofrani, J.; Reeves, R.K. Human influenza-specific adaptive NK cells mediate potent HLA-E-restricted responses against antigenically distinct influenza strains. J. Immunol. 2020, 204 (Suppl. S1), 148.5. [Google Scholar]
  52. Uzhachenko, R.V.; Shanker, A. CD8+ T Lymphocyte and NK Cell Network: Circuitry in the Cytotoxic Domain of Immunity. Front. Immunol. 2019, 10, 1906. [Google Scholar] [CrossRef] [Green Version]
  53. Jiang, Y.; Wei, X.; Guan, J.; Qin, S.; Wang, Z.; Lu, H.; Qian, J.; Wu, L.; Chen, Y.; Chen, Y.; et al. COVID-19 pneumonia: CD8+ T and NK cells are decreased in number but compensatory increased in cytotoxic potential. Clin. Immunol. 2020, 218, 108516. [Google Scholar] [CrossRef]
  54. Khwatenge, C.N.; Pate, M.; Miller, L.C.; Sang, Y. Immunometabolic Dysregulation at the Intersection of Obesity and COVID-19. Front. Immunol. 2021, 12, 732913. [Google Scholar] [CrossRef] [PubMed]
  55. Ronderos, D.; Omar, A.M.S.; Abbas, H.; Makker, J.; Baiomi, A.; Sun, H.; Mantri, N.; Choi, Y.; Fortuzi, K.; Shin, D.; et al. Chronic hepatitis-C infection in COVID-19 patients is associated with in-hospital mortality. World J. Clin. Cases 2021, 9, 8749–8762. [Google Scholar] [CrossRef] [PubMed]
Figure 1. Alteration in the proportion of NK cell subsets expressing in peripheral blood NK cells from COVID-19 patients and HC. (a) Frequency of CD56brightCD16low Immature NK. CD56dimCD16bright Mature NK cell and CD56negCD16bright NK cells subsets among groups. (b) Histogram of comparisons of cell expression in NK cells among groups. (c) Frequency of NKG2A+KIR Maturing NKG2A+KIR+ DP NK cell and NKG2AKIR+ NK subsets among groups. (d) Histogram of comparisons of cell expression NKG2A and KIR on NK cells among groups. (e) Frequency of PD1+NK cell subsets among groups. (f) Histogram of comparisons of cell expression in PD1+NK cells among groups. (g) Frequency of CD69+NK cell subsets among groups. (h) Histogram of comparisons of cell expression in CD69+NK cells among groups. (i) Frequency of NKp44+ NK cell subsets among groups. (l) Histogram of comparisons of cell expression in NKp44+NK cells among groups. (m) Frequency of CD25+NK cell subsets among groups. (n) Histogram of comparisons of cell expression in CD25+NK cells among groups. * p < 0.05. ** p < 0.01, **** p < 0.0001.
Cells 10 03182 g001aCells 10 03182 g001b
Figure 2. Alteration of immunologic features of the patients with COVI-19. Percentages of T cells from the healthy controls (n = 17), and COVID-19 (n = 35). The level of significance is indicated as follows: * p < 0.05. ** p < 0.01, *** p < 0.001, **** p < 0.0001.
Cells 10 03182 g002
Figure 3. (a) Principal Component Analysis (PCA) of NK cells and T cell subsets (b) The cellular subsets of patients were employed to create a decision tree model for the detection of best clustering variables between the two groups.
Cells 10 03182 g003
Figure 4. COVID-19 patients showed an imbalanced proportion of T cell subsets in peripheral blood T cells. Percentages of adaptive/mem.like NK cells. CD3+T cells. CD8+T cell subsets of total PBMCs from mild cases (n = 15). moderate cases (n = 12). and severe cases (n = 8). The level of significance is indicated as follows: * p < 0.05. ** p < 0.01.
Cells 10 03182 g004
Figure 5. (a) Principal Component Analysis (PCA) of NK cells and T cell subsets (b) The cellular subsets of patients were employed to create a decision tree model for the detection of best clustering variables between the two groups. (c) Principal Component Analysis (PCA) of NK cells and T cell subsets between died and survivors COVID-19 patients (d) The heat map analysis of the best discriminatory variable between died and survivors COVID-19 patients.
Cells 10 03182 g005
Figure 6. (a) Correlation Matrix of cytokines (b) Serum cytokine levels from the healthy controls (n = 17). and all COVID-19 patients (n = 35) and among mild cases (n = 15). moderate cases (n = 12) and severe cases (n = 8). The level of significance is indicated as follows: ns. notsignificant; * p < 0.05. ** p < 0.01, *** p < 0.001, and **** p < 0.0001.
Cells 10 03182 g006
Table 1. Demographic data and blood parameters of COVID-19 cohort and healthy controls.
HC (n = 17)COVID-19 (n = 35)p ValuesMild (n = 15)Moderate (n = 12)Severe (n = 8)p Values
AGE (years)65.3 ± 13.768.2 ± 16.3ns70.8 ± 1458 ± 771.5 ± 120ns
GENDER (f/m)6/117/28ns2/134/81/7ns
SMOKING HABITS (current/never/former)6/6/511/9/15ns3/4/84/3/54/2/2ns
Chest X-ray
(monolateral/bilateral pneumoniae)
10/25 5/104/81/7ns
Comorbidities:
yes/no
diabetes
arterial hypertension
other lung diseases
cancer
haematological disorders
0/3531/4
12/3
6
8
5
2
1

11/1
4
9
3
4
0

8/0
4
7
4
3
1
ns
CRP (mg/L) (median (IQR)) 4 (2.2–9.9) 3.8 (2.1–7.2)3.1(2–4.4)5.4(3.8–7.3)0.012
Blood counts:
RBC
WBC
PLT

4.4 (4.1–4.8)
6 (4.1–7.7)
197.5 (158–244)

4.2 (4.1–4.4)
6 (4.5–7.5)
197 (162–244)

3.9 (3–5.1)
6.7 (4.5–8.7)
217 (190–247)

3.5 (3–4.3)
5.3 (4.5–6.4)
190 (161–251)

ns
ns
ns
Leucocytes counts (%):
Lymphocytes
Neutrophils
Eosinophils
Monocytes

15.9 (9.3–19.7)
77.6 (70.9–88.5)
0 (0–0.2)
5.3 (6.1–10.1)

16.8 (9.5–28.9)
77.6 (56.5–80)
0 (0–0.4)
8.8 (4.1–12.8)

17 (10.5–32.9)
78.7 (52.1–82)
0 (0–0.4)
8.8 (4.1–12.8)

11.1 (7–14.6)
64 (48.3–83.2)
0 (0–0.6)
7.6 (5.1–11.1)

0.002
0.03
ns
ns
Publisher’s Note: MDPI stays neutral with regard to jurisdictional claims in published maps and institutional affiliations.

