
Plasma Metabolomics of Intermediate and Neovascular Age-Related Macular Degeneration Patients

 ,
, 
Abstract
1. Introduction
2. Materials and Methods
2.1. Study Participants
2.2. High-Resolution Untargeted Metabolomics
2.3. Data Processing and Analysis
2.4. Identification of Discriminatory Features
2.5. Metabolite Identification
2.6. Pathway Analysis
3. Results
3.1. Study Population Characteristics
3.2. High-Resolution Untargeted Metabolomics
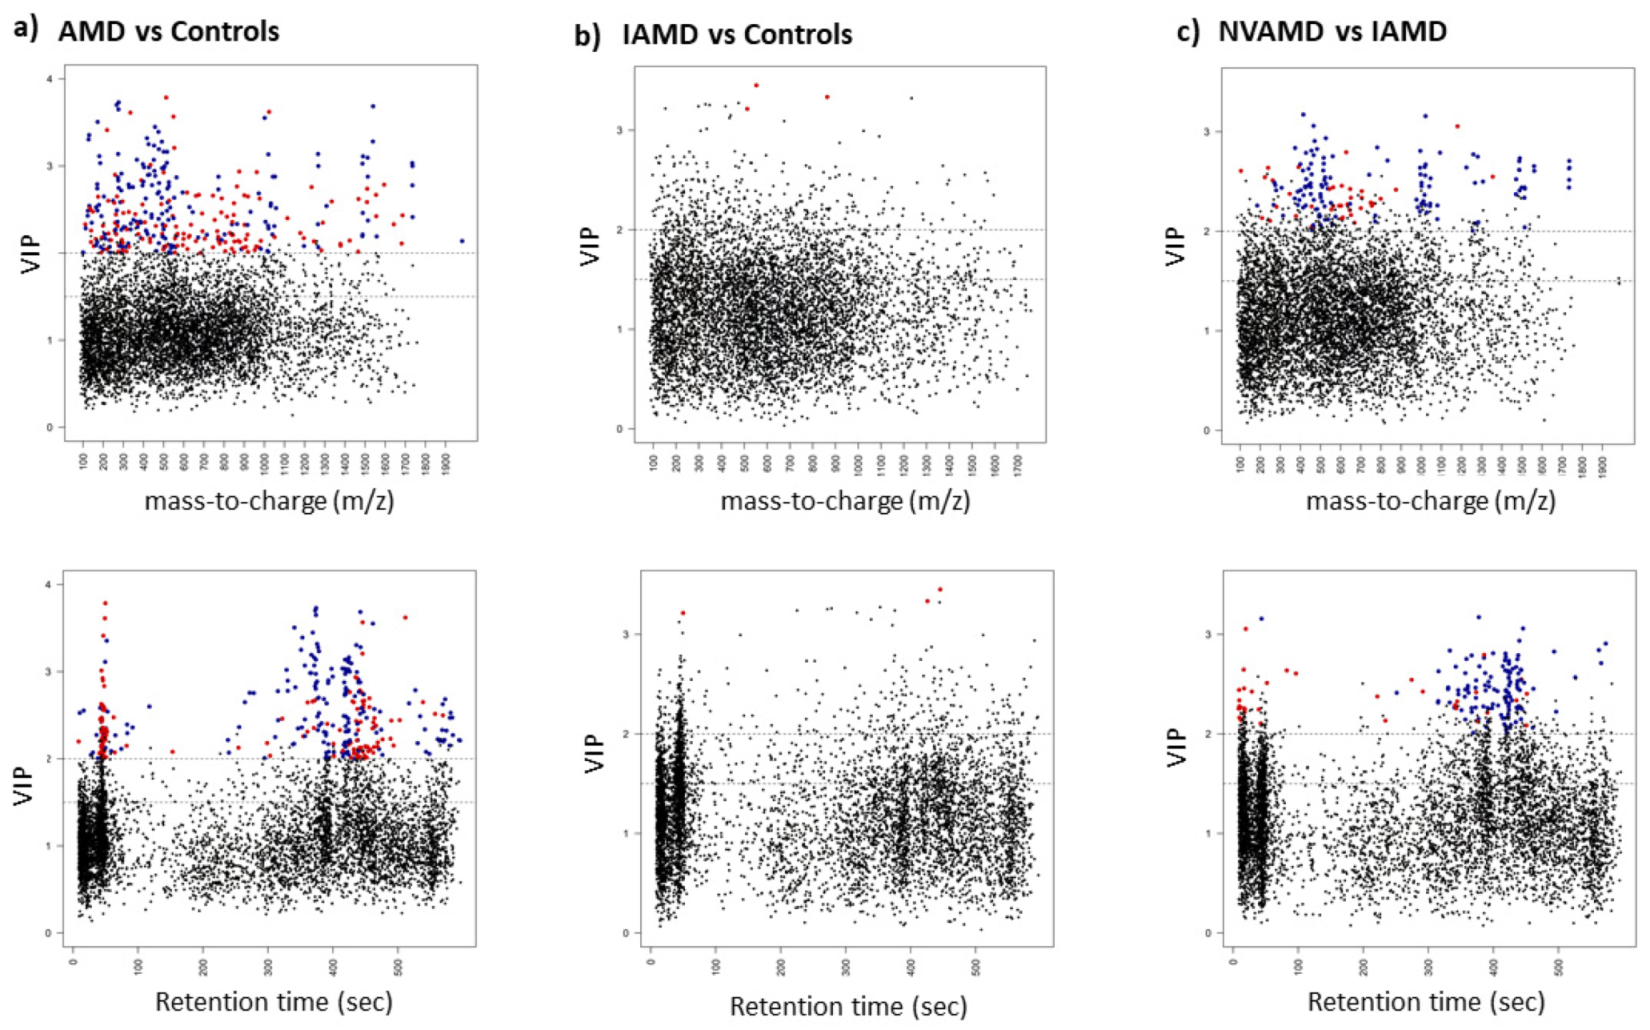
3.3. AMD vs. Controls
3.4. IAMD Patients vs. Controls
3.5. NVAMD Patients vs. IAMD Patients
3.6. Metabolite Identification
3.7. Pathway Analysis
4. Discussion
Supplementary Materials
Author Contributions
Funding
Institutional Review Board Statement
Informed Consent Statement
Data Availability Statement
Acknowledgments
Conflicts of Interest
Abbreviations
References
- Wong, W.L.; Su, X.; Li, X.; Cheung, C.M.G.; Klein, R.; Cheng, C.-Y.; Wong, T.Y. Global Prevalence of Age-Related Macular Degeneration and Disease Burden Projection for 2020 and 2040: A Systematic Review and Meta-Analysis. Lancet Glob. Health 2014, 2, e106–e116. [Google Scholar] [CrossRef]
- García-Layana, A.; Cabrera-López, F.; García-Arumí, J.; Arias-Barquet, L.; Ruiz-Moreno, J.M. Early and Intermediate Age-Related Macular Degeneration: Update and Clinical Review. Clin. Interv. Aging 2017, 12, 1579–1587. [Google Scholar] [CrossRef] [PubMed]
- Bressler, N.M. Early Detection and Treatment of Neovascular Age-Related Macular Degeneration. J. Am. Board Fam. Pract. 2002, 15, 142–152. [Google Scholar]
- Holekamp, N.M. Review of Neovascular Age-Related Macular Degeneration Treatment Options. Am. J. Manag. Care 2019, 25, S172–S181. [Google Scholar]
- Fritsche, L.G.; Igl, W.; Bailey, J.N.C.; Grassmann, F.; Sengupta, S.; Bragg-Gresham, J.L.; Burdon, K.P.; Hebbring, S.J.; Wen, C.; Gorski, M.; et al. A Large Genome-Wide Association Study of Age-Related Macular Degeneration Highlights Contributions of Rare and Common Variants. Nat. Genet. 2016, 48, 134–143. [Google Scholar] [CrossRef] [PubMed]
- Seddon, J.M.; Reynolds, R.; Yu, Y.; Daly, M.J.; Rosner, B. Risk Models for Progression to Advanced Age-Related Macular Degeneration Using Demographic, Environmental, Genetic, and Ocular Factors. Ophthalmology 2011, 118, 2203–2211. [Google Scholar] [CrossRef]
- Sobrin, L.; Seddon, J.M. Nature and Nurture- Genes and Environment- Predict Onset and Progression of Macular Degeneration. Prog. Retin. Eye Res. 2014, 40, 1–15. [Google Scholar] [CrossRef]
- Liu, X.; Locasale, J.W. Metabolomics: A Primer. Trends Biochem. Sci. 2017, 42, 274–284. [Google Scholar] [CrossRef]
- Tan, S.Z.; Begley, P.; Mullard, G.; Hollywood, K.A.; Bishop, P.N. Introduction to Metabolomics and Its Applications in Ophthalmology. Eye 2016, 30, 773–783. [Google Scholar] [CrossRef] [PubMed]
- Osborn, M.P.; Park, Y.; Parks, M.B.; Burgess, L.G.; Uppal, K.; Lee, K.; Jones, D.P.; Brantley, M.A. Metabolome-Wide Association Study of Neovascular Age-Related Macular Degeneration. PLoS ONE 2013, 8, e72737. [Google Scholar] [CrossRef]
- Laíns, I.; Duarte, D.; Barros, A.S.; Martins, A.S.; Gil, J.; Miller, J.B.; Marques, M.; Mesquita, T.; Kim, I.K.; Cachulo, M.D.L.; et al. Human Plasma Metabolomics in Age-Related Macular Degeneration (AMD) Using Nuclear Magnetic Resonance Spectroscopy. PLoS ONE 2017, 12, e0177749. [Google Scholar] [CrossRef]
- Luo, D.; Deng, T.; Yuan, W.; Deng, H.; Jin, M. Plasma Metabolomic Study in Chinese Patients with Wet Age-Related Macular Degeneration. BMC Ophthalmol. 2017, 17, 165. [Google Scholar] [CrossRef]
- Laíns, I.; Kelly, R.S.; Miller, J.B.; Silva, R.; Vavvas, D.G.; Kim, I.K.; Murta, J.N.; Lasky-Su, J.; Miller, J.W.; Husain, D. Human Plasma Metabolomics Study across All Stages of Age-Related Macular Degeneration Identifies Potential Lipid Biomarkers. Ophthalmology 2018, 125, 245–254. [Google Scholar] [CrossRef] [PubMed]
- Mitchell, S.L.; Uppal, K.; Williamson, S.M.; Liu, K.; Burgess, L.G.; Tran, V.; Umfress, A.C.; Jarrell, K.L.; Cooke Bailey, J.N.; Agarwal, A.; et al. The Carnitine Shuttle Pathway Is Altered in Patients with Neovascular Age-Related Macular Degeneration. Investig. Ophthalmol. Vis. Sci. 2018, 59, 4978–4985. [Google Scholar] [CrossRef]
- Laíns, I.; Chung, W.; Kelly, R.S.; Gil, J.; Marques, M.; Barreto, P.; Murta, J.N.; Kim, I.K.; Vavvas, D.G.; Miller, J.B.; et al. Human Plasma Metabolomics in Age-Related Macular Degeneration: Meta-Analysis of Two Cohorts. Metabolites 2019, 9, 127. [Google Scholar] [CrossRef] [PubMed]
- Kersten, E.; Dammeier, S.; Ajana, S.; Groenewoud, J.M.M.; Codrea, M.; Klose, F.; Lechanteur, Y.T.; Fauser, S.; Ueffing, M.; Delcourt, C.; et al. Metabolomics in Serum of Patients with Non-Advanced Age-Related Macular Degeneration Reveals Aberrations in the Glutamine Pathway. PLoS ONE 2019, 14, e0218457. [Google Scholar] [CrossRef] [PubMed]
- Acar, İ.E.; Lores-Motta, L.; Colijn, J.M.; Meester-Smoor, M.A.; Verzijden, T.; Cougnard-Gregoire, A.; Ajana, S.; Merle, B.M.J.; de Breuk, A.; Heesterbeek, T.J.; et al. Integrating Metabolomics, Genomics and Disease Pathways in Age-Related Macular Degeneration: The EYE-RISK Consortium. Ophthalmology 2020, 127, 1693–1709. [Google Scholar] [CrossRef]
- Chao de la Barca, J.M.; Rondet-Courbis, B.; Ferré, M.; Muller, J.; Buisset, A.; Leruez, S.; Plubeau, G.; Macé, T.; Moureauzeau, L.; Chupin, S.; et al. A Plasma Metabolomic Profiling of Exudative Age-Related Macular Degeneration Showing Carnosine and Mitochondrial Deficiencies. J. Clin. Med. 2020, 9, 631. [Google Scholar] [CrossRef] [PubMed]
- Han, G.; Wei, P.; He, M.; Teng, H.; Chu, Y. Metabolomic Profiling of the Aqueous Humor in Patients with Wet Age-Related Macular Degeneration Using UHPLC–MS/MS. J. Proteome Res. 2020, 19, 2358–2366. [Google Scholar] [CrossRef] [PubMed]
- Lains, I.; Zhu, S.; Han, X.; Chung, W.; Yuan, Q.; Kelly, R.S.; Gil, J.Q.; Katz, R.; Nigalye, A.; Kim, I.K.; et al. Genomic-Metabolomic Associations Support the Role of LIPC and Glycerophospholipids in Age-Related Macular Degeneration. Ophthalmol. Sci. 2021, 1, 100017. [Google Scholar] [CrossRef]
- Lambert, V.; Hansen, S.; Schoumacher, M.; Lecomte, J.; Leenders, J.; Hubert, P.; Herfs, M.; Blacher, S.; Carnet, O.; Yip, C.; et al. Pyruvate Dehydrogenase Kinase/Lactate Axis: A Therapeutic Target for Neovascular Age-Related Macular Degeneration Identified by Metabolomics. J. Mol. Med. 2020, 98, 1737–1751. [Google Scholar] [CrossRef]
- Seddon, J.M.; Sharma, S.; Adelman, R.A. Evaluation of the Clinical Age-Related Maculopathy Staging System. Ophthalmology 2006, 113, 260–266. [Google Scholar] [CrossRef]
- Go, Y.-M.; Walker, D.I.; Liang, Y.; Uppal, K.; Soltow, Q.A.; Tran, V.; Strobel, F.; Quyyumi, A.A.; Ziegler, T.R.; Pennell, K.D.; et al. Reference Standardization for Mass Spectrometry and High-Resolution Metabolomics Applications to Exposome Research. Toxicol. Sci. 2015, 148, 531–543. [Google Scholar] [CrossRef] [PubMed]
- Johnson, J.M.; Yu, T.; Strobel, F.H.; Jones, D.P. A Practical Approach to Detect Unique Metabolic Patterns for Personalized Medicine. Analyst 2010, 135, 2864–2870. [Google Scholar] [CrossRef] [PubMed]
- Soltow, Q.A.; Strobel, F.H.; Mansfield, K.G.; Wachtman, L.; Park, Y.; Jones, D.P. High-Performance Metabolic Profiling with Dual Chromatography-Fourier-Transform Mass Spectrometry (DC-FTMS) for Study of the Exposome. Metabolomics 2013, 9, S132–S143. [Google Scholar] [CrossRef] [PubMed]
- Frediani, J.K.; Jones, D.P.; Tukvadze, N.; Uppal, K.; Sanikidze, E.; Kipiani, M.; Tran, V.T.; Hebbar, G.; Walker, D.I.; Kempker, R.R.; et al. Plasma Metabolomics in Human Pulmonary Tuberculosis Disease: A Pilot Study. PLoS ONE 2014, 9, e108854. [Google Scholar] [CrossRef]
- Burgess, L.G.; Uppal, K.; Walker, D.I.; Roberson, R.M.; Tran, V.; Parks, M.B.; Wade, E.A.; May, A.T.; Umfress, A.C.; Jarrell, K.L.; et al. Metabolome-Wide Association Study of Primary Open Angle Glaucoma. Investig. Ophthalmol. Vis. Sci. 2015, 56, 5020–5028. [Google Scholar] [CrossRef]
- Roede, J.R.; Uppal, K.; Park, Y.; Lee, K.; Tran, V.; Walker, D.; Strobel, F.H.; Rhodes, S.L.; Ritz, B.; Jones, D.P. Serum Metabolomics of Slow vs. Rapid Motor Progression Parkinson’s Disease: A Pilot Study. PLoS ONE 2013, 8, e77629. [Google Scholar] [CrossRef]
- Yu, T.; Park, Y.; Johnson, J.M.; Jones, D.P. ApLCMS—Adaptive Processing of High-Resolution LC/MS Data. Bioinformatics 2009, 25, 1930–1936. [Google Scholar] [CrossRef]
- Uppal, K.; Soltow, Q.A.; Strobel, F.H.; Pittard, W.S.; Gernert, K.M.; Yu, T.; Jones, D.P. XMSanalyzer: Automated Pipeline for Improved Feature Detection and Downstream Analysis of Large-Scale, Non-Targeted Metabolomics Data. BMC Bioinform. 2013, 14, 15. [Google Scholar] [CrossRef]
- Johnson, W.E.; Li, C.; Rabinovic, A. Adjusting Batch Effects in Microarray Expression Data Using Empirical Bayes Methods. Biostatistics 2007, 8, 118–127. [Google Scholar] [CrossRef]
- Uppal, K.; Walker, D.I.; Jones, D.P. XMSannotator: An R Package for Network-Based Annotation of High-Resolution Metabolomics Data. Anal. Chem. 2017, 89, 1063–1067. [Google Scholar] [CrossRef] [PubMed]
- Patel, R.M.; Roback, J.D.; Uppal, K.; Yu, T.; Jones, D.P.; Josephson, C.D. Metabolomics Profile Comparisons of Irradiated and Nonirradiated Stored Donor Red Blood Cells. Transfusion 2015, 55, 544–552. [Google Scholar] [CrossRef]
- Rohart, F.; Gautier, B.; Singh, A.; Lê Cao, K.-A. MixOmics: An R Package for ‘omics Feature Selection and Multiple Data Integration. PLoS Comput. Biol. 2017, 13, e1005752. [Google Scholar] [CrossRef]
- Smith, C.A.; Want, E.J.; O’Maille, G.; Abagyan, R.; Siuzdak, G. XCMS: Processing Mass Spectrometry Data for Metabolite Profiling Using Nonlinear Peak Alignment, Matching, and Identification. Anal. Chem. 2006, 78, 779–787. [Google Scholar] [CrossRef]
- Tautenhahn, R.; Böttcher, C.; Neumann, S. Highly Sensitive Feature Detection for High Resolution LC/MS. BMC Bioinform. 2008, 9, 504. [Google Scholar] [CrossRef] [PubMed]
- Benton, H.P.; Want, E.J.; Ebbels, T.M.D. Correction of Mass Calibration Gaps in Liquid Chromatography-Mass Spectrometry Metabolomics Data. Bioinformatics 2010, 26, 2488–2489. [Google Scholar] [CrossRef]
- Ruttkies, C.; Schymanski, E.L.; Wolf, S.; Hollender, J.; Neumann, S. MetFrag Relaunched: Incorporating Strategies beyond in Silico Fragmentation. J. Cheminform. 2016, 8, 3. [Google Scholar] [CrossRef] [PubMed]
- Sumner, L.W.; Amberg, A.; Barrett, D.; Beale, M.H.; Beger, R.; Daykin, C.A.; Fan, T.W.-M.; Fiehn, O.; Goodacre, R.; Griffin, J.L.; et al. Proposed Minimum Reporting Standards for Chemical Analysis Chemical Analysis Working Group (CAWG) Metabolomics Standards Initiative (MSI). Metabolomics 2007, 3, 211–221. [Google Scholar] [CrossRef]
- Li, S.; Park, Y.; Duraisingham, S.; Strobel, F.H.; Khan, N.; Soltow, Q.A.; Jones, D.P.; Pulendran, B. Predicting Network Activity from High Throughput Metabolomics. PLoS Comput. Biol. 2013, 9, e1003123. [Google Scholar] [CrossRef]
- Li, S.; Sullivan, N.L.; Rouphael, N.; Yu, T.; Banton, S.; Maddur, M.S.; McCausland, M.; Chiu, C.; Canniff, J.; Dubey, S.; et al. Metabolic Phenotypes of Response to Vaccination in Humans. Cell 2017, 169, 862–877.e17. [Google Scholar] [CrossRef]
- Khatri, P.; Sirota, M.; Butte, A.J. Ten Years of Pathway Analysis: Current Approaches and Outstanding Challenges. PLoS Comput. Biol. 2012, 8, e1002375. [Google Scholar] [CrossRef]
- Accardi, C.J.; Walker, D.I.; Uppal, K.; Quyyumi, A.A.; Rohrbeck, P.; Pennell, K.D.; Mallon, C.T.M.; Jones, D.P. High-Resolution Metabolomics for Nutrition and Health Assessment of Armed Forces Personnel. J. Occup. Environ. Med. 2016, 58, S80. [Google Scholar] [CrossRef] [PubMed]
- Go, Y.-M.; Liang, Y.; Uppal, K.; Soltow, Q.A.; Promislow, D.E.L.; Wachtman, L.M.; Jones, D.P. Metabolic Characterization of the Common Marmoset (Callithrix Jacchus). PLoS ONE 2015, 10, e0142916. [Google Scholar] [CrossRef] [PubMed]
- Kalucka, J.; Bierhansl, L.; Conchinha, N.V.; Missiaen, R.; Elia, I.; Brüning, U.; Scheinok, S.; Treps, L.; Cantelmo, A.R.; Dubois, C.; et al. Quiescent Endothelial Cells Upregulate Fatty Acid β-Oxidation for Vasculoprotection via Redox Homeostasis. Cell Metab. 2018, 28, 881–894. [Google Scholar] [CrossRef]
- Schoors, S.; Bruning, U.; Missiaen, R.; Queiroz, K.C.; Borgers, G.; Elia, I.; Zecchin, A.; Cantelmo, A.R.; Christen, S.; Goveia, J.; et al. Fatty Acid Carbon Is Essential for DNTP Synthesis in Endothelial Cells. Nature 2015, 520, 192–197. [Google Scholar] [CrossRef]
- Montgomery, C.L.; Keereetaweep, J.; Johnson, H.M.; Grillo, S.L.; Chapman, K.D.; Koulen, P. Changes in Retinal N-Acylethanolamines and Their Oxylipin Derivatives During the Development of Visual Impairment in a Mouse Model for Glaucoma. Lipids 2016, 51, 857–866. [Google Scholar] [CrossRef]
- Matias, I.; Wang, J.W.; Moriello, A.S.; Nieves, A.; Woodward, D.F.; Di Marzo, V. Changes in Endocannabinoid and Palmitoylethanolamide Levels in Eye Tissues of Patients with Diabetic Retinopathy and Age-Related Macular Degeneration. Prostaglandins Leukot. Essent. Fat. Acids 2006, 75, 413–418. [Google Scholar] [CrossRef] [PubMed]
- Duncan, R.S.; Xin, H.; Goad, D.L.; Chapman, K.D.; Koulen, P. Protection of Neurons in the Retinal Ganglion Cell Layer against Excitotoxicity by the N-Acylethanolamine, N-Linoleoylethanolamine. Clin. Ophthalmol. 2011, 5, 543–548. [Google Scholar] [CrossRef]
- Garg, P.; Duncan, R.S.; Kaja, S.; Koulen, P. Intracellular Mechanisms of N-Acylethanolamine-Mediated Neuroprotection in a Rat Model of Stroke. Neuroscience 2010, 166, 252–262. [Google Scholar] [CrossRef]
- Payne, A.J.; Kaja, S.; Sabates, N.R.; Koulen, P. A Case for Neuroprotection in Ophthalmology: Developments in Translational Research. Mo. Med. 2013, 110, 429–436. [Google Scholar]
- Brown, C.; Green, B.; Thompson, R.; den Hollander, A.; Lengyel, I.; on behalf of the EYE-RISK Consortium. Metabolomics and Age-Related Macular Degeneration. Metabolites 2018, 9, 4. [Google Scholar] [CrossRef] [PubMed]
- Dunn, W.B.; Broadhurst, D.; Begley, P.; Zelena, E.; Francis-McIntyre, S.; Anderson, N.; Brown, M.; Knowles, J.D.; Halsall, A.; Haselden, J.N.; et al. Procedures for Large-Scale Metabolic Profiling of Serum and Plasma Using Gas Chromatography and Liquid Chromatography Coupled to Mass Spectrometry. Nat. Protoc. 2011, 6, 1060–1083. [Google Scholar] [CrossRef] [PubMed]
- Uppal, K.; Walker, D.I.; Liu, K.; Li, S.; Go, Y.-M.; Jones, D.P. Computational Metabolomics: A Framework for the Million Metabolome. Chem. Res. Toxicol. 2016, 29, 1956–1975. [Google Scholar] [CrossRef] [PubMed]
- Chen, G.; Walmsley, S.; Cheung, G.C.M.; Chen, L.; Cheng, C.-Y.; Beuerman, R.W.; Wong, T.Y.; Zhou, L.; Choi, H. Customized Consensus Spectral Library Building for Untargeted Quantitative Metabolomics Analysis with Data Independent Acquisition Mass Spectrometry and MetaboDIA Workflow. Anal. Chem. 2017, 89, 4897–4906. [Google Scholar] [CrossRef]


| Characteristic | Controls (n = 195) | AMD (n = 191) | IAMD (n = 91) | NVAMD (n = 100) |
|---|---|---|---|---|
| Age, years | 71.9 ± 6.5 | 77.6 ± 7.3 * | 75.7 ± 7.5 * | 79.2 ± 6.8 *,† |
| Female, % | 63.6 | 64.4 | 63.0 | 65.0 |
| Smokers, % | 50.3 | 57.1 | 52.8 | 61.0 |
| BMI, kg/m2 | 26.9 ± 5.0 | 26.5 ± 4.5 | 26.1 ± 4.8 | 26.8 ± 4.2 |
| Diabetes, % | 17.7 | 20.8 | 17.8 | 23.3 |
| Hypertension, % | 51.1 | 54.0 | 46.0 | 60.9 |
| Hyperlipidemia, % | 53.9 | 45.9 | 41.7 | 49.4 |
| m/z | RT (sec) | Verified Metabolite or Metabolite Class | Metabolite Identification Level | AMD/ Controls Fold Change | IAMD/ Controls Fold Change | NVAMD/ IAMD Fold Change |
|---|---|---|---|---|---|---|
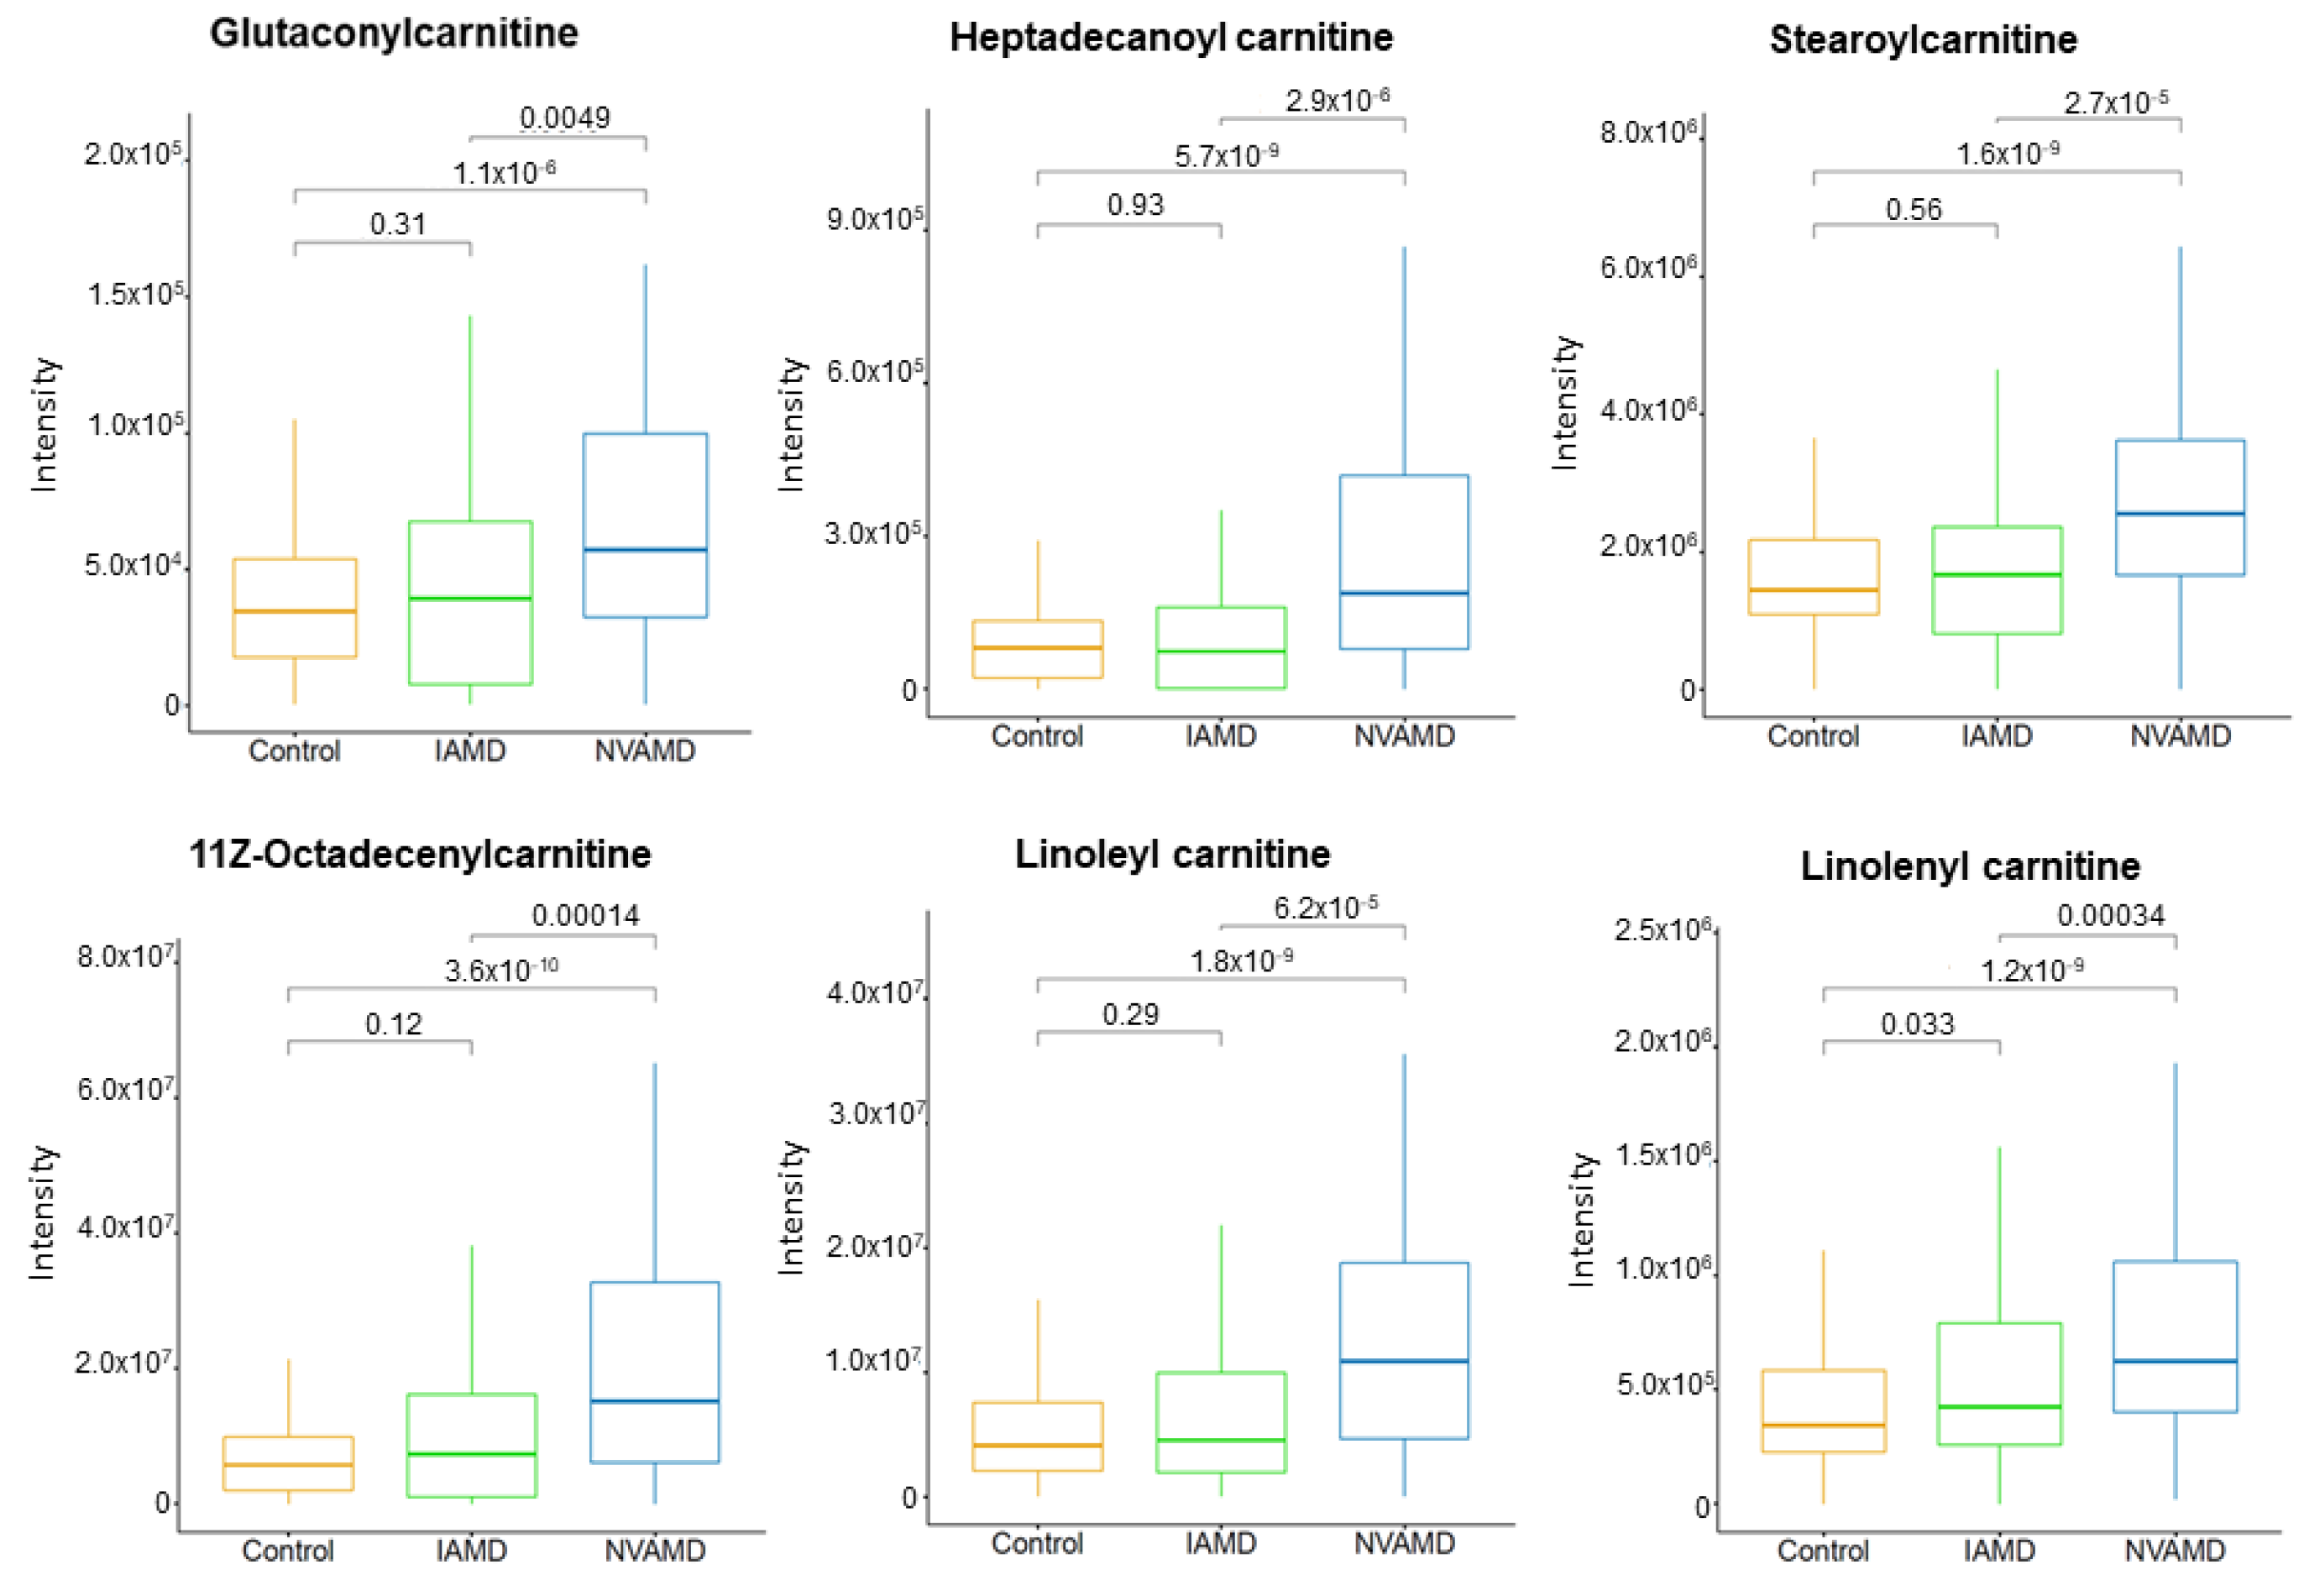
| Acylcarnitines | ||||||
| 414.3568 | 377.7 | Heptadecanoyl carnitine | 2 | - | - | 2.08 |
| 426.3568 | 366.5 | 11Z-Octadecenylcarnitine | 2 | - | - | 1.74 |
| 424.3419 | 345.9 | Linoleyl carnitine | 2 | - | - | 1.75 |
| 422.3270 | 330.5 | Linolenyl carnitine * | 2 | 1.63 | - | - |
| 274.1263 | 373.8 | Glutaconylcarnitine | 2 | 1.49 | - | - |
| 428.3721 | 392.6 | Stearoylcarnitine | 2 | - | - | 1.83 |
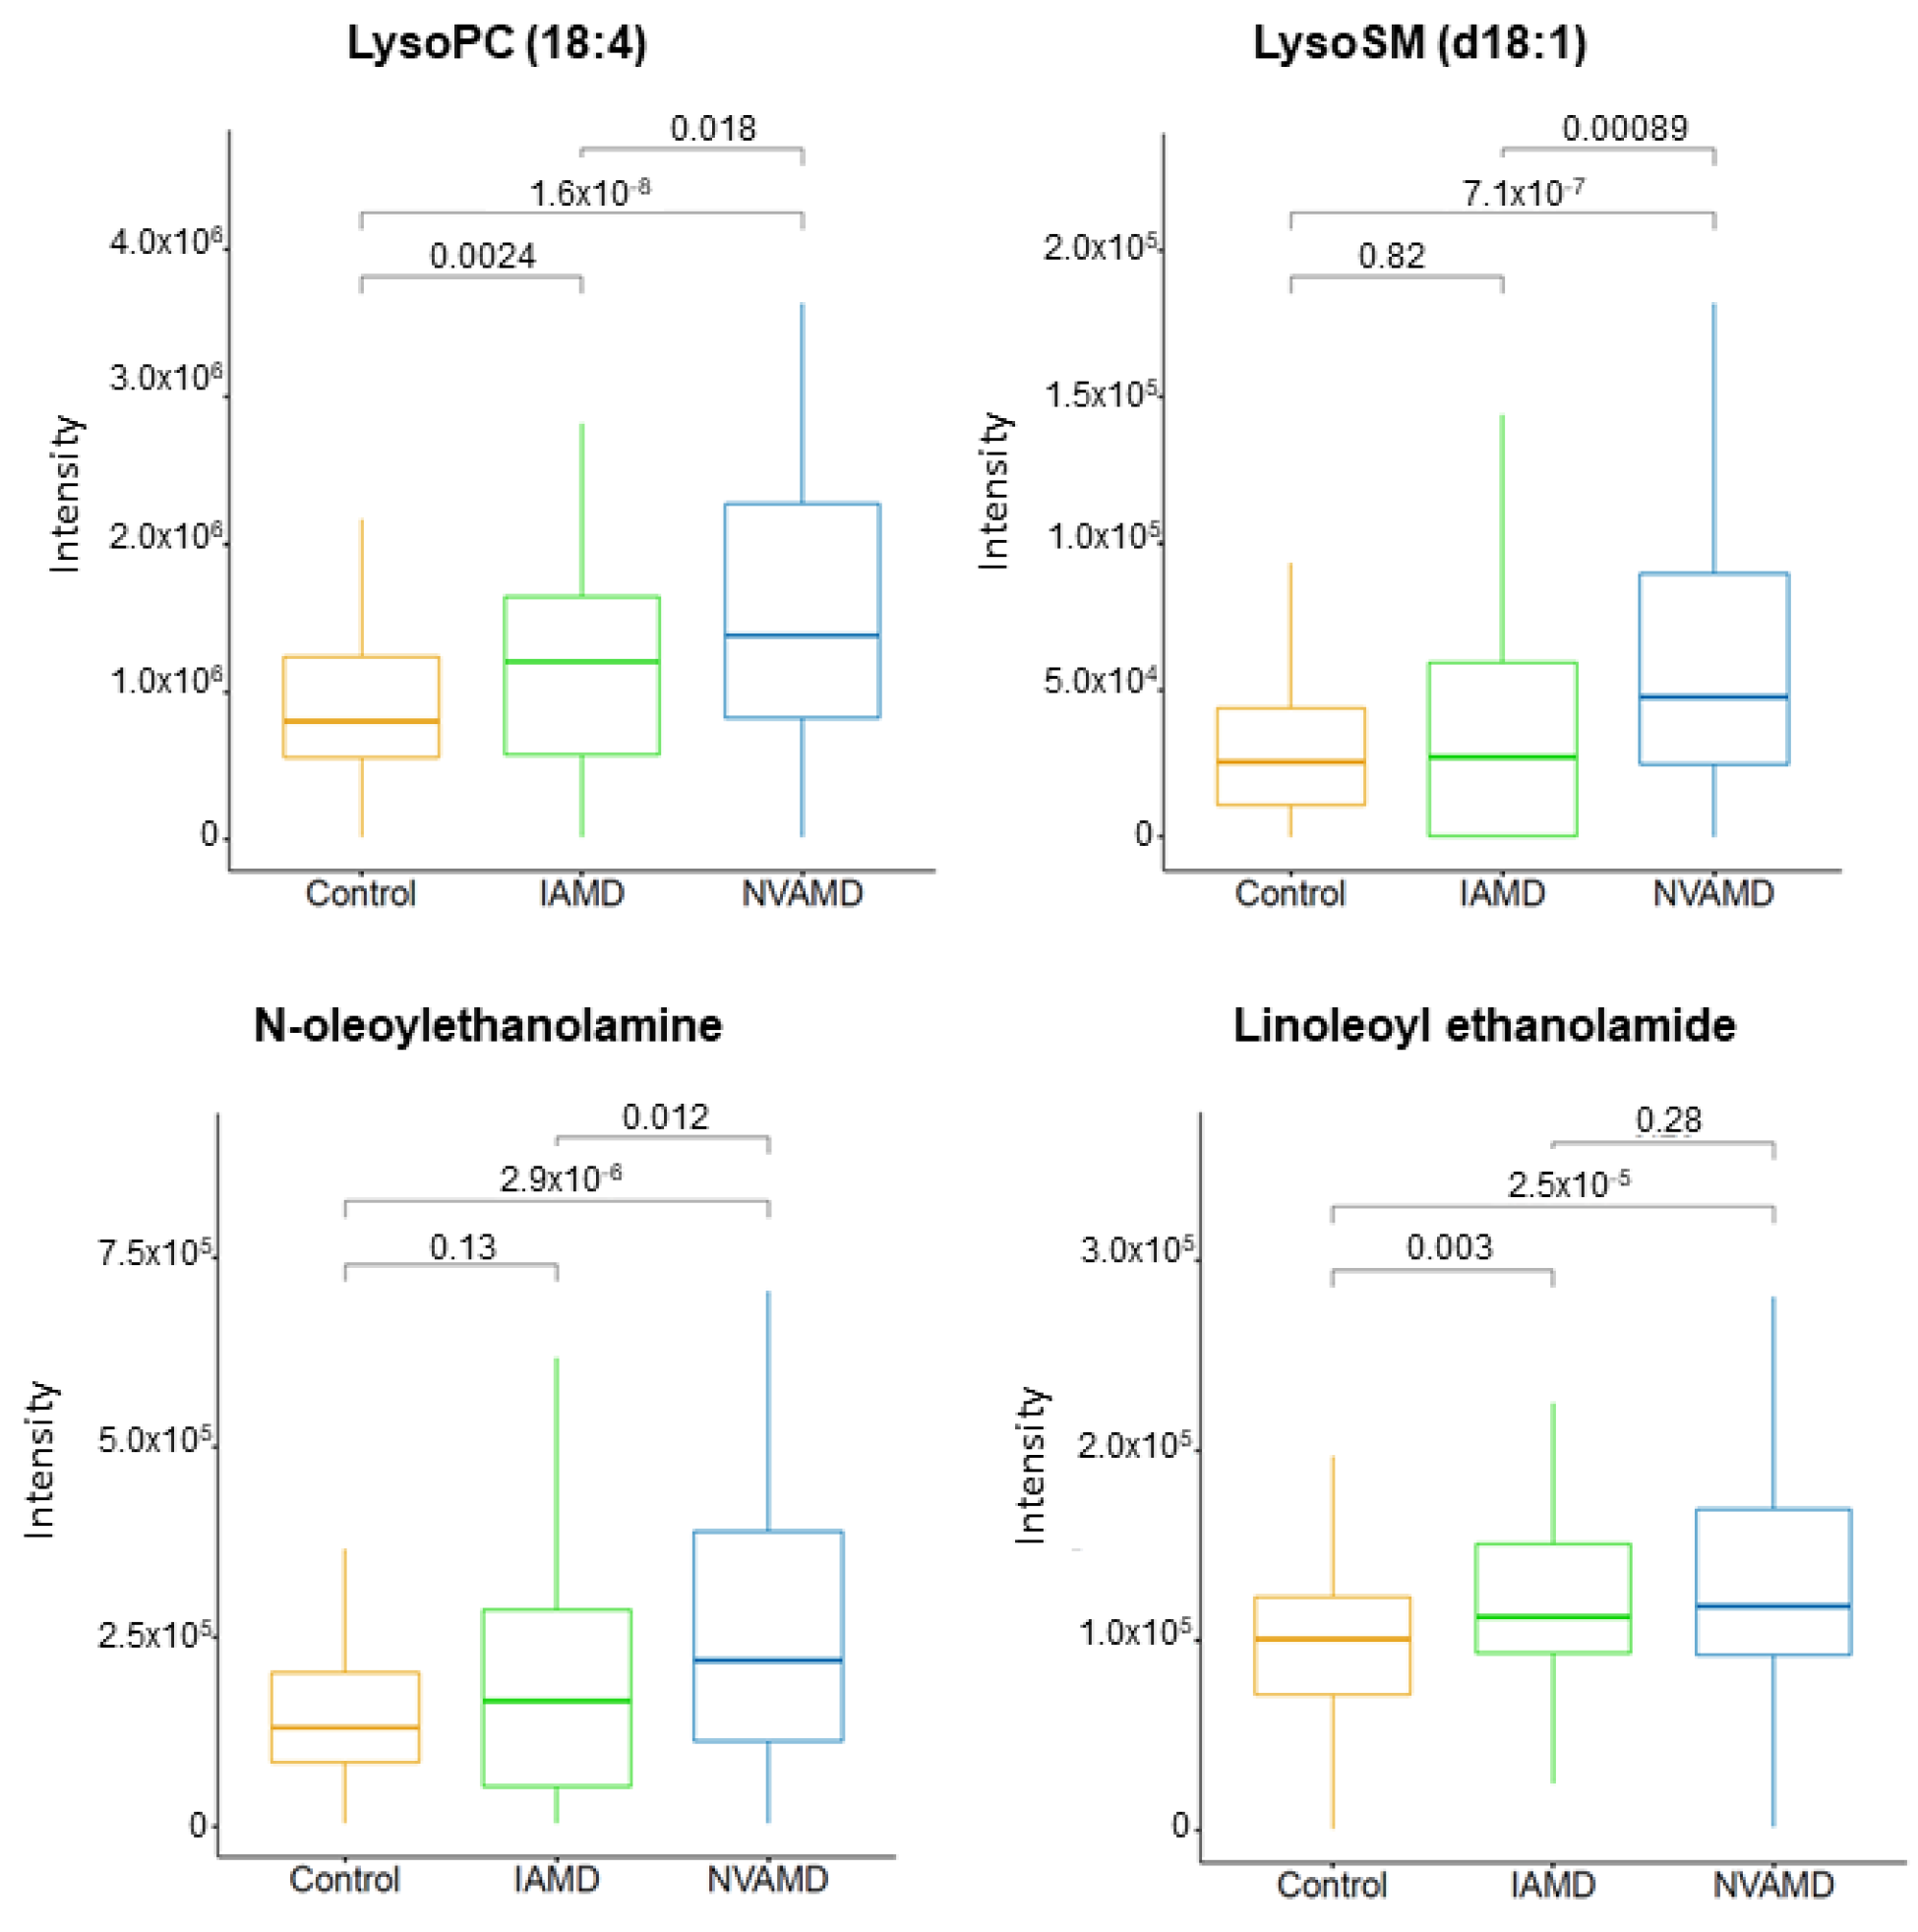
| Lipid metabolites | ||||||
| 466.3518 | 332.9 | LysoSM (d18:1) * | 2 | - | - | 2.34 |
| 516.3057 | 376.2 | LysoPC (18:4) * | 2 | 1.47 | - | - |
| 324.2893 | 471.0 | Linoleoyl ethanolamide | 2 | 1.32 | - | - |
| 326.3045 | 526.9 | N-Oleoylethanolamine | 2 | 1.37 | - | - |
| Steroids and steroid derivatives | ||||||
| 413.3451 | 351.0 | 25-Hydroxyvitamin D2 | 2 | - | - | 2.16 |
| 347.2213 | 271.9 | Cortexolone | 2 | 3.12 | - | - |
| Amino acid-related metabolites | ||||||
| 130.0499 | 51.9 | Pyroglutamic acid | 1 | 1.52 | - | - |
| 209.0910 | 234.1 | Kynurenine | 1 | - | - | 0.72 |
Publisher’s Note: MDPI stays neutral with regard to jurisdictional claims in published maps and institutional affiliations. |
© 2021 by the authors. Licensee MDPI, Basel, Switzerland. This article is an open access article distributed under the terms and conditions of the Creative Commons Attribution (CC BY) license (https://creativecommons.org/licenses/by/4.0/).
Share and Cite
Mitchell, S.L.; Ma, C.; Scott, W.K.; Agarwal, A.; Pericak-Vance, M.A.; Haines, J.L.; Jones, D.P.; Uppal, K.; Brantley, M.A., Jr. Plasma Metabolomics of Intermediate and Neovascular Age-Related Macular Degeneration Patients. Cells 2021, 10, 3141. https://doi.org/10.3390/cells10113141
Mitchell SL, Ma C, Scott WK, Agarwal A, Pericak-Vance MA, Haines JL, Jones DP, Uppal K, Brantley MA Jr. Plasma Metabolomics of Intermediate and Neovascular Age-Related Macular Degeneration Patients. Cells. 2021; 10(11):3141. https://doi.org/10.3390/cells10113141
Chicago/Turabian StyleMitchell, Sabrina L., Chunyu Ma, William K. Scott, Anita Agarwal, Margaret A. Pericak-Vance, Jonathan L. Haines, Dean P. Jones, Karan Uppal, and Milam A. Brantley, Jr. 2021. "Plasma Metabolomics of Intermediate and Neovascular Age-Related Macular Degeneration Patients" Cells 10, no. 11: 3141. https://doi.org/10.3390/cells10113141
APA StyleMitchell, S. L., Ma, C., Scott, W. K., Agarwal, A., Pericak-Vance, M. A., Haines, J. L., Jones, D. P., Uppal, K., & Brantley, M. A., Jr. (2021). Plasma Metabolomics of Intermediate and Neovascular Age-Related Macular Degeneration Patients. Cells, 10(11), 3141. https://doi.org/10.3390/cells10113141