
Increased Intrahepatic Expression of Immune Checkpoint Molecules in Autoimmune Liver Disease

 ,
,  ,
,
Abstract
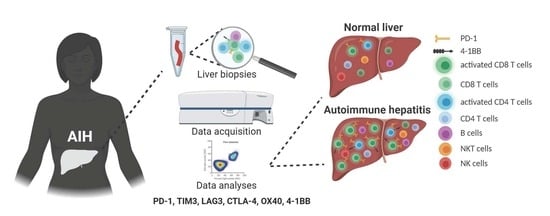
1. Introduction
2. Materials and Methods
2.1. Patients and Liver Biopsy Processing
2.2. Flow Cytometry Analyses
2.3. Statistical Analysis
3. Results
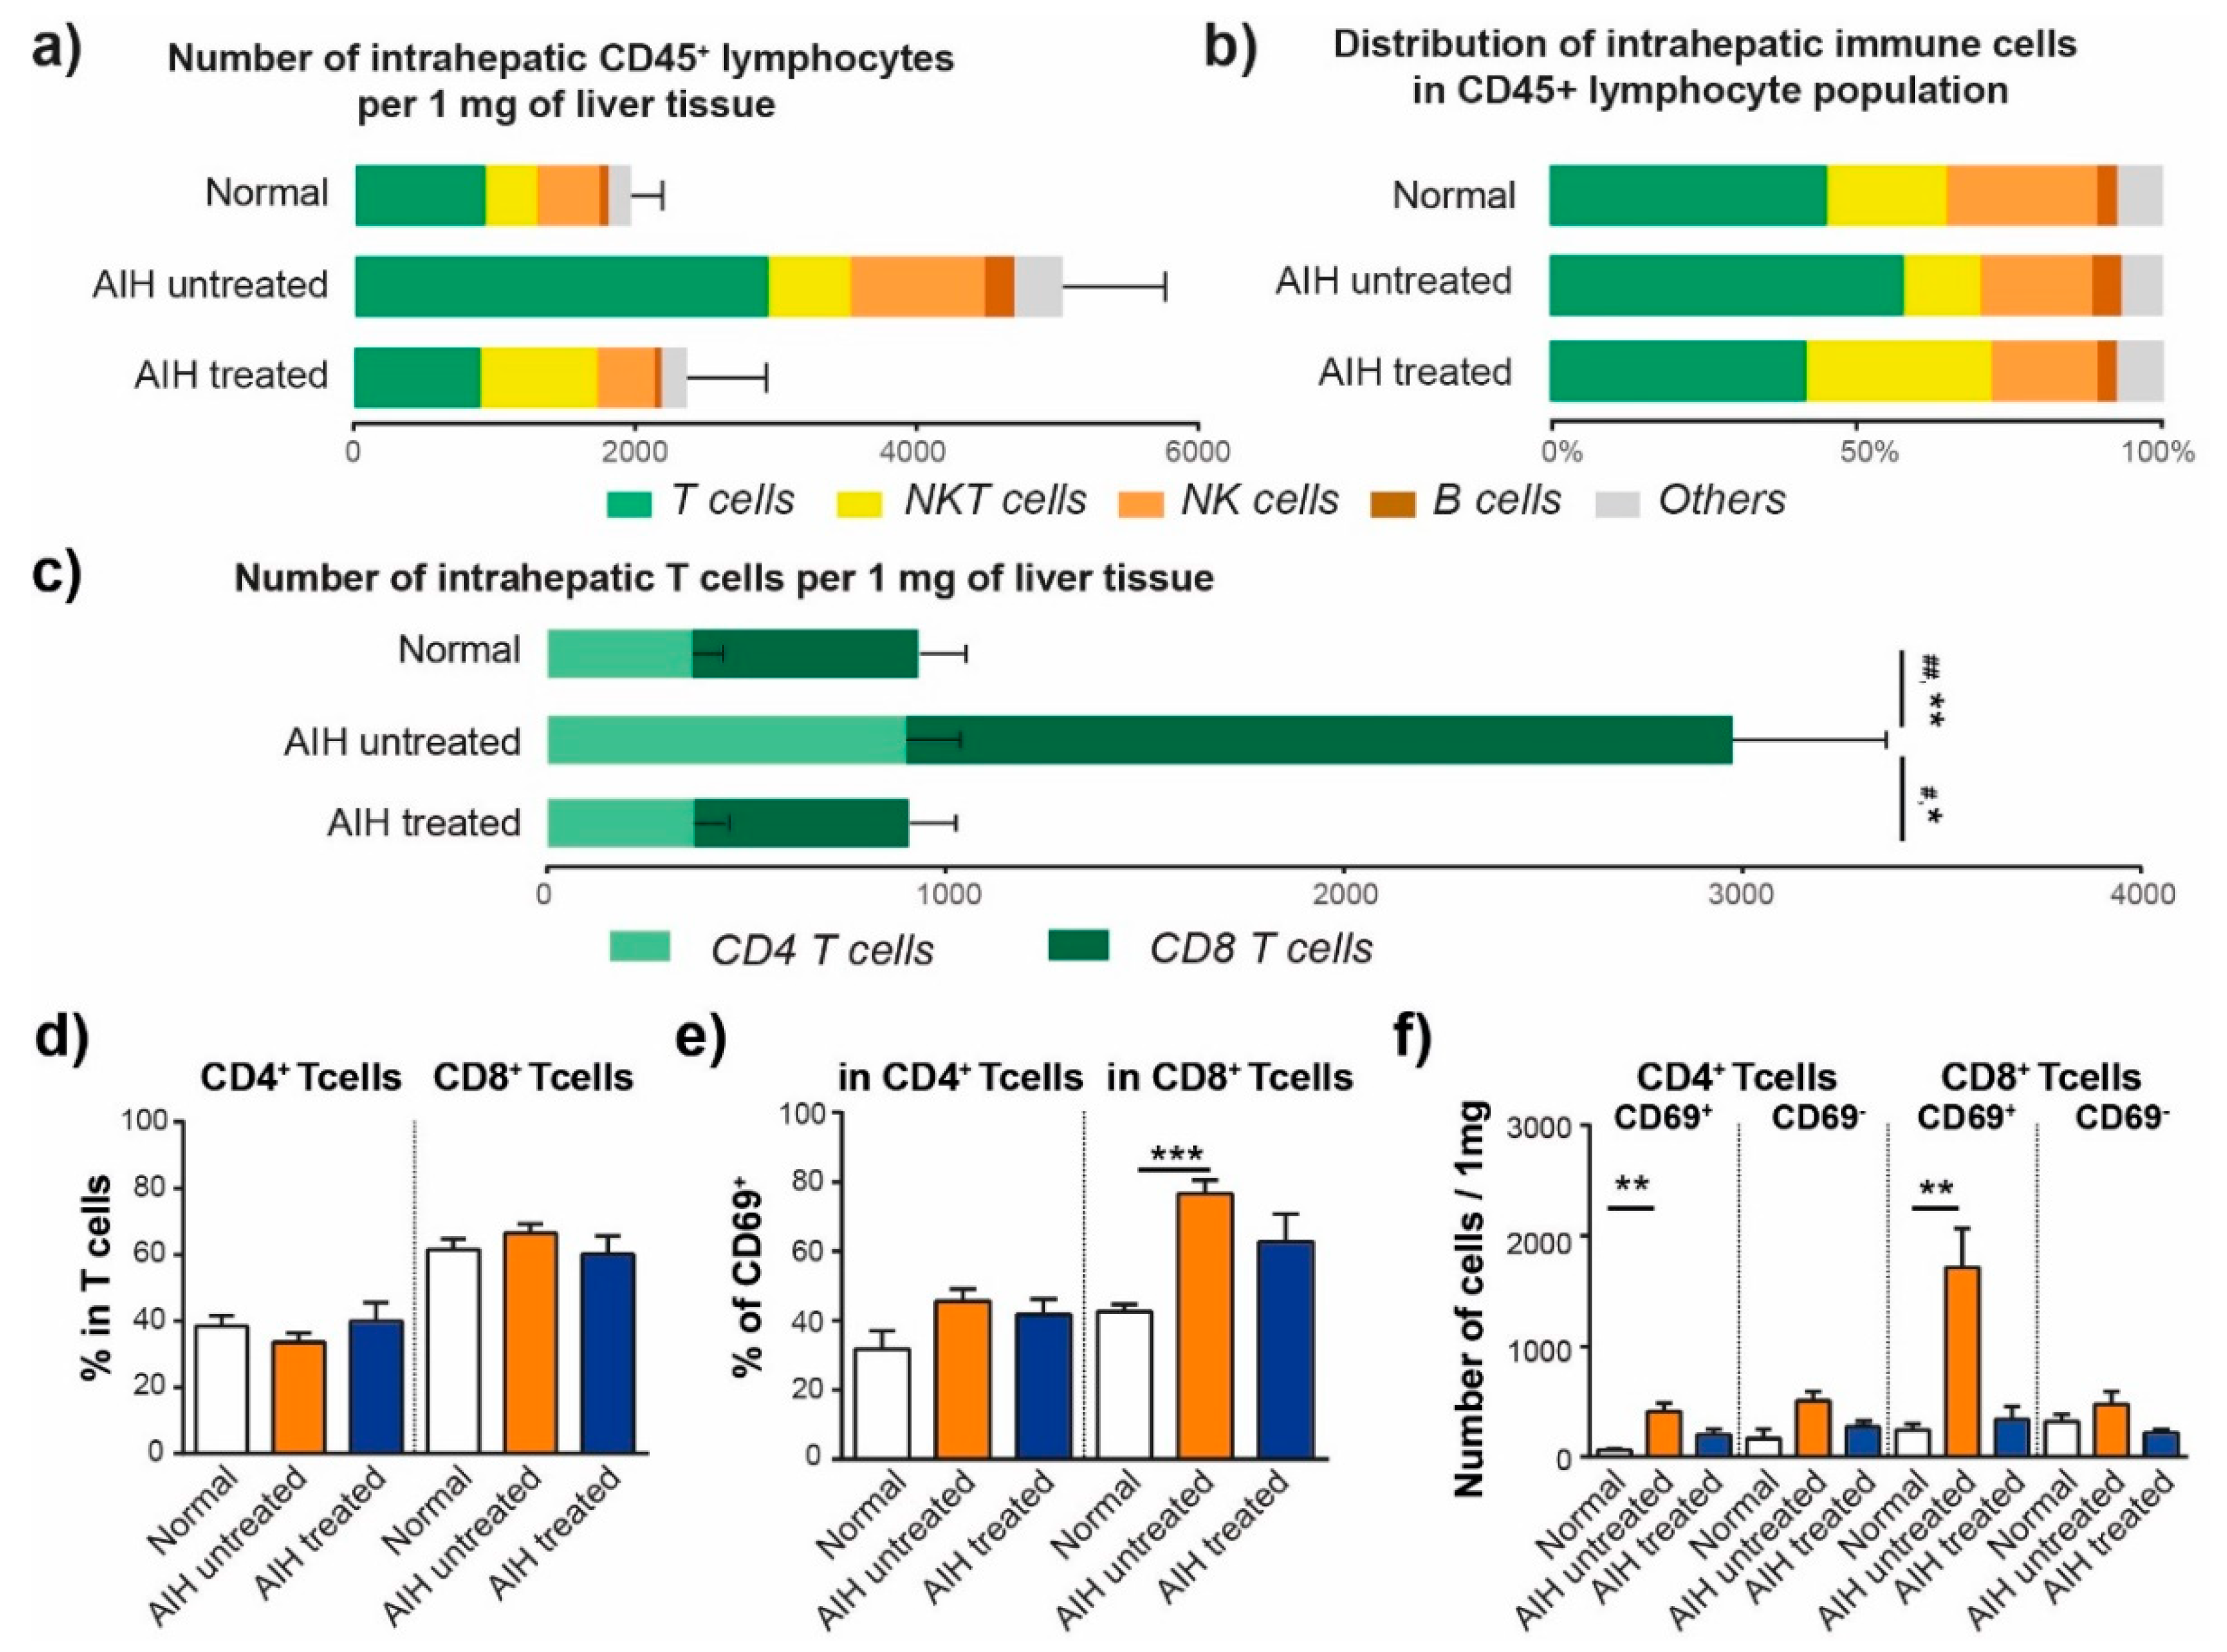
3.1. The Number and Distribution of Intrahepatic Lymphocytes Are Modified in AIH
3.2. Activated CD8+ T Cells Are Accumulated in the Liver of Patients with AIH
3.3. High Frequency of PD-1+ and 4-1BB+ T Cells in the Liver of Patients with AIH
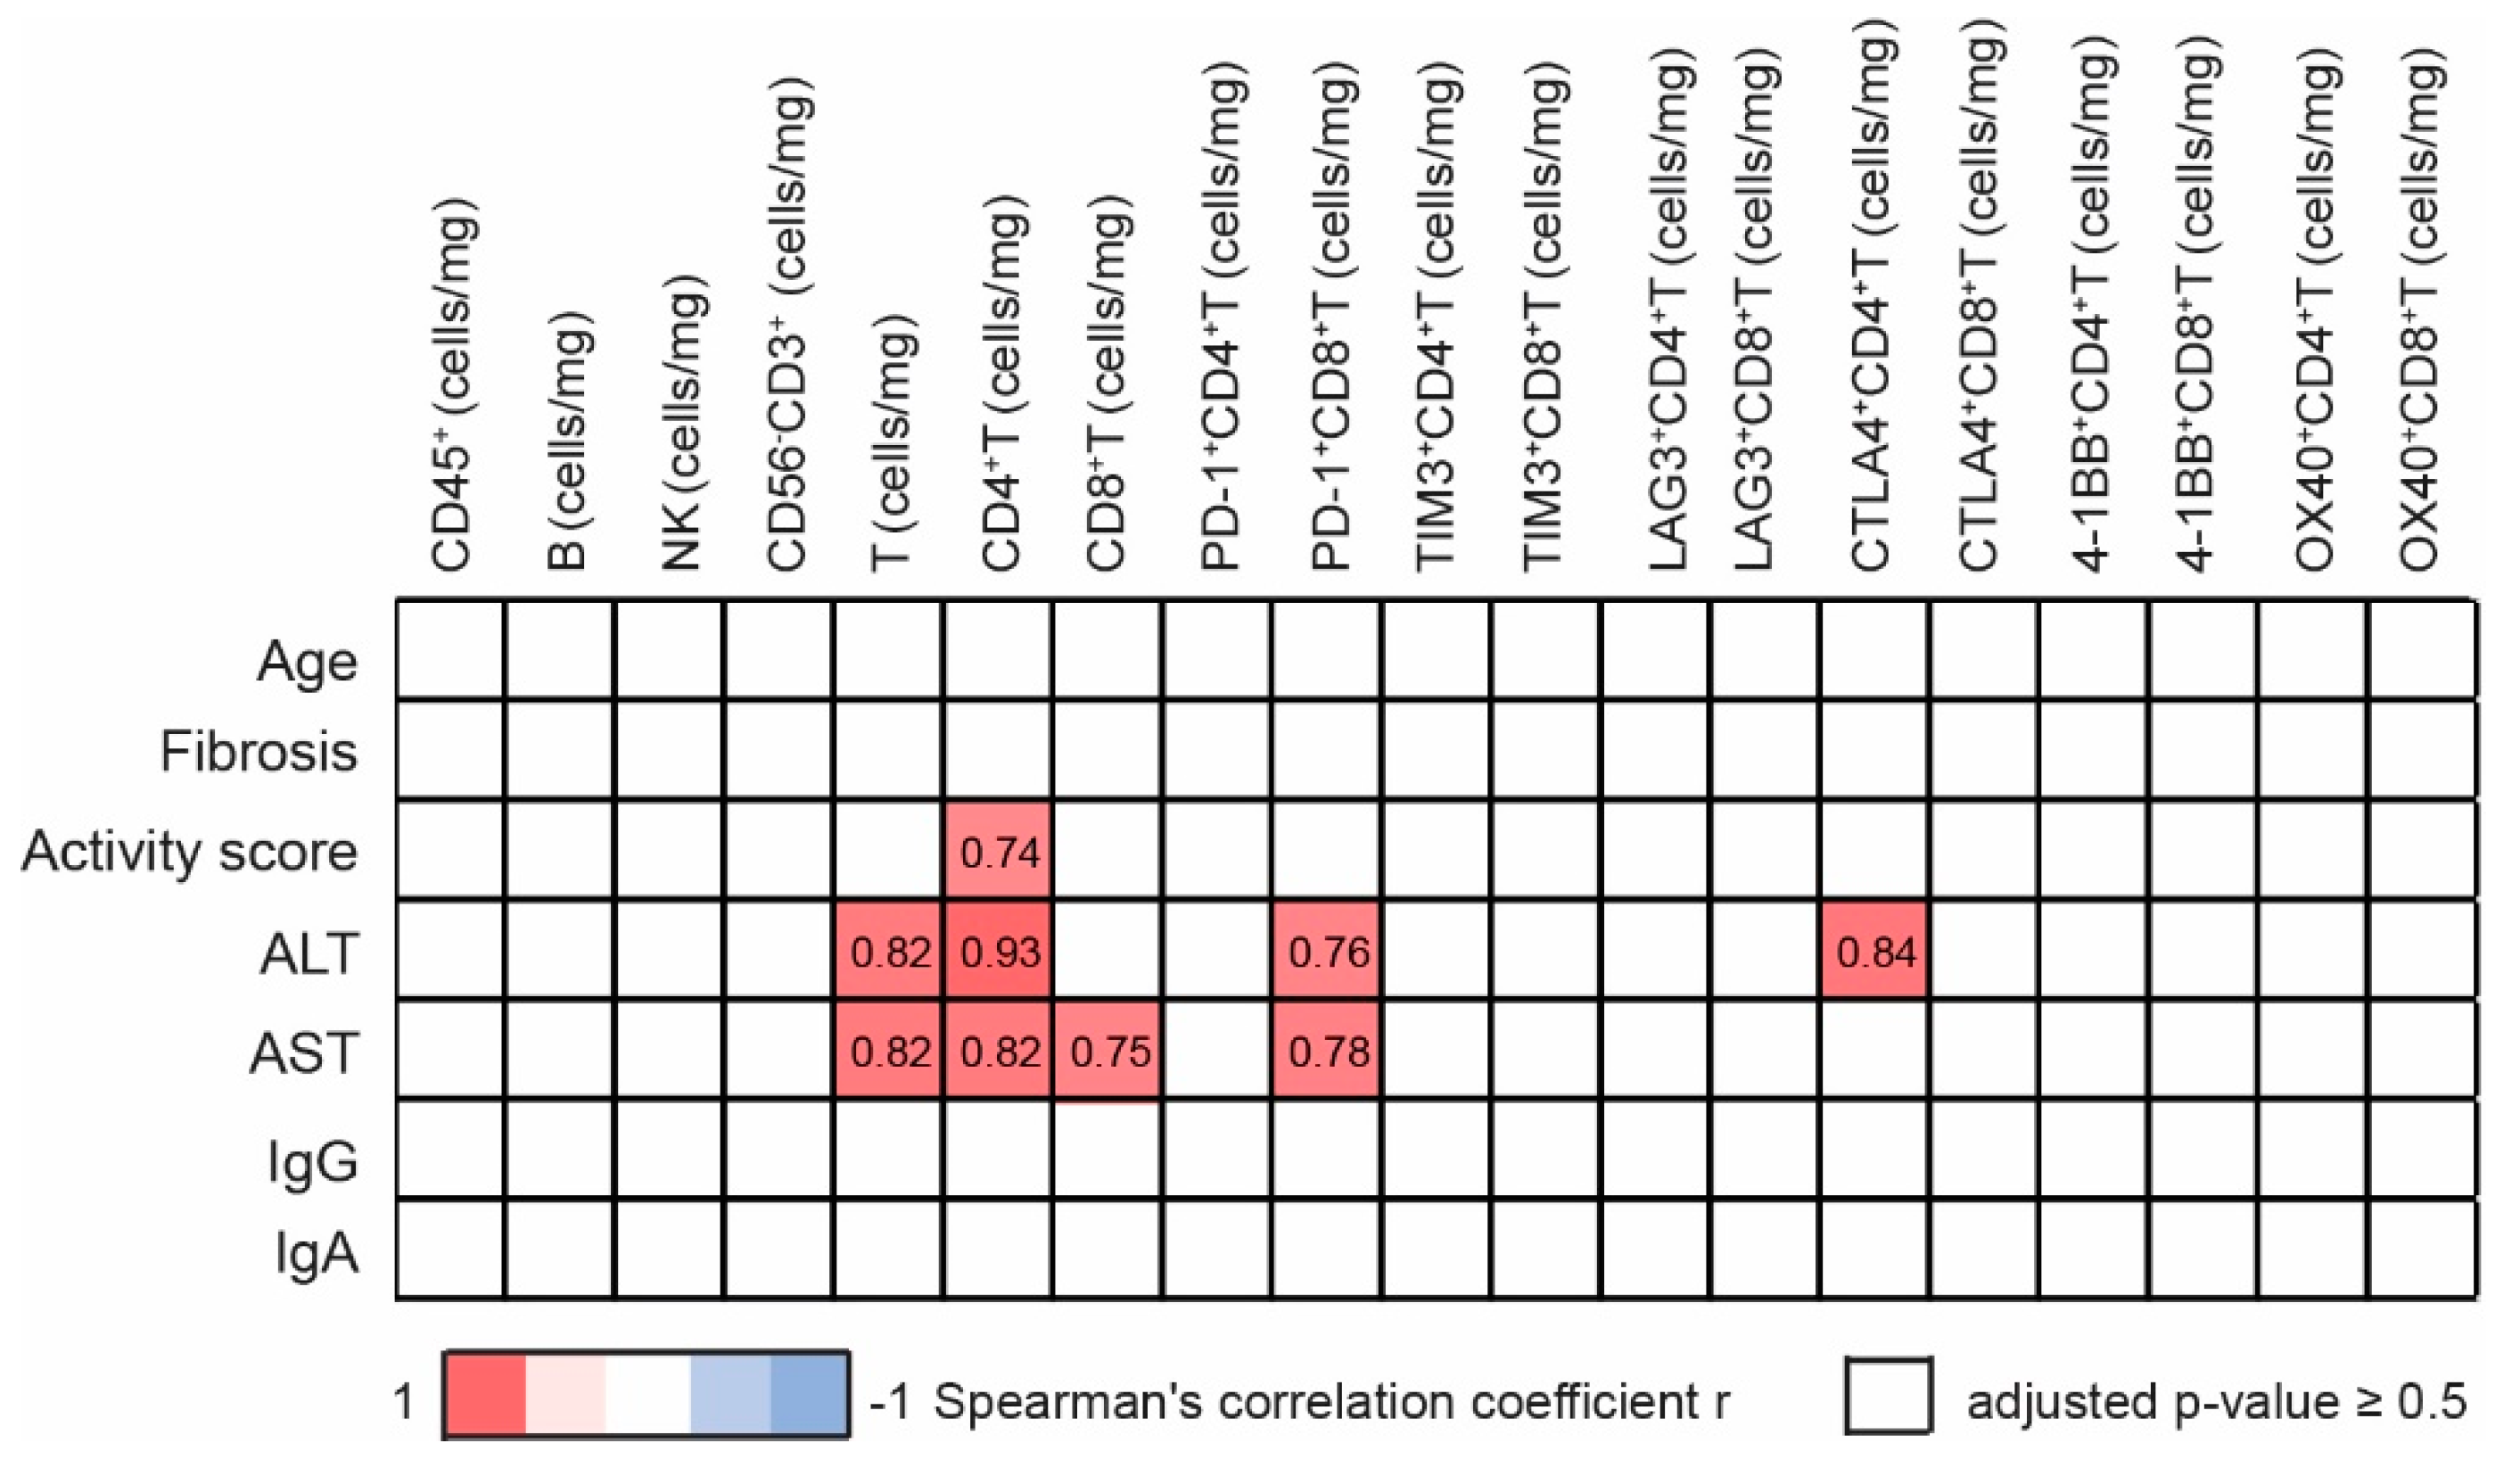
3.4. Intrahepatic T Cells Correlate Positively with Markers of Liver Pathology
4. Discussion
Supplementary Materials
Author Contributions
Funding
Institutional Review Board Statement
Informed Consent Statement
Data Availability Statement
Conflicts of Interest
References
- Carbone, M.; Neuberger, J.M. Autoimmune liver disease, autoimmunity and liver transplantation. J. Hepatol. 2014, 60, 210–223. [Google Scholar] [CrossRef]
- Valgeirsson, K.B.; Hreinsson, J.P.; Björnsson, E.S. Increased incidence of autoimmune hepatitis is associated with wider use of biological drugs. Liver Int. 2019, 39, 2341–2349. [Google Scholar] [CrossRef] [PubMed]
- Takahashi, A.; Ohira, H.; Abe, K.; Zeniya, M.; Abe, M.; Arinaga-Hino, T.; Torimura, T.; Yoshizawa, K.; Takaki, A.; Kang, J.-H.; et al. Increasing incidence of acute autoimmune hepatitis: A nationwide survey in Japan. Sci. Rep. 2020, 10, 14250. [Google Scholar] [CrossRef] [PubMed]
- Grønbæk, L.; Otete, H.; Ban, L.; Crooks, C.; Card, T.; Jepsen, P.; West, J. Incidence, prevalence and mortality of autoimmune hepatitis in England 1997-2015. A population-based cohort study. Liver Int. 2020, 40, 1634–1644. [Google Scholar] [CrossRef] [PubMed]
- Mieli-Vergani, G.; Vergani, D.; Czaja, A.J.; Manns, M.P.; Krawitt, E.L.; Vierling, J.M.; Lohse, A.W.; Montano-Loza, A.J. Autoimmune hepatitis. Nat. Reviews. Dis. Primers 2018, 4, 18017. [Google Scholar] [CrossRef]
- Marschall, H.U.; Henriksson, I.; Lindberg, S.; Söderdahl, F.; Thuresson, M.; Wahlin, S.; Ludvigsson, J.F. Incidence, prevalence, and outcome of primary biliary cholangitis in a nationwide Swedish population-based cohort. Sci. Rep. 2019, 9, 11525. [Google Scholar] [CrossRef]
- Jepsen, P.; Grønbæk, L.; Vilstrup, H. Worldwide Incidence of Autoimmune Liver Disease. Dig. Dis. 2015, 33 (Suppl. 2), 2–12. [Google Scholar] [CrossRef]
- Blachier, M.; Leleu, H.; Peck-Radosavljevic, M.; Valla, D.C.; Roudot-Thoraval, F. The burden of liver disease in Europe: A review of available epidemiological data. J. Hepatol. 2013, 58, 593–608. [Google Scholar] [CrossRef]
- Bovensiepen, C.S.; Schakat, M.; Sebode, M.; Zenouzi, R.; Hartl, J.; Peiseler, M.; Li, J.; Henze, L.; Woestemeier, A.; Schramm, C.; et al. TNF-Producing Th1 Cells Are Selectively Expanded in Liver Infiltrates of Patients with Autoimmune Hepatitis. J. Immunol. 2019, 203, 3148–3156. [Google Scholar] [CrossRef]
- Than, N.N.; Jeffery, H.C.; Oo, Y.H. Autoimmune Hepatitis: Progress from Global Immunosuppression to Personalised Regulatory T Cell Therapy. Can. J. Gastroenterol. Hepatol. 2016, 2016, 7181685. [Google Scholar] [CrossRef]
- Lohse, A.W.; Sebode, M.; Jørgensen, M.H.; Ytting, H.; Karlsen, T.H.; Kelly, D.; Manns, M.P.; Vesterhus, M. Second-line and third-line therapy for autoimmune hepatitis: A position statement from the European Reference Network on Hepatological Diseases and the International Autoimmune Hepatitis Group. J. Hepatol. 2020, 73, 1496–1506. [Google Scholar] [CrossRef]
- Zamani, M.R.; Aslani, S.; Salmaninejad, A.; Javan, M.R.; Rezaei, N. PD-1/PD-L and autoimmunity: A growing relationship. Cell. Immunol. 2016, 310, 27–41. [Google Scholar] [CrossRef]
- Francisco, L.M.; Sage, P.T.; Sharpe, A.H. The PD-1 pathway in tolerance and autoimmunity. Immunol. Rev. 2010, 236, 219–242. [Google Scholar] [CrossRef]
- Salama, A.D.; Chitnis, T.; Imitola, J.; Ansari, M.J.; Akiba, H.; Tushima, F.; Azuma, M.; Yagita, H.; Sayegh, M.H.; Khoury, S.J. Critical role of the programmed death-1 (PD-1) pathway in regulation of experimental autoimmune encephalomyelitis. J. Exp. Med. 2003, 198, 71–78. [Google Scholar] [CrossRef] [PubMed]
- Huang, C.; Zhu, H.X.; Yao, Y.; Bian, Z.H.; Zheng, Y.J.; Li, L.; Moutsopoulos, H.M.; Gershwin, M.E.; Lian, Z.X. Immune checkpoint molecules. Possible future therapeutic implications in autoimmune diseases. J. Autoimmun. 2019, 104, 102333. [Google Scholar] [CrossRef] [PubMed]
- Macek Jilkova, Z.; Decaens, T.; Marlu, A.; Marche, H.; Jouvin-Marche, E.; Marche, P.N. Sex Differences in Spontaneous Degranulation Activity of Intrahepatic Natural Killer Cells during Chronic Hepatitis B: Association with Estradiol Levels. Mediat. Inflamm. 2017, 2017, 3214917. [Google Scholar] [CrossRef]
- Macek Jilkova, Z.; Afzal, S.; Marche, H.; Decaens, T.; Sturm, N.; Jouvin-Marche, E.; Huard, B.; Marche, P.N. Progression of fibrosis in patients with chronic viral hepatitis is associated with IL-17(+) neutrophils. Liver Int. Off. J. Int. Assoc. Study Liver 2016, 36, 1116–1124. [Google Scholar] [CrossRef] [PubMed]
- Macek Jilkova, Z.; Aspord, C.; Kurma, K.; Granon, A.; Sengel, C.; Sturm, N.; Marche, P.N.; Decaens, T. Immunologic Features of Patients With Advanced Hepatocellular Carcinoma Before and During Sorafenib or Anti-programmed Death-1/Programmed Death-L1 Treatment. Clin. Transl. Gastroenterol. 2019, 10, e00058. [Google Scholar] [CrossRef]
- Fugier, E.; Marche, H.; Thelu, M.A.; Macek Jilkova, Z.; Van Campenhout, N.; Dufeu-Duchesne, T.; Leroy, V.; Zarski, J.P.; Sturm, N.; Marche, P.N.; et al. Functions of liver natural killer cells are dependent on the severity of liver inflammation and fibrosis in chronic hepatitis C. PLoS ONE 2014, 9, e95614. [Google Scholar] [CrossRef]
- Cao, J.; Liu, F.X.; Yu, M.X. Expression of programmed death 1 and its ligands in the liver of autoimmune hepatitis C57BL/6 mice. Chin. Med. J. 2009, 122, 1941–1946. [Google Scholar]
- Oikawa, T.; Takahashi, H.; Ishikawa, T.; Hokari, A.; Otsuki, N.; Azuma, M.; Zeniya, M.; Tajiri, H. Intrahepatic expression of the co-stimulatory molecules programmed death-1, and its ligands in autoimmune liver disease. Pathol. Int. 2007, 57, 485–492. [Google Scholar] [CrossRef]
- Agina, H.A.; Ehsan, N.A.; Abd-Elaziz, T.A.; Abd-Elfatah, G.A.; Said, E.M.; Sira, M.M. Hepatic expression of programmed death-1 (PD-1) and its ligand, PD-L1, in children with autoimmune hepatitis: Relation to treatment response. Clin. Exp. Hepatol. 2019, 5, 256–264. [Google Scholar] [CrossRef]
- Aarslev, K.; Dige, A.; Greisen, S.R.; Kreutzfeldt, M.; Jessen, N.; Vilstrup, H.; Deleuran, B.; Grønbæk, H. Soluble programmed death-1 levels are associated with disease activity and treatment response in patients with autoimmune hepatitis. Scand. J. Gastroenterol. 2017, 52, 93–99. [Google Scholar] [CrossRef] [PubMed]
- Hadley, T.; Gillespie, S.; Espinoza, H.; Prince, J.; Gronbaek, H.; Chandrakasan, S.; Kuguthasan, S.; Kolachala, V.L.; Gupta, N.A. Soluble PD1 levels are increased with disease activity in paediatric onset autoimmune hepatitis and inflammatory bowel disease. Autoimmunity 2020, 53, 253–260. [Google Scholar] [CrossRef]
- Renand, A.; Cervera-Marzal, I.; Gil, L.; Dong, C.; Garcia, A.; Kervagoret, E.; Aublé, H.; Habes, S.; Chevalier, C.; Vavasseur, F.; et al. Integrative molecular profiling of autoreactive CD4 T cells in autoimmune hepatitis. J. Hepatol. 2020. [Google Scholar] [CrossRef] [PubMed]
- Gianchecchi, E.; Fierabracci, A. Inhibitory Receptors and Pathways of Lymphocytes: The Role of PD-1 in Treg Development and Their Involvement in Autoimmunity Onset and Cancer Progression. Front. Immunol. 2018, 9, 2374. [Google Scholar] [CrossRef] [PubMed]
- Peiseler, M.; Sebode, M.; Franke, B.; Wortmann, F.; Schwinge, D.; Quaas, A.; Baron, U.; Olek, S.; Wiegard, C.; Lohse, A.W.; et al. FOXP3+ regulatory T cells in autoimmune hepatitis are fully functional and not reduced in frequency. J. Hepatol. 2012, 57, 125–132. [Google Scholar] [CrossRef]
- Taubert, R.; Hardtke-Wolenski, M.; Noyan, F.; Wilms, A.; Baumann, A.K.; Schlue, J.; Olek, S.; Falk, C.S.; Manns, M.P.; Jaeckel, E. Intrahepatic regulatory T cells in autoimmune hepatitis are associated with treatment response and depleted with current therapies. J. Hepatol. 2014, 61, 1106–1114. [Google Scholar] [CrossRef]
- Wang, C.; Lin, G.H.; McPherson, A.J.; Watts, T.H. Immune regulation by 4-1BB and 4-1BBL: Complexities and challenges. Immunol. Rev. 2009, 229, 192–215. [Google Scholar] [CrossRef]
- Bartkowiak, T.; Curran, M.A. 4-1BB Agonists: Multi-Potent Potentiators of Tumor Immunity. Front. Oncol. 2015, 5. [Google Scholar] [CrossRef]
- Xia, G.; Wu, S.; Zhang, Y. Anti-4-1BB monoclonal antibodies attenuate concanavalin A-induced immune-mediated liver injury in mice. Exp. Ther. Med. 2016, 12, 1263–1268. [Google Scholar] [CrossRef] [PubMed][Green Version]
- Bartkowiak, T.; Jaiswal, A.R.; Ager, C.R.; Chin, R.; Chen, C.H.; Budhani, P.; Ai, M.; Reilley, M.J.; Sebastian, M.M.; Hong, D.S.; et al. Activation of 4-1BB on Liver Myeloid Cells Triggers Hepatitis via an Interleukin-27-Dependent Pathway. Clin. Cancer Res. Off. J. Am. Assoc. Cancer Res. 2018, 24, 1138–1151. [Google Scholar] [CrossRef] [PubMed]
- Liberal, R.; Grant, C.R.; Holder, B.S.; Ma, Y.; Mieli-Vergani, G.; Vergani, D.; Longhi, M.S. The impaired immune regulation of autoimmune hepatitis is linked to a defective galectin-9/tim-3 pathway. Hepatology 2012, 56, 677–686. [Google Scholar] [CrossRef] [PubMed]
- Zhao, P.; Wang, P.; Dong, S.; Zhou, Z.; Cao, Y.; Yagita, H.; He, X.; Zheng, S.G.; Fisher, S.J.; Fujinami, R.S.; et al. Depletion of PD-1-positive cells ameliorates autoimmune disease. Nat. Biomed. Eng. 2019, 3, 292–305. [Google Scholar] [CrossRef] [PubMed]


| Normal | AIH Untreated | AIH Treated | |
|---|---|---|---|
| Number of individuals | 10 | 11 | 5 |
| Sex, male/female | 6/4 | 5/6 | 2/3 |
| Age, y (mean ± SD) | 47.3 ± 4.8 | 48.5 ± 7.3 | 51.6 ± 6.8 |
| ALT, U/L (median; range) | 33; 17–79 | 327; 44–2279 | 47; 25–836 |
| AST, U/L (median; range) | 29; 20–71 | 337; 31–982 | 55; 21–1212 |
| IgG, g/L (median; range) | - | 15.4; 12.3–22.2 | 12.8; 10.9–34.2 |
| IgA, g/L (median; range) | - | 3.1; 1.6–4.5 | 3.0; 2.8–4.6 |
| SMA+ titer (>1:80), Yes/No (median; range) | - | 9/3 (160; <40–1280) | 2/3 (80; <40–640) |
| ANA+ titer (>1:80), Yes/No (median; range) | - | 10/1 (320; <80–1280) | 4/1 (160; <40–320) |
| Treatment | |||
| None | 10 | 11 | - |
| Steroids/Steroids + Azathioprine | - | - | 2/3 |
| Histology, METAVIR scoring | |||
| Fibrosis stage (F0/F1-F2/F3-F4) | 9/1/0 | 1/8/2 | 1/1/3 |
| Activity score (A0/A1/A2/A3) | - | 2/3/1/5 | 2/2/1/0 |
Publisher’s Note: MDPI stays neutral with regard to jurisdictional claims in published maps and institutional affiliations. |
© 2021 by the authors. Licensee MDPI, Basel, Switzerland. This article is an open access article distributed under the terms and conditions of the Creative Commons Attribution (CC BY) license (https://creativecommons.org/licenses/by/4.0/).
Share and Cite
Macek Jilkova, Z.; Hilleret, M.N.; Gerster, T.; Sturm, N.; Mercey-Ressejac, M.; Zarski, J.-P.; Leroy, V.; Marche, P.N.; Costentin, C.; Decaens, T. Increased Intrahepatic Expression of Immune Checkpoint Molecules in Autoimmune Liver Disease. Cells 2021, 10, 2671. https://doi.org/10.3390/cells10102671
Macek Jilkova Z, Hilleret MN, Gerster T, Sturm N, Mercey-Ressejac M, Zarski J-P, Leroy V, Marche PN, Costentin C, Decaens T. Increased Intrahepatic Expression of Immune Checkpoint Molecules in Autoimmune Liver Disease. Cells. 2021; 10(10):2671. https://doi.org/10.3390/cells10102671
Chicago/Turabian StyleMacek Jilkova, Zuzana, Marie Noelle Hilleret, Theophile Gerster, Nathalie Sturm, Marion Mercey-Ressejac, Jean-Pierre Zarski, Vincent Leroy, Patrice N. Marche, Charlotte Costentin, and Thomas Decaens. 2021. "Increased Intrahepatic Expression of Immune Checkpoint Molecules in Autoimmune Liver Disease" Cells 10, no. 10: 2671. https://doi.org/10.3390/cells10102671
APA StyleMacek Jilkova, Z., Hilleret, M. N., Gerster, T., Sturm, N., Mercey-Ressejac, M., Zarski, J.-P., Leroy, V., Marche, P. N., Costentin, C., & Decaens, T. (2021). Increased Intrahepatic Expression of Immune Checkpoint Molecules in Autoimmune Liver Disease. Cells, 10(10), 2671. https://doi.org/10.3390/cells10102671