Pan-Cancer Molecular Patterns and Biological Implications Associated with a Tumor-Specific Molecular Signature


 , and
, and 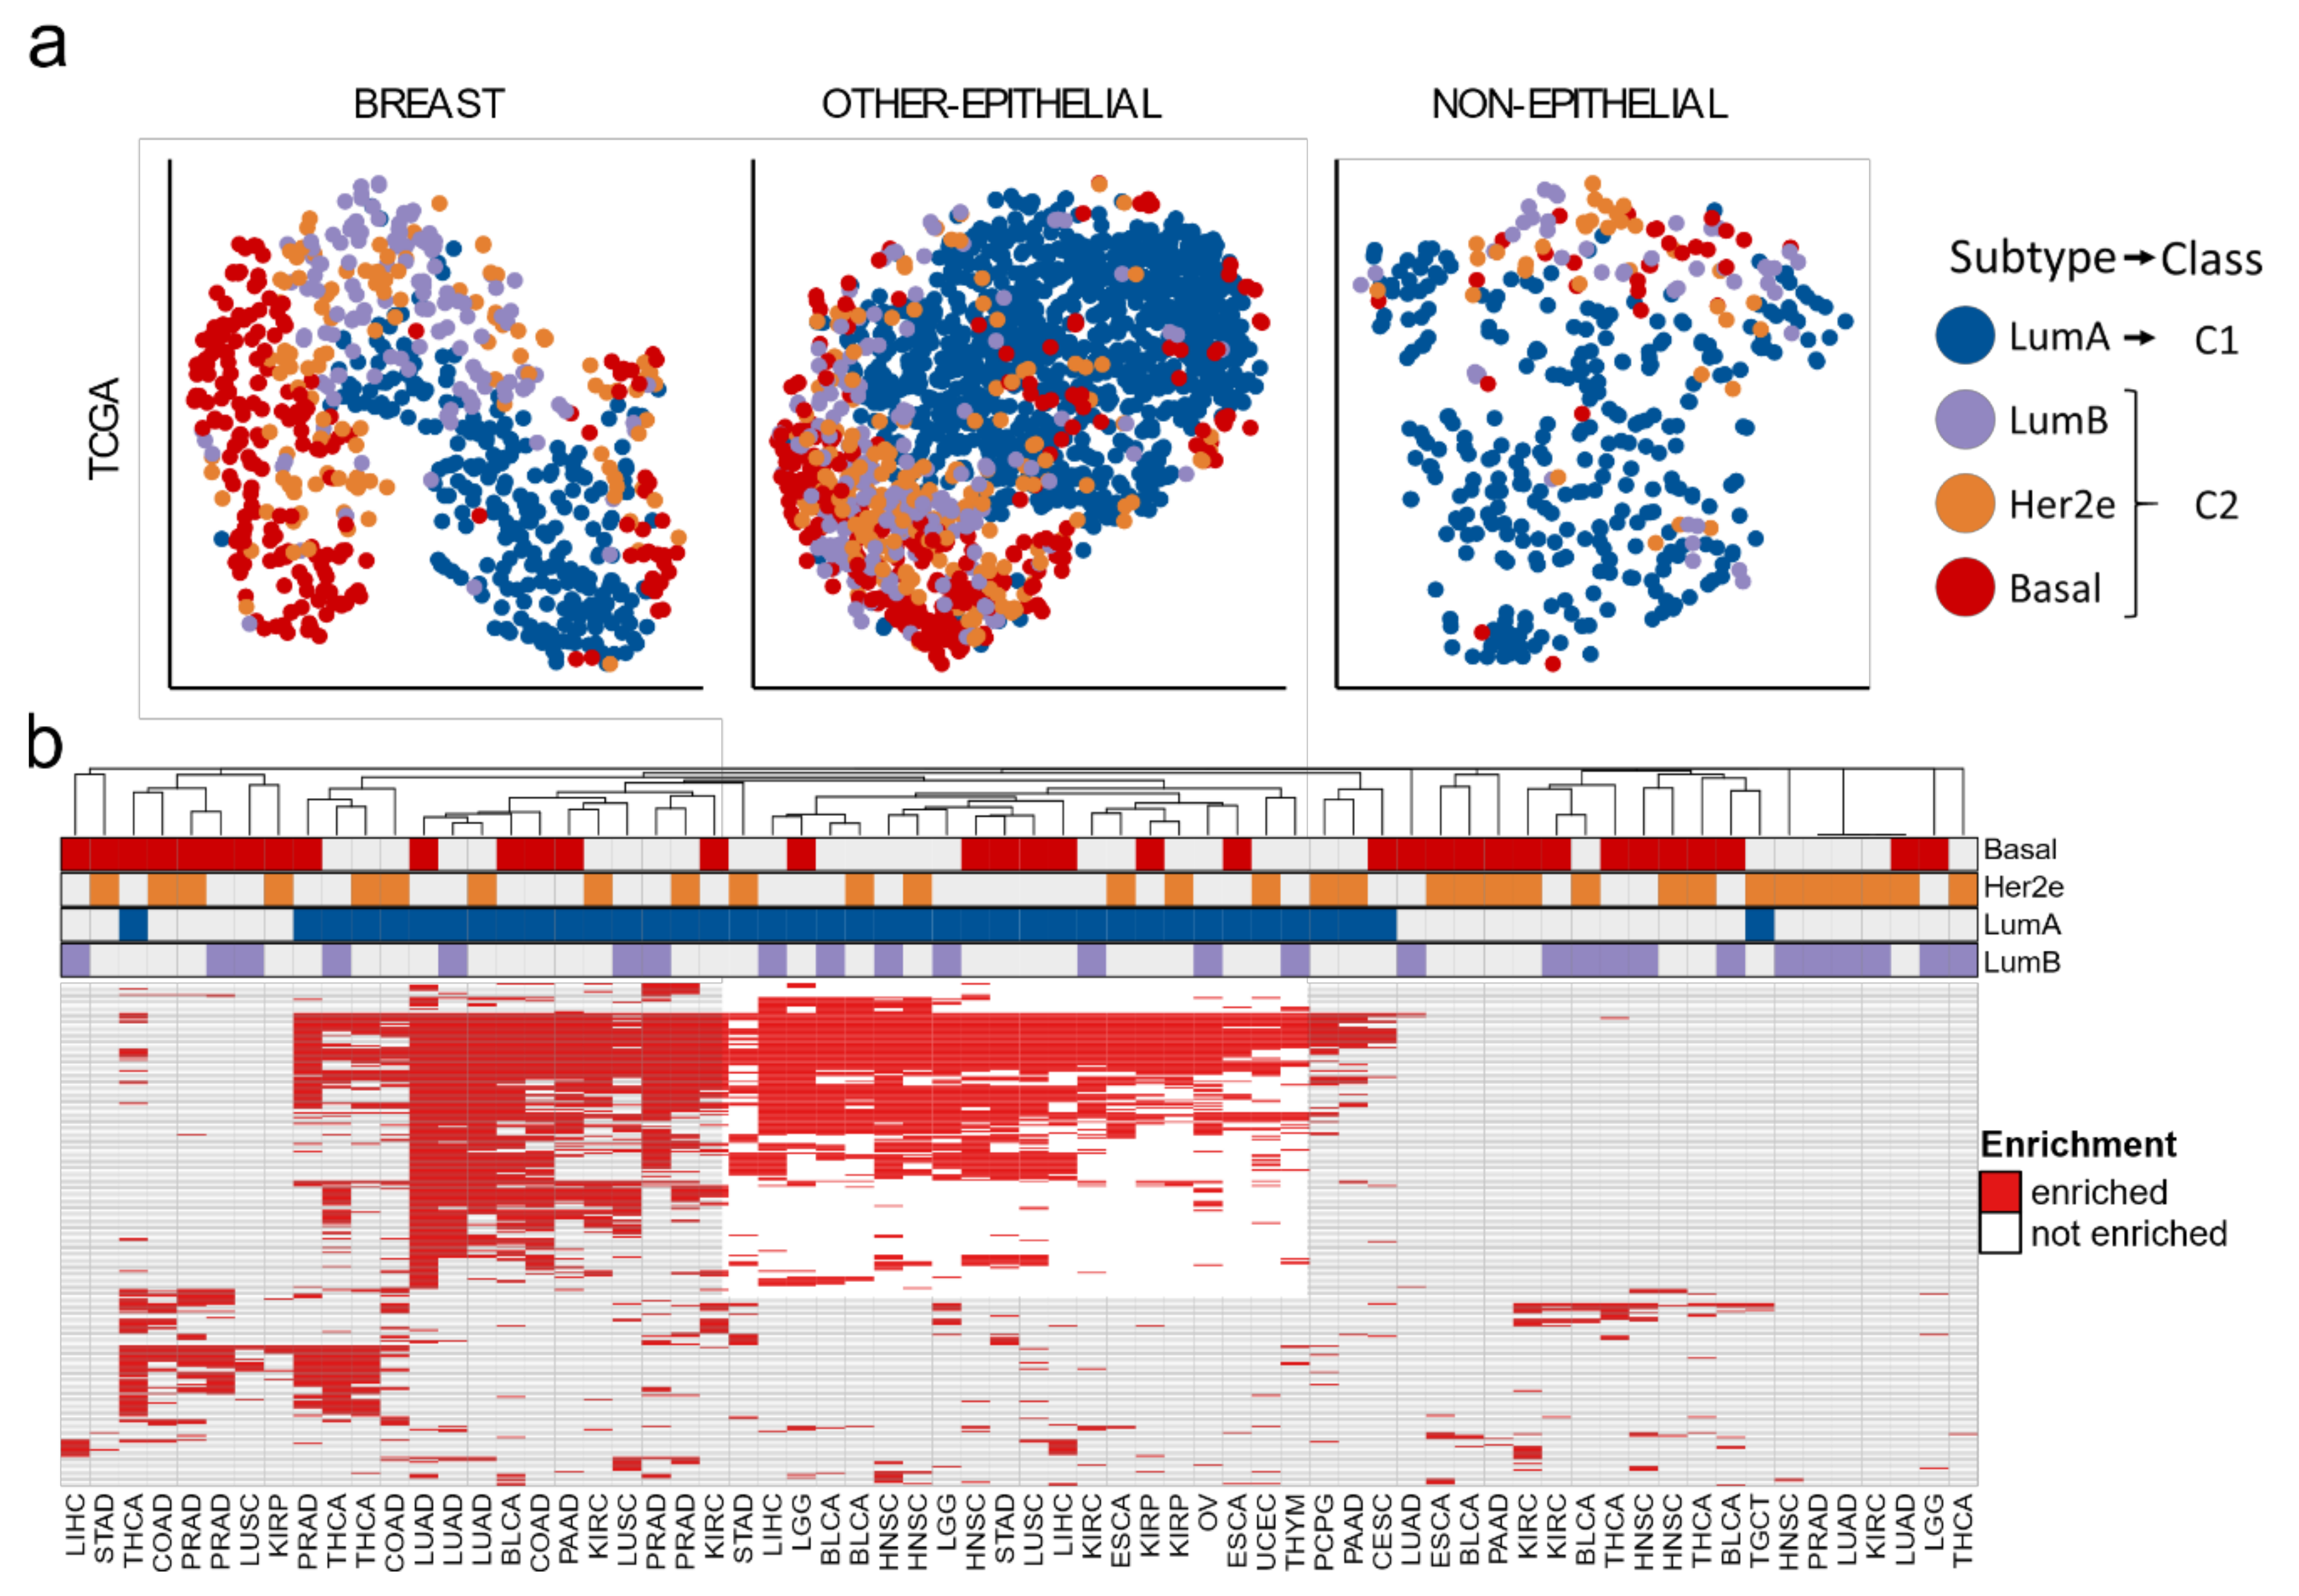
Abstract
1. Introduction
2. Methods
2.1. Study Design
2.2. Data Acquisition and Pre-Processing
2.3. Sample Classification and Immune Infiltrate Estimation
2.4. Gene Set Enrichment and Differential Gene Expression
2.5. Signatures
2.6. Equations
2.7. Survival Analysis
2.8. Drug Analysis
3. Results
3.1. Two Molecular Classes Emerge in All Tissues
3.2. Cell-Cycle Checkpoints and Progression Pathways Drive the Differences between C1 and C2 Classes
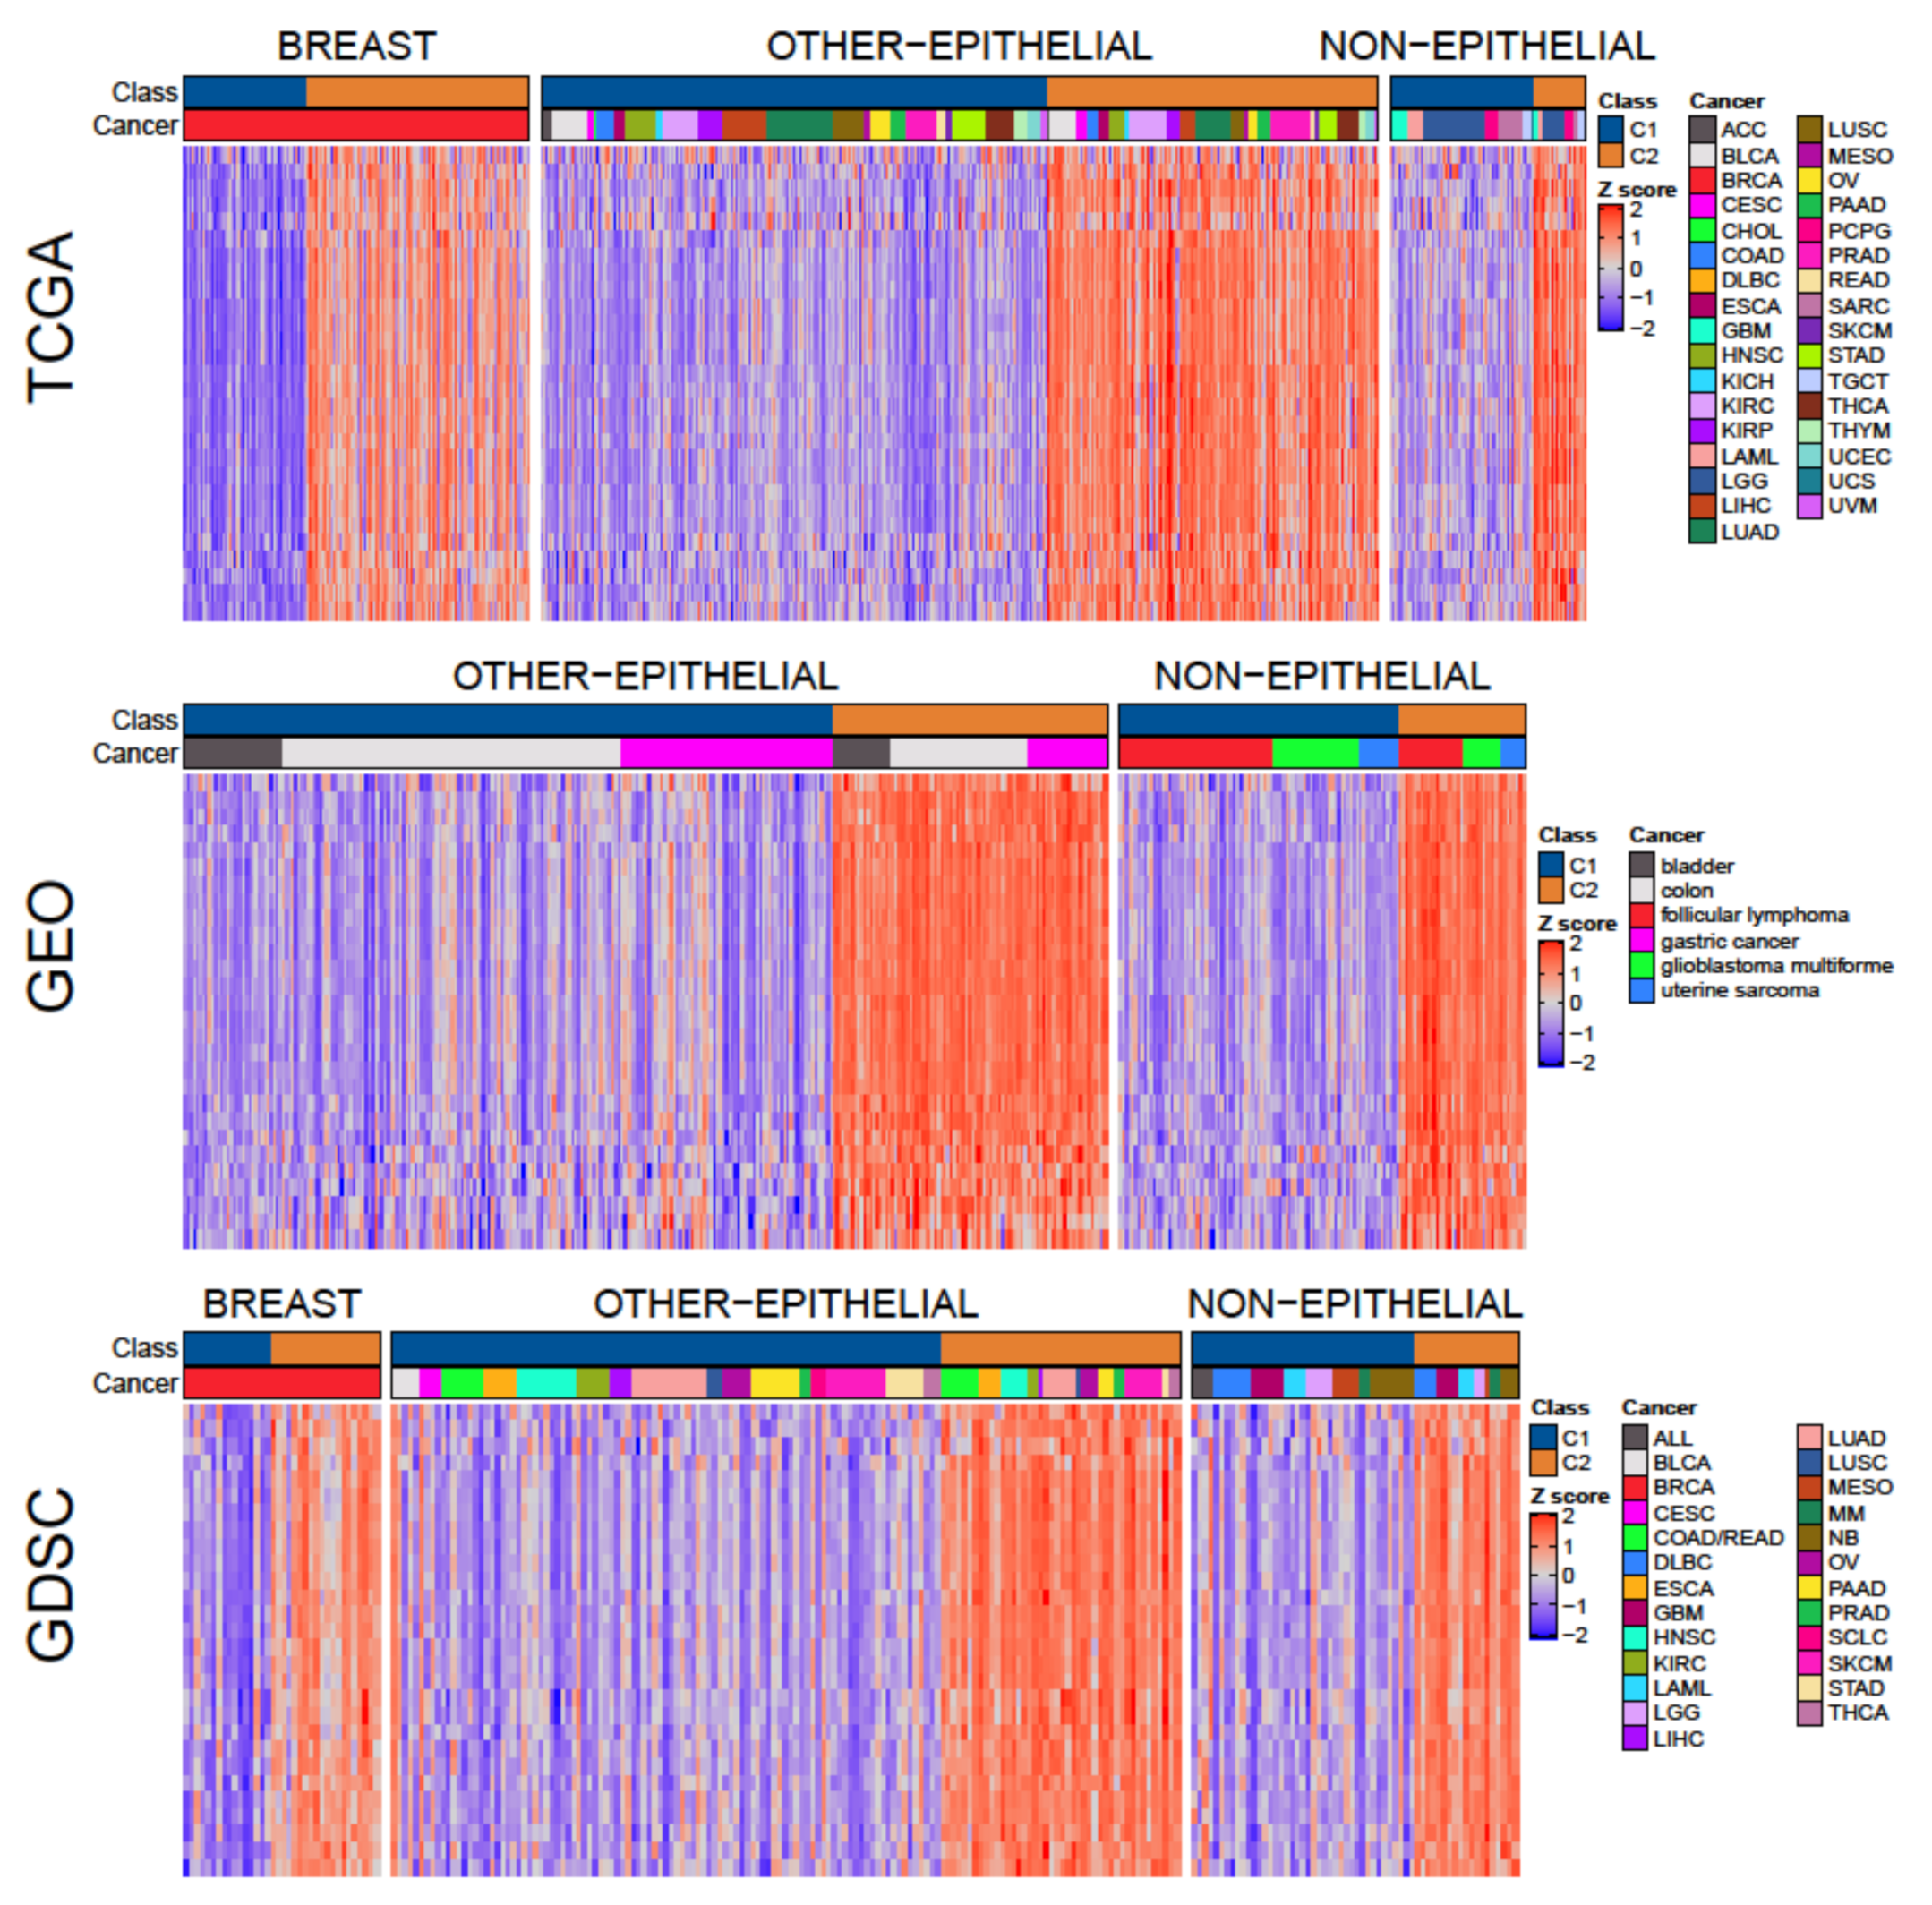
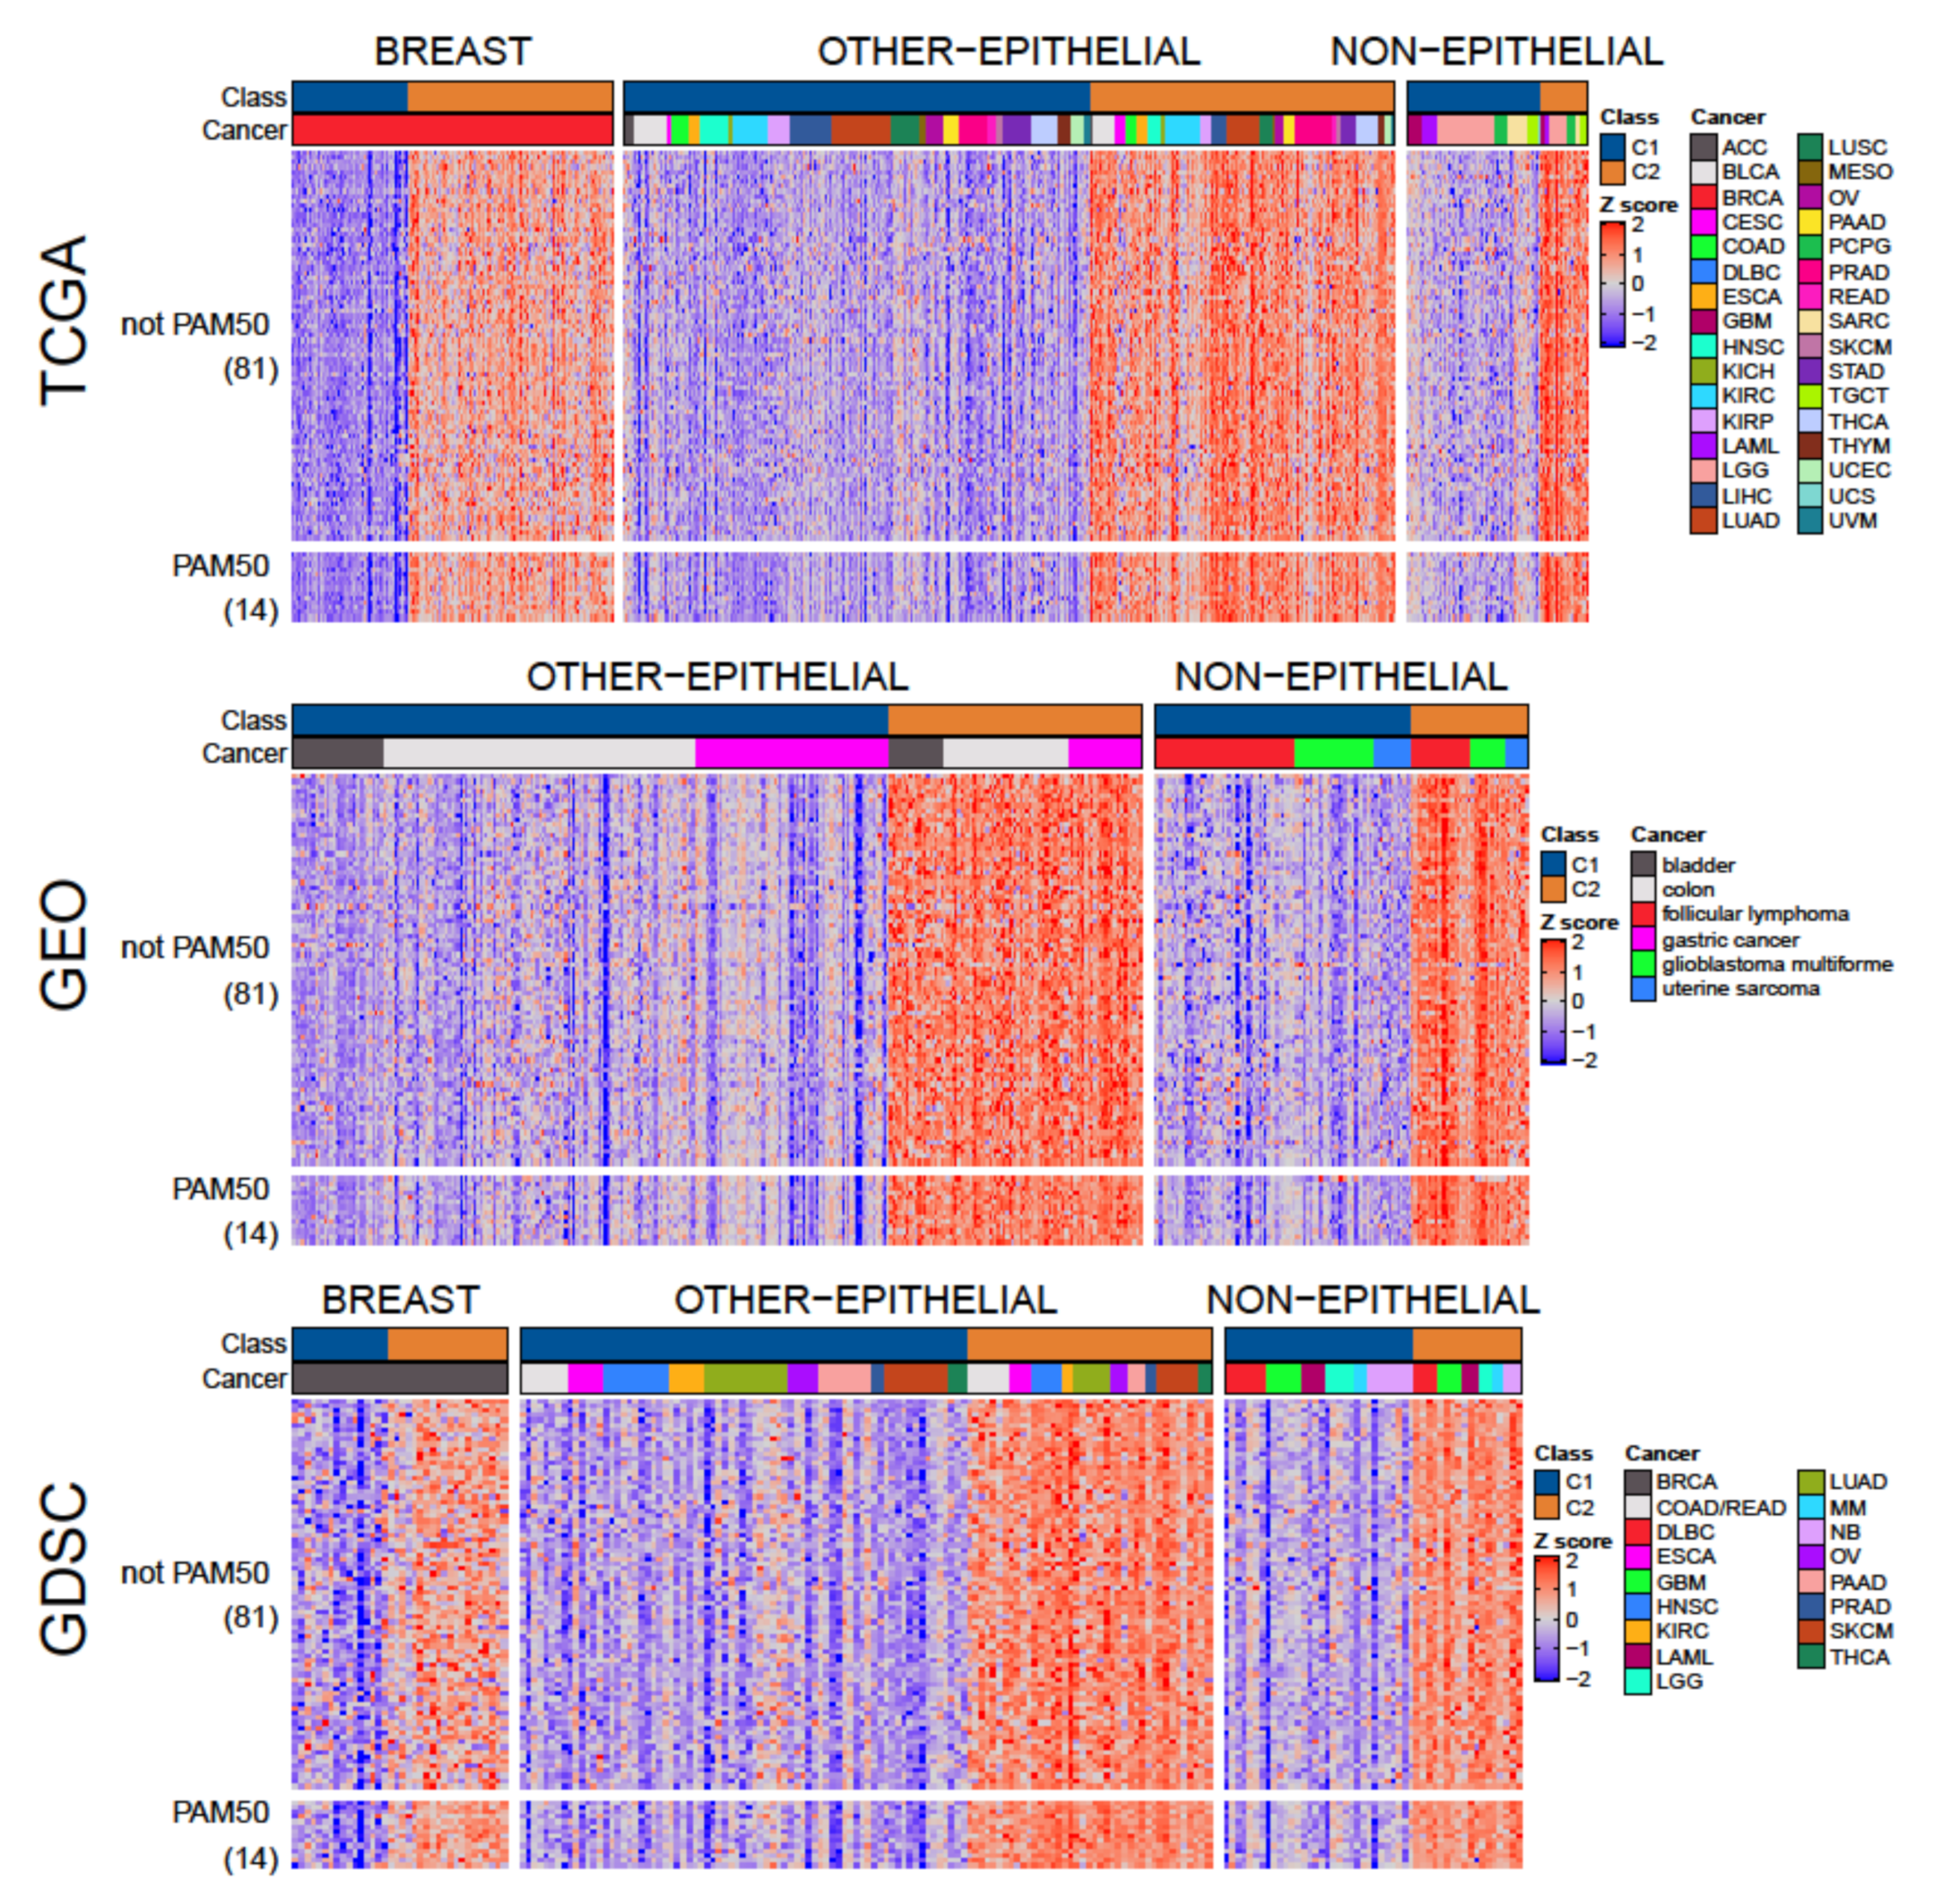
3.3. A Tumor-Agnostic Set of Genes Differentiate C1 from C2 Classes
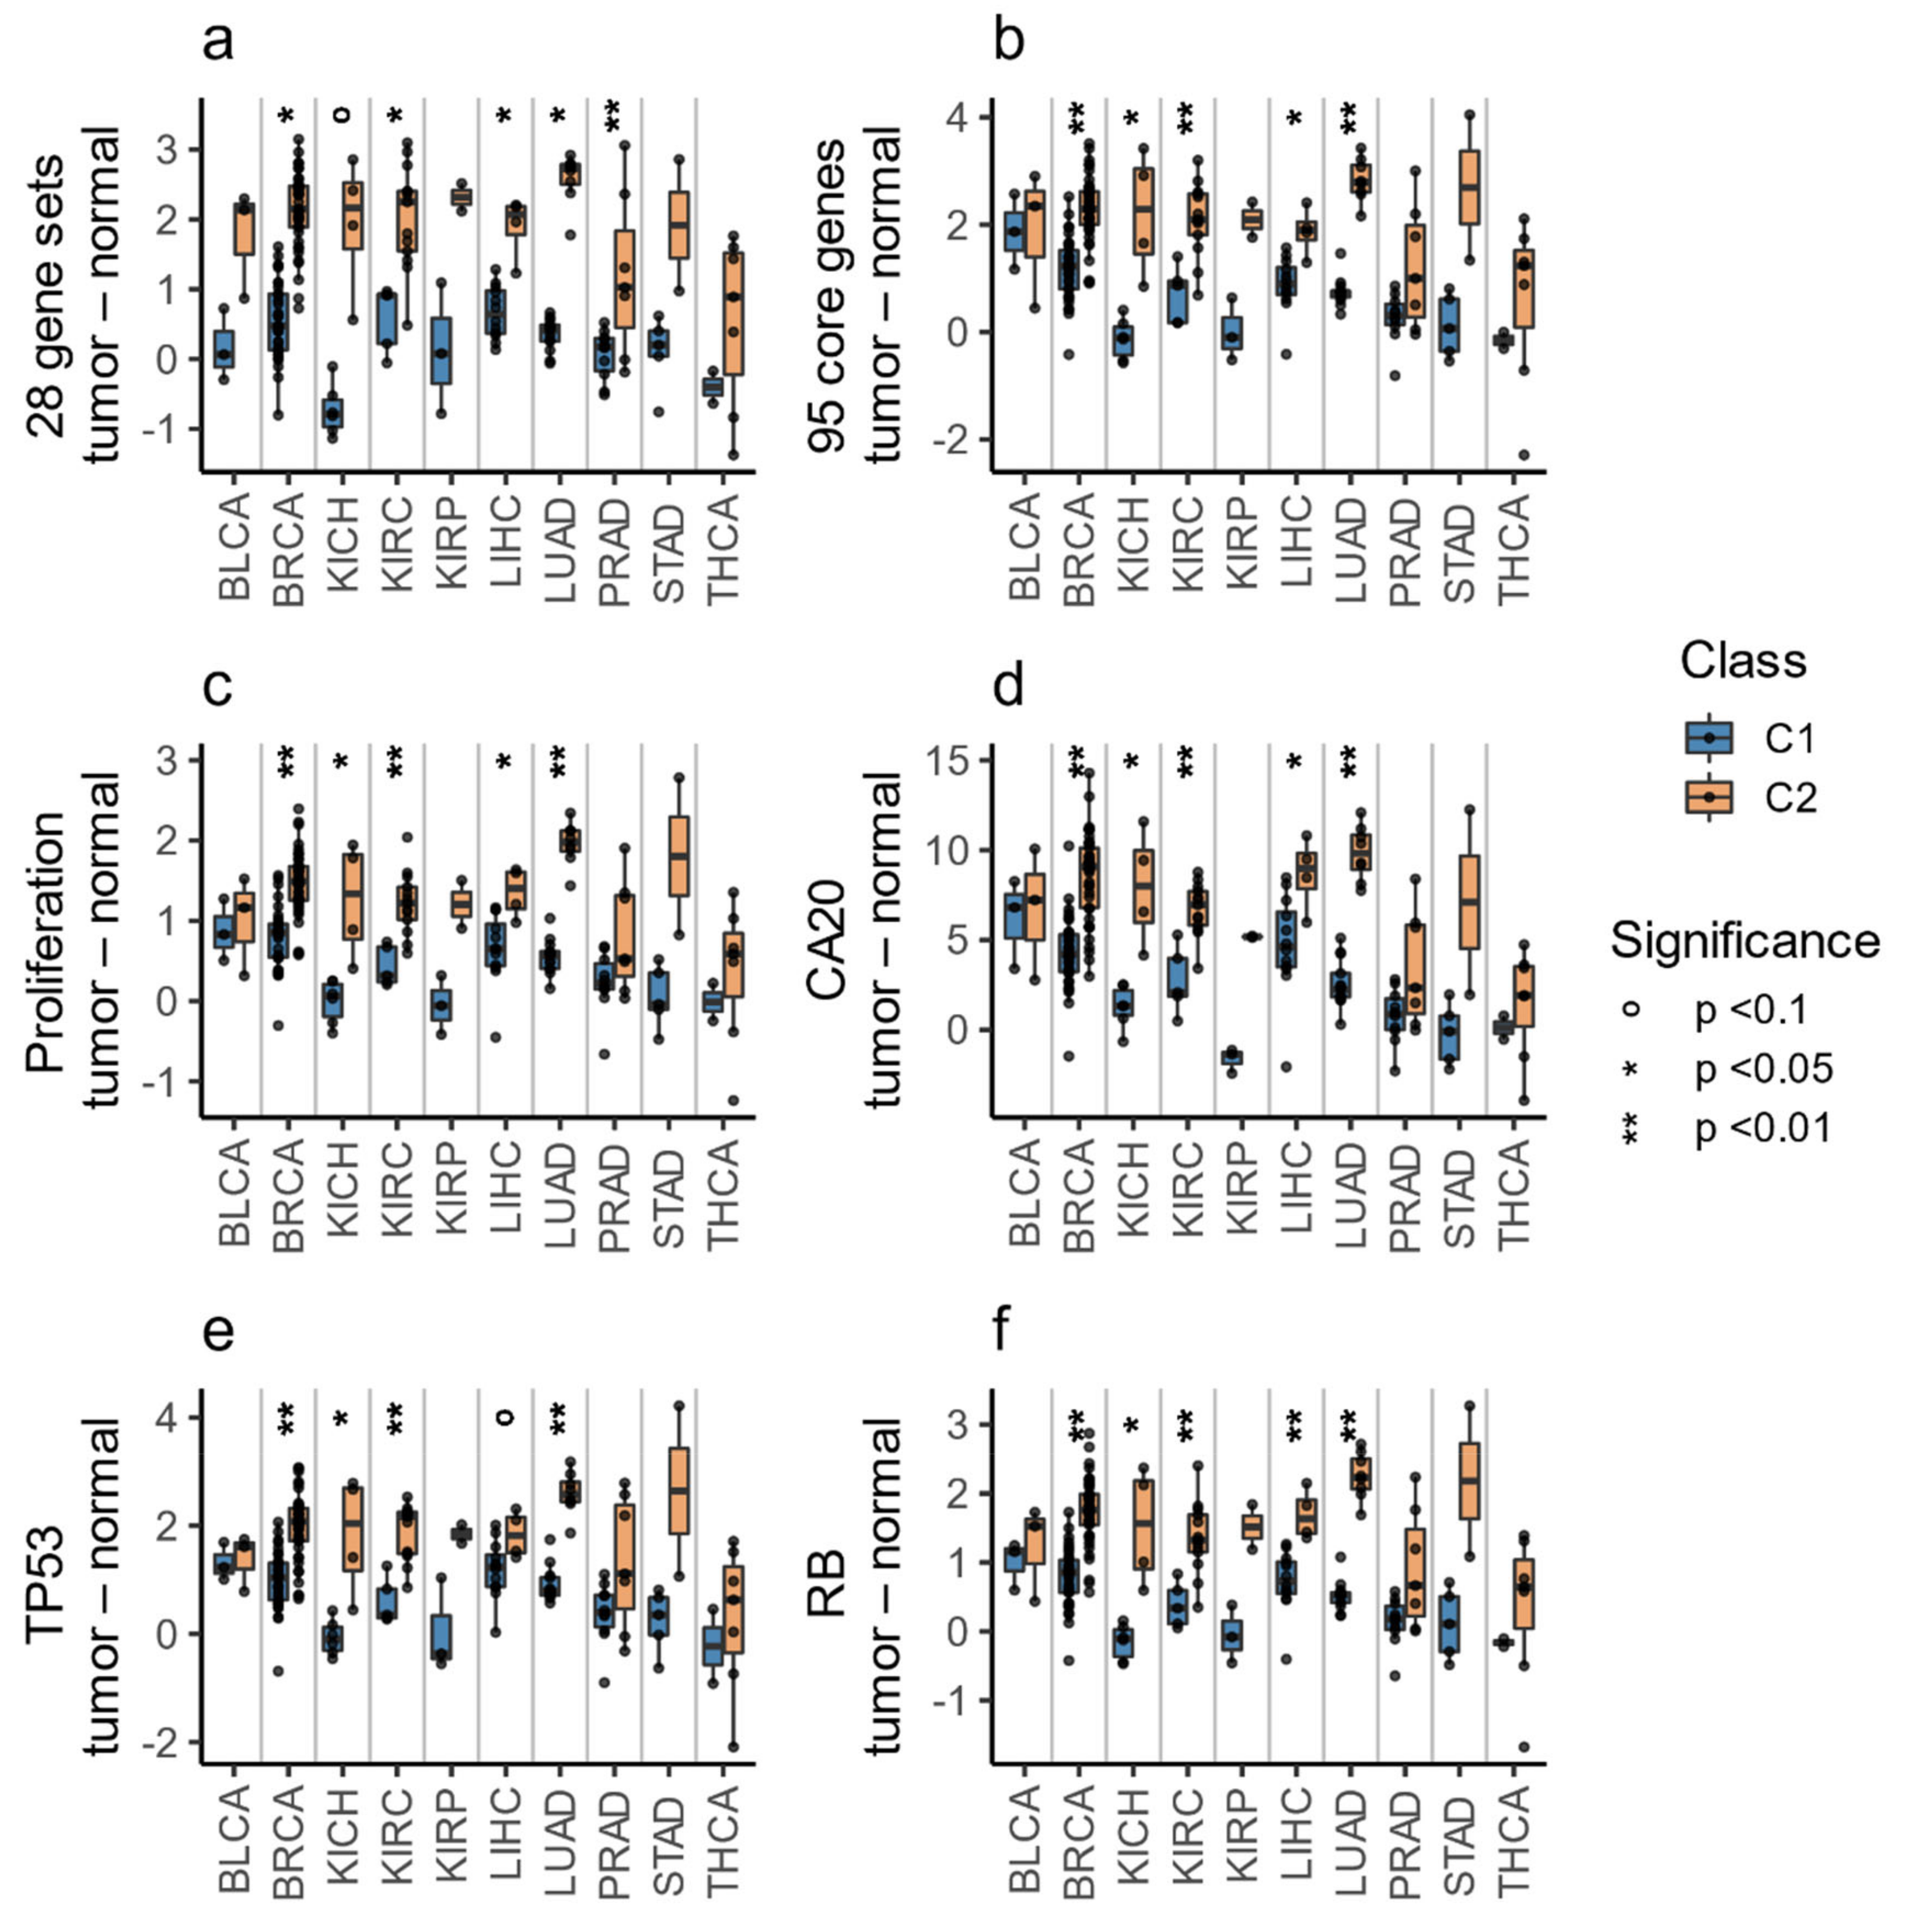
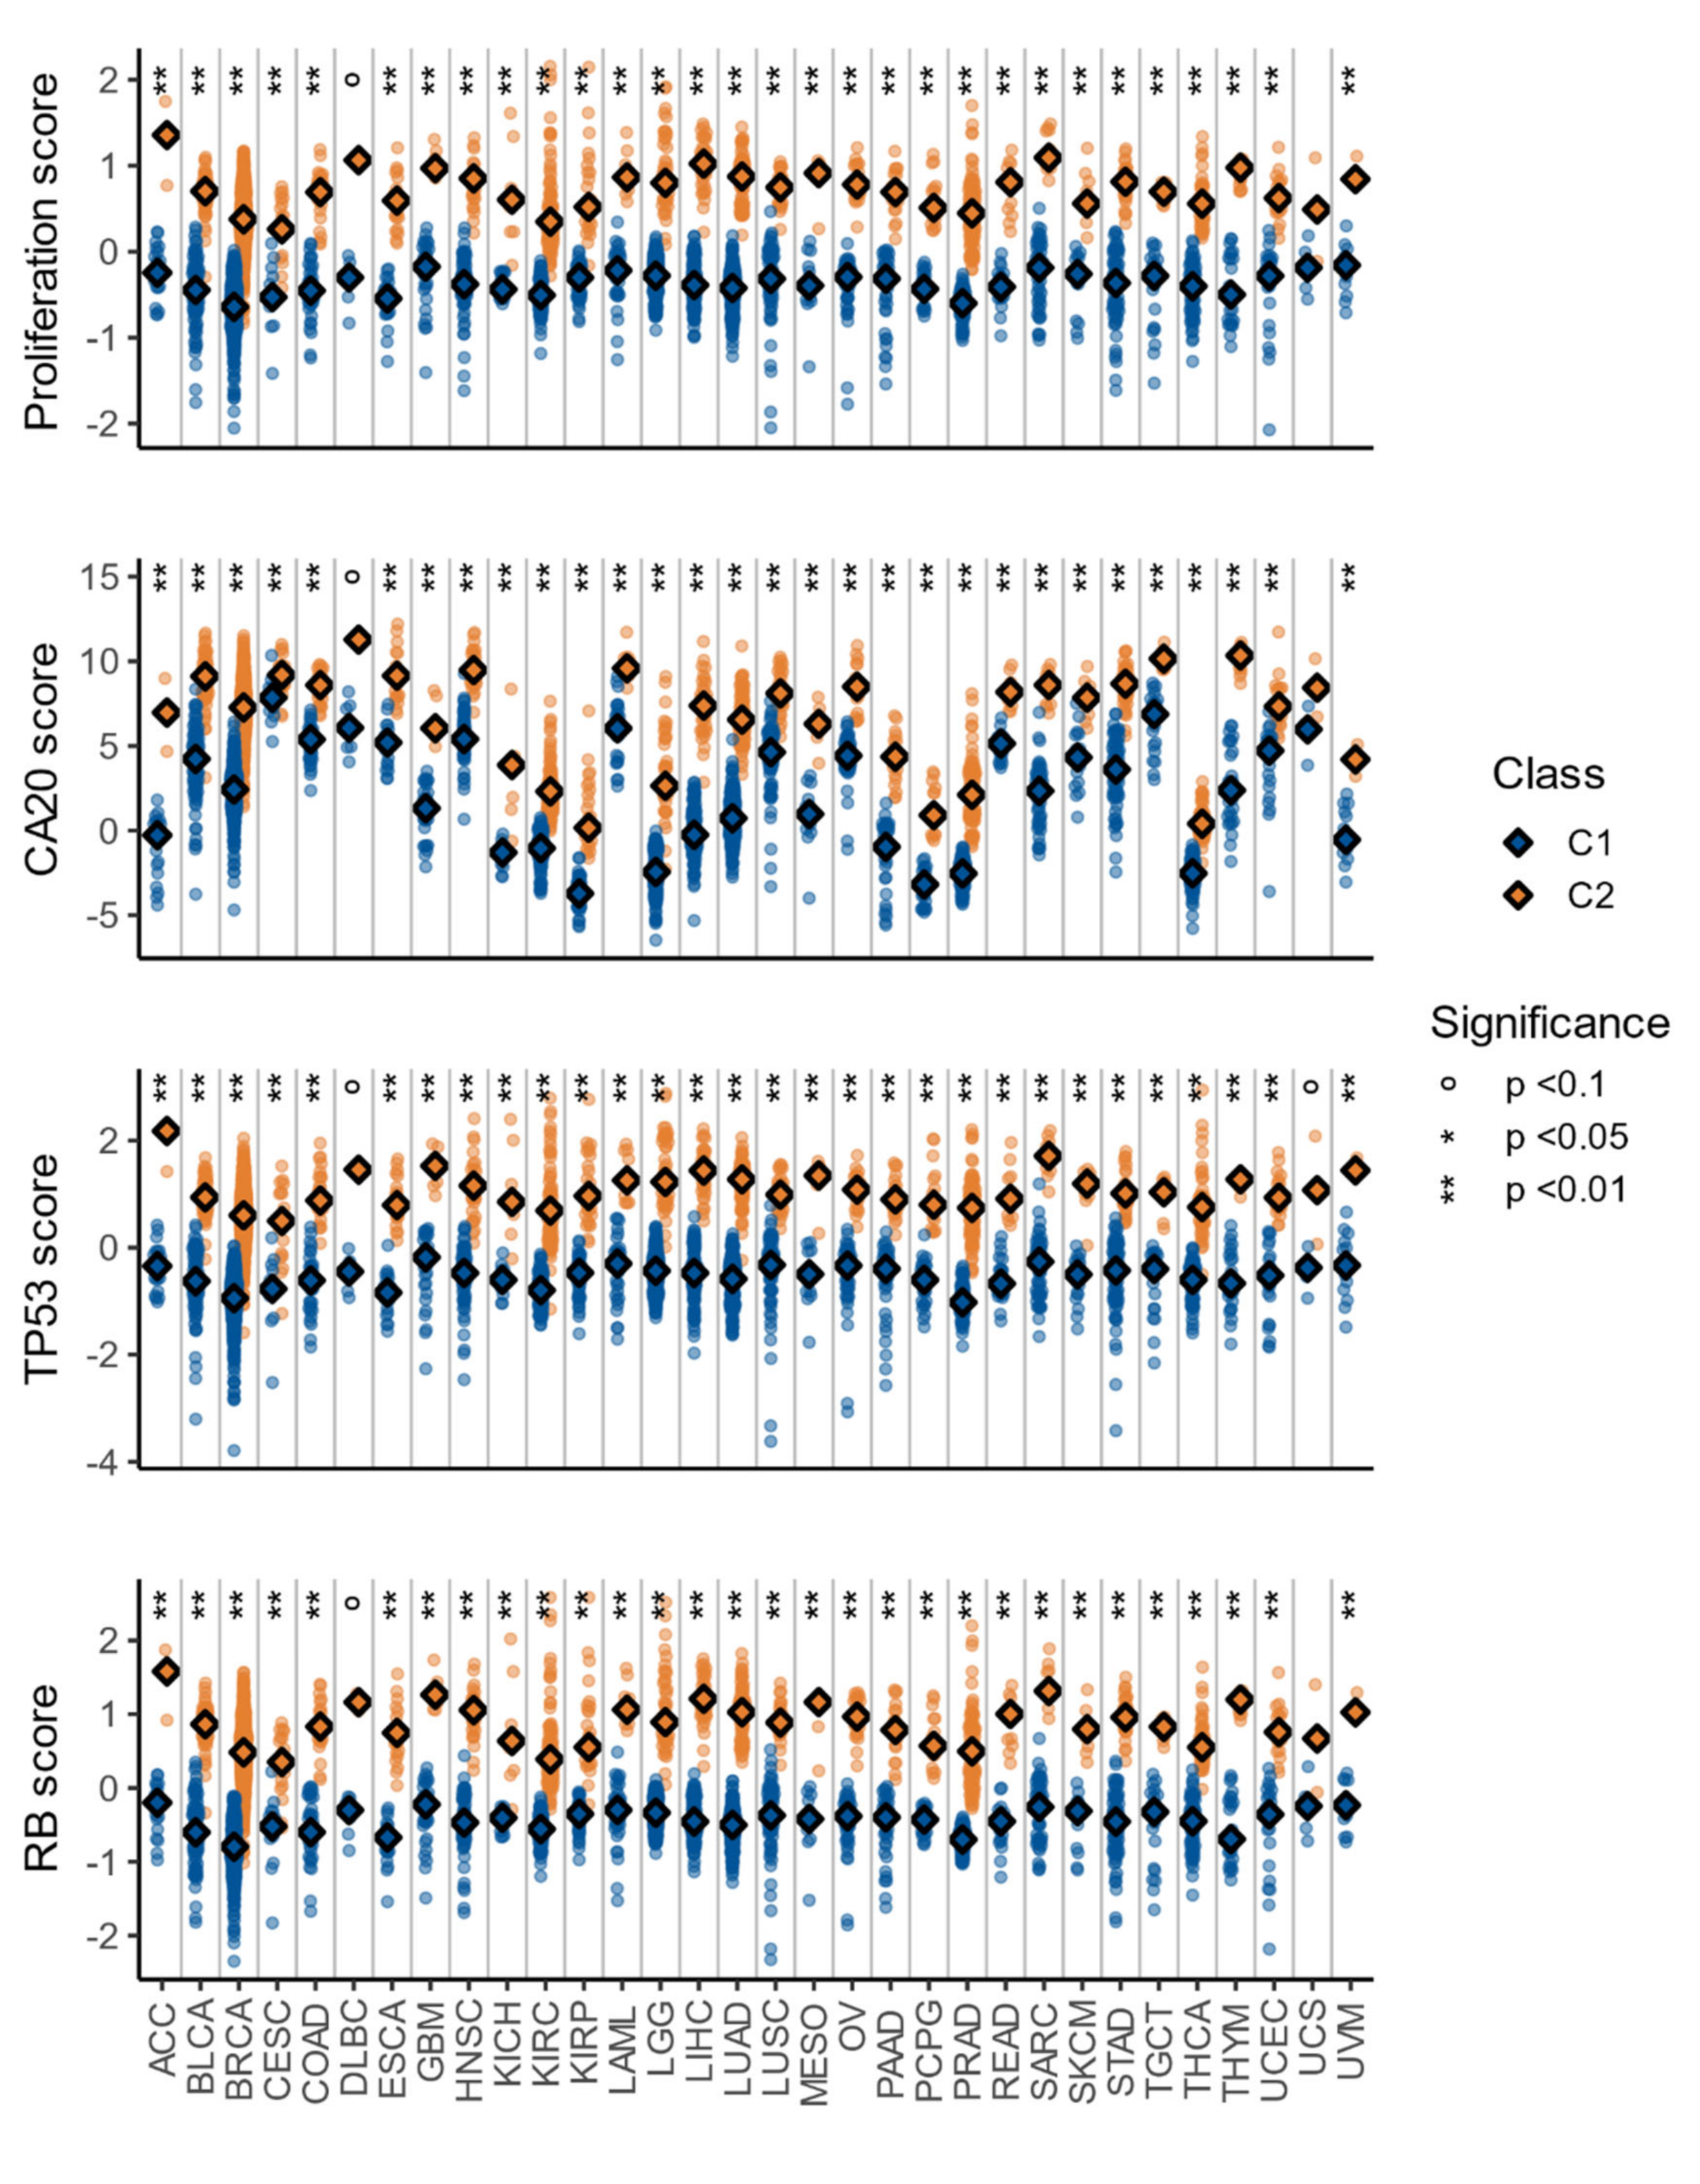
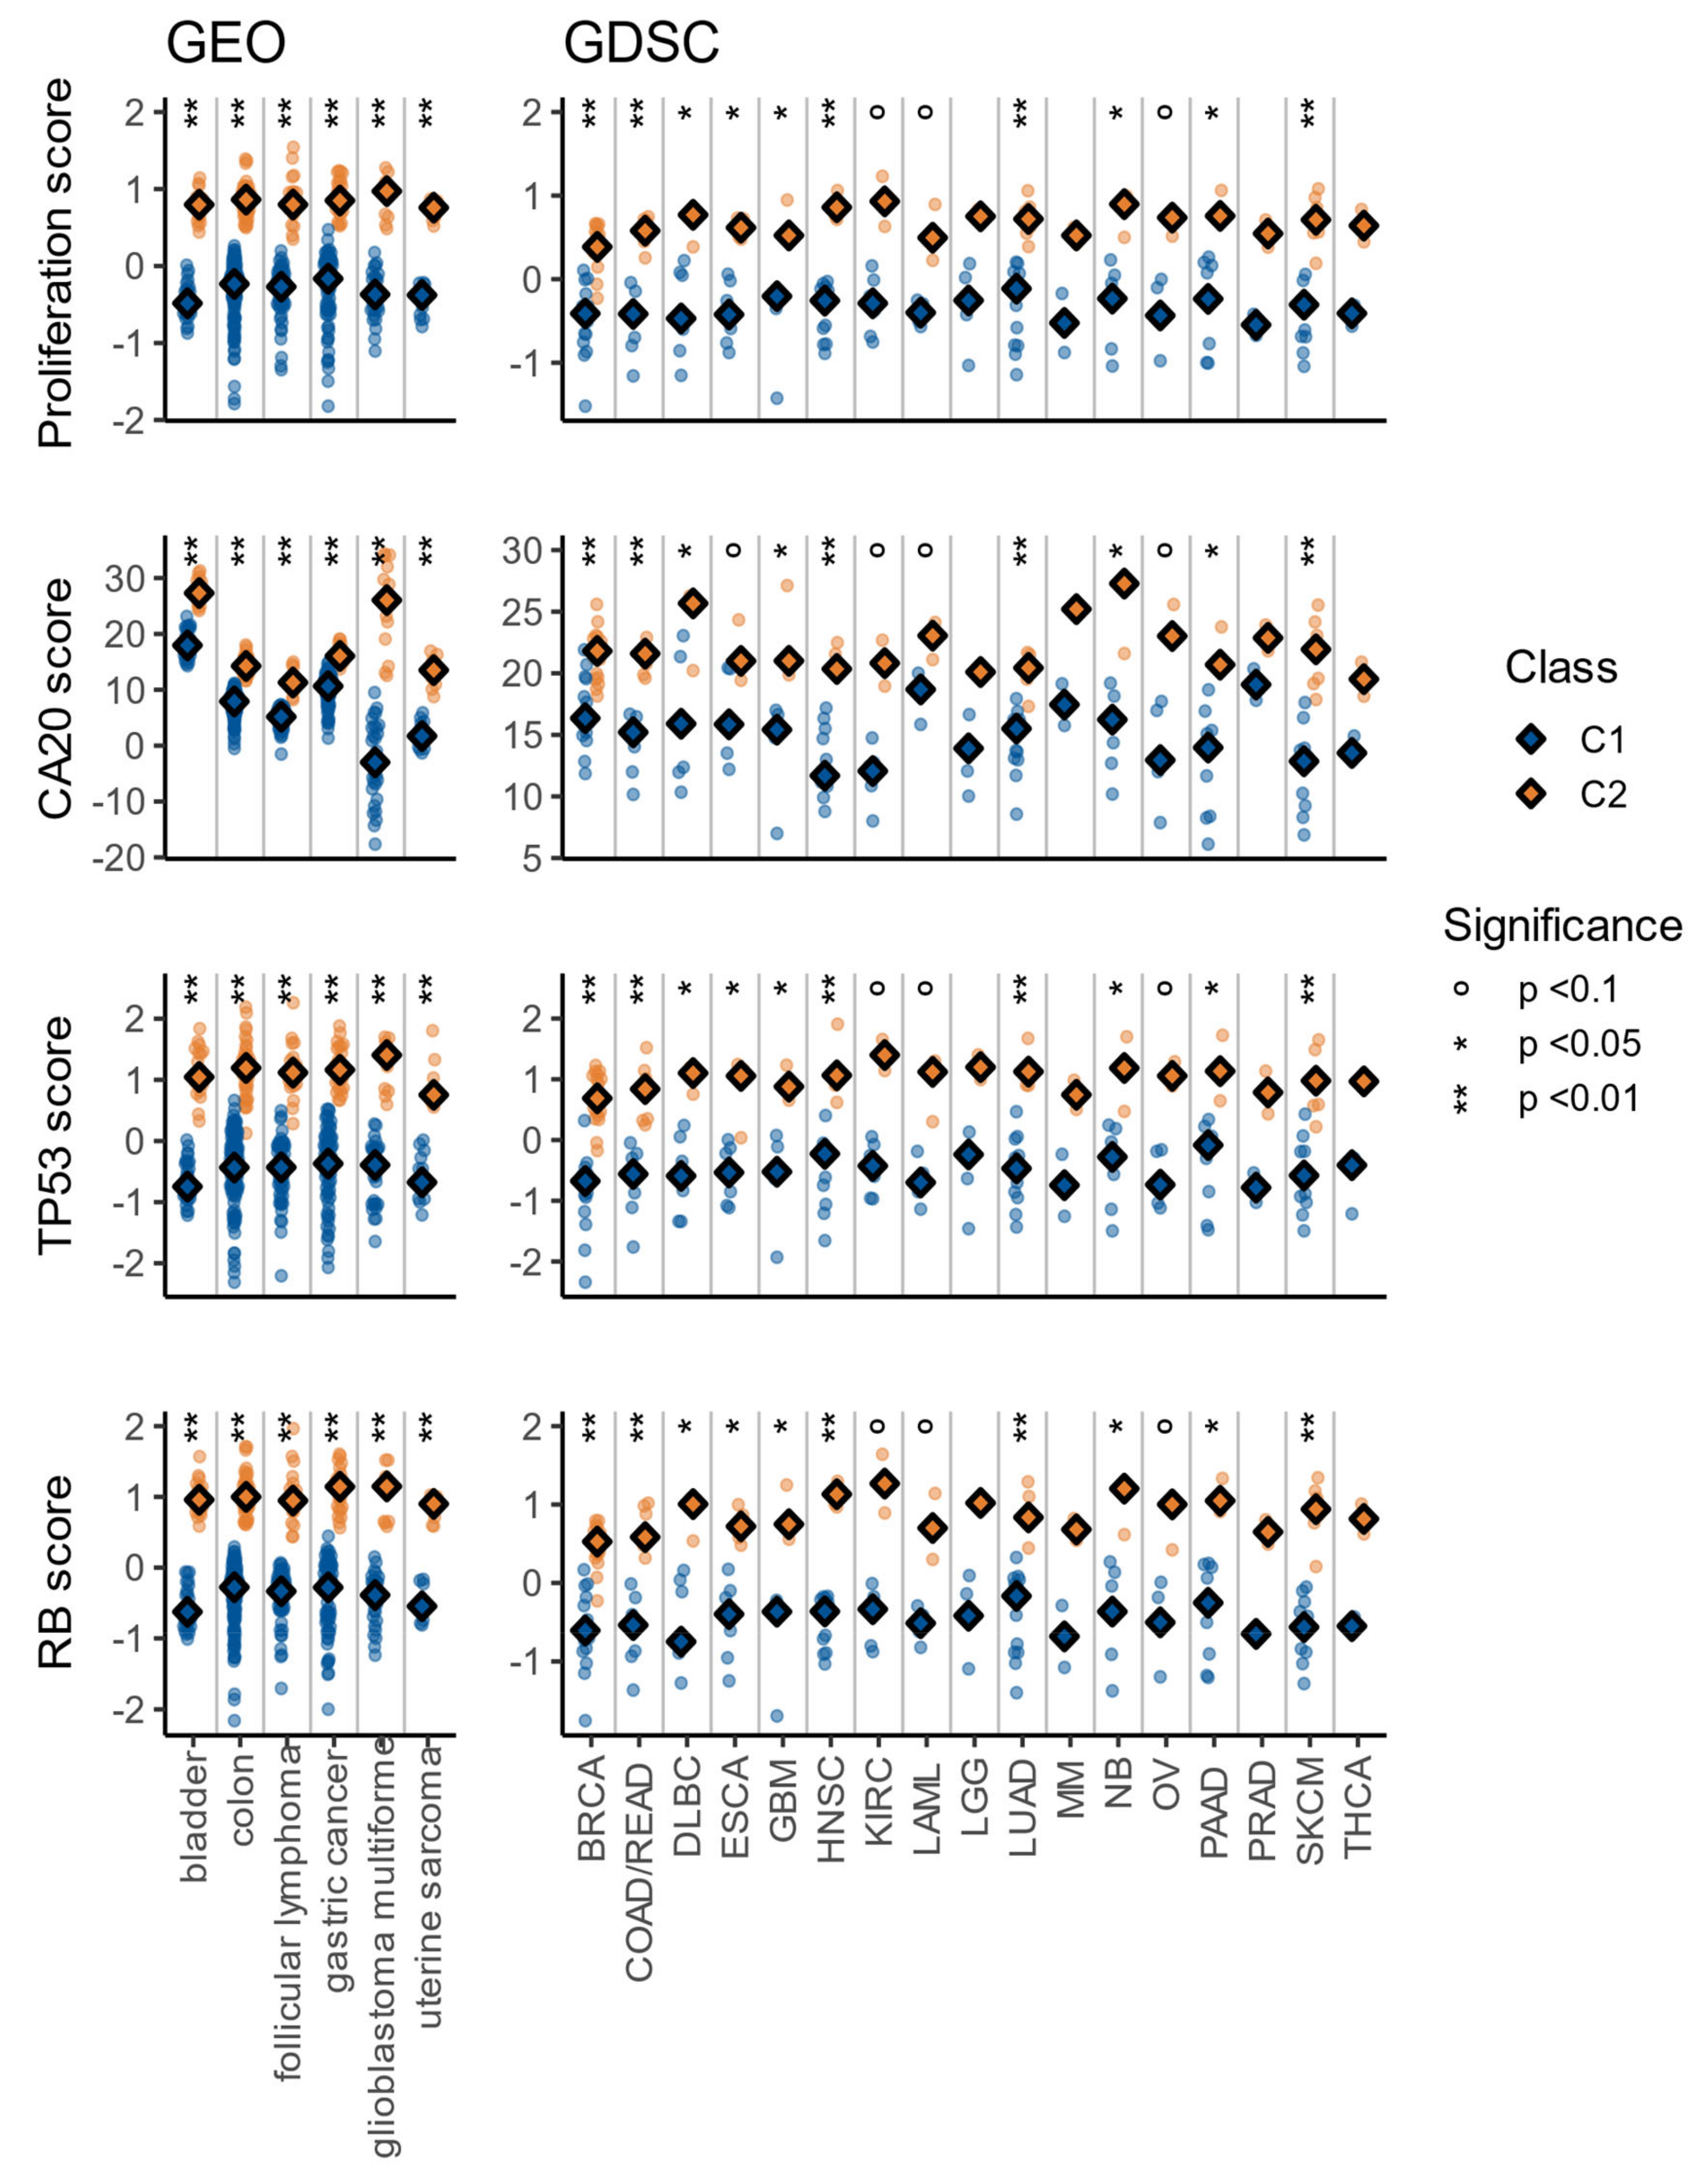
3.4. The C1/C2 Classification Is Associated with Proliferation, Centrosome Amplification, TP53, and Retinoblastoma Pathways
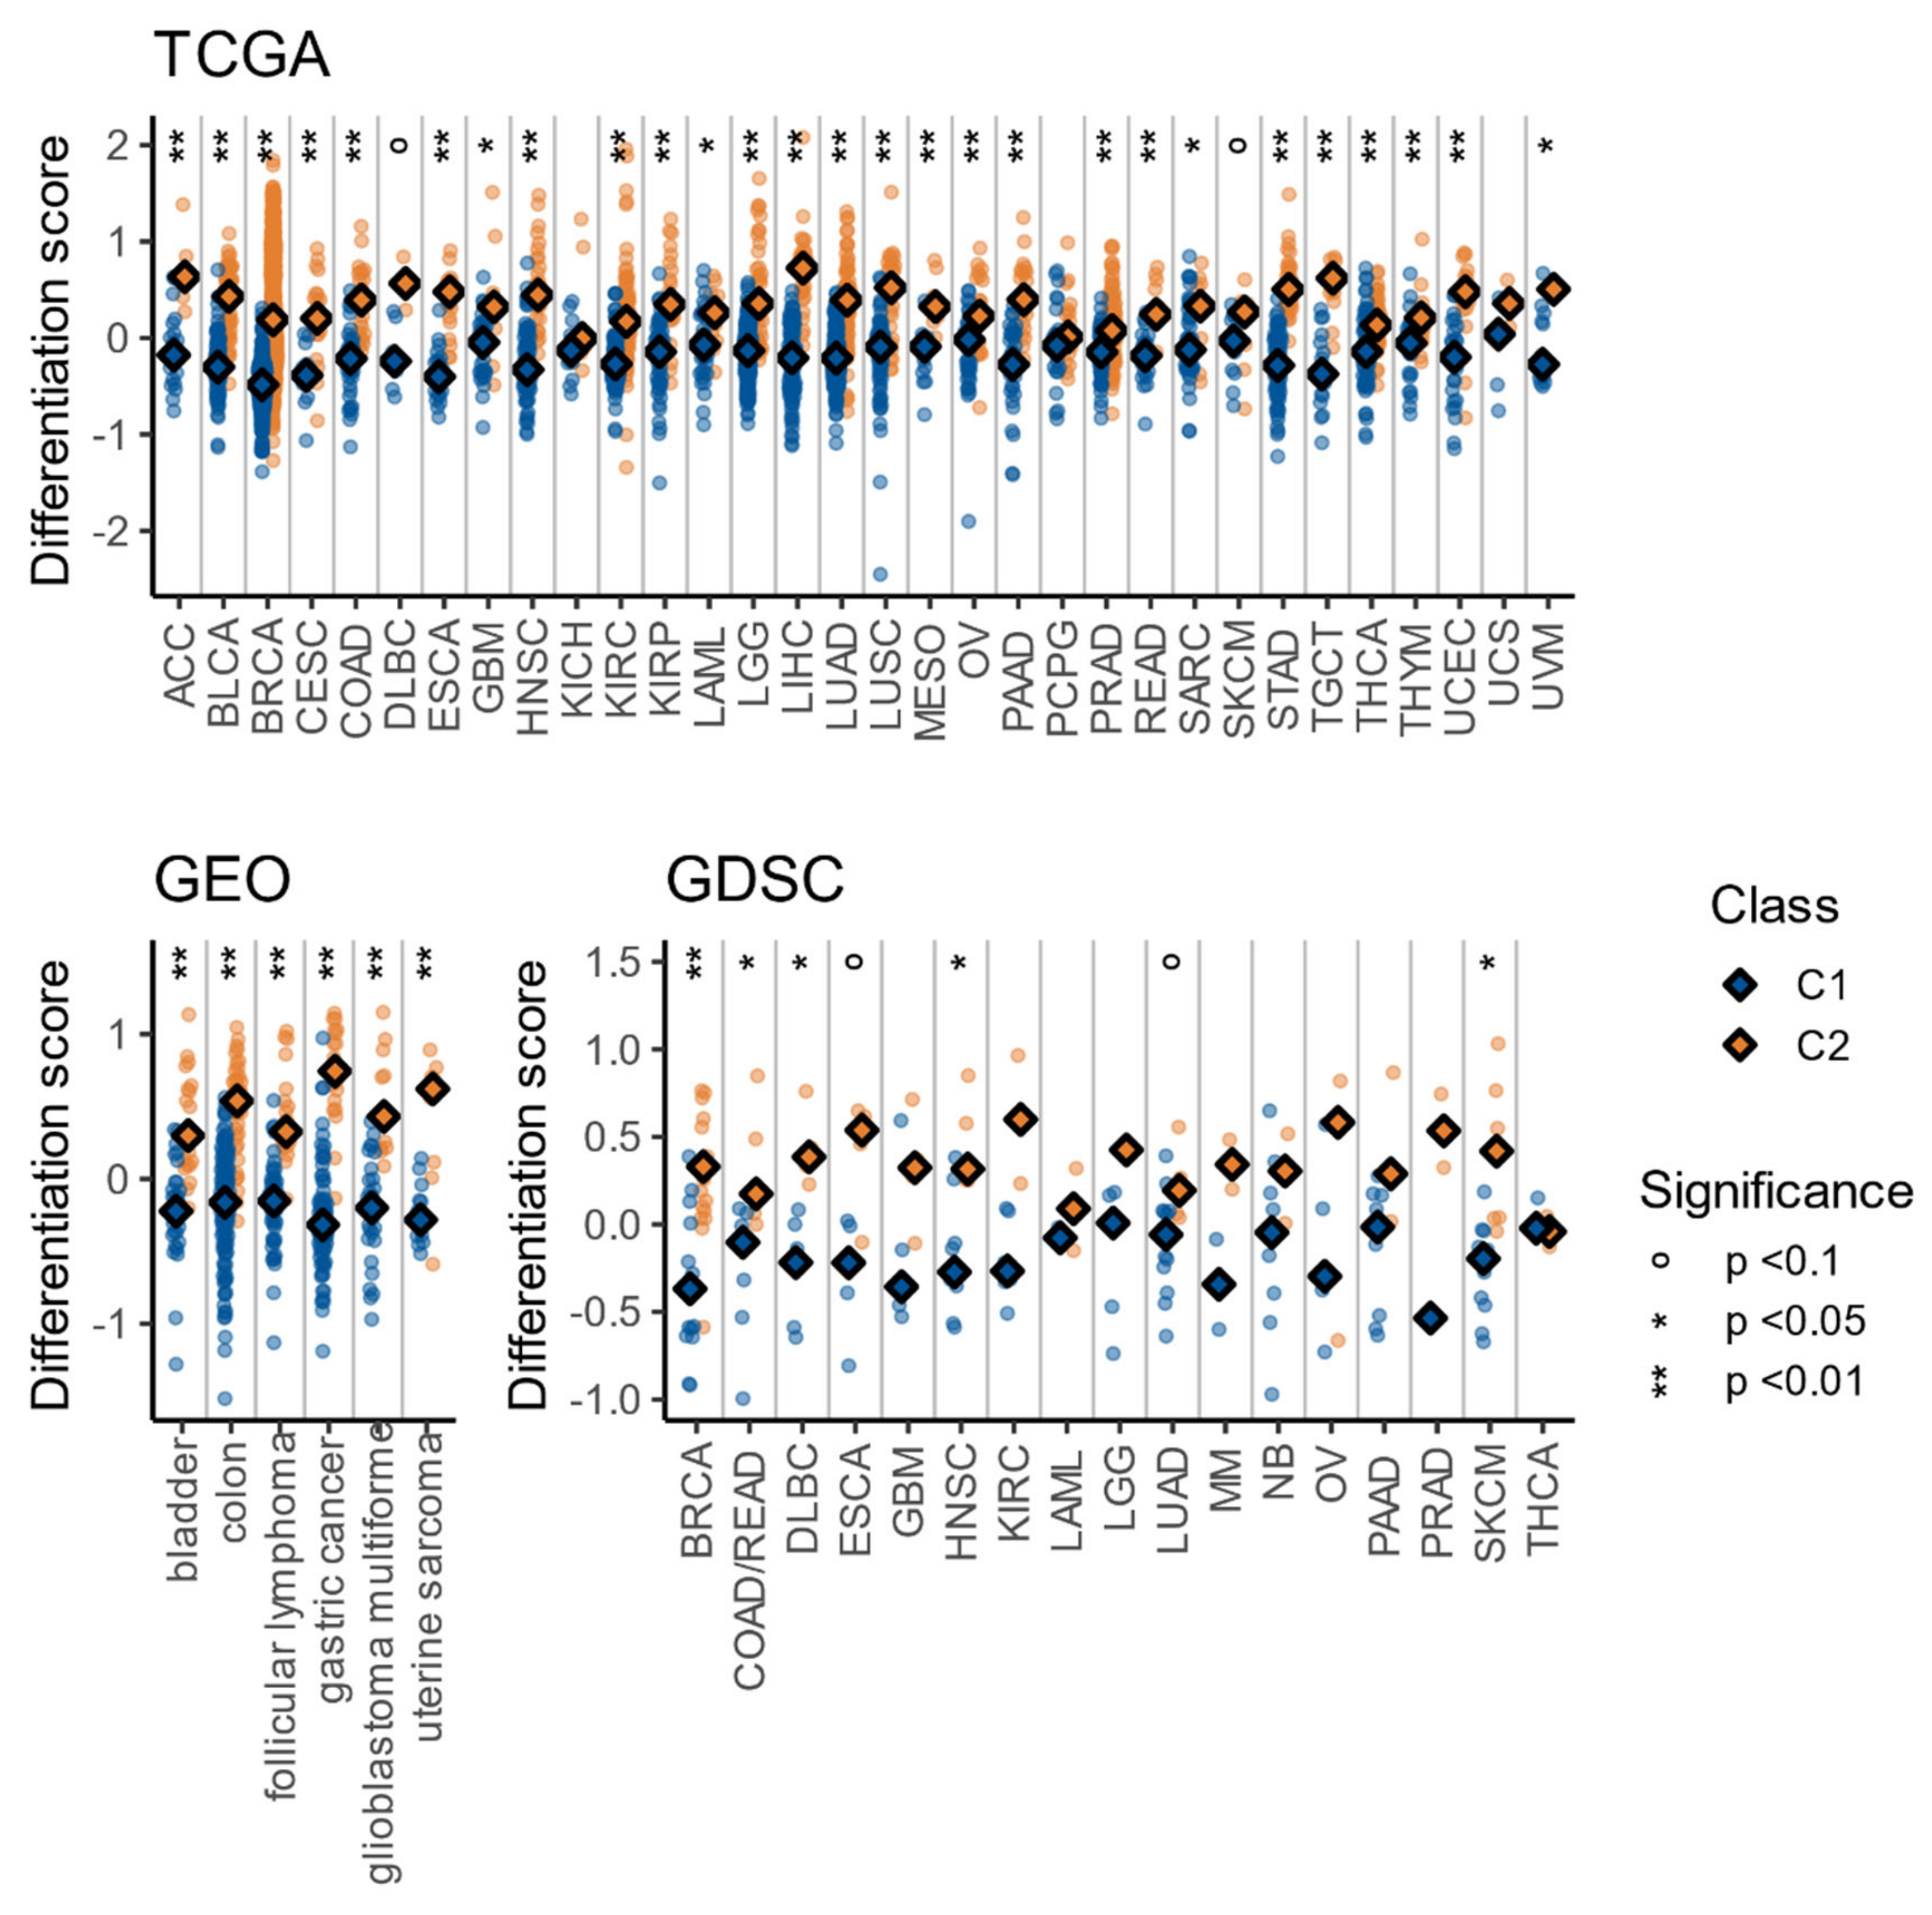
3.5. The C1/C2 Classification Is Associated with Tumor Differentiation and Embryonic Stem Cell-Likeness
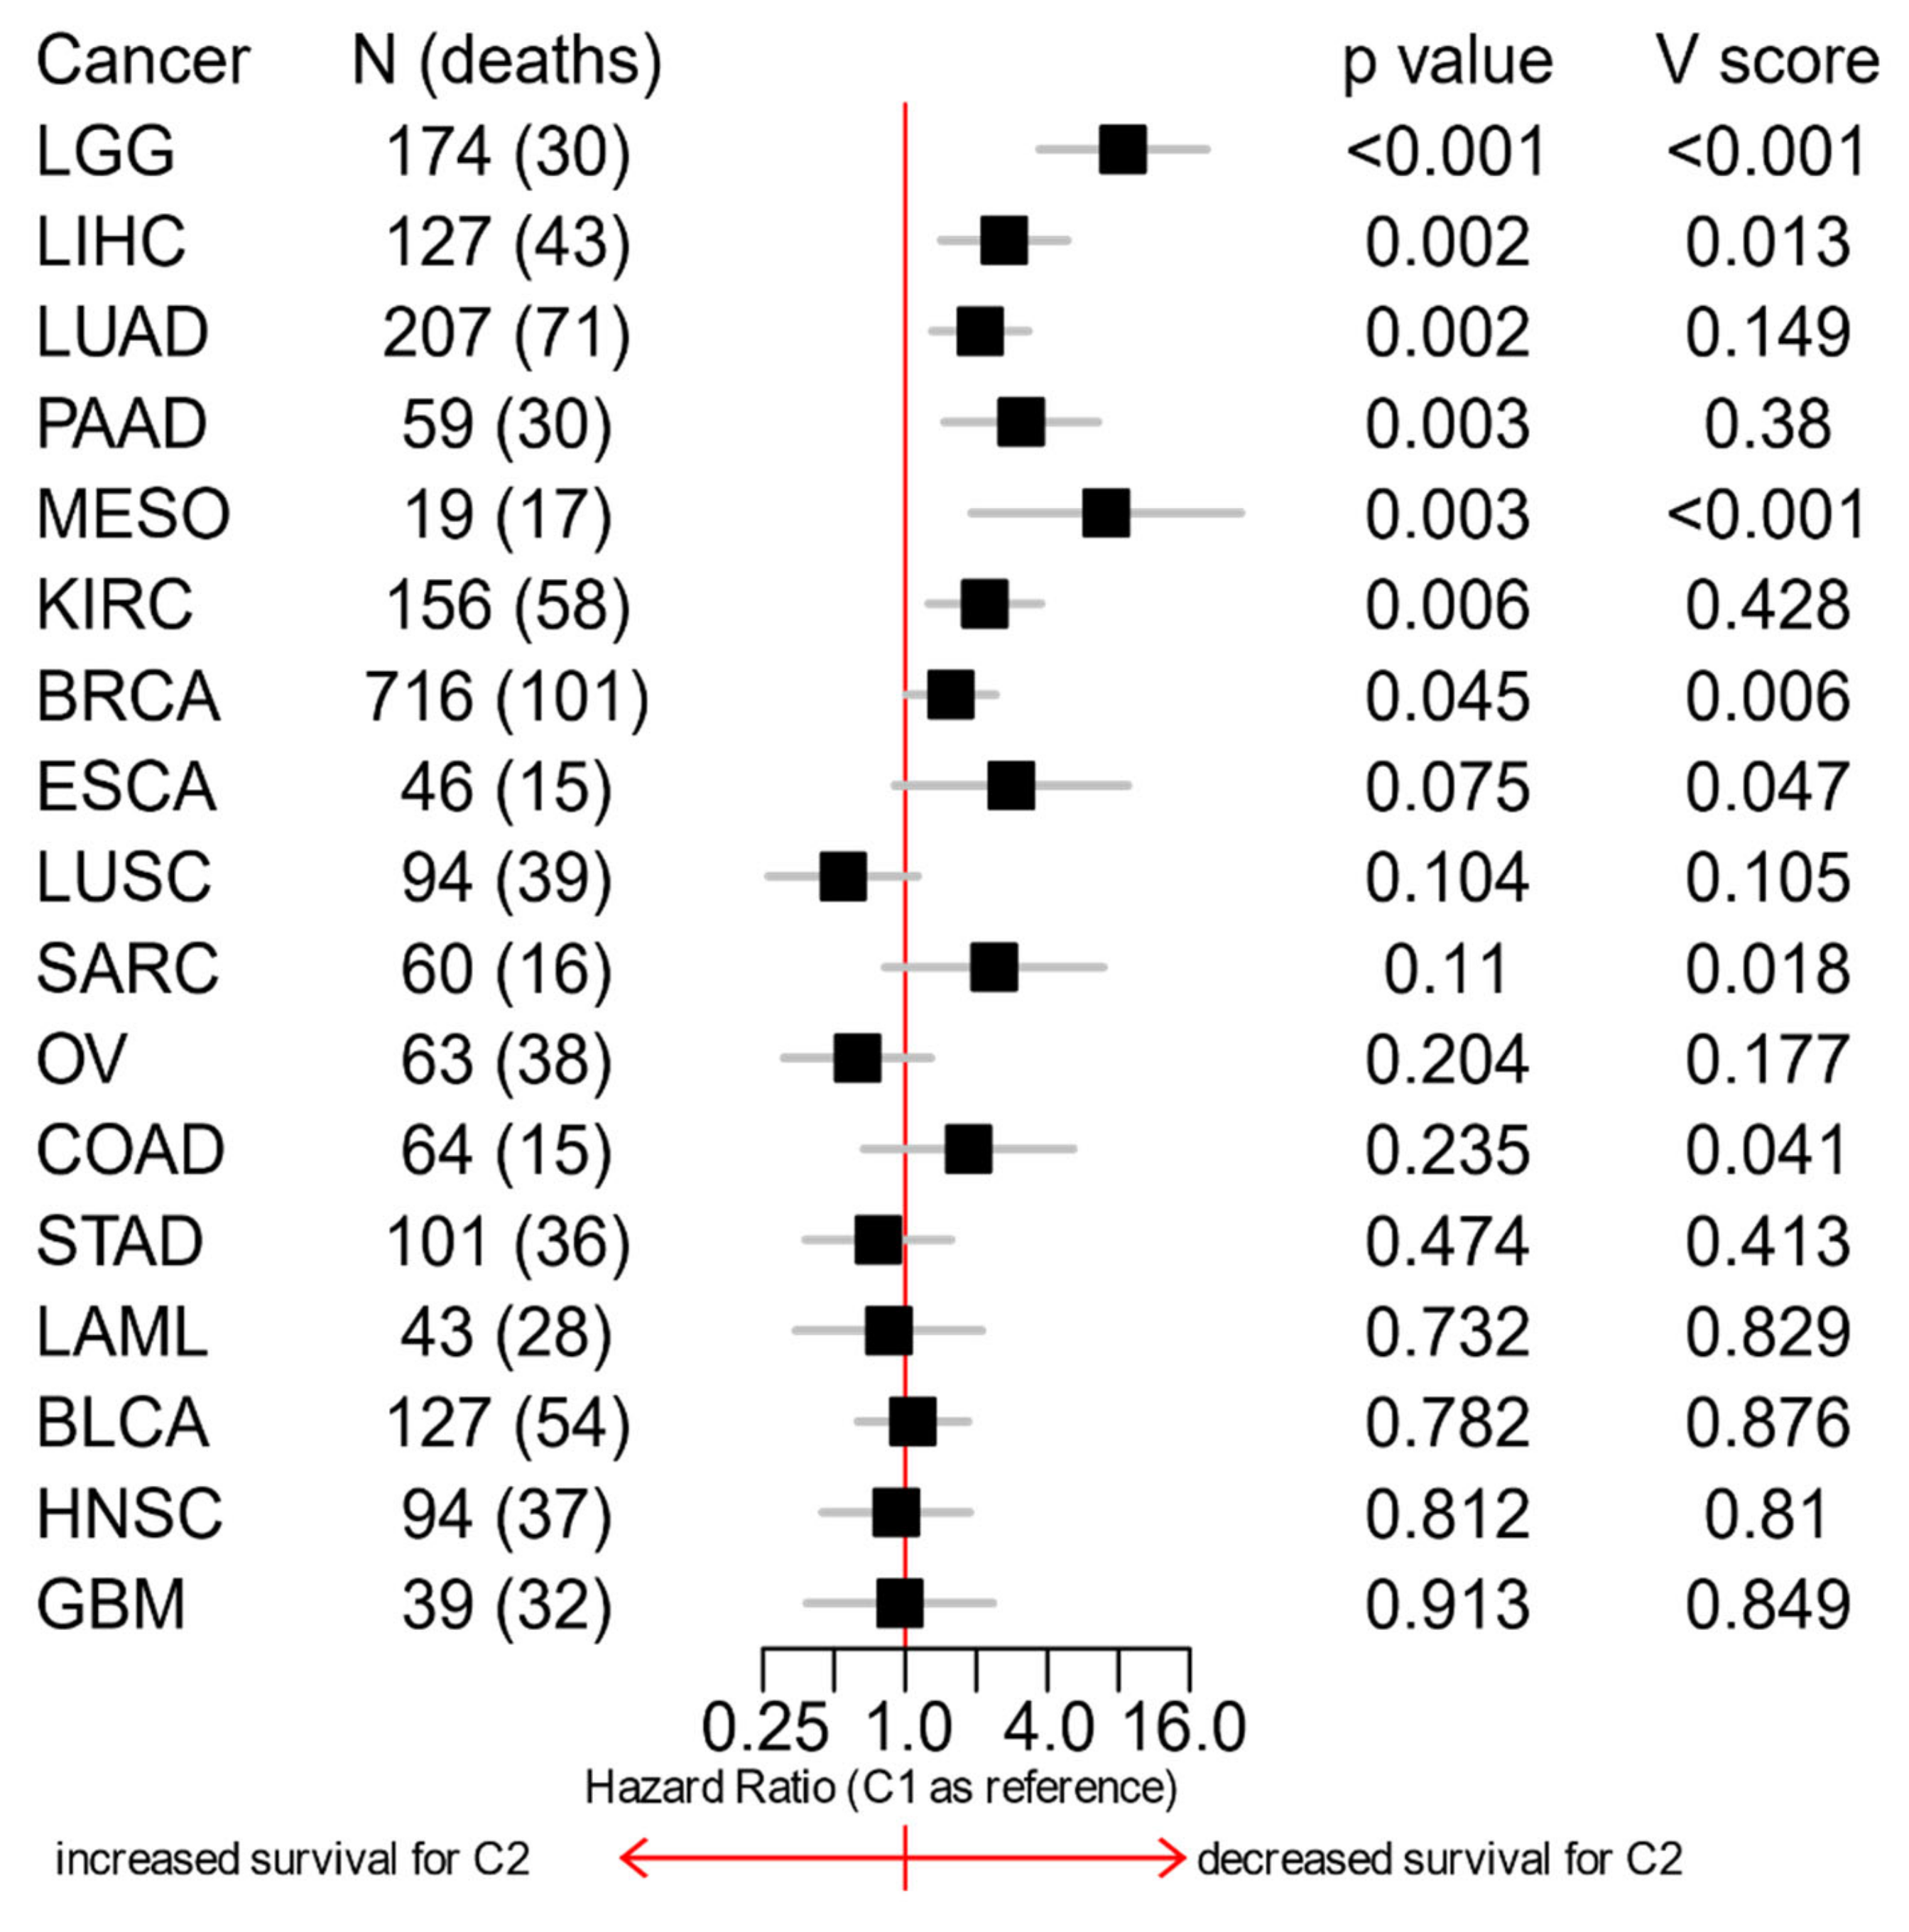
3.6. The C1/C2 Classification Is Associated with Patients’ Survival
3.7. A Few Transcription Factors Could Cause Most of the Differences between C1 and C2 Signatures
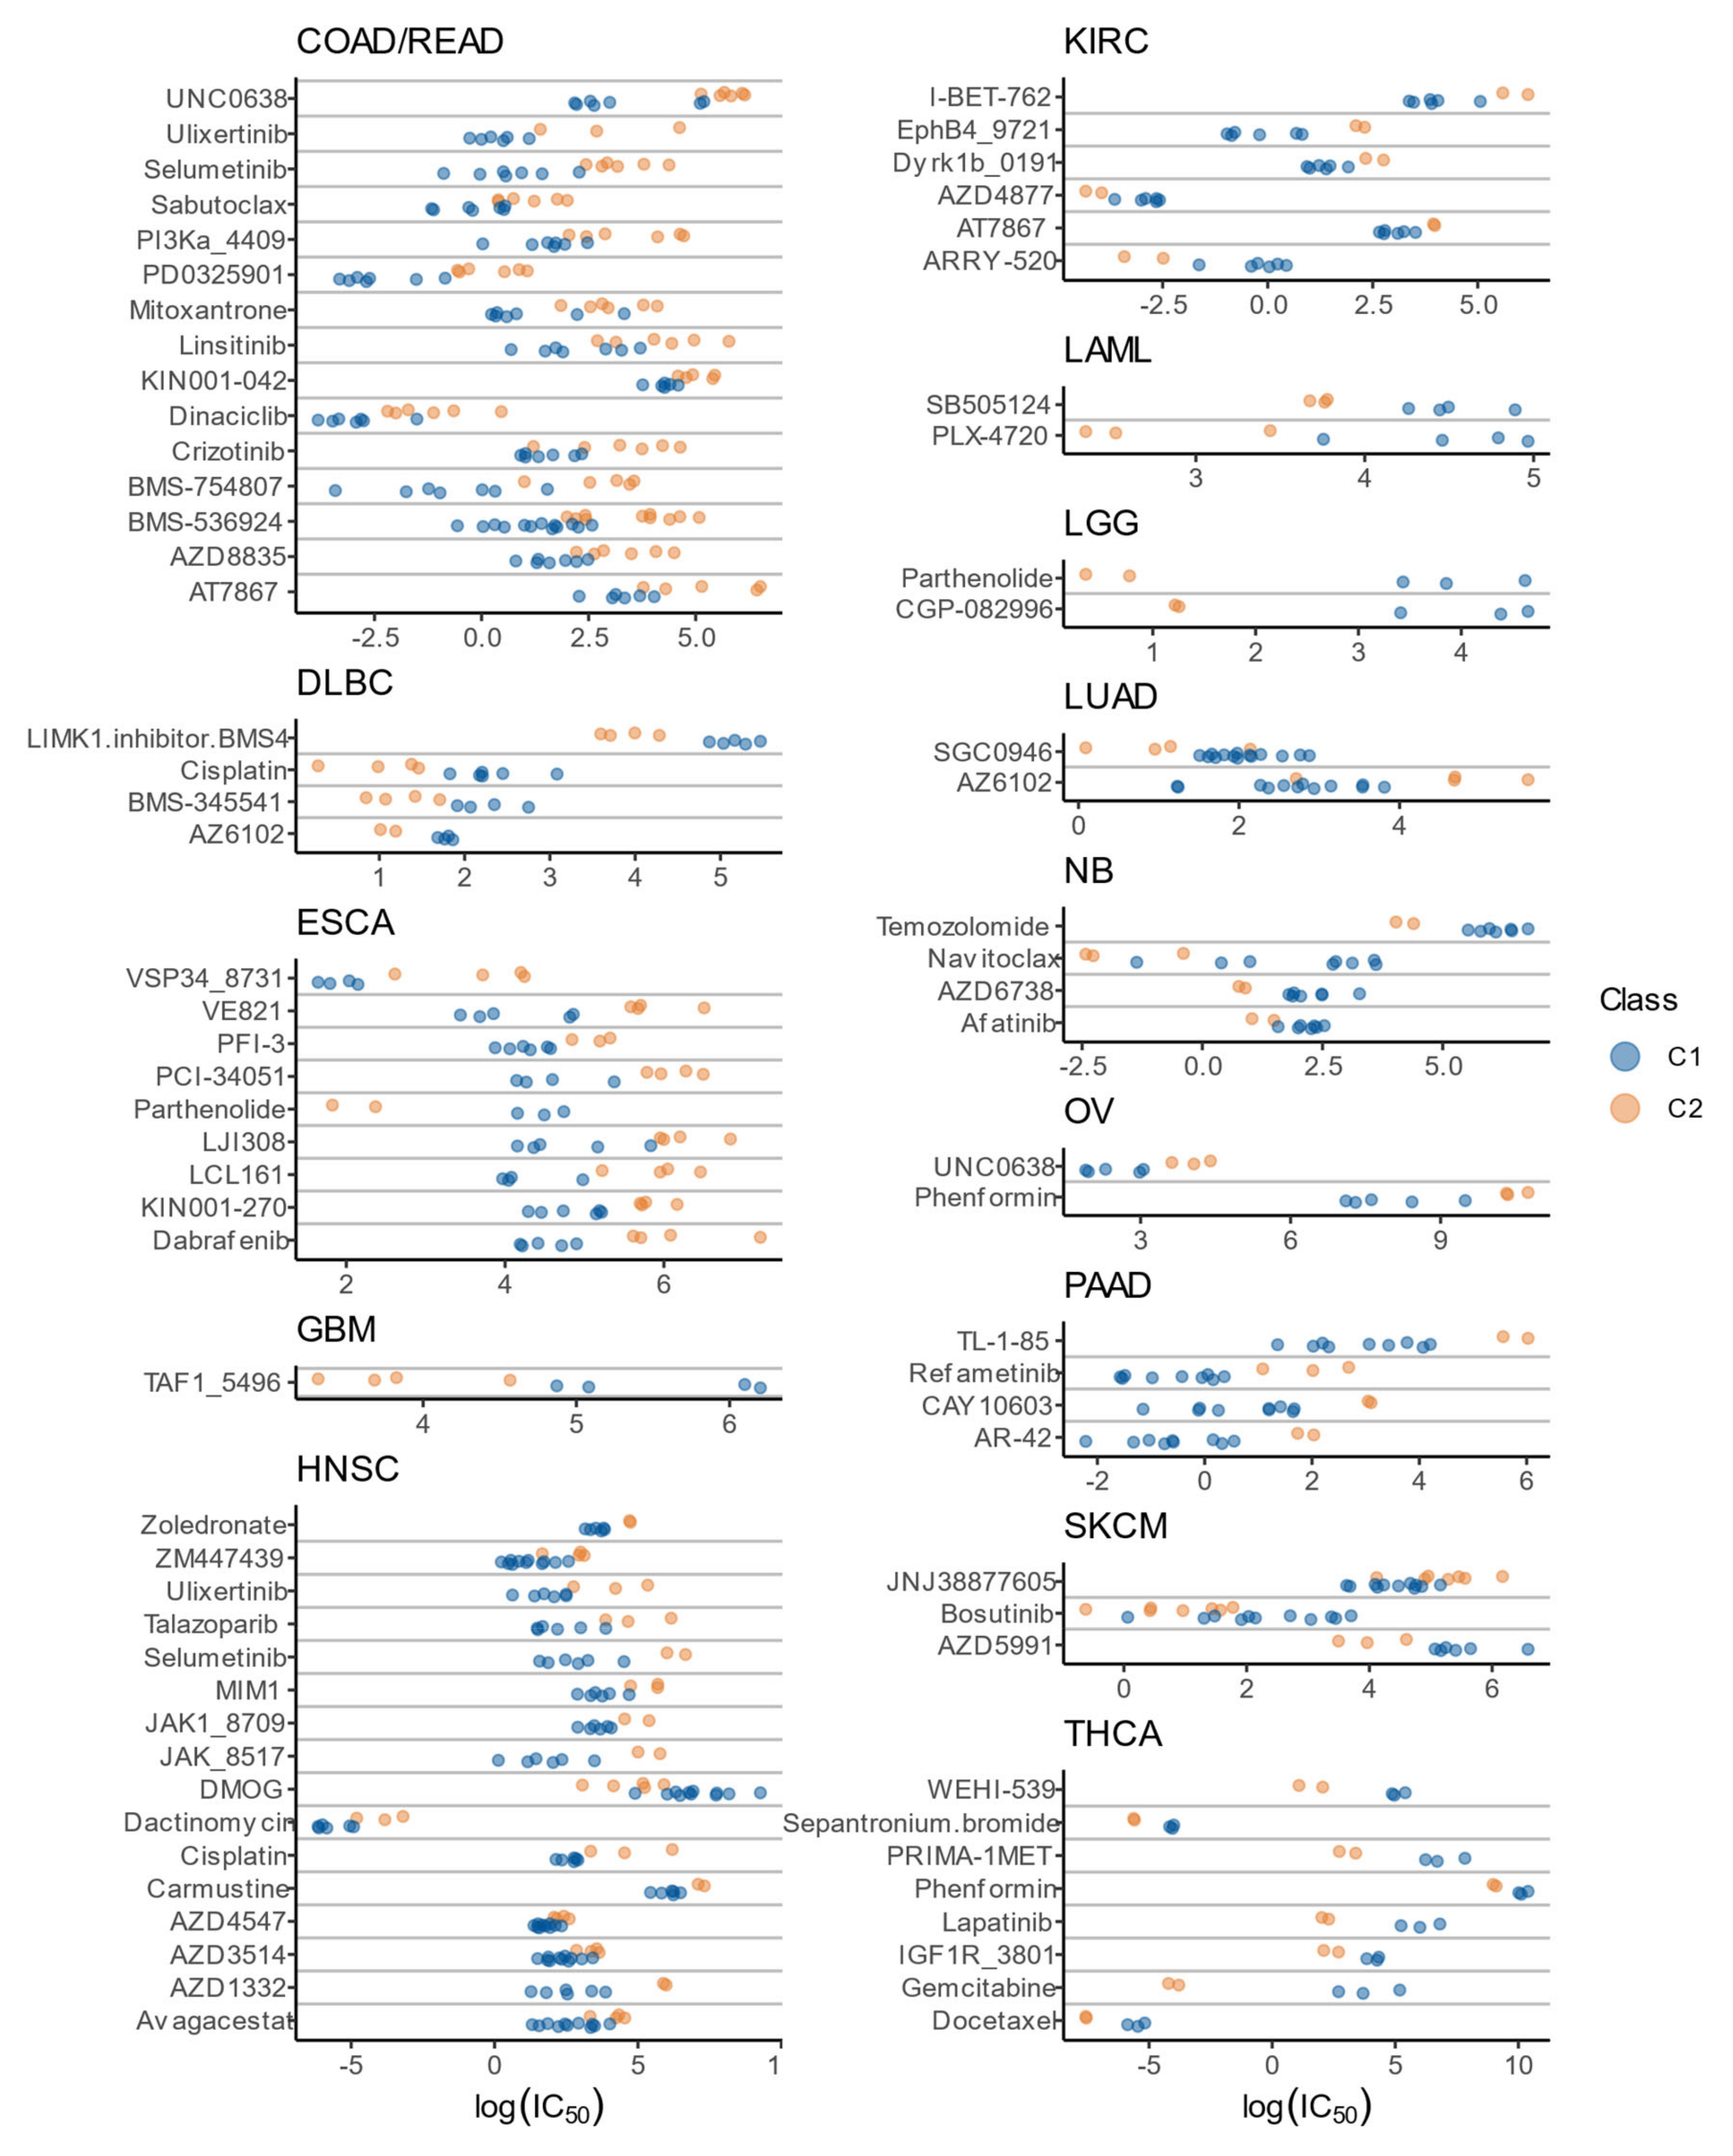
3.8. Drug Sensitivity Patterns of C1 and C2 Classes
3.9. The Immune Infiltrate Prognostic Value Is Affected by the C1/C2 Classification
4. Discussion
Supplementary Materials
Author Contributions
Funding
Conflicts of Interest
References
- Ginsburg, G.S.; Phillips, K.A. Precision medicine: From science to value. Health Aff. 2018, 37, 694–701. [Google Scholar] [CrossRef] [PubMed]
- Cortés, J.; Calvo, E.; Vivancos, A.; Perez-Garcia, J.; Recio, J.A.; Seoane, J. New approach to cancer therapy based on a molecularly defined cancer classification. CA. Cancer J. Clin. 2014, 64, 70–74. [Google Scholar] [CrossRef] [PubMed]
- Cancer Genome Atlas Research Network; Weinstein, J.N.; Collisson, E.A.; Mills, G.B.; Shaw, K.R.M.; Ozenberger, B.A.; Ellrott, K.; Shmulevich, I.; Sander, C.; Stuart, J.M. The Cancer Genome Atlas Pan-Cancer analysis project. Nat. Genet. 2013, 45, 1113–1120. [Google Scholar] [CrossRef]
- Parker, J.S.; Mullins, M.; Cheang, M.C.U.; Leung, S.; Voduc, D.; Vickery, T.; Davies, S.; Fauron, C.; He, X.; Hu, Z.; et al. Supervised risk predictor of breast cancer based on intrinsic subtypes. J. Clin. Oncol. 2009, 27, 1160–1167. [Google Scholar] [CrossRef] [PubMed]
- Perou, C.M.; Sørlie, T.; Eisen, M.B.; van de Rijn, M.; Jeffrey, S.S.; Rees, C.A.; Pollack, J.R.; Ross, D.T.; Johnsen, H.; Akslen, L.A. Molecular portraits of human breast tumours. Nature 2000, 406, 747–752. [Google Scholar] [CrossRef] [PubMed]
- Choi, W.; Porten, S.; Kim, S.; Willis, D.; Plimack, E.R.; Hoffman-Censits, J.; Roth, B.; Cheng, T.; Tran, M.; Lee, I.-L.; et al. Identification of distinct basal and luminal subtypes of muscle-invasive bladder cancer with different sensitivities to frontline chemotherapy. Cancer Cell 2014, 25, 152–165. [Google Scholar] [CrossRef]
- Moffitt, R.A.; Marayati, R.; Flate, E.L.; Volmar, K.E.; Loeza, S.G.H.; Hoadley, K.A.; Rashid, N.U.; Williams, L.A.; Eaton, S.C.; Chung, A.H.; et al. Virtual microdissection identifies distinct tumor- and stroma-specific subtypes of pancreatic ductal adenocarcinoma. Nat. Genet. 2015, 47, 1168–1178. [Google Scholar] [CrossRef]
- Koboldt, D.C.; Fulton, R.S.; McLellan, M.D.; Schmidt, H.; Kalicki-Veizer, J.; McMichael, J.F.; Fulton, L.L.; Dooling, D.J.; Ding, L.; Mardis, E.R.; et al. Comprehensive molecular portraits of human breast tumours. Nature 2012, 490, 61–70. [Google Scholar] [CrossRef]
- Chung, C.H.; Bernard, P.S.; Perou, C.M. Molecular portraits and the family tree of cancer. Nat. Genet. 2002, 32, 533–540. [Google Scholar] [CrossRef]
- Begg, C.B.; Rice, M.S.; Zabor, E.C.; Tworoger, S.S. Examining the common aetiology of serous ovarian cancers and basal-like breast cancers using double primaries. Br. J. Cancer 2017, 116, 1088–1091. [Google Scholar] [CrossRef]
- Siegfried, J.M.; Lin, Y.; Diergaarde, B.; Lin, H.-M.; Dacic, S.; Pennathur, A.; Weissfeld, J.L.; Romkes, M.; Nukui, T.; Stabile, L.P. Expression of PAM50 Genes in Lung Cancer: Evidence that Interactions between Hormone Receptors and HER2/HER3 Contribute to Poor Outcome. Neoplasia 2015, 17, 817–825. [Google Scholar] [CrossRef] [PubMed]
- Zhao, S.G.; Chen, W.S.; Das, R.; Chang, S.L.; Tomlins, S.A.; Chou, J.; Quigley, D.A.; Dang, H.X.; Barnard, T.J.; Mahal, B.A.; et al. Clinical and Genomic Implications of Luminal and Basal Subtypes Across Carcinomas. Clin. Cancer Res. 2019, 25, 2450–2457. [Google Scholar] [CrossRef] [PubMed]
- Fresno, C.; González, G.A.; Merino, G.A.; Flesia, A.G.; Podhajcer, O.L.; Llera, A.S.; Fernández, E.A.; Kelso, J. A novel non-parametric method for uncertainty evaluation of correlation-based molecular signatures: Its application on PAM50 algorithm. Bioinformatics 2017, 33, 693–700. [Google Scholar] [CrossRef] [PubMed]
- Tai, W.; Mahato, R.; Cheng, K. The role of HER2 in cancer therapy and targeted drug delivery. J. Control. Release 2010, 146, 264–275. [Google Scholar] [CrossRef]
- Daemen, A.; Manning, G. HER2 is not a cancer subtype but rather a pan-cancer event and is highly enriched in AR-driven breast tumors. Breast Cancer Res. 2018, 20, 8. [Google Scholar] [CrossRef]
- Zhao, S.G.; Chang, S.L.; Erho, N.; Yu, M.; Lehrer, J.; Alshalalfa, M.; Speers, C.; Cooperberg, M.R.; Kim, W.; Ryan, C.J.; et al. Associations of Luminal and Basal Subtyping of Prostate Cancer With Prognosis and Response to Androgen Deprivation Therapy. JAMA Oncol. 2017, 3, 1663–1672. [Google Scholar] [CrossRef]
- Fresno, C.; Gonzalez, G.A.; Llera, A.S.; Fernandez, E.A. pbcmc: Permutation-Based Confidence for Molecular Classification 2016. Available online: https://bioconductor.riken.jp/packages/3.3/bioc/html/pbcmc.html (accessed on 21 August 2019).
- Edgar, R.; Domrachev, M.; Lash, A.E. Gene Expression Omnibus: NCBI gene expression and hybridization array data repository. Nucleic Acids Res. 2002, 30, 207–210. [Google Scholar] [CrossRef]
- Barrett, T.; Wilhite, S.E.; Ledoux, P.; Evangelista, C.; Kim, I.F.; Tomashevsky, M.; Marshall, K.A.; Phillippy, K.H.; Sherman, P.M.; Holko, M.; et al. NCBI GEO: Archive for functional genomics data sets—Update. Nucleic Acids Res. 2013, 41. [Google Scholar] [CrossRef]
- Yang, W.; Soares, J.; Greninger, P.; Edelman, E.J.; Lightfoot, H.; Forbes, S.; Bindal, N.; Beare, D.; Smith, J.A.; Thompson, I.R.; et al. Genomics of Drug Sensitivity in Cancer (GDSC): A resource for therapeutic biomarker discovery in cancer cells. Nucleic Acids Res. 2013, 41, D955. [Google Scholar] [CrossRef]
- Wei, L.; Jin, Z.; Yang, S.; Xu, Y.; Zhu, Y.; Ji, Y. TCGA-Assembler 2: Software Pipeline for Retrieval and Processing of TCGA / CPTAC Data. Bioinformatics 2018, 34, 1615–1617. [Google Scholar] [CrossRef]
- Robinson, M.D.; McCarthy, D.J.; Smyth, G.K. edgeR: A Bioconductor package for differential expression analysis of digital gene expression data. Bioinformatics 2009, 26, 139–140. [Google Scholar] [CrossRef] [PubMed]
- Sean, D.; Meltzer, P.S. GEOquery: A bridge between the Gene Expression Omnibus (GEO) and BioConductor. Bioinformatics 2007, 23, 1846–1847. [Google Scholar] [CrossRef]
- Carlson, M. org.Hs.eg.db: Genome Wide Annotation for Human 2019. Available online: https://bioconductor.org/packages/release/data/annotation/html/org.Hs.eg.db.html (accessed on 27 June 2020).
- Fernández, E.; Mahmoud, Y.; Veigas, F.; Rocha, D.; Balzarini, M.; Lujan, H.; Rabinovich, G.; Girotti, M.R. MIXTURE: An improved algorithm for immune tumor microenvironment estimation based on gene expression data. bioRxiv 2019, 726562. [Google Scholar] [CrossRef]
- Newman, A.M.; Liu, C.L.; Green, M.R.; Gentles, A.J.; Feng, W.; Xu, Y.; Hoang, C.D.; Diehn, M.; Alizadeh, A.A. Robust enumeration of cell subsets from tissue expression profiles. Nat. Methods 2015, 12, 453–457. [Google Scholar] [CrossRef]
- Hänzelmann, S.; Castelo, R.; Guinney, J. GSVA: Gene set variation analysis for microarray and RNA-Seq data. BMC Bioinformatics 2013, 14, 7. [Google Scholar] [CrossRef]
- Rodriguez, J.C.; Merino, G.A.; Llera, A.S.; Fernández, E.A. Massive integrative gene set analysis enables functional characterization of breast cancer subtypes. J. Biomed. Inform. 2019, 93, 103157. [Google Scholar] [CrossRef]
- Van der Maaten, L.; Hinton, G. Visualizing Data using t-SNE. J. Mach. Learn. Res. 2008, 2579–2605. [Google Scholar]
- Liberzon, A.; Subramanian, A.; Pinchback, R.; Thorvaldsdóttir, H.; Tamayo, P.; Mesirov, J.P. Molecular signatures database (MSigDB) 3.0. Bioinformatics 2011, 27, 1739–1740. [Google Scholar] [CrossRef]
- Ogata, H.; Goto, S.; Sato, K.; Fujibuchi, W.; Bono, H.; Kanehisa, M. KEGG: Kyoto Encyclopedia of Genes and Genomes. Nucleic Acids Res. 1999, 27, 29–34. [Google Scholar] [CrossRef]
- Croft, D.; Mundo, A.F.; Haw, R.; Milacic, M.; Weiser, J.; Wu, G.; Caudy, M.; Garapati, P.; Gillespie, M.; Kamdar, M.R.; et al. The Reactome pathway knowledgebase. Nucleic Acids Res. 2014, 42, D472–D477. [Google Scholar] [CrossRef]
- Ritchie, M.E.; Phipson, B.; Wu, D.; Hu, Y.; Law, C.W.; Shi, W.; Smyth, G.K. limma powers differential expression analyses for RNA-sequencing and microarray studies. Nucleic Acids Res. 2015, 43, e47. [Google Scholar] [CrossRef] [PubMed]
- Venet, D.; Dumont, J.E.; Detours, V. Most Random Gene Expression Signatures Are Significantly Associated with Breast Cancer Outcome. PLoS Comput. Biol. 2011, 7, e1002240. [Google Scholar] [CrossRef] [PubMed]
- Shimoni, Y. Association between expression of random gene sets and survival is evident in multiple cancer types and may be explained by sub-classification. PLOS Comput. Biol. 2018, 14, e1006026. [Google Scholar] [CrossRef] [PubMed]
- Hoadley, K.A.; Yau, C.; Hinoue, T.; Wolf, D.M.; Lazar, A.J.; Drill, E.; Shen, R.; Taylor, A.M.; Cherniack, A.D.; Thorsson, V.; et al. Cell-of-Origin Patterns Dominate the Molecular Classification of 10,000 Tumors from 33 Types of Cancer. Cell 2018, 173, 291–304. [Google Scholar] [CrossRef]
- Mooney, M.A.; Wilmot, B. Gene set analysis: A step-by-step guide. Am. J. Med. Genet. Part B Neuropsychiatr. Genet. 2015, 168, 517–527. [Google Scholar] [CrossRef]
- Rodriguez, J.C.; González, G.A.; Fresno, C.; Llera, A.S.; Fernández, E.A. Improving information retrieval in functional analysis. Comput. Biol. Med. 2016, 79, 10–20. [Google Scholar] [CrossRef]
- Marisa, L.; de Reyniès, A.; Duval, A.; Selves, J.; Gaub, M.P.; Vescovo, L.; Etienne-Grimaldi, M.-C.; Schiappa, R.; Guenot, D.; Ayadi, M.; et al. Gene Expression Classification of Colon Cancer into Molecular Subtypes: Characterization, Validation, and Prognostic Value. PLoS Med. 2013, 10, e1001453. [Google Scholar] [CrossRef]
- Oh, S.C.; Sohn, B.H.; Cheong, J.H.; Kim, S.B.; Lee, J.E.; Park, K.C.; Lee, S.H.; Park, J.L.; Park, Y.Y.; Lee, H.S.; et al. Clinical and genomic landscape of gastric cancer with a mesenchymal phenotype. Nat. Commun. 2018, 9, 1–14. [Google Scholar] [CrossRef]
- Newman, A.M.; Steen, C.B.; Liu, C.L.; Gentles, A.J.; Chaudhuri, A.A.; Scherer, F.; Khodadoust, M.S.; Esfahani, M.S.; Luca, B.A.; Steiner, D.; et al. Determining cell type abundance and expression from bulk tissues with digital cytometry. Nat. Biotechnol. 2019, 37, 773–782. [Google Scholar] [CrossRef]
- Zhang, B.; Shen, R.; Cheng, S.; Feng, L. Immune microenvironments differ in immune characteristics and outcome of glioblastoma multiforme. Cancer Med. 2019, 8, 2897–2907. [Google Scholar] [CrossRef]
- Binzer-Panchal, A.; Hardell, E.; Viklund, B.; Ghaderi, M.; Bosse, T.; Nucci, M.R.; Lee, C.H.; Hollfelder, N.; Corcoran, P.; Gonzalez-Molina, J.; et al. Integrated molecular analysis of undifferentiated uterine sarcomas reveals clinically relevant molecular subtypes. Clin. Cancer Res. 2019, 25, 2155–2165. [Google Scholar] [CrossRef] [PubMed]
- Kastan, M.B.; Bartek, J. Cell-cycle checkpoints and cancer. Nature 2004, 432, 316–323. [Google Scholar] [CrossRef] [PubMed]
- Hanahan, D.; Weinberg, R.A. Hallmarks of cancer: The next generation. Cell 2011, 144, 646–674. [Google Scholar] [CrossRef] [PubMed]
- Hanahan, D.; Weinberg, R.A. The Hallmarks of Cancer. Cell 2000, 100, 57–70. [Google Scholar] [CrossRef]
- Otto, T.; Sicinski, P. Cell cycle proteins as promising targets in cancer therapy. Nat. Rev. Cancer 2017, 17, 93–115. [Google Scholar] [CrossRef]
- Bourhis, J.; Overgaard, J.; Audry, H.; Ang, K.K.; Saunders, M.; Bernier, J.; Horiot, J.C.; Le Maître, A.; Pajak, T.F.; Poulsen, M.G.; et al. Hyperfractionated or accelerated radiotherapy in head and neck cancer: A meta-analysis. Lancet 2006, 368, 843–854. [Google Scholar] [CrossRef]
- Starmans, M.H.W.; Krishnapuram, B.; Steck, H.; Horlings, H.; Nuyten, D.S.A.; Van De Vijver, M.J.; Seigneuric, R.; Buffa, F.M.; Harris, A.L.; Wouters, B.G.; et al. Robust prognostic value of a knowledge-based proliferation signature across large patient microarray studies spanning different cancer types. Br. J. Cancer 2008, 99, 1884–1890. [Google Scholar] [CrossRef][Green Version]
- Raff, J.W.; Basto, R. Centrosome Amplification and Cancer: A Question of Sufficiency. Dev. Cell 2017, 40, 217–218. [Google Scholar] [CrossRef]
- Rivera-Rivera, Y.; Saavedra, H.I. Centrosome—A promising anti-cancer target. Biologics 2016, 10, 167–176. [Google Scholar] [CrossRef]
- Ogden, A.; Rida, P.C.G.; Aneja, R. Prognostic value of CA20, a score based on centrosome amplificationassociated genes, in breast tumors. Sci. Rep. 2017, 7, 1–11. [Google Scholar] [CrossRef]
- De Almeida, B.P.; Vieira, A.F.; Paredes, J.; Bettencourt-Dias, M.; Barbosa-Morais, N.L. Pan-cancer association of a centrosome amplification gene expression signature with genomic alterations and clinical outcome. PLoS Comput. Biol. 2019, 15, e1006832. [Google Scholar] [CrossRef] [PubMed]
- Knudsen, E.S.; Nambiar, R.; Rosario, S.R.; Smiraglia, D.J.; Goodrich, D.W.; Witkiewicz, A.K. Pan-cancer molecular analysis of the RB tumor suppressor pathway. Commun. Biol. 2020, 3, 1–12. [Google Scholar] [CrossRef] [PubMed]
- Donehower, L.A.; Soussi, T.; Korkut, A.; Liu, Y.; Schultz, A.; Cardenas, M.; Li, X.; Babur, O.; Hsu, T.K.; Lichtarge, O.; et al. Integrated Analysis of TP53 Gene and Pathway Alterations in The Cancer Genome Atlas. Cell Rep. 2019, 28, 1370–1384. [Google Scholar] [CrossRef] [PubMed]
- Bertucci, F.; Finetti, P.; Cervera, N.; Charafe-Jauffret, E.; Buttarelli, M.; Jacquemier, J.; Chaffanet, M.; Maraninchi, D.; Viens, P.; Birnbaum, D. How different are luminal A and basal breast cancers? Int. J. Cancer 2009, 124, 1338–1348. [Google Scholar] [CrossRef] [PubMed]
- Jögi, A.; Vaapil, M.; Johansson, M.; Påhlman, S. Cancer cell differentiation heterogeneity and aggressive behavior in solid tumors. Ups. J. Med. Sci. 2012, 117, 217–224. [Google Scholar] [CrossRef] [PubMed]
- Ben-Porath, I.; Thomson, M.W.; Carey, V.J.; Ge, R.; Bell, G.W.; Regev, A.; Weinberg, R.A. An embryonic stem cell-like gene expression signature in poorly differentiated aggressive human tumors. Nat. Genet. 2008, 40, 499–507. [Google Scholar] [CrossRef]
- Ramaker, R.C.; Lasseigne, B.N.; Hardigan, A.A.; Palacio, L.; Gunther, D.S.; Myers, R.M.; Cooper, S.J. RNA sequencing-based cell proliferation analysis across 19 cancers identifies a subset of proliferation-informative cancers with a common survival signature. Oncotarget 2017, 8, 38668–38681. [Google Scholar] [CrossRef]
- Whitfield, M.L.; George, L.K.; Grant, G.D.; Perou, C.M. Common markers of proliferation. Nat. Rev. Cancer 2006, 6, 99–106. [Google Scholar] [CrossRef]
- Ko, K.; Jeong, C.W.; Kwak, C.; Kim, H.H.; Ku, J.H. Significance of Ki-67 in non-muscle invasive bladder cancer patients: A systematic review and meta-analysis. Oncotarget 2017, 8, 100614–100630. [Google Scholar] [CrossRef]
- Pan, D.; Wei, K.; Ling, Y.; Su, S.; Zhu, M.; Chen, G. The prognostic role of Ki-67/MIB-1 in cervical cancer: A systematic review with meta-analysis. Med. Sci. Monit. 2015, 21, 882–889. [Google Scholar] [CrossRef]
- Chen, M.; Yao, S.; Cao, Q.; Xia, M.; Liu, J.; He, M. The prognostic value of Ki67 in ovarian high-grade serous carcinoma: An 11-year cohort study of Chinese patients. Oncotarget 2017, 8, 107877–107885. [Google Scholar] [CrossRef] [PubMed]
- Janky, R.; Verfaillie, A.; Imrichová, H.; van de Sande, B.; Standaert, L.; Christiaens, V.; Hulselmans, G.; Herten, K.; Naval Sanchez, M.; Potier, D.; et al. iRegulon: From a Gene List to a Gene Regulatory Network Using Large Motif and Track Collections. PLoS Comput. Biol. 2014, 10, e1003731. [Google Scholar] [CrossRef] [PubMed]
- Engelmann, D.; Pützer, B.M. The dark side of E2F1: In transit beyond apoptosis. Cancer Res. 2012, 72, 571–575. [Google Scholar] [CrossRef] [PubMed]
- Bertino, J.R.; Banerjee, D. E2F-1 as an anticancer drug target. Oncol. Rev. 2009, 3, 207–214. [Google Scholar] [CrossRef]
- Banerjee, D.; Schnieders, B.; Fu, J.Z.; Adhikari, D.; Zhao, S.-C.; Bertino, J.R. Role of E2F-1 in Chemosensitivity. Cancer Res. 1998, 58, 4292–4296. [Google Scholar]
- Rouaud, F.; Hamouda-Tekaya, N.; Cerezo, M.; Abbe, P.; Zangari, J.; Hofman, V.; Ohanna, M.; Mograbi, B.; El-Hachem, N.; Benfodda, Z.; et al. E2F1 inhibition mediates cell death of metastatic melanoma article. Cell Death Dis. 2018, 9, 1–12. [Google Scholar] [CrossRef]
- Farra, R.; Dapas, B.; Grassi, M.; Benedetti, F.; Grassi, G. E2F1 as a molecular drug target in ovarian cancer. Expert Opin. Ther. Targets 2019, 23, 161–164. [Google Scholar] [CrossRef]
- Millour, J.; De Olano, N.; Horimoto, Y.; Monteiro, L.J.; Langer, J.K.; Aligue, R.; Hajji, N.; Lam, E.W.F. ATM and p53 regulate FOXM1 expression via E2F in breast cancer epirubicin treatment and resistance. Mol. Cancer Ther. 2011, 10, 1046–1058. [Google Scholar] [CrossRef]
- Fang, Z.; Lin, M.; Li, C.; Liu, H.; Gong, C. A comprehensive review of the roles of E2F1 in colon cancer. Am. J. Cancer Res. 2020, 10, 757–768. [Google Scholar]
- Liao, G.B.; Li, X.Z.; Zeng, S.; Liu, C.; Yang, S.M.; Yang, L.; Hu, C.J.; Bai, J.Y. Regulation of the master regulator FOXM1 in cancer. Cell Commun. Signal. 2018, 16, 1–15. [Google Scholar] [CrossRef]
- Bergamaschi, A.; Madak-Erdogan, Z.; Kim, Y.J.; Choi, Y.L.; Lu, H.; Katzenellenbogen, B.S. The forkhead transcription factor FOXM1 promotes endocrine resistance and invasiveness in estrogen receptor-positive breast cancer by expansion of stem-like cancer cells. Breast Cancer Res. 2014, 16, 436. [Google Scholar] [CrossRef] [PubMed]
- Ziegler, Y.; Laws, M.J.; Sanabria Guillen, V.; Kim, S.H.; Dey, P.; Smith, B.P.; Gong, P.; Bindman, N.; Zhao, Y.; Carlson, K.; et al. Suppression of FOXM1 activities and breast cancer growth in vitro and in vivo by a new class of compounds. npj Breast Cancer 2019, 5, 1–11. [Google Scholar] [CrossRef] [PubMed]
- Borhani, S.; Gartel, A.L. FOXM1: A potential therapeutic target in human solid cancers. Expert Opin. Ther. Targets 2020, 24, 205–217. [Google Scholar] [CrossRef] [PubMed]
- Gu, C.; Yang, Y.; Sompallae, R.; Xu, H.; Tompkins, V.S.; Holman, C.; Hose, D.; Goldschmidt, H.; Tricot, G.; Zhan, F.; et al. FOXM1 is a therapeutic target for high-risk multiple myeloma. Leukemia 2016, 30, 873–882. [Google Scholar] [CrossRef] [PubMed]
- Yoo, M.; Shin, J.; Kim, J.; Ryall, K.A.; Lee, K.; Lee, S.; Jeon, M.; Kang, J.; Tan, A.C. DSigDB: Drug signatures database for gene set analysis. Bioinformatics 2015, 31, 3069–3071. [Google Scholar] [CrossRef]
- Kuleshov, M.V.; Jones, M.R.; Rouillard, A.D.; Fernandez, N.F.; Duan, Q.; Wang, Z.; Koplev, S.; Jenkins, S.L.; Jagodnik, K.M.; Lachmann, A.; et al. Enrichr: A comprehensive gene set enrichment analysis web server 2016 update. Nucleic Acids Res. 2016, 44, W90–W97. [Google Scholar] [CrossRef]
- Baldwin, E.; Osheroff, N. Etoposide, Topoisomerase II and Cancer. Curr. Med. Chem. Agents 2005, 5, 363–372. [Google Scholar] [CrossRef]
- Teulings, H.E.; Tjin, E.P.M.; Willemsen, K.J.; van der Kleij, S.; ter Meulen, S.; Kemp, E.H.; Krebbers, G.; van Noesel, C.J.M.; Franken, C.L.M.C.; Drijfhout, J.W.; et al. Anti-Melanoma immunity and local regression of cutaneous metastases in melanoma patients treated with monobenzone and imiquimod; a phase 2 a trial. Oncoimmunology 2018, 7, e1419113. [Google Scholar] [CrossRef]
- Price, T.; Burge, M.; Chantrill, L.; Gibbs, P.; Pavlakis, N.; Shapiro, J.; Sjoquist, K. Trifluridine/tipiracil: A practical guide to its use in the management of refractory metastatic colorectal cancer in Australia. Asia. Pac. J. Clin. Oncol. 2020, 16, 3–12. [Google Scholar] [CrossRef]
- Sztiller-Sikorska, M.; Czyz, M. Parthenolide as cooperating agent for anti-cancer treatment of various malignancies. Pharmaceuticals 2020, 13, 194. [Google Scholar] [CrossRef]
- Luo, Q.; Zhang, L.; Luo, C.; Jiang, M. Emerging strategies in cancer therapy combining chemotherapy with immunotherapy. Cancer Lett. 2019, 454, 191–203. [Google Scholar] [CrossRef] [PubMed]
- Bruni, D.; Angell, H.K.; Galon, J. The immune contexture and Immunoscore in cancer prognosis and therapeutic efficacy. Nat. Rev. Cancer 2020, 20, 662–680. [Google Scholar] [CrossRef] [PubMed]
- Shang, B.; Liu, Y.; Jiang, S.J.; Liu, Y. Prognostic value of tumor-infiltrating FoxP3+ regulatory T cells in cancers: A systematic review and meta-analysis. Sci. Rep. 2015, 5. [Google Scholar] [CrossRef] [PubMed]
- Pabla, S.; Conroy, J.M.; Nesline, M.K.; Glenn, S.T.; Papanicolau-Sengos, A.; Burgher, B.; Hagen, J.; Giamo, V.; Andreas, J.; Lenzo, F.L.; et al. Proliferative potential and resistance to immune checkpoint blockade in lung cancer patients. J. Immunother. Cancer 2019, 7, 27. [Google Scholar] [CrossRef] [PubMed]
- Murciano-Goroff, Y.R.; Warner, A.B.; Wolchok, J.D. The future of cancer immunotherapy: Microenvironment-targeting combinations. Cell Res. 2020, 30, 507–519. [Google Scholar] [CrossRef] [PubMed]


Publisher’s Note: MDPI stays neutral with regard to jurisdictional claims in published maps and institutional affiliations. |
© 2020 by the authors. Licensee MDPI, Basel, Switzerland. This article is an open access article distributed under the terms and conditions of the Creative Commons Attribution (CC BY) license (http://creativecommons.org/licenses/by/4.0/).
Share and Cite
Rocha, D.; García, I.A.; González Montoro, A.; Llera, A.; Prato, L.; Girotti, M.R.; Soria, G.; Fernández, E.A. Pan-Cancer Molecular Patterns and Biological Implications Associated with a Tumor-Specific Molecular Signature. Cells 2021, 10, 45. https://doi.org/10.3390/cells10010045
Rocha D, García IA, González Montoro A, Llera A, Prato L, Girotti MR, Soria G, Fernández EA. Pan-Cancer Molecular Patterns and Biological Implications Associated with a Tumor-Specific Molecular Signature. Cells. 2021; 10(1):45. https://doi.org/10.3390/cells10010045
Chicago/Turabian StyleRocha, Darío, Iris A. García, Aldana González Montoro, Andrea Llera, Laura Prato, María R. Girotti, Gastón Soria, and Elmer A. Fernández. 2021. "Pan-Cancer Molecular Patterns and Biological Implications Associated with a Tumor-Specific Molecular Signature" Cells 10, no. 1: 45. https://doi.org/10.3390/cells10010045
APA StyleRocha, D., García, I. A., González Montoro, A., Llera, A., Prato, L., Girotti, M. R., Soria, G., & Fernández, E. A. (2021). Pan-Cancer Molecular Patterns and Biological Implications Associated with a Tumor-Specific Molecular Signature. Cells, 10(1), 45. https://doi.org/10.3390/cells10010045