Article

Effect of Salinity Stress and Microbial Inoculations on Glomalin Production and Plant Growth Parameters of Snap Bean (Phaseolus vulgaris)

by
Claudia Lyl Garcia
,
Sanku Dattamudi
*,
Saoli Chanda
and
Krishnaswamy Jayachandran
Department of Earth and Environment, Florida International University, Miami, FL 33199, USA
*
Author to whom correspondence should be addressed.
Agronomy 2019, 9(9), 545; https://doi.org/10.3390/agronomy9090545
Submission received: 9 August 2019 / Revised: 4 September 2019 / Accepted: 9 September 2019 / Published: 12 September 2019
(This article belongs to the Special Issue Rhizobium–Legume Symbiosis)

Abstract

:
Salinity is a major abiotic stress that can adversely affect plant growth, yield, other physiological parameters, and soil health. Salinity stress on biomass production of salt-sensitive crops, like snap bean (Phaseolus vulgaris), is a serious problem, and specifically in South Florida, USA, where saline soils can be found in major agricultural lands. Research studies focused on the ‘snap bean–Rhizobium–arbuscular mycorrhizal fungi (AMF)’ relationship under salinity stress are limited, and fewer studies have evaluated how this tripartite symbiosis affects glomalin production (GRSP), a glycoprotein released by AMF. A shade house experiment was conducted to elucidate the effects of three microbial inoculations (IC = inoculation control; IT1 = AMF and IT2 = AMF + Rhizobium) on three salinity treatments (SC = salinity control 0.6 dS m−1, S1 = 1.0 dS m−1, and S2 = 2.0 dS m−1) on snap bean growth and yield. Our results indicate that S2 reduced 20% bean biomass production, 11% plant height, 13% root weight, and 23% AMF root colonization. However, microbial inoculations increased 26% bean yield over different salinity treatments. Maximum salinity stress (S2) increased 6% and 18% GRSP production than S1 and SC, respectively, indicating the relative advantage of abiotic stress on AMF’s role in soil. Dual inoculation (IT2) demonstrated a beneficial role on all physiological parameters, biomass production, and GRSP synthesis compared to single inoculation (IT1) treatment with all three salinity levels.

Graphical Abstract

1. Introduction

Salinization is one of the major environmental stresses that negatively impacts agricultural productivity on a global scale, accounting for 1.5 million ha agricultural land loss every year [1]. Salt-affected soils are widespread and are estimated to be distributed across 1 billion ha worldwide, affecting more than 100 countries [2]. In addition to that, secondary salinization, i.e., development of salinity due to human intervention, also affects 76 million ha of land area [1] worldwide. Ground water aquifers near coastal regions that are trapped under a permeable layer of rocks are susceptible to saltwater intrusion and degradation of water quality for agricultural use [3,4,5]. Typically, in South Florida, USA, sea level rise [6], saltwater intrusion, and high evaporation [7] results in high saline conditions, i.e., 40 to 60 PSU (practical salinity unit; g kg−1) [8], in the bay and agricultural area.
Soil salinity causes a broad range of molecular, biochemical, and physiological changes in plants [9,10], including plant toxicity [11], and reduced plant growth and yield [12]. Porcel et al. [13] reported that salinity stress can decrease crop production for more than 20% of irrigated lands in the world. High soil salinity in Florida decreases the availability of K+ and Mg2+ in the soil, which can subsequently cause plant wilting and create nutritional problems during crop production [14].
Snap bean or common bean (Phaseolus vulgaris) is considered as a salt-sensitive crop (glycophytes), with a threshold salinity level of 1 dS m−1 [15]. Snap bean is one of the Florida’s most commercially important vegetable crops, planted across more than 28,200 acres, and generating a commercial value of $105.6 million in 2016 [16]. The majority of snap bean production in Florida is in Palm Beach and Miami-Dade County, where the source of water is from the highly permeable Biscayne aquifer [17]. Therefore, special land management strategies may be needed for the production of snap bean in the saline soils of Florida.
Numerous cultivation practices, including the planting of salt-tolerant varieties [18], have been adopted to sustain crop growth and biomass productions in saline conditions [11]. However, recently, the approach of soil microbial inoculation to ameliorate salinity stress in plants [19] has gained more attention. Microbial inoculants, such as arbuscular mycorrhizal fungi (AMF) and Rhizobium, have been previously studied as they are ubiquitous in soil and provide a low-cost natural means of improving nutrient acquisition in stressed soil under adverse environmental conditions [20,21,22,23]. Specifically, soil inoculation with AMF and Rhizobium can potentially reduce environmental pollution by lowering the application of synthetic fertilizers in the soil [24,25]. Some rhizobia species (Rhizobium leguminosarum and Rhizobium japonicum) have been found to be tolerant to osmotic stress, while soil salinity has shown to inhibit the legume–rhizobia symbiosis for certain salt-sensitive species, reducing nodulation and thereby lowering nitrogen content and plant productivity [26]. However, it is generally understood that Rhizobium tend to be more salt-tolerant than their host plant [27]. Inoculating legumes with Rhizobium either directly (i.e., soil inoculation) or indirectly (i.e., seed inoculation) provides certain benefits [28], such as an increase in nodulation and biological nitrogen fixation [29]. Similarly, AMF symbiosis provides benefits to soil, including nutrient cycling [11], soil quality, tolerance to abiotic stresses [30], increasing photosynthetic rate [13], and production of glomalin (glycoprotein). Glomalin- or glomalin-related soil protein (GRSP), produced in the soil as an extracellular secretion of AMF, has been shown to increase soil aggregate stability, soil water potential, reduce heavy metal contamination, and an overall increase in crop yield [31,32,33].
Therefore, the objective of this study was to understand microbial inoculations on soil health and crop productions under various salinity treatments. Our sub-objectives were (1) to determine the effect of single (AMF) and dual (AMF + Rhizobium) inoculations on snap bean physiology, chlorophyll content, and biomass production, and (2) evaluate these microbial inoculations and salinity treatments on GRSP production in soil.

2. Materials and Methods

2.1. Site Description and Experimental Layout

The experiment was conducted at the Organic Garden shade house (25°45’15.10” N and 80°22’48.09” W) located near the nature preserve at Florida International University (FIU) MMC, Miami, FL, USA. Snap bean (Phaseolus vulgaris Caprice Bush) were grown in two-gallon nursery pots spaced 0.5 m × 0.5 m apart from each other. Both salinity (control 0.6 dS m−1, 1 dS m−1, and 2 dS m−1) and inoculation (control, AMF, and Rhizobium + AMF) treatments had three different levels, which resulted in a total of 9 treatment combinations. The treatments were arranged as a 3 × 3 factorial in a completely randomized block design (RCBD) with 10 replications. Details of the experimental layout are presented in Figure 1.

2.2. Planting Schemes and Data Collection

Planting of snap beans were done in 2-gallon (7.57 L) pots filled with un-sterilized soil along with two tablespoons of Root Naturally Endo Mycorrhizae (RNEM). The mycorrhizal inoculant contained a mixture of various AMF species (Glomus intraradices, Glomus mosseae, Glomus aggregatum, and Glomus etunicatum), which placed two inches below the soil surface (a modified method from [22,34]. Root Naturally Endo Mycorrhizae was applied only to treatments that contained AMF inoculation (i.e., IT1SC, IT2SC, IT1S1, IT2S1, IT1S2, and IT2S2). Snap bean seeds were soaked in non-chlorinated water before being inoculated with GUARD-N Rhizobium seed inoculant for treatments IT2SC, IT2S1, and IT2S2. GUARD-N Rhizobium seed inoculant had a mixture of the following species: Bradyrhizobium sp. (Vigna), Bradyrhizobium japonicum, Rhizobium leguminosarum biovar phaseoli, and Rhizobium leguminosarum biovar viceae.
After inoculation, seeds were left to dry for three minutes prior to immediate seeding in the pots. Four seeds per pot were placed 5 to 10 cm apart one inch deep within the soil. After emergence, seedlings were thinned to one per pot. At the initial phase of the experiment, experimental pots were irrigated with water from the Organic Garden (0.6 dS m−1) every two days at 25% of the soil water holding capacity. To provide additional nutrients, 11 mL of Hoagland’s solution at half strength without ammonium phosphate were prepared [22] and added to each pot once a week.
Salinity treatments began 26 days after planting (DAP) to allow AMF root colonization establishment. After 26 DAP, beans were irrigated following the protocol from Hamoui et al. [35] with modification. Plants were watered with 200 mL of the corresponding salinity treatment (SC, S1, or S2) three times a week during the growth period. Saline treatment water was prepared by mixing water from the Organic Garden and sodium chloride (NaCl, 0.6, 1.0, and 2.0 dS m−1) in buckets until targeted electrical conductivity (EC) values were obtained. Leaf miners were observed on the plants during the active growth stage. Neem oil was sprayed one time to minimize any damage caused by leaf miners.

2.3. Plant Height, Leaf Chlorophyll Content and Bean Yield

In order to assess the effect of dual inoculation and salinity stress, plant height (cm) and overall crop growth were recorded following protocol from Scholberg and Locascio [34] with modification. Plant height was measured every two weeks after planting for a total of four measurements. Average leaf chlorophyll content of the developed upper leaves was determined using the Soil-Plant Analyses Development (SPAD) 502 Plus Chlorophyll Meter every two weeks for eight weeks. Leaf chlorophyll content is one of the indicators of crop health [36]. In general, leaf chlorophyll and nitrogen content exhibit a positive correlation [37]. Total fresh bean yield was calculated by weighing harvested beans from the plants at the end of the experiment [34].

2.4. Shoot and Root Dry Biomass

Fresh shoot and root samples were collected at the end of the experiment (58 DAP) following Scholberg and Locascio’s [34] protocol. Shoot samples (both stem and leaves) were taken from the first node up. Roots were carefully washed to remove soil particles, and all samples were stored at 4 °C until further analysis. All samples were dried at 72 °C for 3 days to estimate shoot and root dry biomass.

2.5. Estimation of AMF (Arbuscular Mycorrhizal Fungi) Root Colonization

Quantification of AMF percent root colonization was conducted by following the protocol from McGonigle et al. [38] with some modification. After completion of the bean growth period, roots were washed in order to remove any remaining soil particles. Thin roots were separated from fresh root biomass and placed in micro-centrifuge tubes filled with 10% potassium hydroxide solution (KOH). KOH filled root samples were placed in an oven at 70 °C for two hours before they were rinsed with deionized (DI) water. After rinsing, samples were submerged in alkaline H2O2 for 30 min before being rinsed with DI water. Root samples were immersed in 1% hydrochloric acid (HCl) for 30 min and rinsed with DI water. Trypan blue (0.05%) with lactoglycerol was added and heated at 70 °C for 20 min. Twenty root segments of each sample were placed on a microscopic slide containing a drop of glycerol solution (100 mL glycerol and 100 mL lactic acid) and observed under a compound microscope. Root segments were classified as either colonized when non-septate hyphae or vesicles were present, or clear roots by the absence of those AMF structures. To calculate the percentage of AMF root colonization, the following formula was used:
N u m b e r   o f   C o l o n i z e d   R o o t s T o t a l   n u m b e r   o f   R o o t s   × 100 % .

2.6. Glomalin-Related Soil Protein (GRSP) Extraction

To extract glomalin-related soil protein (GRSP), soil samples from 5 replicates of each treatment (e.g., ICSC 1, 4, 7, 8, and 10) were randomly selected, dried at 50 °C for 24 h, and sieved (2.0 mm) prior to protein extraction following the protocol from Wright and Upadhyaya [39] with modification [40]. Easily extractable GRSP (EEG) was extracted from 0.5-g soil samples by adding 4 mL of 20 mmol L−1 sodium citrate (pH 7.0) solution followed by autoclaving at 121 °C for 30 min. Total glomalin-related soil protein (TG) was extracted by adding 4 mL of 50 mmol L−1 sodium citrate (pH 8.0) solution to 0.1 g of soil prior to autoclaving at 121 °C for 60 min. For both EEG and TG, the supernatant was collected by centrifuging at 3000 to 4000 G for 12 min, and stored at 4 °C. For TG, the procedure was repeated eight times, and the supernatant from each cycle was pooled until a reddish-brown color attributed to GRSP disappearance and the coloring became transparent.
The protein concentration within the supernatant was determined by a Thermo Scientific Pierce™ Coomassie Plus Bradford Assay Kit with the bovine serum albumin (BSA) used as standard. Microplate columns were arranged and filled with 5-μL blank samples (sodium citrate 20 or 50 mmol), 5-μL sample solutions (i.e., ICSC 1, 4, 7, etc.), and 5-μL standard solution. Once prepared, 250 μL of Coomassie Plus Reagent were dispensed into all plate wells and incubated for 10 min before the protein absorbance was measured at 595 nm.

2.7. Statistical Analyses

Data analysis was performed using SAS 9.4 [41]. The statistical analysis performed was two-way ANOVA due to the 3 × 3 factorial design, and its two levels (i.e., inoculation type and salinity content). Plant height, biomass, and chlorophyll content from three inoculant and salinity treatments were analyzed for significant differences in plant growth. Easily extractable and total glomalin content were compared between different inoculation and salinity treatments for significant differences in GRSP production. Data was significant when p < 0.05.

3. Results and Discussion

3.1. Effect of Salinity and Microbial Inoculations on Soil and Plant Parameters

The effects of salinity level and inoculation types on soil pH, plant height, bean yield, and the root and shoot weights of snap bean are presented in Table 1. Overall, soil pH was not significantly (p > 0.05) influenced by salinity levels or inoculations. However, soils with the highest salinity level (S2) had numerically (about 5–7%) higher pH than soils with background salinity (control, 0.6 dS m−1). This is mainly because salinity through the NaCl solution may have released basic Na+ ions and subsequently increased the soil pH within a short duration (eight weeks of the study). In a similar study conducted in Italy, soil pH values were slightly increased by different salinity treatments on snap bean (Phaseolus vulgaris) productions [42].
The average value of plant height at eight weeks were ranged from 26.48 (ICSC) to 33.80 (IT2S2) cm, where the level three inoculation (IT2) and salinity (S2) treatment combination had a significantly higher (p < 0.05) plant height than level one inoculation (IC) and salinity (SC) treatment combinations. Individual effects of microbial inoculation and salinity treatments on plant height were insignificant; however, non-salinity (ICSC, IT1SC, and IT2SC) treatments had significantly lower (p < 0.05) plant heights than high saline treatments with inoculation (IT1S2, IT2S2). These results indicate that even under high abiotic stress (EC of 2.0 dS m−1), microbial inoculation play a beneficial role in increasing plant height, and subsequently in increasing biomass production. In a similar study, Selvakumar et al. [43] found that microbial inoculation in soils significantly increased fruit numbers and red pepper (Capsicum annuum L.) yield. However, the lower plant height of non-stressed snap beans possibly resulted from the lack of sufficient sunlight (due to obstruction from a construction near the shade house) during the initial phase of the experiment. On average, the maximum salinity stress (2.0 dS m−1) produced an 11% lower plant height and 20% lower bean yield as compared to control treatments. Similar results were obtained by Hasamuzzaman et al. [44], where salinity stress reduced 7% to 11% of the rice paddy height, depending on the cultivars. A reduced bean yield was observed at the threshold salinity level (1.0 dS m−1), which was similar to a study reported by Almeida et al. [45], where bean yield reduction was observed at the 1.5 dS m−1 salinity level.
Plant height was increased by 14% through dual inoculation compared to the control at a salinity of 2 dS m−1, suggesting that dual inoculation had beneficial effects on bean growth by mitigating salinity stress. Additionally, on average, treatment IT2 produced a 26% higher bean yield than treatment IT1. This could be attributed to the presence of Rhizobium, which fix atmospheric N [46], and simultaneously have the unique ability to solubilize inorganic P through rhizosphere acidification, providing available P for plant nutrition [47,48] as well. The presence of Rhizobium could also influence the root hydraulic properties of the host plant [49], and thus increase osmotic water flow in the roots and increase biomass production. An overall decrease (not significant at p > 0.05) of the bean yield and shoot weights of IT1 treatments compared to IC possibly resulted from (a) a lack of sunlight, (b) shorter study duration and (c) higher leaf miner infestation of IT1 plants during this experiment. Our results also indicate that salinity stress did not affect the shoot weight; however, it affected the root weight by 13% (when inoculation effect was not considered). These results contradicted a study by Taibi et al. [50], possibly because of dual inoculation effects (improved root hydraulic properties) and the relatively short duration of this study. Salinity stress could reduce the shoot weight by 27% to 30% and root weight by 59% to 61% for different genotypes of snap bean [50], mainly because the significant increase in the malondialdehyde (by-product of lipid peroxidation) content. Salinity stress could cause a reduction in the K+/Na+ ratio in plants, which reduces stomatal movement and other physiological modifications, such as disruption of various metabolic processes [51], and thus reduce crop yield. However, the effect of AMF in reducing soil salinity, enhancing crops’ tolerance to salinity, and increasing N contents in the soil has been reported in previous studies [30,32]. Arbuscular mycorrhizal fungi also have the capability to improve plant nutrient uptakes by spreading their hyphae in the soil beyond rhizosphere [43]. In several studies, AMF and Rhizobium inoculations have been shown to increase nutrient uptake, water availability, and biological nitrogen fixation and thereby improve crop growth and overall relief from salt stress [11,52,53].

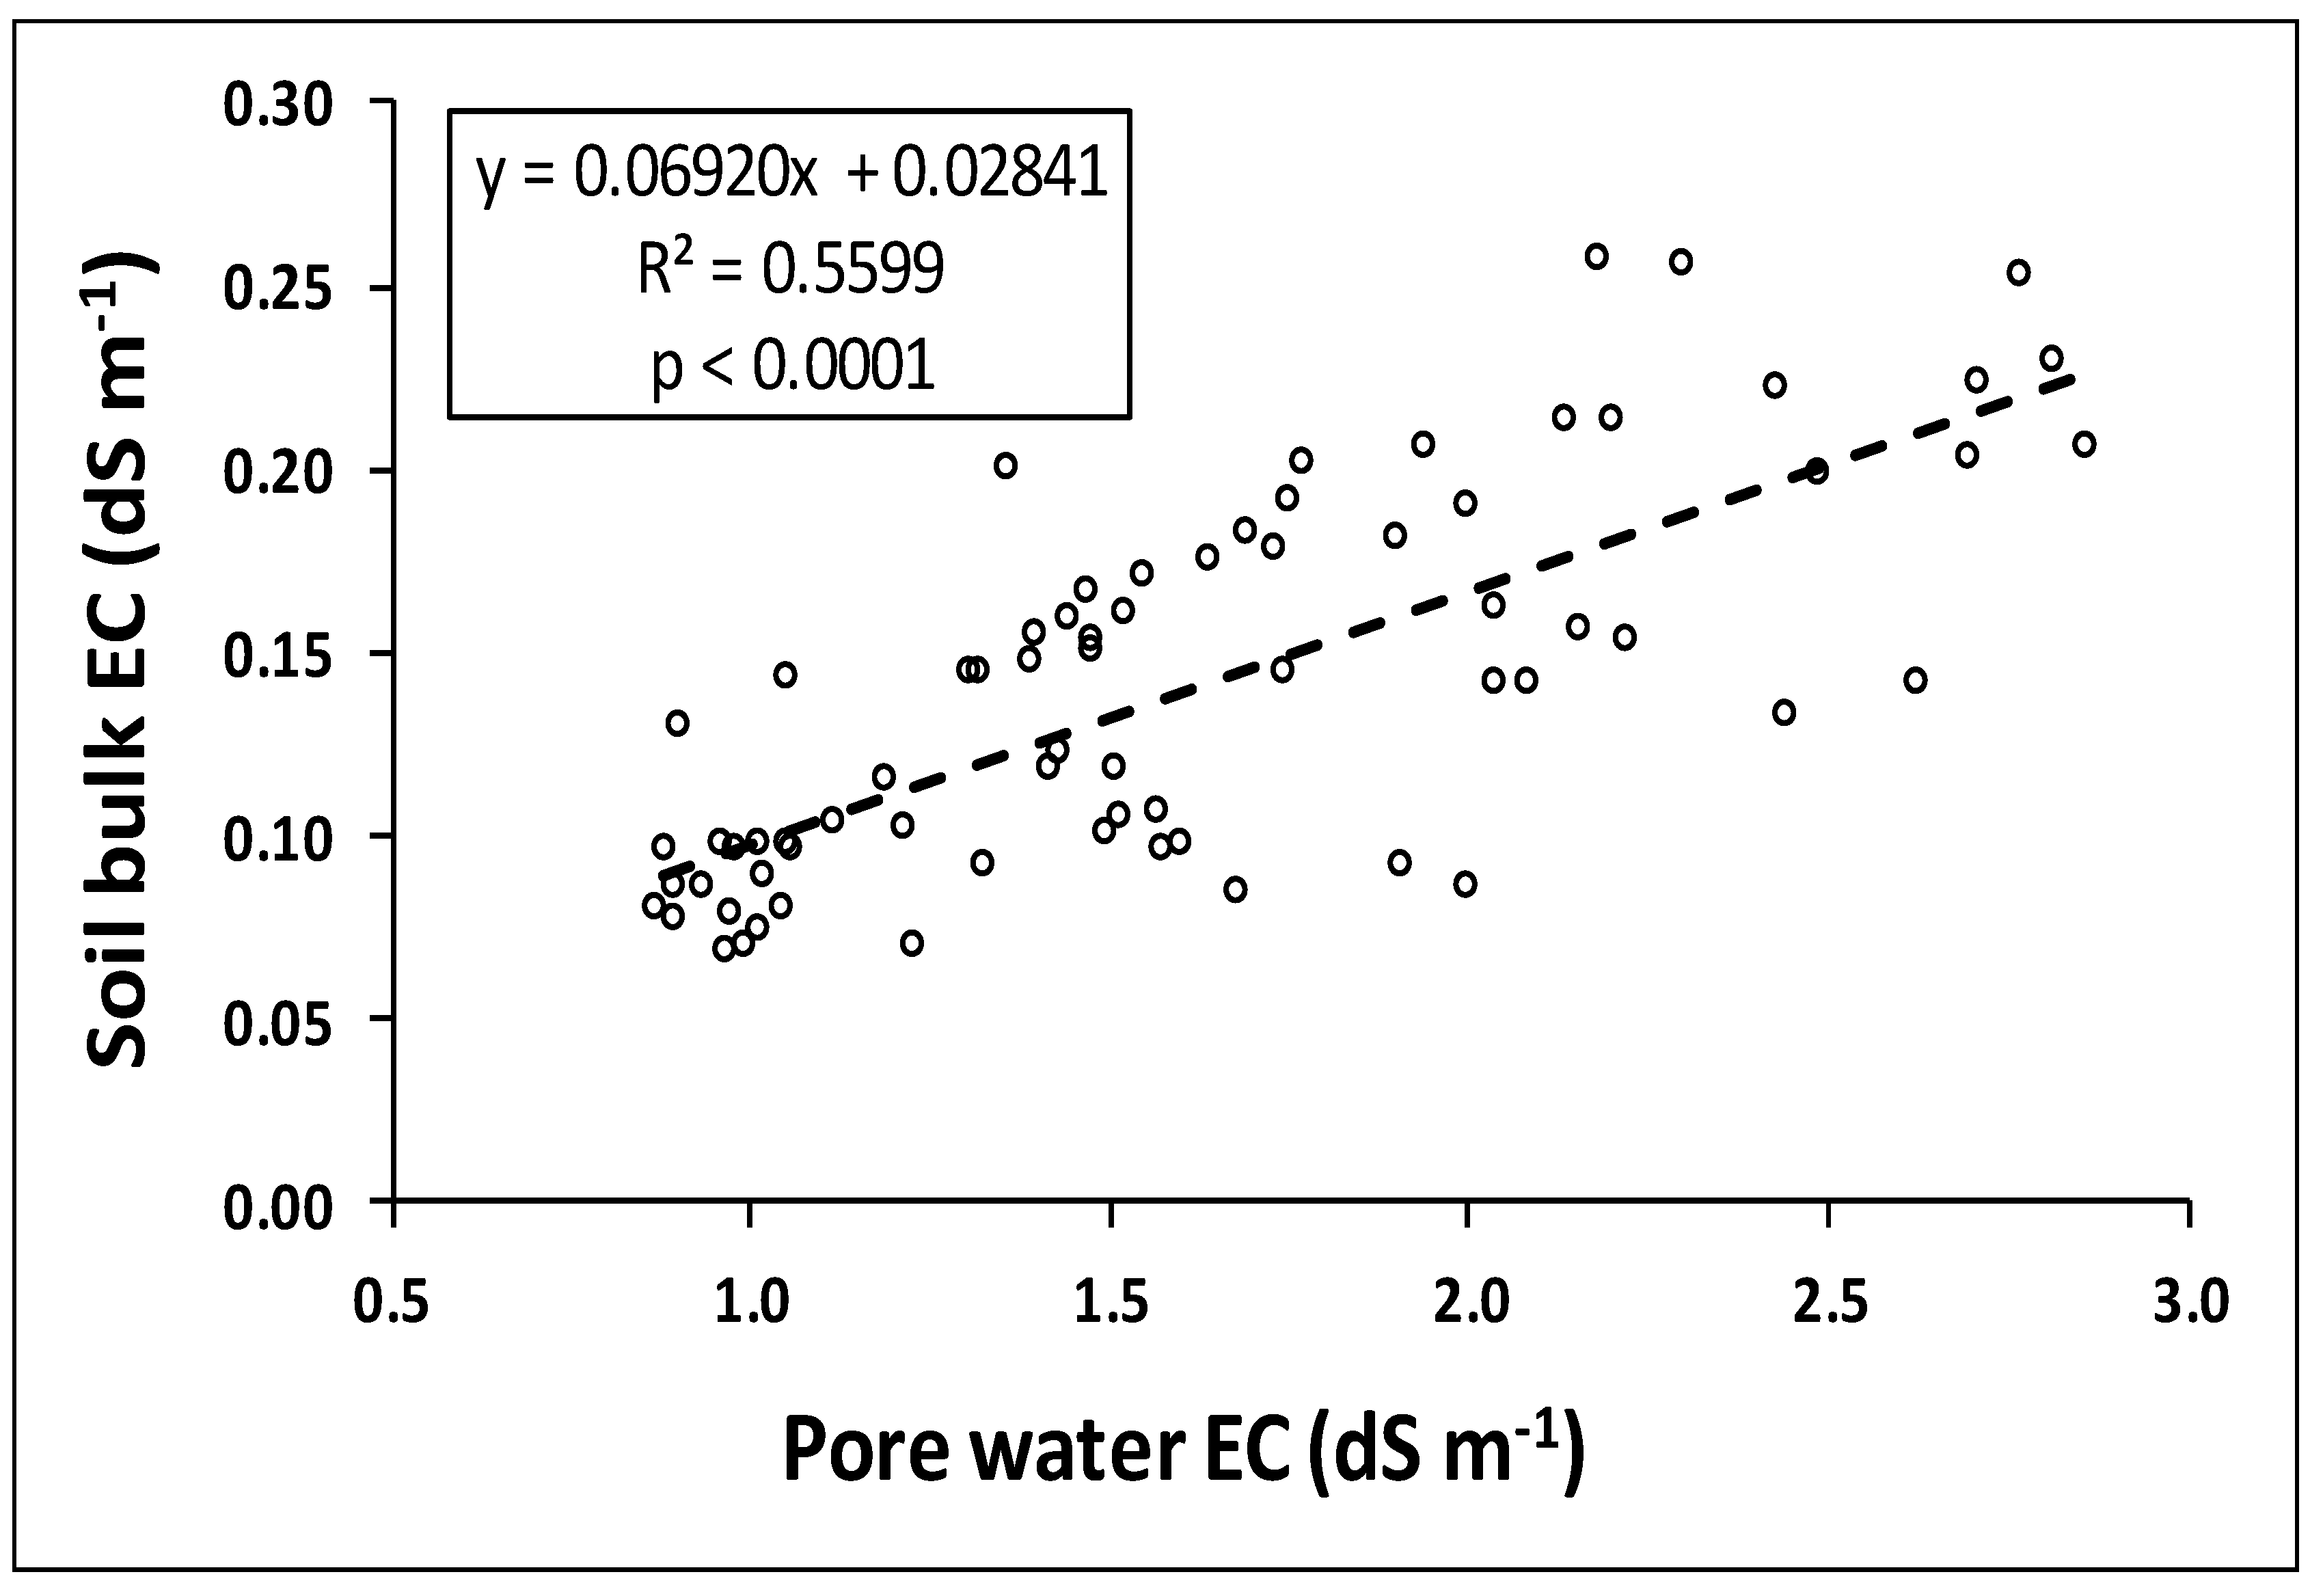
3.2. Analysis of Pore Water EC and Soil Bulk EC

The EC values of pore water and bulk soil for all nine treatments are presented in Figure 2. Plants were watered (0.6 dS m−1) on a regular basis during the first month (weeks 1–4; prior to salinity treatments). During this time, a decreasing trend of EC for both pore water and bulk soils was observed, irrespective of the treatments. This is because freshwater addition to the experimental pots leached out some of the salts from the soil matrix. However, after salinity treatments were introduced (four weeks after planting), varied responses from the treatments were observed, resulting in a widespread line graph for the second half of the experiment (Figure 2). The response was varied due to the degree of salinity and the response of inoculation treatments.
At the end of week 8, treatments with inoculation and no salinity control showed lowest pore water and soil bulk EC. It can be pointed out that even after applying saline water in the soil, pore water and bulk soil EC never reached the initial EC levels for this experiment. This is possibly because microbial inoculations had positive effects in maintaining pore water EC and in specific, dual inoculation performed better than the other treatments. The effect of microbial inoculation on mitigating salinity stress was reported in previous studies [13,19,54]. Soil bulk EC showed a similar trend as the pore water EC, where salinity control showed the least soil EC change followed by salinity treatments one and two. A regression analysis (Figure 3) of the soil bulk EC and pore water EC showed a significant (p < 0.001) relationship (R2 = 0.56), which indicates that a change in the salinity of the pore water matrix can similarly affect the soil bulk EC for this experiment.
Processes and mechanisms of salinity stress mitigation are still not understood [13]. However, few studies described a possible role, such as cyanobacteria store excess sodium extracellularly when grown in saline soil [55,56] or Na+ is compartmentalized in cotton (Gossypium hirsutum) shoots [57,58]. Arbuscular mycorrhiza either alone or inoculated with Rhizobium increased solutes in the root cells (decrease osmotic potential) and thus increased water uptake under salinity stressed conditions to maintain cellular turgidity [59].

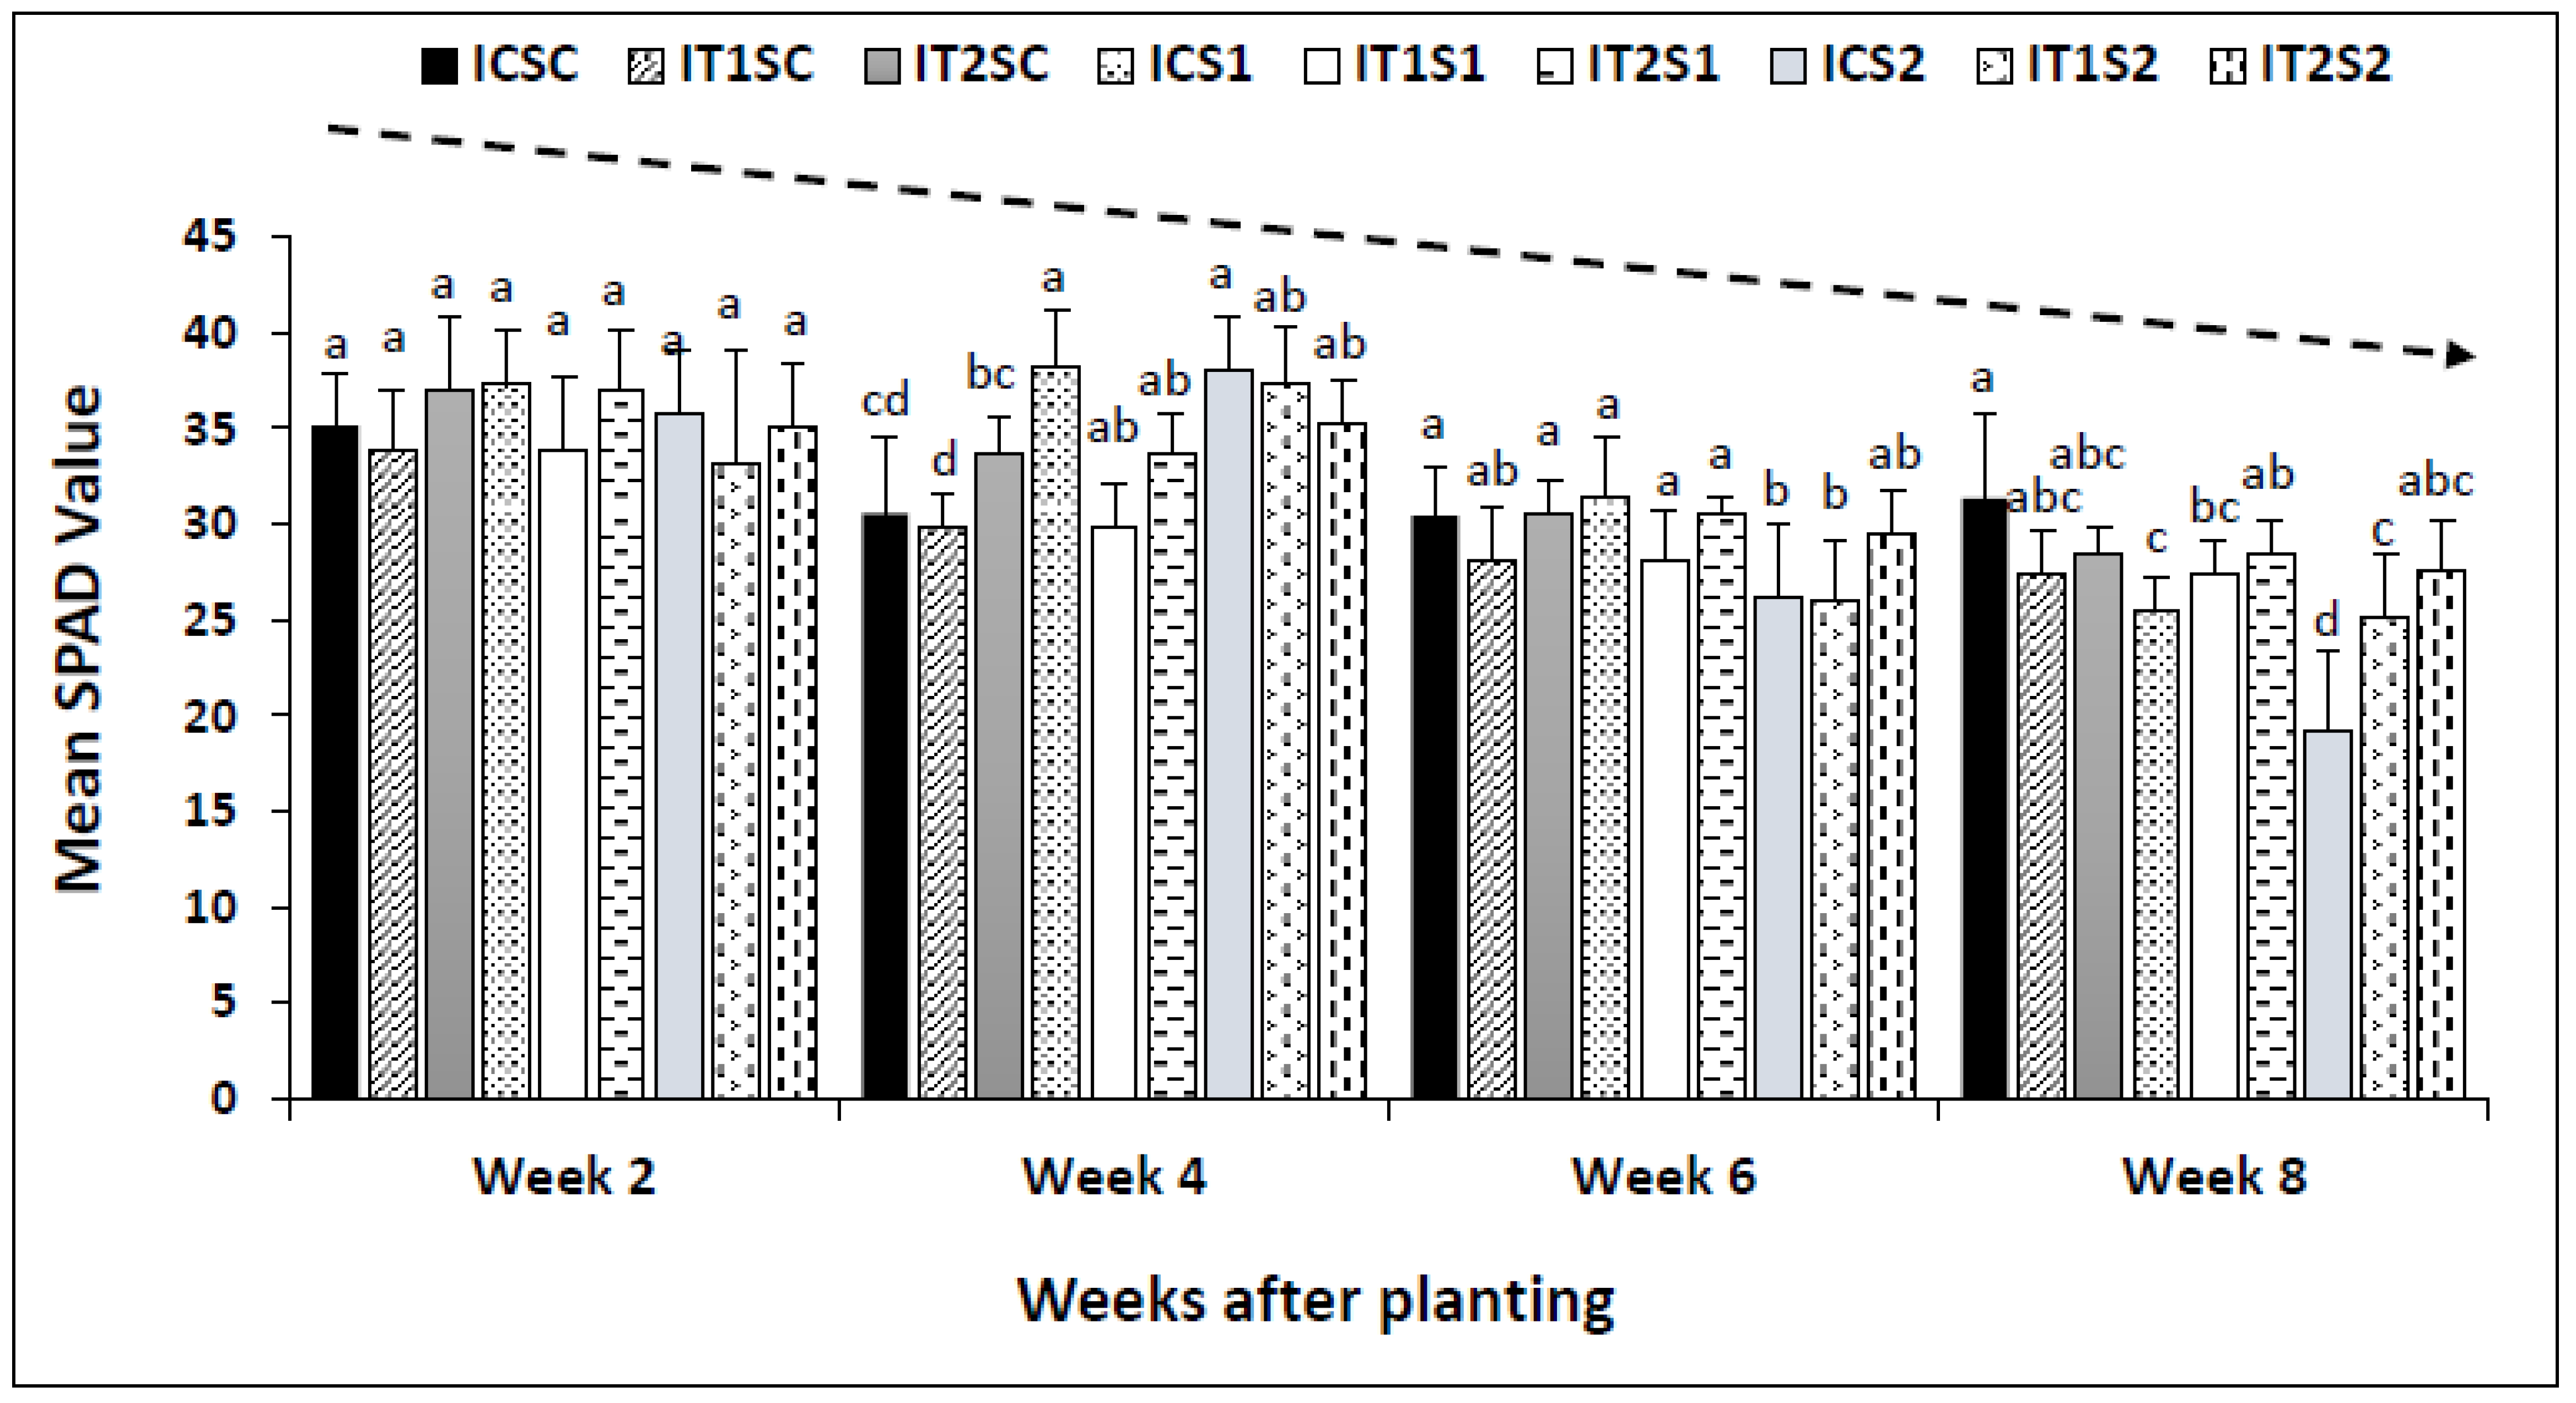
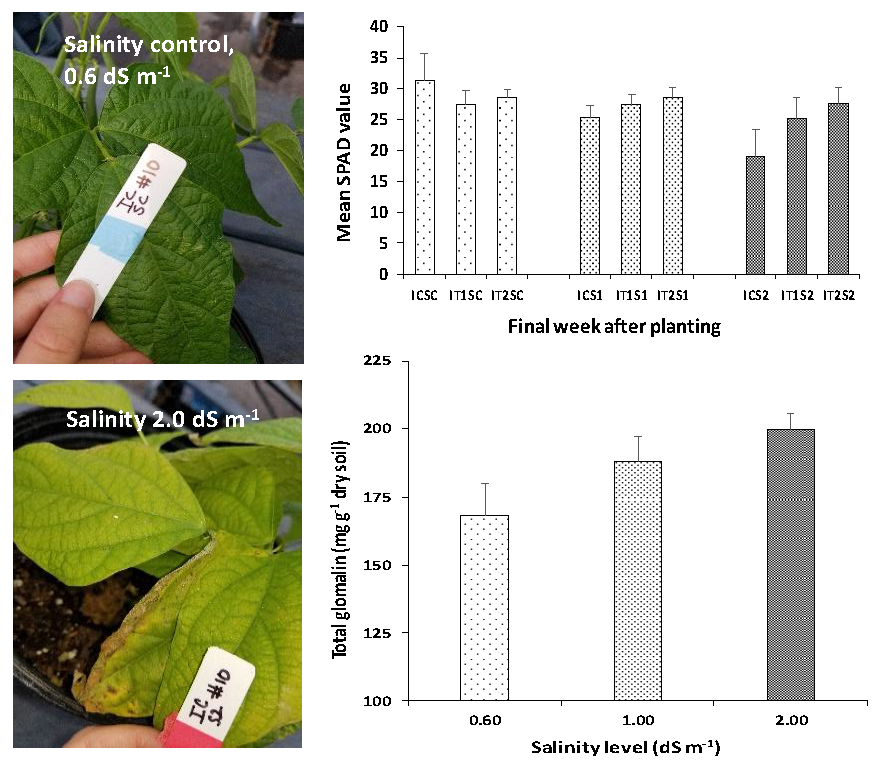
3.3. Analysis of Leaf Chlorophyll Content (SPAD Readings)

Soil plant analytical development (SPAD) values were recorded every two weeks to obtain the leaf chlorophyll content of snap bean. The effect of salinity levels and inoculation treatments on SPAD values are presented in Figure 4. Overall, mean SPAD values varied over time, however, significant differences (p < 0.05) between treatments were only observed four weeks after planting (Figure 4). The results further indicate that AMF and Rhizobium inoculation during the initial phase of the experiment did not affect the plant parameters of snap bean. However, during the final week (eight weeks after planting), significant differences between treatments were observed, specifically the effect of salinity (S1 and S2) with no inoculation (IC) resulted in the lowest SPAD values (e.g., ICS2 and ICS1 were 19.2 and 25.4, respectively).
The effect of salinity stress on leaf chlorophyll content was also visually observed during this experiment (Figure 5). The increase in salinity stress (from 0.6 to 2.0 dS m−1) resulted in leaf chlorosis and the firing of leaf margins. A yellow leaf color with firing leaf margins for almost all the plant leaves was found when treated with high saline water (2.0 dS m−1). Visual observation of plant leaves explained similar salinity effects to what we measured through SPAD meter readings. Salinity stress in plants generates reactive oxygen species (ROS), such as H2O2, as a byproduct, which subsequently causes chlorophyll degradation (both chlorophyll a and b), and reduces plant growth [50,60,61]. Gama et al. [62] observed that increasing salinity levels significantly impaired photosynthetic parameters (stomatal conductance and transpiration rate) of five snap beans cultivars. Additionally, our study indicated that even at the threshold level of salinity stress (1.0 dS m−1), plant leaves displayed moderate chlorosis (yellowish-green color) within a few weeks of saline water application (Figure 5).
During the final phase of the experiment (week 8), snap beans with the control treatment (ICSC) measured 40% higher (significant at p < 0.05) SPAD readings than the maximum salinity stress and no inoculation (ICS2). The SPAD reading of AMF inoculation alone with salinity (IT1S2) measured 20% lower (significant at p < 0.05) SPAD readings than ICSC, which suggests that single microbial inoculation alone could reduce 50% salinity stress in regard to chlorophyll content. We observed, when dual inoculation (IT2) was combined with level two salinity (S2), the SPAD reading of ICSC was 12% higher than IT2S2 (not significant at p > 0.05), which indicates the benefit of using dual microbial inoculation for healthy snap bean production. This is because Rhizobium fixes atmospheric N [49,63] in root nodules (active root nodules were found in most plants treated with Rhizobium), which compensated for a portion of the chlorophyll degradation from salt stress. Microbial inoculations are also reported to increase the chlorophyll content of plant leaves [64,65].

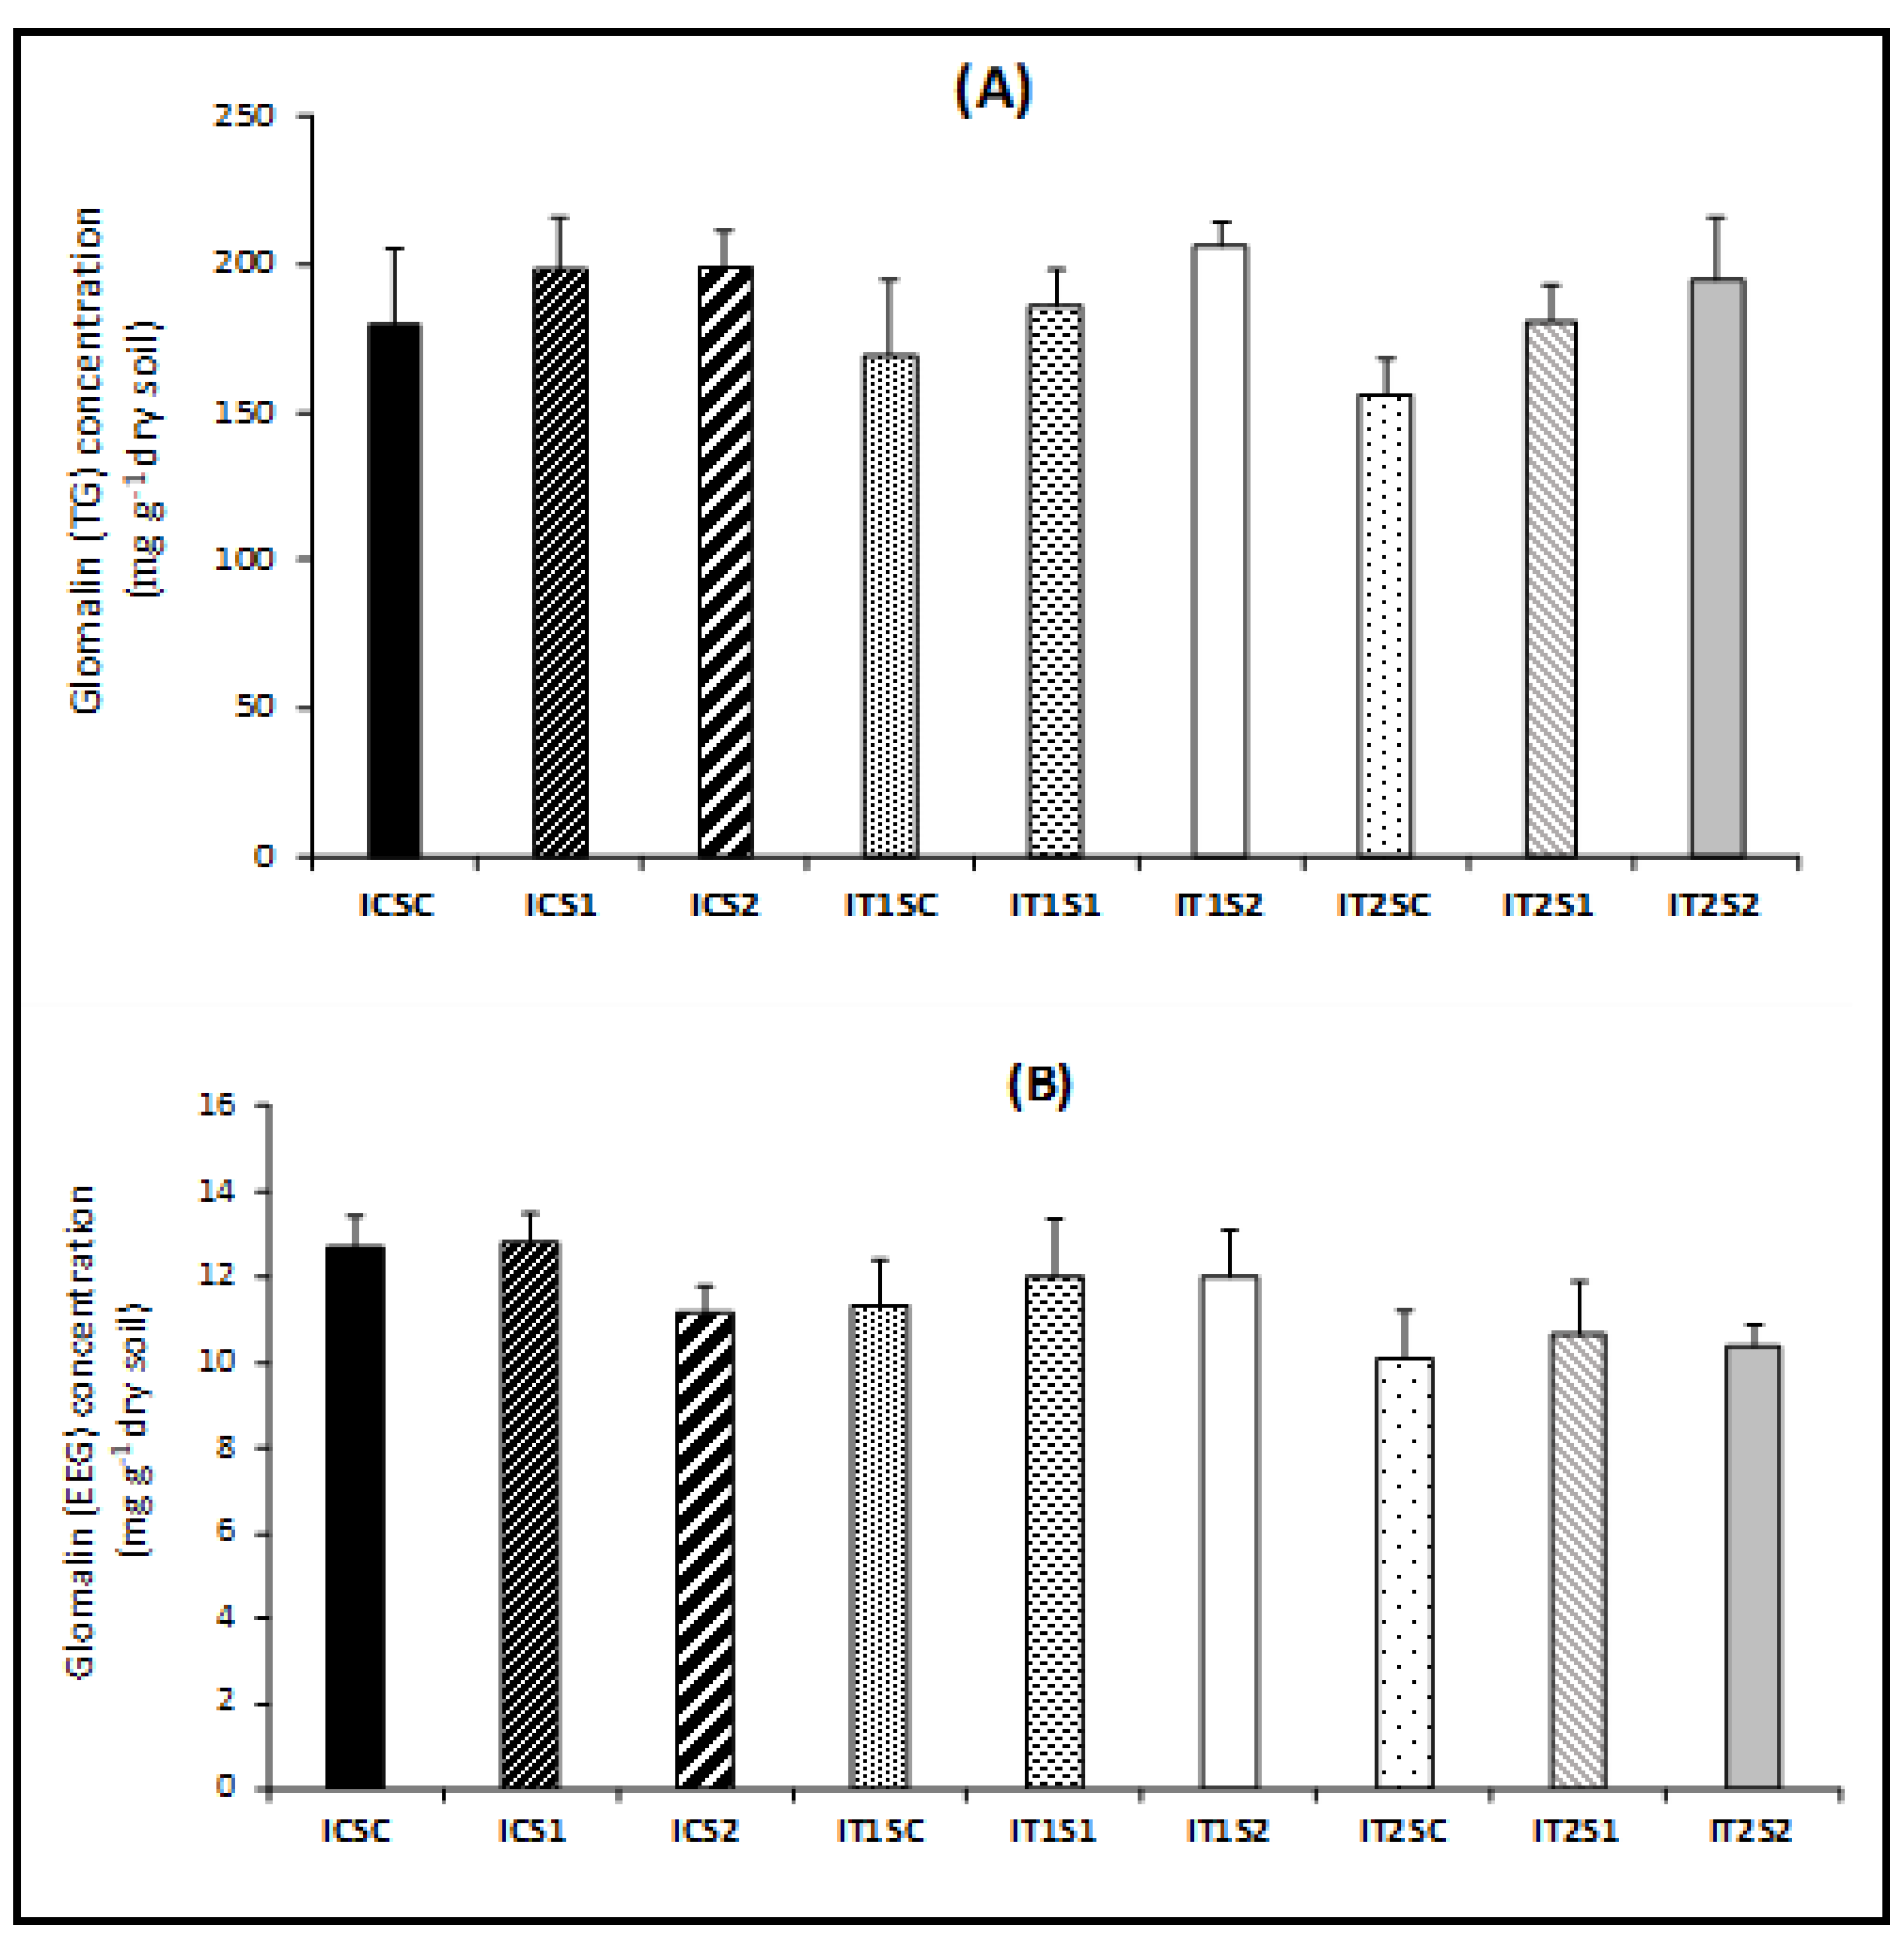
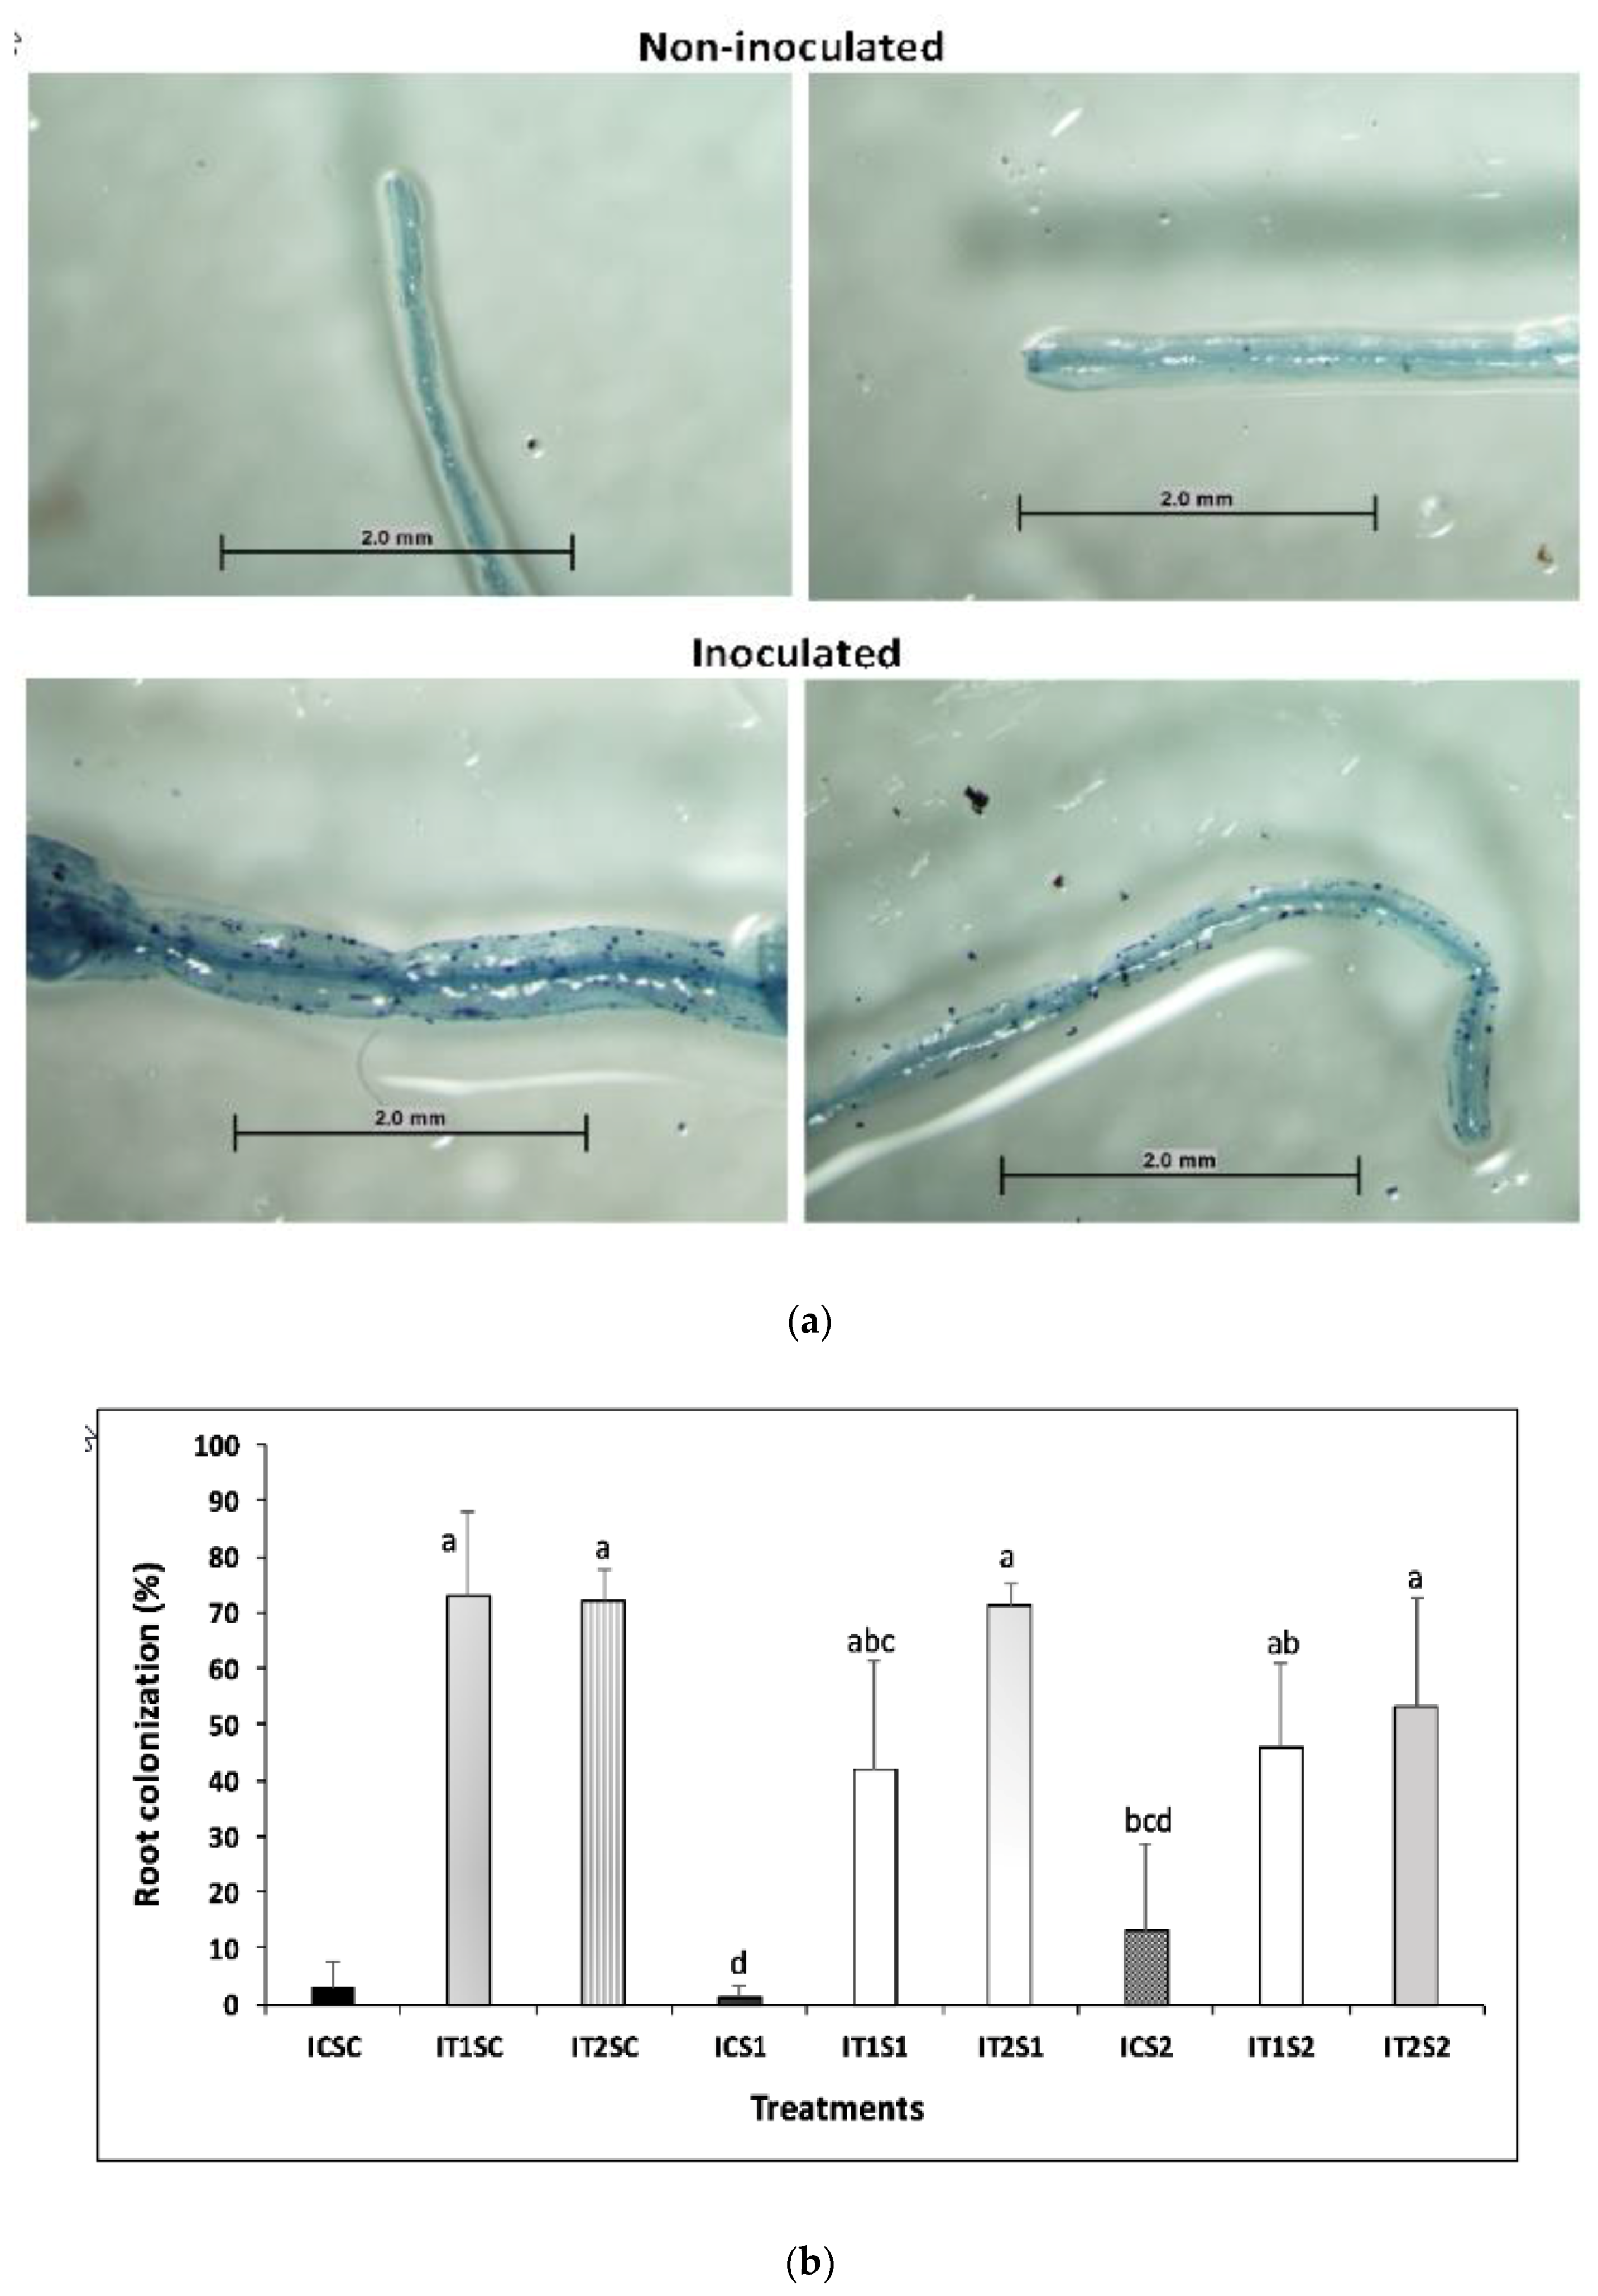
3.4. Root Colonization of AMF and Glomalin Production (TG and EEG)

Microscopic observations of AMF non-inoculated and inoculated snap bean roots, and AMF root colonization (%) are presented in Figure 6. Our results indicate that no salinity treatment (SC) showed a 23% higher AMF root colonization than salinity treatment level one and two (S1 and S2 = 1.0 and 2.0 dS m−1, respectively). The presence of NaCl in soil reduces AMF root colonization [66,67] through an inhibitory effect of NaCl on AMF [68].
Inoculation treatment one and two (IT1 and IT2) increased significantly higher (p < 0.05) AMF root colonization than control (IC). However, average values of AMF root colonization in inoculation treatment two (IT2 = AMF + Rhizobium) were 17% higher than the average of inoculation treatment one (IT1 = AMF only), which indicates that AMF and Rhizobium as a dual inoculant promoted AMF root colonization compared to AMF inoculation alone. These results further support our data (Table 1) that dual inoculation of AMF and Rhizobium was effective in mitigating salt stress during snap bean cultivation.
Glomalin, also known as glomalin-related soil protein (GRSP), is a glycoprotein [69], which is secreted in the soil by AMF. Glomalin has been studied to evaluate its effect on binding soil particles together and improving soil aggregate stability. We quantified the amount of total glomalin (TG) and easily extractable glomalin (EEG) (Figure 7a,b). Results of TG (Figure 7a) indicates an increasing trend of GRSP content with increasing salinity levels (SC, S1, S2) with (IT1 and IT2) or without (IC) inoculation. Overall, the maximum salinity level (S2) produced 6% and 18% higher GRSP than salinity treatment one (S1) and salinity control (SC), respectively. Abiotic stress (salinity, draught, etc.) has been reported to increase GRSP contents [70,71] when AMF is active in soil. Therefore, microbial inoculations (AMF alone and with Rhizobium) has the ability to restore soil health and improve soil quality of salt-affected agricultural areas. Our experiment suggests that glomalin or GRSP production can also be used as a potential indicator of soil abiotic stress. Glomalin is reported to be present at various concentrations in natural soil [72]. However, the addition of AMF and dual inoculation (AMF + Rhizobium) in soil increased the overall GRSP content in this experiment. In a recent study, Gao et al. [73] found that AMF inoculation in soil can increase both total and easily extractable glomalin related soil protein (GRSP) contents.
The easily extractable glomalin (EEG) content across different treatments was variable in this experiment. Easily extractable glomalin was a minor fraction (5–7%) of the TG produced in the soil (Figure 7b). This might be because the soil used in this study was not sterilized, and the glomalin was not only contributed by AM but also by other microbial sources. We specifically used un-sterilized soil for this study to ‘simulate’ the actual field conditions of organic farming in South Florida. However, uncertainty remains as the AMF may have previously been present in our soil and contributed GRSP contents, but a general increasing trend of GRSP release over time indicates the effect of our induced inoculation treatments. Similar observations were reported by Walley et al. [74] when they studied the effect of AM and plant growth-promoting rhizobacteria on glomalin production in un-sterilized soil. For EEG, the salinity showed no or little effect on natural glomalin present in the soil. When the soil was inoculated with AMF and Rhizobium + AMF, the glomalin content increased numerically with the presence of salinity, which illustrates the possible beneficial effect of Rhizobium on AMF inoculation in synthesizing GRSP in soil.
Benefits of GRSP in soil are well documented. Glomalin provides benefits through soil aggregate stability [31,32,75,76,77]; nutrient cycling, interaction with beneficial microbes, such as phosphate solubilizing bacteria, etc. [78]; increased soil organic carbon (SOC) contents [40]; increased soil–water–plant relations [70,79]; and reduced heavy metal accumulation in crops [33,80].
Due to the long-chain and recalcitrant carbon structure, glomalin successfully contributes to the soil carbon sequestration under long-term experiments [40]. Glomalin resides in the soil for 6 to 42 years and is primarily responsible for soil organic carbon accumulation [81,82]. We did not measure the SOC accumulation induced by GRSP because of the short duration of the experiment, but our results suggest that it is not unlikely that microbial inoculations in saline-affected agricultural areas can potentially restore the SOC and increase soil productivity.

4. Conclusions

Saltwater intrusion and soil salinity are major agricultural problems in South Florida. Appropriate soil management is needed for growing salt-sensitive crops, such as snap bean, which contributes to Florida’s economy. Our experiment indicated that salinity stress even at the threshold level (1.0 dS m−1) can negatively affect snap bean physiology, but microbial inoculations (AMF and Rhizobium) can mitigate salinity stress to a certain degree, increase bean biomass production, shoot weights, and leaf chlorophyll content, and most importantly induce the secretion of GRSP, which has numerous beneficial effects in restoring soil health. Salt-affected areas are often considered as low productive lands and not suitable for the production of major agricultural crops. Our experimental results suggest that a reduction of salinity can be achieved through independent and dual microbial inoculations in salt-affected soils, and thus, this is expected to be used for better crop productions in main agricultural crop lands. We also observed that at different salinity stress levels, dual inoculation (AMF + Rhizobium) promoted AMF root colonization compared to independent inoculation (AMF only), improving plant physiological parameters, biomass productions, and GRSP secretion.

Author Contributions

Initial project discussion: C.L.G., K.J., and S.C.; Experimental set up and laboratory analysis: C.L.G., K.J., and S.C.; Result data compilation and statistical analyses: C.L.G., S.D., and S.C.; Development of the manuscript: C.L.G., S.D., S.C., and K.J.; Major writings: S.D., S.C., C.L.G., and K.J.; Proofread and final development of the manuscript: S.D., K.J., S.C., and C.L.G.

Acknowledgments

The authors would like to acknowledge Eric Betancourt, Ariel Freidenreich, Mary Tiedeman of the agroecology program for their help during experimental set-up and laboratory analyses. This research is possible by the funding from the United States Department of Agriculture- NIFA- Hispanic-Serving Institutions Higher Education Grants Program (2016-38422-25542).

Conflicts of Interest

The authors declare no conflict of interest.

Abbreviations

ECElectrical conductivity
GRSPGlomalin Related Soil Protein
EGEasily Extractable Glomalin
AMFArbuscular Mycorrhizal Fungi
DAPDays After Planting
SPADSoil Plant Analytical Development
SOCSoil Organic Carbon

References

  1. Food and Agriculture Organization of the United Nations (FAO). Status of the World’s Soil Resources; FAO: Rome, Italy, 2015. [Google Scholar]
  2. Tanji, K.K. Salinity in the Soil Environment. In Salinity: Environment—Plants—Molecules; Läuchli, A., Lüttge, U., Eds.; Springer: Berlin/Heidelberg, Germany, 2006. [Google Scholar]
  3. Zhou, M.; Butterbach-Bahl, K.; Vereecken, H.; Brüggemann, N. A meta-analysis of soil salinization effects on nitrogen pools, cycles and fluxes in coastal ecosystems. Glob. Chang. Biol. 2017, 23, 1338–1352. [Google Scholar] [CrossRef] [PubMed]
  4. Kaleris, V.K.; Ziogas, A.I. The effect of cutoff walls on saltwater intrusion and groundwater extraction in coastal aquifers. J. Hydrol. 2013, 476, 370–383. [Google Scholar] [CrossRef]
  5. Barlow, P.M.; Reichard, E.G. Saltwater intrusion in coastal regions of North America. J. Hydrol. 2010, 18, 247–260. [Google Scholar] [CrossRef]
  6. Guha, H.; Panday, S. Impact of Sea Level Rise on Groundwater Salinity in a Coastal Community of South Florida. J. Am. Water Resour. Assoc. 2012, 48, 510–529. [Google Scholar] [CrossRef]
  7. Price, R.M.; Nuttle, W.K.; Cosby, B.J.; Swart, P.K. Variation and uncertainty in evaporation from a subtropical estuary: Florida Bay. Estuaries Coasts 2007, 30, 497–506. [Google Scholar] [CrossRef] [Green Version]
  8. Satbenau, E.; Kotun, K. Salinity and Hydrology of Florida Bay: Status and Trends 1990-2009; South Florida Natural Resources Center: Homestead, FL, USA, 2012.
  9. Numan, M.; Bashir, S.; Khan, Y.; Mumtaz, R.; Shinwari, Z.K.; Khan, A.L.; Khan, A.; AL-Harrasi, A. Plant growth promoting bacteria as an alternative strategy for salt tolerance in plants: A review. Microbiol. Res. 2018, 209, 21–32. [Google Scholar] [CrossRef]
  10. Manchanda, G.; Garg, N. Salinity and its effects on the functional biology of legumes. Acta Physiol. Plant. 2008, 30, 595–618. [Google Scholar] [CrossRef]
  11. Evelin, H.; Devi, T.S.; Gupta, S.; Kapoor, R. Mitigation of Salinity Stress in Plants by Arbuscular Mycorrhizal Symbiosis: Current Understanding and New Challenges. Front. Plant Sci. 2019, 10. [Google Scholar] [CrossRef]
  12. Gopalakrishnan, S.; Sathya, A.; Vijayabharathi, R.; Varshney, R.K.; Gowda, C.L.L.; Krishnamurthy, L. Plant growth promoting rhizobia: Challenges and opportunities. 3 Biotech 2015, 5, 355–377. [Google Scholar] [CrossRef]
  13. Porcel, R.; Aroca, R.; Ruiz-Lozano, J.M. Salinity stress alleviation using arbuscular mycorrhizal fungi. A review. Agron. Sustain. Dev. 2012, 32, 181–200. [Google Scholar] [CrossRef]
  14. Shober, A.L. Soils and Fertilizers for Master Gardeners: Organisms in the Soil. 2009. Available online: https://edis.ifas.ufl.edu/pdffiles/MG/MG45200.pdf (accessed on 10 September 2019).
  15. Hanson, B.R.; Grattan, S.R.; Fulton, R. Agricultural Salinity and Drainage; Division of Agriculture and Natural Resources, University of California: Davis, CA, USA, 2006. [Google Scholar]
  16. Freeman, J.H.; Dittmar, P.J.; Vallad, G.E. Commercial Vegetable Production in Florida. In Vegetable Production Handbook of Florida; UF/IFAS Extension Service, University of Florida: Gainesville, FL, USA, 2019; pp. 1–2. [Google Scholar]
  17. Marella, R.L. Water withdrawals in Florida, 2012. USGS, 2015. Available online: https://pubs.usgs.gov/of/2015/1156/ofr20151156_marella-water-use-2012.pdf (accessed on 10 September 2019).[Green Version]
  18. Schubert, S.; Neubert, A.; Schierholt, A.; Sümer, A.; Zörb, C. Development of salt-resistant maize hybrids: The combination of physiological strategies using conventional breeding methods. Plant Sci. 2009, 177, 196–202. [Google Scholar] [CrossRef]
  19. Dodd, I.C.; Pérez-Alfocea, F. Microbial amelioration of crop salinity stress. J. Exp. Bot. 2012, 63, 3415–3428. [Google Scholar] [CrossRef] [PubMed] [Green Version]
  20. Hack, C.M.; Porta, M.; Schäufele, R.; Grimoldi, A.A. Arbuscular mycorrhiza mediated effects on growth, mineral nutrition and biological nitrogen fixation of Melilotus alba Med. in a subtropical grassland soil. Appl. Soil Ecol. 2019, 134, 38–44. [Google Scholar] [CrossRef]
  21. Wang, S.; Feng, Z.; Wang, X.; Gong, W. Arbuscular mycorrhizal fungi alter the response of growth and nutrient uptake of snap bean (Phaseolus vulgaris L.) to O 3. J. Environ. Sci. 2011, 23, 968–974. [Google Scholar] [CrossRef]
  22. Saleh Al-Garni, S.M. Increased heavy metal tolerance of cowpea plants by dual inoculation of an arbuscular mycorrhizal fungi and nitrogen-fixer Rhizobium bacterium. African J. Biotechnol. 2006, 5, 133–142. [Google Scholar]
  23. Diouf, D.; Duponnois, R.; Ba, A.T.; Neyra, M.; Lesueur, D. Symbiosis of Acacia auriculiformis and Acacia mangium with mycorrhizal fungi and Bradyrhizobium spp. improves salt tolerance in greenhouse conditions. Funct. Plant Biol. 2005, 32, 1143–1152. [Google Scholar] [CrossRef]
  24. Fox, J.E.; Gulledge, J.; Engelhaupt, E.; Burow, M.E.; McLachlan, J.A. Pesticides reduce symbiotic efficiency of nitrogen-fixing rhizobia and host plants. Proc. Natl. Acad. Sci. USA 2007, 104, 10282–10287. [Google Scholar] [CrossRef] [Green Version]
  25. Zahran, H.H. Rhizobium-legume symbiosis and nitrogen fixation under severe conditions and in an arid climate. Microbiol. Mol. Biol. Rev. 1999, 63, 968–989. [Google Scholar]
  26. Atieno, M.; Lesueur, D. Opportunities for improved legume inoculants: Enhanced stress tolerance of rhizobia and benefits to agroecosystems. Symbiosis 2019, 77, 191–205. [Google Scholar] [CrossRef]
  27. Soussi, M.; Santamaría, M.; Ocaña, A.; Lluch, C. Effects of salinity on protein and lipopolysaccharide pattern in a salt-tolerant strain of Mesorhizobium ciceri. J. Appl. Microbiol. 2001, 90, 476–481. [Google Scholar] [CrossRef] [Green Version]
  28. Deaker, R.; Roughley, R.J.; Kennedy, I.R. Legume seed inoculation technology–A review. Soil Biol. Biochem. 2004, 36, 1275–1288. [Google Scholar] [CrossRef]
  29. Christy Kala, T.; Mary Christi, R.; Renuka Bai, N. Effect of rhizobium inoculation on the growth and yield of horsegram (Dolichos biflorus Linn). Plant Arch. 2011, 1, 97–99. [Google Scholar]
  30. Zhang, W.; Wang, C.; Liu, M.; Yu, Y. Integrated reclamation of saline soil nitrogen transformation in the hyphosphere by earthworms and arbuscular mycorrhizal fungus. Appl. Soil Ecol. 2019, 135, 137–146. [Google Scholar] [CrossRef]
  31. Lǚ, L.H.; Zou, Y.N.; Wu, Q.S. Mycorrhizas Mitigate Soil Replant Disease of Peach Through Regulating Root Exudates, Soil Microbial Population, and Soil Aggregate Stability. Commun. Soil Sci. Plant Anal. 2019, 50, 909–921. [Google Scholar] [CrossRef]
  32. Zhang, Y.C.; Wang, P.; Wu, Q.H.; Zou, Y.N.; Bao, Q.; Wu, Q.S. Arbuscular mycorrhizas improve plant growth and soil structure in trifoliate orange under salt stress. Arch. Agron. Soil Sci. 2017, 63, 491–500. [Google Scholar] [CrossRef]
  33. Hu, Z.H.; Zhuo, F.; Jing, S.H.; Li, X.; Yan, T.X.; Lei, L.L.; Lu, R.R.; Zhang, X.F.; Jing, Y.X. Combined application of arbuscular mycorrhizal fungi and steel slag improves plant growth and reduces Cd, Pb accumulation in Zea mays. Int. J. Phytoremediation 2019, 21, 857–865. [Google Scholar] [CrossRef]
  34. Scholberg, J.M.S.; Locascio, S.J. Growth response of snap bean and tomato as affected by salinity and irrigation method. HortScience 1999, 34, 259–264. [Google Scholar] [CrossRef]
  35. Hamaoui, B.; Abbadi, J.; Burdman, S.; Rashid, A.; Sarig, S. Effects of inoculation with Azospirillum brasilense on chickpeas (Cicer arietinum) and faba beans (Vicia faba) under different growth conditions. Agronomie 2001, 21, 553–560. [Google Scholar] [CrossRef]
  36. Freidenreich, A.; Barraza, G.; Jayachandran, K.; Khoddamzadeh, A.A. Precision Agriculture Application for Sustainable Nitrogen Management of Justicia brandegeana Using Optical Sensor Technology. Agriculture 2019, 9, 98. [Google Scholar] [CrossRef]
  37. Ling, Q.; Huang, W.; Jarvis, P. Use of a SPAD-502 meter to measure leaf chlorophyll concentration in Arabidopsis thaliana. Photosynth. Res. 2011, 107, 209–214. [Google Scholar] [CrossRef]
  38. Miller, M.H.; McGonigle, T.P.; Swan, J.A.; Evans, D.G.; Fairchild, G.L. A New Method which Gives an Objective Measure of Colonization of Roots by Vesicular-Arbuscular Mycorrhizal Fungi. New Phytol. 1990, 115, 495–501. [Google Scholar]
  39. Wright, S.F.; Upadhyaya, A. A survey of soils for aggregate stability and glomalin, a glycoprotein produced by hyphae of arbuscular mycorrhizal fungi. Plant Soil 1998, 198, 97–107. [Google Scholar] [CrossRef]
  40. Wang, W.; Zhong, Z.; Wang, Q.; Wang, H.; Fu, Y.; He, X. Glomalin contributed more to carbon, nutrients in deeper soils, and differently associated with climates and soil properties in vertical profiles. Sci. Rep. 2017, 7, 1–13. [Google Scholar] [CrossRef] [PubMed] [Green Version]
  41. SAS Software, version 9.4; SAS Institute Inc.: Cary, NC, USA, 2013.
  42. Mori, M.; Di Mola, I.; Chiarandà, F.Q. Salt stress and transplant time in snap bean: Growth and productive behaviour. Int. J. Plant Prod. 2011, 5, 49–64. [Google Scholar]
  43. Selvakumar, G.; Yi, P.H.; Lee, S.E.; Shagol, C.C.; Han, S.G.; Sa, T.; Chung, B.N. Effects of long-term subcultured Arbuscular mycorrhizal fungi on red pepper plant growth and soil glomalin content. Mycobiology 2018, 122–128. [Google Scholar] [CrossRef] [PubMed]
  44. Hasamuzzaman, M.; Fujita, M.; Islam, M.N.; Ahamed, K.U.; Nahar, K. Performance of four irrigated rice varieties under different levels of salinity stress. Int. J. Integr. Biol. 2009, 6, 85–90. [Google Scholar]
  45. De Almeida, W.F.; da Paz, V.P.; de Jesus, A.P.C.; da Silva, J.S.; Gonçalves, K.S.; de Oliveira, A.S. Yield of green beans subjected to continuous and pulse drip irrigation with saline water. Rev. Bras. Eng. Agríc. Ambient. 2018, 22, 476–481. [Google Scholar] [CrossRef]
  46. Shridhar, B.S.; Author, C.; Shrimant Shridhar, B.; Shridhar, B.S.; Author, C.; Shrimant Shridhar, B. Review: Nitrogen Fixing Microorganisms. Int. J. Microbiol. Res. 2012. [Google Scholar] [CrossRef]
  47. de Souza, R.; Ambrosini, A.; Passaglia, L.M.P. Plant growth-promoting bacteria as inoculants in agricultural soils. Genet. Mol. Biol. 2015, 38, 401–419. [Google Scholar] [CrossRef]
  48. Qin, L.; Jiang, H.; Tian, J.; Zhao, J.; Liao, H. Rhizobia enhance acquisition of phosphorus from different sources by soybean plants. Plant Soil 2011, 349, 25–36. [Google Scholar] [CrossRef]
  49. Franzini, V.I.; Azcón, R.; Ruiz-Lozano, J.M.; Aroca, R. Rhizobial symbiosis modifies root hydraulic properties in bean plants under non-stressed and salinity-stressed conditions. Planta 2019, 249, 1207–1215. [Google Scholar] [CrossRef] [PubMed]
  50. Taïbi, K.; Taïbi, F.; Ait Abderrahim, L.; Ennajah, A.; Belkhodja, M.; Mulet, J.M. Effect of salt stress on growth, chlorophyll content, lipid peroxidation and antioxidant defence systems in Phaseolus vulgaris L. South African J. Bot. 2016, 105, 306–312. [Google Scholar] [CrossRef]
  51. Tester, M.; Davenport, R. Na+ tolerance and Na+ transport in higher plants. Ann. Bot. 2003, 91, 503–527. [Google Scholar] [CrossRef] [PubMed]
  52. Ren, C.G.; Bai, Y.J.; Kong, C.C.; Bian, B.; Xie, Z.H. Synergistic Interactions Between Salt-tolerant Rhizobia and Arbuscular Mycorrhizal Fungi on Salinity Tolerance of Sesbania cannabina Plants. J. Plant Growth Regul. 2016, 35, 1098–1107. [Google Scholar] [CrossRef]
  53. Bothe, H. Arbuscular mycorrhiza and salt tolerance of plants. Symbiosis 2012, 58, 7–16. [Google Scholar] [CrossRef]
  54. Yao, L.; Wu, Z.; Zheng, Y.; Kaleem, I.; Li, C. Growth promotion and protection against salt stress by Pseudomonas putida Rs-198 on cotton. Eur. J. Soil Biol. 2010, 46, 49–54. [Google Scholar] [CrossRef]
  55. Peng, Z.; He, S.; Sun, J.; Pan, Z.; Gong, W.; Lu, Y.; Du, X. Na + compartmentalization related to salinity stress tolerance in upland cotton (Gossypium hirsutum) seedlings. Sci. Rep. 2016. [Google Scholar] [CrossRef]
  56. Apte, S.K.; Thomas, J. Possible amelioration of coastal soil salinity using halotolerant nitrogen-fixing cyanobacteria. Plant Soil 1997, 189, 205–211. [Google Scholar] [CrossRef]
  57. Giri, B.; Kapoor, R.; Mukerji, K.G. Influence of arbuscular mycorrhizal fungi and salinity on growth, biomass, and mineral nutrition of Acacia auriculiformis. Biol. Fertil. Soils 2003, 38, 170–175. [Google Scholar] [CrossRef]
  58. Al-Karaki, G.N. Nursery inoculation of tomato with arbuscular mycorrhizal fungi and subsequent performance under irrigation with saline water. Sci. Hortic. 2006, 109, 1–7. [Google Scholar] [CrossRef]
  59. Soliman, A.S.; Shanan, N.T.; Massoud, O.N.; Swelim, D.M. Improving salinity tolerance of Acacia saligna (Labill.) plant by arbuscular mycorrhizal fungi and Rhizobium inoculation. African J. Biotechnol. 2014, 11, 1259–1266. [Google Scholar]
  60. Valifard, M.; Mohsenzadeh, S.; Kholdebarin, B.; Rowshan, V.; Niazi, A.; Moghadam, A. Effect of salt stress on terpenoid biosynthesis in Salvia mirzayanii: From gene to metabolite. J. Hortic. Sci. Biotechnol. 2019, 94, 389–399. [Google Scholar] [CrossRef]
  61. Babu, N.; Devaraj, R. High temperature and salt stress response in French bean (Phaseolus vulgaris). Aust. J. Crop Sci. South. Cross J. 2008, 2, 40–48. [Google Scholar]
  62. Gama, P.B.; Inanaga, S.; Tanaka, K.; Nakazawa, R. Physiological response of common bean (Phaseolus vulgaris L.) seedlings to salinity stress. African J. Biotechnol. 2007, 6, 79–88. [Google Scholar]
  63. Mortimer, P.E.; Pérez-Fernández, M.A.; Valentine, A.J. The role of arbuscular mycorrhizal colonization in the carbon and nutrient economy of the tripartite symbiosis with nodulated Phaseolus vulgaris. Soil Biol. Biochem. 2008, 40, 1019–1027. [Google Scholar] [CrossRef]
  64. Wu, F.; Li, J.; Chen, Y.; Zhang, L.; Zhang, Y.; Wang, S.; Shi, X.; Li, L.; Liang, J. Effects of phosphate solubilizing bacteria on the growth, photosynthesis, and nutrient uptake of Camellia oleifera abel. Forests 2019, 10, 348. [Google Scholar] [CrossRef]
  65. Priya, H.; Prasanna, R.; Ramakrishnan, B.; Bidyarani, N.; Babu, S.; Thapa, S.; Renuka, N. Influence of cyanobacterial inoculation on the culturable microbiome and growth of rice. Microbiol. Res. 2015, 171, 78–89. [Google Scholar] [CrossRef]
  66. Sheng, M.; Tang, M.; Chen, H.; Yang, B.; Zhang, F.; Huang, Y. Influence of arbuscular mycorrhizae on photosynthesis and water status of maize plants under salt stress. Mycorrhiza 2008, 18, 287–296. [Google Scholar] [CrossRef]
  67. Giri, B.; Kapoor, R.; Mukerji, K.G. Improved tolerance of Acacia nilotica to salt stress by arbuscular mycorrhiza, Glomus fasciculatum may be partly related to elevated K/Na ratios in root and shoot tissues. Microb. Ecol. 2007, 54, 753–760. [Google Scholar] [CrossRef]
  68. Juniper, S.; Abbott, L.K. Soil salinity delays germination and limits growth of hyphae from propagules of arbuscular mycorrhizal fungi. Mycorrhiza 2006, 16, 371–379. [Google Scholar] [CrossRef]
  69. Wright, S.F.; Upadhyaya, A. Extraction of an abundant and unusual protein from soil and comparison with hyphal protein of arbuscular mycorrhizal fungi. Soil Sci. 1996, 161, 575–586. [Google Scholar] [CrossRef]
  70. Zou, Y.N.; Srivastava, A.K.; Wu, Q.S.; Huang, Y.M. Glomalin-related soil protein and water relations in mycorrhizal citrus (Citrus tangerina) during soil water deficit. Arch. Agron. Soil Sci. 2014, 60, 1103–1114. [Google Scholar] [CrossRef]
  71. Hammer, E.C.; Rillig, M.C. The influence of different stresses on glomalin levels in an arbuscular mycorrhizal fungus-salinity increases glomalin content. PLoS ONE 2011, 6, 1–5. [Google Scholar] [CrossRef] [PubMed]
  72. Yang, Y.; He, C.; Huang, L.; Ban, Y.; Tang, M. The effects of arbuscular mycorrhizal fungi on glomalin-related soil protein distribution, aggregate stability and their relationships with soil properties at different soil depths in lead-zinc contaminated area. PLoS ONE 2017, 12, e0182264. [Google Scholar] [CrossRef] [PubMed]
  73. Gao, Y.; Zong, J.; Que, H.; Zhou, Z.; Xiao, M.; Chen, S. Inoculation with arbuscular mycorrhizal fungi increases glomalin-related soil protein content and PAH removal in soils planted with Medicago sativa L. Soil Biol. Biochem. 2017, 115, 148–151. [Google Scholar] [CrossRef]
  74. Walley, F.L.; Gillespie, A.W.; Adetona, A.B.; Germida, J.J.; Farrell, R.E. Manipulation of rhizosphere organisms to enhance glomalin production and C sequestration: Pitfalls and promises. Can. J. Plant Sci. 2013, 94, 1025–1032. [Google Scholar] [CrossRef]
  75. Averill, C.; Turner, B.L.; Finzi, A.C. Mycorrhiza-mediated competition between plants and decomposers drives soil carbon storage. Nature 2014, 505, 543–545. [Google Scholar] [CrossRef]
  76. Bedini, S.; Pellegrino, E.; Avio, L.; Pellegrini, S.; Bazzoffi, P.; Argese, E.; Giovannetti, M. Changes in soil aggregation and glomalin-related soil protein content as affected by the arbuscular mycorrhizal fungal species Glomus mosseae and Glomus intraradices. Soil Biol. Biochem. 2009, 41, 1491–1496. [Google Scholar] [CrossRef]
  77. Wright, S.F.; Anderson, R.L. Aggregate stability and glomalin in alternative crop rotations for the central Great Plains. Biol. Fertil. Soils 2000, 31, 249–253. [Google Scholar] [CrossRef]
  78. Singh, P.K. Role of Glomalin Related Soil Protein Produced by Arbuscular Mycorrhizal Fungi: A Review. Agric. Sci. Res. J. 2012, 2, 119–125. [Google Scholar]
  79. Smith, S.E.; Read, D. Arbuscular mycorrhizas. In Mycorrhizal Symbiosis; Elsevier: Amsterdam, The Netherlands, 2008; pp. 111–145. [Google Scholar]
  80. Spagnoletti, F.; Carmona, M.; Gómez, N.E.T.; Chiocchio, V.; Lavado, R.S. Arbuscular mycorrhiza reduces the negative effects of M. phaseolina on soybean plants in arsenic-contaminated soils. Appl. Soil Ecol. 2017, 121, 41–47. [Google Scholar] [CrossRef]
  81. Rillig, M.C.; Wright, S.F.; Nichols, K.A.; Schmidt, W.F.; Torn, M.S. Large contribution of arbuscular mycorrhizal fungi to soil carbon pools in tropical forest soils. Plant Soil 2001, 233, 167–177. [Google Scholar] [CrossRef]
  82. Zhu, Y.G.; Miller, R.M. Carbon cycling by arbuscular mycorrhizal fungi in soil-plant systems. Trends Plant Sci. 2003, 8, 407–409. [Google Scholar] [CrossRef]
Figure 1. Experimental layout (3 × 3 factorial) for the shade house experiment, including different salinity treatments (control or salinity control (SC), treatment 1 or S1, and treatment 2 or S2) and inoculation treatments (control or inoculation control (IC,) treatment 1 or IT1, and treatment 2 or IT2). Two inoculants used for this study were arbuscular mycorrhizal fungi (AMF) and Rhizobium (Rhi), with + and − signs indicate inoculated and not inoculated, respectively. Each treatment had 10 replications.
Agronomy 09 00545 g001
Figure 2. Scatter line graph represents the changes of (A) pore water EC and (B) soil bulk EC changes over time. Treatments include three different inoculation types (IC = No inoculation, IT1 = AMF, IT2 = Rhizobium + AMF) and three salinity treatments (SC = Salinity control 0.6 dS m−1 EC, S1 = 1.0 dS m−1 EC, and S2 = 2.0 dS m−1 EC). The dashed line represents when snap beans were first irrigated (four weeks after planting) with their corresponding salinity treatment (i.e., 0.6, 1.0, and 2.0 dS m−1 EC). Average values (n = 10) are presented for each treatment in both graphs. Error bars represents the standard error of mean values.
Agronomy 09 00545 g002
Figure 3. Linear regression analysis of soil bulk EC and pore water EC for all nine treatments. Treatments consist of inoculation type (IC = No inoculation, IT1 = Mycorrhizal, IT2 = Rhizobium + Mycorrhizal) and salinity levels (SC = Salinity control 0.6 dS m−1 EC, S1 = 1.0 dS m−1 EC, and S2 = 2.0 dS m−1 EC). Values are expressed as mean and each treatment consisted of n = 10. The dashed line represents a positive linear trend that’s significant at p < 0.05.
Agronomy 09 00545 g003
Figure 4. Mean comparison of soil plant analytical development (SPAD) meter reading of snap bean leaves at different time after planting (2, 4, 6, and 8 weeks) for nine treatments. Treatments consist of inoculation type (IC = No inoculation, IT1 = AMF, IT2 = Rhizobium + AMF) and salinity levels (SC = Salinity control 0.6 dS m−1 EC, S1 = 1.0 dS m−1 EC, and S2 = 2.0 dS m−1 EC). Salinity was applied 26 days after planting (DAP). Error bars represents standard deviations of mean values. p < 0.05, same letters indicate no statistical difference among the treatments while different letters indicates treatments have significantly difference. We used 10 plants (n = 10) for each treatment.
Agronomy 09 00545 g004
Figure 5. Visual representation of varying salinity effects on snap bean leaves prior to termination; (a) no impact, dark green color, (b) minor chlorosis effects on edges of leaves for non-stressed (0.6 dS m−1) co-inoculated beans, pale-green color, (c) moderate chlorosis on salt-stressed (1.0 dS m−1) non-inoculated snap beans, yellowish-green color, and (d) firing of the leaf margins on highly stressed (2.0 dS m−1) non-inoculated beans, straw-colored leaf margins.
Agronomy 09 00545 g005
Figure 6. Microscopic observations of snap bean roots stained with 0.05% trypan blue in (a) non-inoculated root and root inoculated by arbuscular mycorrhizal fungi (AMF). (b) The bar diagram represents the effect of salinity levels (SC = Salinity control 0.6 dS m−1 EC, S1 = 1.0 dS m−1 EC, and S2 = 2.0 dS m−1 EC) and inoculation treatments (IC = No inoculation, IT1 = Mycorrhizal, IT2 = Rhizobium + Mycorrhizal) on AMF root colonization (%) during snap bean productions. Error bars represents standard deviations of mean values. Same letters indicate no statistical difference (p > 0.05) among the treatments while different letters indicate treatments have significantly difference. Each treatment consisted of n = 10.
Agronomy 09 00545 g006
Figure 7. Average values of (A) total glomalin-related soil protein (TG) and (B) easily extractable glomalin-related soil protein (EEG) mg g−1 of dry soil for all nine treatments (inoculation type × salinity level) during snap bean production. Treatments consist of inoculation type (IC = No inoculation, IT1 = Mycorrhizal, IT2 = AMF + Rhizobium) and salinity levels (SC = Salinity control 0.6 dS m−1 EC, S1 = 1.0 dS m−1 EC, and S2 = 2.0 dS m−1 EC). The graph is expressed as mean + standard deviation error bars. Each treatment consisted of n = 5.
Agronomy 09 00545 g007
Table 1. Effect of salinity level and inoculation types on soil pH, plant height, yield, root and shoot weights of snap bean.
TreatmentSoil pH Week 8Plant Height (cm) Week 8Total Bean Yield (g)Shoot Dry Weight (g)Root Dry Weight (g)Shoot to Root Ratio
ICSC6.63 ± 0.4826.48 c ± 2.7644.20 ab ± 7.475.57 ab ± 0.741.60 a ± 0.643.48
IT1SC6.52 ± 0.3227.15 c ± 2.9123.93 c ± 7.163.99 bc ± 0.971.44 a ± 0.352.77
IT2SC6.76 ± 0.2226.78 c ± 4.9133.29 bc ± 9.715.61 a ± 1.211.53 a ± 0.463.67
ICS16.36 ± 0.3828.53 bc ± 2.3357.26 a ± 8.006.53 a ± 1.581.52 a ± 0.284.30
IT1S16.30 ± 0.3431.01 abc ± 2.4427.97 c ± 5.215.03 abc ± 0.931.59 a ± 0.253.16
IT2S16.60 ±0.1830.83 abc ± 2.6643.57 b ± 10.386.09 a ± 0.871.51 a ± 0.224.03
ICS26.77 ± 0.3729.52 abc ± 4.1535.49 bc ± 14.834.96 abc ± 1.291.27 a ± 0.253.91
IT1S26.48 ± 0.2232.31 ab ± 3.7430.36 c ± 8.563.71 c ± 1.301.44 a ± 0.292.58
IT2S26.60 ± 0.3033.80 a ± 3.9535.36 bc ± 6.035.19 abc ± 0.711.42 a ± 0.293.65
Treatments consist of inoculation type (IC = No inoculation, IT1 = Mycorrhizal, IT2 = Rhizobium + Mycorrhizal) and salinity levels (SC = Salinity control 0.6 dS m−1 EC, S1 = 1.0 dS m−1 EC, and S2 = 2.0 dS m−1 EC). Values are expressed as mean ± standard deviation. Each treatment consisted of n = 10. Means within a column followed by the same letter are not significantly different at p < 0.05.

