Article

SSR Marker-Assisted Management of Parental Germplasm in Sugarcane (Saccharum spp. hybrids) Breeding Programs

1
Guangdong Provincial Bioengineering Institute (Guangzhou Sugarcane Industry Research Institute), Guangzhou 510316, China
2
Sugarcane Research Unit, USDA-ARS, Houma, LA 70360, USA
*
Authors to whom correspondence should be addressed.
These authors contributed equally to this work.
Agronomy 2019, 9(8), 449; https://doi.org/10.3390/agronomy9080449
Submission received: 11 July 2019 / Revised: 8 August 2019 / Accepted: 10 August 2019 / Published: 14 August 2019
(This article belongs to the Special Issue Molecular Marker Technology for Crop Improvement)

Abstract

:
Sugarcane (Saccharum spp. hybrids) is an important sugar and bioenergy crop with a high aneuploidy, complex genomes and extreme heterozygosity. A good understanding of genetic diversity and population structure among sugarcane parental lines is a prerequisite for sugarcane improvement through breeding. In order to understand genetic characteristics of parental lines used in sugarcane breeding programs in China, 150 of the most popular accessions were analyzed with 21 fluorescence-labeled simple sequence repeats (SSR) markers and high-performance capillary electrophoresis (HPCE). A total of 226 SSR alleles of high-resolution capacity were identified. Among the series obtained from different origins, the YC-series, which contained eight unique alleles, had the highest genetic diversity. Based on the population structure analysis, the principal coordinate analysis (PCoA) and phylogenetic analysis, the 150 accessions were clustered into two distinct sub-populations (Pop1 and Pop2). Pop1 contained the majority of clones introduced to China (including 28/29 CP-series accessions) while accessions native to China clustered in Pop2. The analysis of molecular variance (AMOVA), fixation index (Fst) value and gene flow (Nm) value all indicated the very low genetic differentiation between the two groups. This study illustrated that fluorescence-labeled SSR markers combined with high-performance capillary electrophoresis (HPCE) could be a very useful tool for genotyping of the polyploidy sugarcane. The results provided valuable information for sugarcane breeders to better manage the parental germplasm, choose the best parents to cross, and produce the best progeny to evaluate and select for new cultivar(s).

1. Introduction

Sugarcane cultivars are allopolyploids with highly heterozygous and complex genomes, which render a slow progress in breeding. To date, most commercial sugarcane varieties can be traced back to a limited number of popular cultivars belonging to either the POJ- or Co-series, which represent a very narrow genetic base [1]. Therefore, it is important for sugarcane breeders to fully understand the genetic relationship among parental lines and to choose elite parents of different genetic background for crossing in order to broaden the genetic diversity of sugarcane population [2].
Hainan sugarcane breeding station (HSBS) is the primary sugarcane crossing facility in Mainland China. It produces nearly all the seeds for sugarcane breeders in China every year [3]. HSBS has more than 2000 germplasm materials. Currently, thousands of new elite sugarcane genotypes are created by breeders each year. The utilization of these ever-increasing germplasm materials is a daunting challenge. Parental selection is a crucial step for good quality cross-breeding. Therefore, breeding materials should be adequately evaluated by different analytical methods to ensure their genetic suitability.
In the past, sugarcane breeders studied the genetic differences of parents mainly from the aspects of the genetic relationship, geographical origin and morphology. The genetic differences of sugarcane parents cannot really be reflected by pedigree because of mixed pollen, selfing and seed admixture [4]. Although morphological traits can be evaluated, these traits are easily influenced by the environment and may not reflect the real genetic diversity of sugarcane germplasm resources [5]. DNA molecular markers with high stability, multiple quantity and high polymorphism are more suitable for evaluating sugarcane germplasm collection [1]. With the rapid development of biotechnology, sugarcane researchers have utilized different types of DNA molecular markers, including amplified fragment length polymorphisms (AFLP) [1,5], restriction fragment length polymorphisms (RFLP) [6,7], random amplification of polymorphic DNAs (RAPD) [8,9], single nucleotide polymorphism (SNP) [10], simple sequence repeats (SSRs) [11], inter simple sequence repeat (ISSRs) [12,13], expressed sequence tag-simple sequence repeat (EST-SSRs) [14,15,16], 5S rRNA intergenic spacers [17], start codon targeted (SCoT) [18], target region amplification polymorphism (TRAP) [5,19,20], and cleaved amplified polymorphism sequences (CAPS) [21] for evaluating sugarcane germplasm.
Among PCR-based markers, SSR (microsatellite) markers are considered one of the most efficient markers for plant breeding due to large quantity, low dosage, co-dominant, reliability and multi-allelic detecting [22]. SSR markers have been used widely to study sugarcane genetic diversity and population structure [22,23,24], variety identity [25], genetic map [26,27], and genetic association [28,29,30]. Furthermore, fluorescence-labeled SSR markers combined with high-performance capillary electrophoresis (HPCE) have manifested better performance in genotyping of polyploid sugarcane, due to higher accuracy and better detection power [22,23,24,31,32,33,34,35,36,37].
Now, this paper reports a study that was designed to manage the parental germplasm of the sugarcane breeding programs in China through the microsatellite (SSR) DNA fingerprinting using fluorescence-labeled SSR primers and the high-performance capillary electrophoresis (HPCE) system. The results will help sugarcane breeders better manage the parental germplam, choose cross parents, design cross combinations, and produce high quality seedlings for the selection and development of elite varieties.

2. Materials and Methods

2.1. Plant Materials

One hundred and fifty parental clones were chosen for this study, based on the number of lines used most often in crossing from 2014 to 2018 in all Chinese sugarcane breeding programs (Table 1 and S1). These included 32 of clones from foreign origin, 109 clones from the China Mainland, and nine ROC-series clones from China Taiwan. Among the 32 foreign clones, one was from India (Co-series), 29 were from the U.S. (CP-series) and two were from Thailand (K-series). Among the 109 clones from China Mainland, four were from the Dehong Sugarcane Research Institute, Yunnan Province (DZ-series); 11 were from the Fujian Agriculture and Forestry University, Fujian Province (FN-series); two were from the Jiangxi Sugarcane Research Institute, Jiangxi Province (GN-series); 21 were from the Guangxi Academy of Agricultural Sciences, Guangxi Province (GT-series); six were from the Liucheng Academy of Agricultural Sciences, Guangxi Province (LC-series); six were from the Neijiang Academy of Agricultural Sciences, Sichuan Province (NJ-series); 18 were from the Hainan Sugarcane Breeding Station of Guangzhou Sugarcane Industry Research Institute, Hainan Province (YC-series); 29 were from the Guangzhou Sugarcane Industry Research Institute, Guangdong Province (YT-series); 10 were from the Yunnan Academy of Agricultural Sciences, Yunnan Province (YZ-series) and two were from other breeding units in China Mainland (one from Sichuan Research Institute of Sugar Crops, Sichuan Province and one from the Guangdong Academy of Agricultural Sciences, Guangdong Province).

2.2. SSR Genotyping

Young leaf tissues were collected from three individual clones, rinsed with 75% ethanol, and kept at −80 °C prior to DNA extraction. The genomic DNA was extracted from leaf tissues using the cetyl trimethyl ammonium bromide (CTAB) method [38] with minor modifications. The quality and concentration of DNA were measured using the UV-Vis Spectrophotometer Q5000 of Quawell (Quawell Technology, Inc. San Jose, CA, USA) and diluted to 20 ng/μL. A set of 21 SSR primer pairs (Table 1) with stable and clear amplification was selected from previous reports [3,11,33,39,40,41,42]. All forward primers were labeled with a fluorescence dye, 6-carboxy-fluorescein (FAM) or Hexachlorofluorescein (HEX). PCR reactions were performed with the following cycling condition: 95 °C for 2 min, followed by 40 cycles of 94 °C for 30 s, then primer-specific annealing temperature (Tm) for 90 s, 65 °C for 30 s, followed by one cycle at 65 °C for 10 min. The annealing temperatures for the 21 primer pairs were optimized separately, ranging from 49 °C to 62 °C (Table 2). The amplified PCR products were checked by a 3% agarose gel electrophoresis. High-performance capillary electrophoreses (HPCE) was conducted on the ABI 3730XL DNA analyzer (Applied Biosystems, Inc. Foster City, CA, USA) to generate GeneScan files. The GeneScan files were analyzed using the GeneMarker V2.2 software (SoftGenetics, LLC. State College, PA, USA) to show SSR DNA fragments (alleles) and the sizes of these fragments were calibrated automatically against the GeneScan500 size standards. Due to the polyploidy nature of sugarcane, the SSR alleles had to be manually called first and the score sheet was manually rechecked according to Pan [43]. The presence of an allele was scored as “1” and its absence scored as “0”. SSR alleles were named using a combination of primer name and allele size.

2.3. Genetic Diversity Analysis

Qualitative allelic data matrix was constructed and formatted using the DataFormatter software [44]. The PowerMarker v3.25 software [45] was used to calculate allele frequency, number of alleles per locus, polymorphism information content (PIC), the gene diversity index (h), Shannon’s information index (I), and percentage of polymorphic loci (PPL) of each marker. The resolving power of the primer (Rp) [46] was calculated using allele frequencies. The probability of identity (PI) [23] was computed using the CERVUS v3.0 software [47]. Unique (Series-specific) alleles were estimated using GeneALEx v6.502 [48,49].

2.4. Population Structure Analysis

The model-based program Structure v2.3.4 [50] was used to analyze the population structure involving the 226 alleles amplified by the 21 SSR primer pairs. The number of populations (K) was set from one to 10, and at each K value, ten runs were conducted separately with 50,000 iterations of burn-in length and 50,000 Markov Chain Monte Carlo (MCMC). Then, the best K value was estimated using Evanno’s ∆K method [51] with an online tool, Structure Harvester [52]. An individual Q matrix was generated by CLUMPP v1.1.2 [53]. Parental clones with membership probabilities greater than 0.5 were identified as the same group [54]. A Principal Coordinate Analysis (PCoA) map was generated based on the genetic distances between pairs of clones by GeneALEx v6.502 [48,49]. An unrooted phylogenetic tree was constructed based on the neighbor-joining (NJ) method and the genetic distance matrix using PowerMarker v3.25 [45] and adjusted with MEGA v6.06 [55].

2.5. Differentiation Analysis and Genetic Diversity Indices

Analysis of Molecular Variance (AMOVA) was conducted to find the genetic differentiation within and among subpopulations using GeneALEx v6.502 [48,49]. From AMOVA, the fixation index (Fst) and gene flow (Nm) within the population was also acquired. In addition, genetic diversity indices, including number of different alleles (Na), number of effective alleles (Ne), Shannon’s information index (I), observed heterozygosity (Ho), expected heterozygosity (He), unbiased expected heterozygosity (uHe), and percentage of polymorphic loci (PPL) of different sub-groups were also calculated using GeneALEx v6.502 [48,49].

3. Results

3.1. Polymorphism Revealed by SSR Genotyping

The 21 SSR primer pairs amplified a total of 226 alleles with an average of 10.8 alleles per primer pair (Table 2). Of the 226 alleles, 220 alleles were polymorphic and the other six alleles could be amplified in each clone. The number of alleles amplified by one primer pair ranged from five by MCSA176C01 to 25 by SCM4. The mean PIC value of each SSR primer pair ranged from 0.15 to 0.29 with an average of 0.23. The probability of identity (PI) of the 21 markers was all very low, which ranged from 0.000001 (mSSCIR36) to 0.071332 (SMC569CS) with an average of 0.015532. For the 21 primers pairs, the resolving power of the primer (Rp) was relatively high, ranging from 3.68 (SMC569CS) to 21.01 (mSSCIR36) with an average of 9.14. The mean number of alleles and the mean PIC value of genomic SSRs were 10.6 and 0.23, and were 9.8 and 0.23 for EST SSRs, respectively (Table 3).

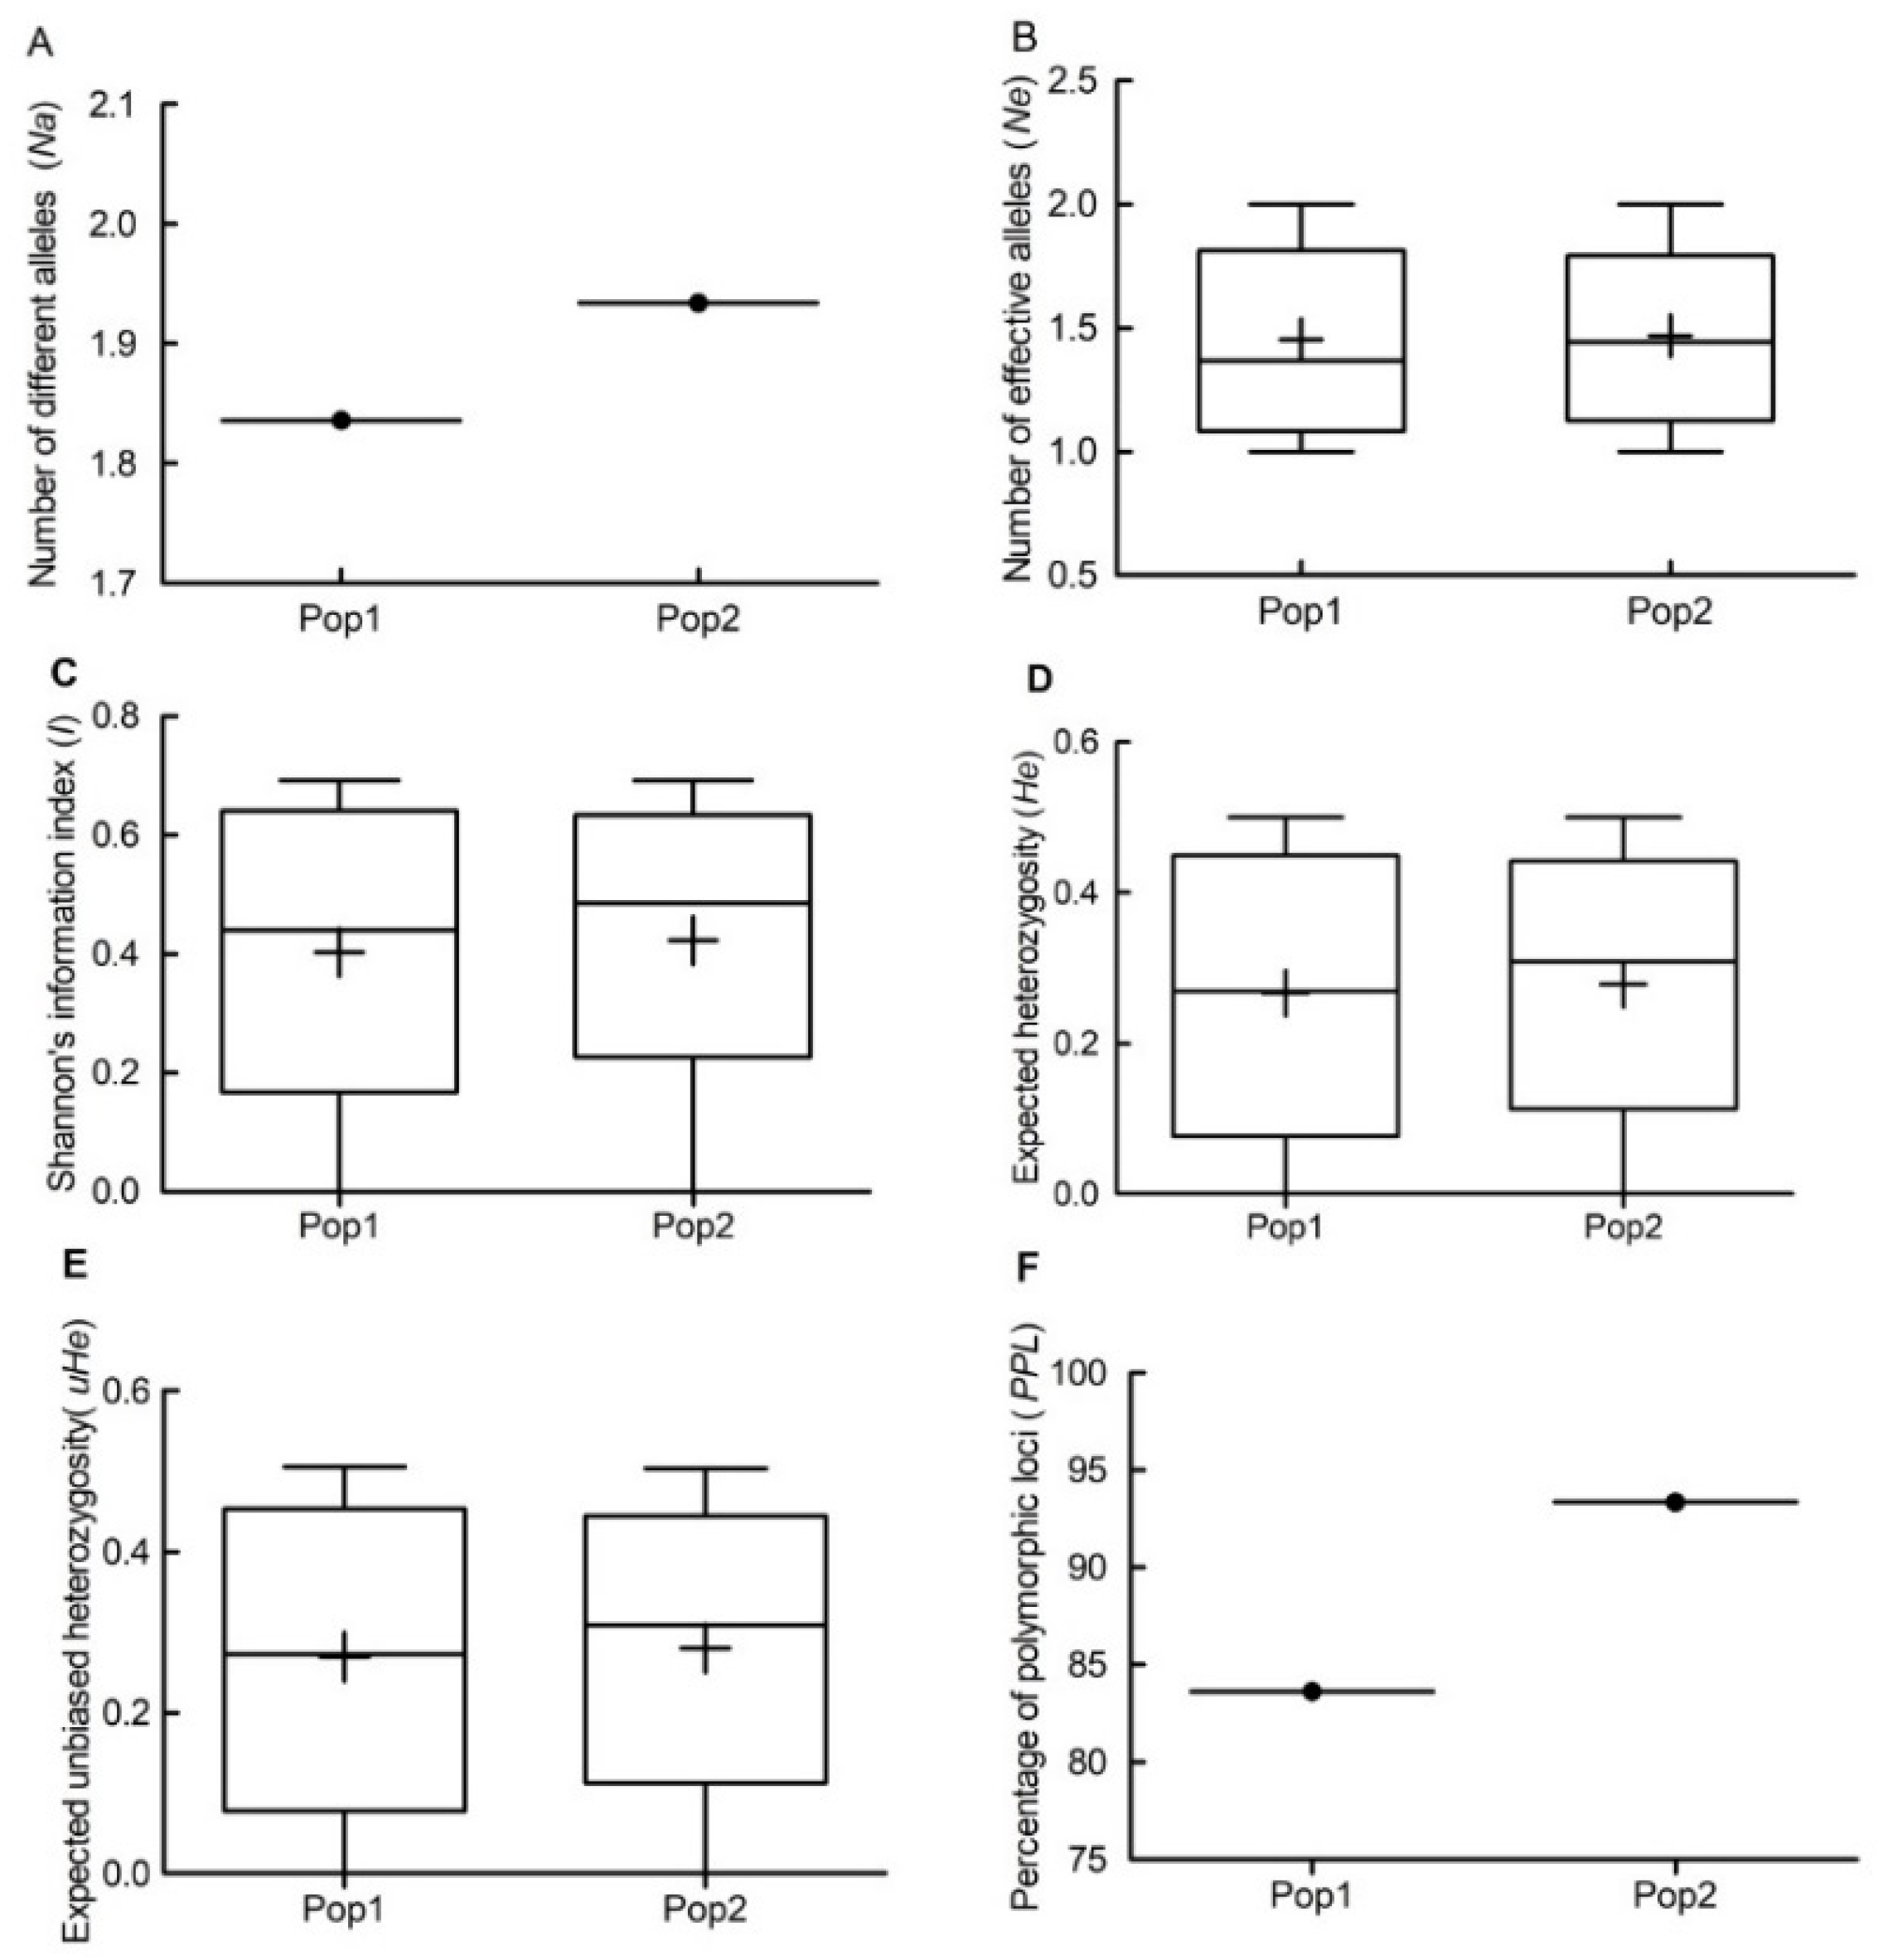
3.2. Genetic Diversity

The gene diversity (h) of the polymorphic allele ranged from 0.013 to 0.500 with an average of 0.282. The Shannon’s information index (I) of the polymorphic allele ranged from 0.010 to 0.534 with an average of 0.261. Among the different series of sugarcane parental lines, the highest values of both gene diversity (h) and Shannon’s information index (I) were found in the YC-series (0.261, 0.397), followed by the YT-series (0.254, 0.386,) and the GT-series (0.251, 0.376) (Table 3), indicating that the YC-series is genetically more diverse than the other series. The average percentages of polymorphic allele for the YT-, YC-, and CP-series were 0.814, 0.805 and 0.743, respectively. Alleles were identified that were unique to the 12 distinct germplasm groups (Table 4).

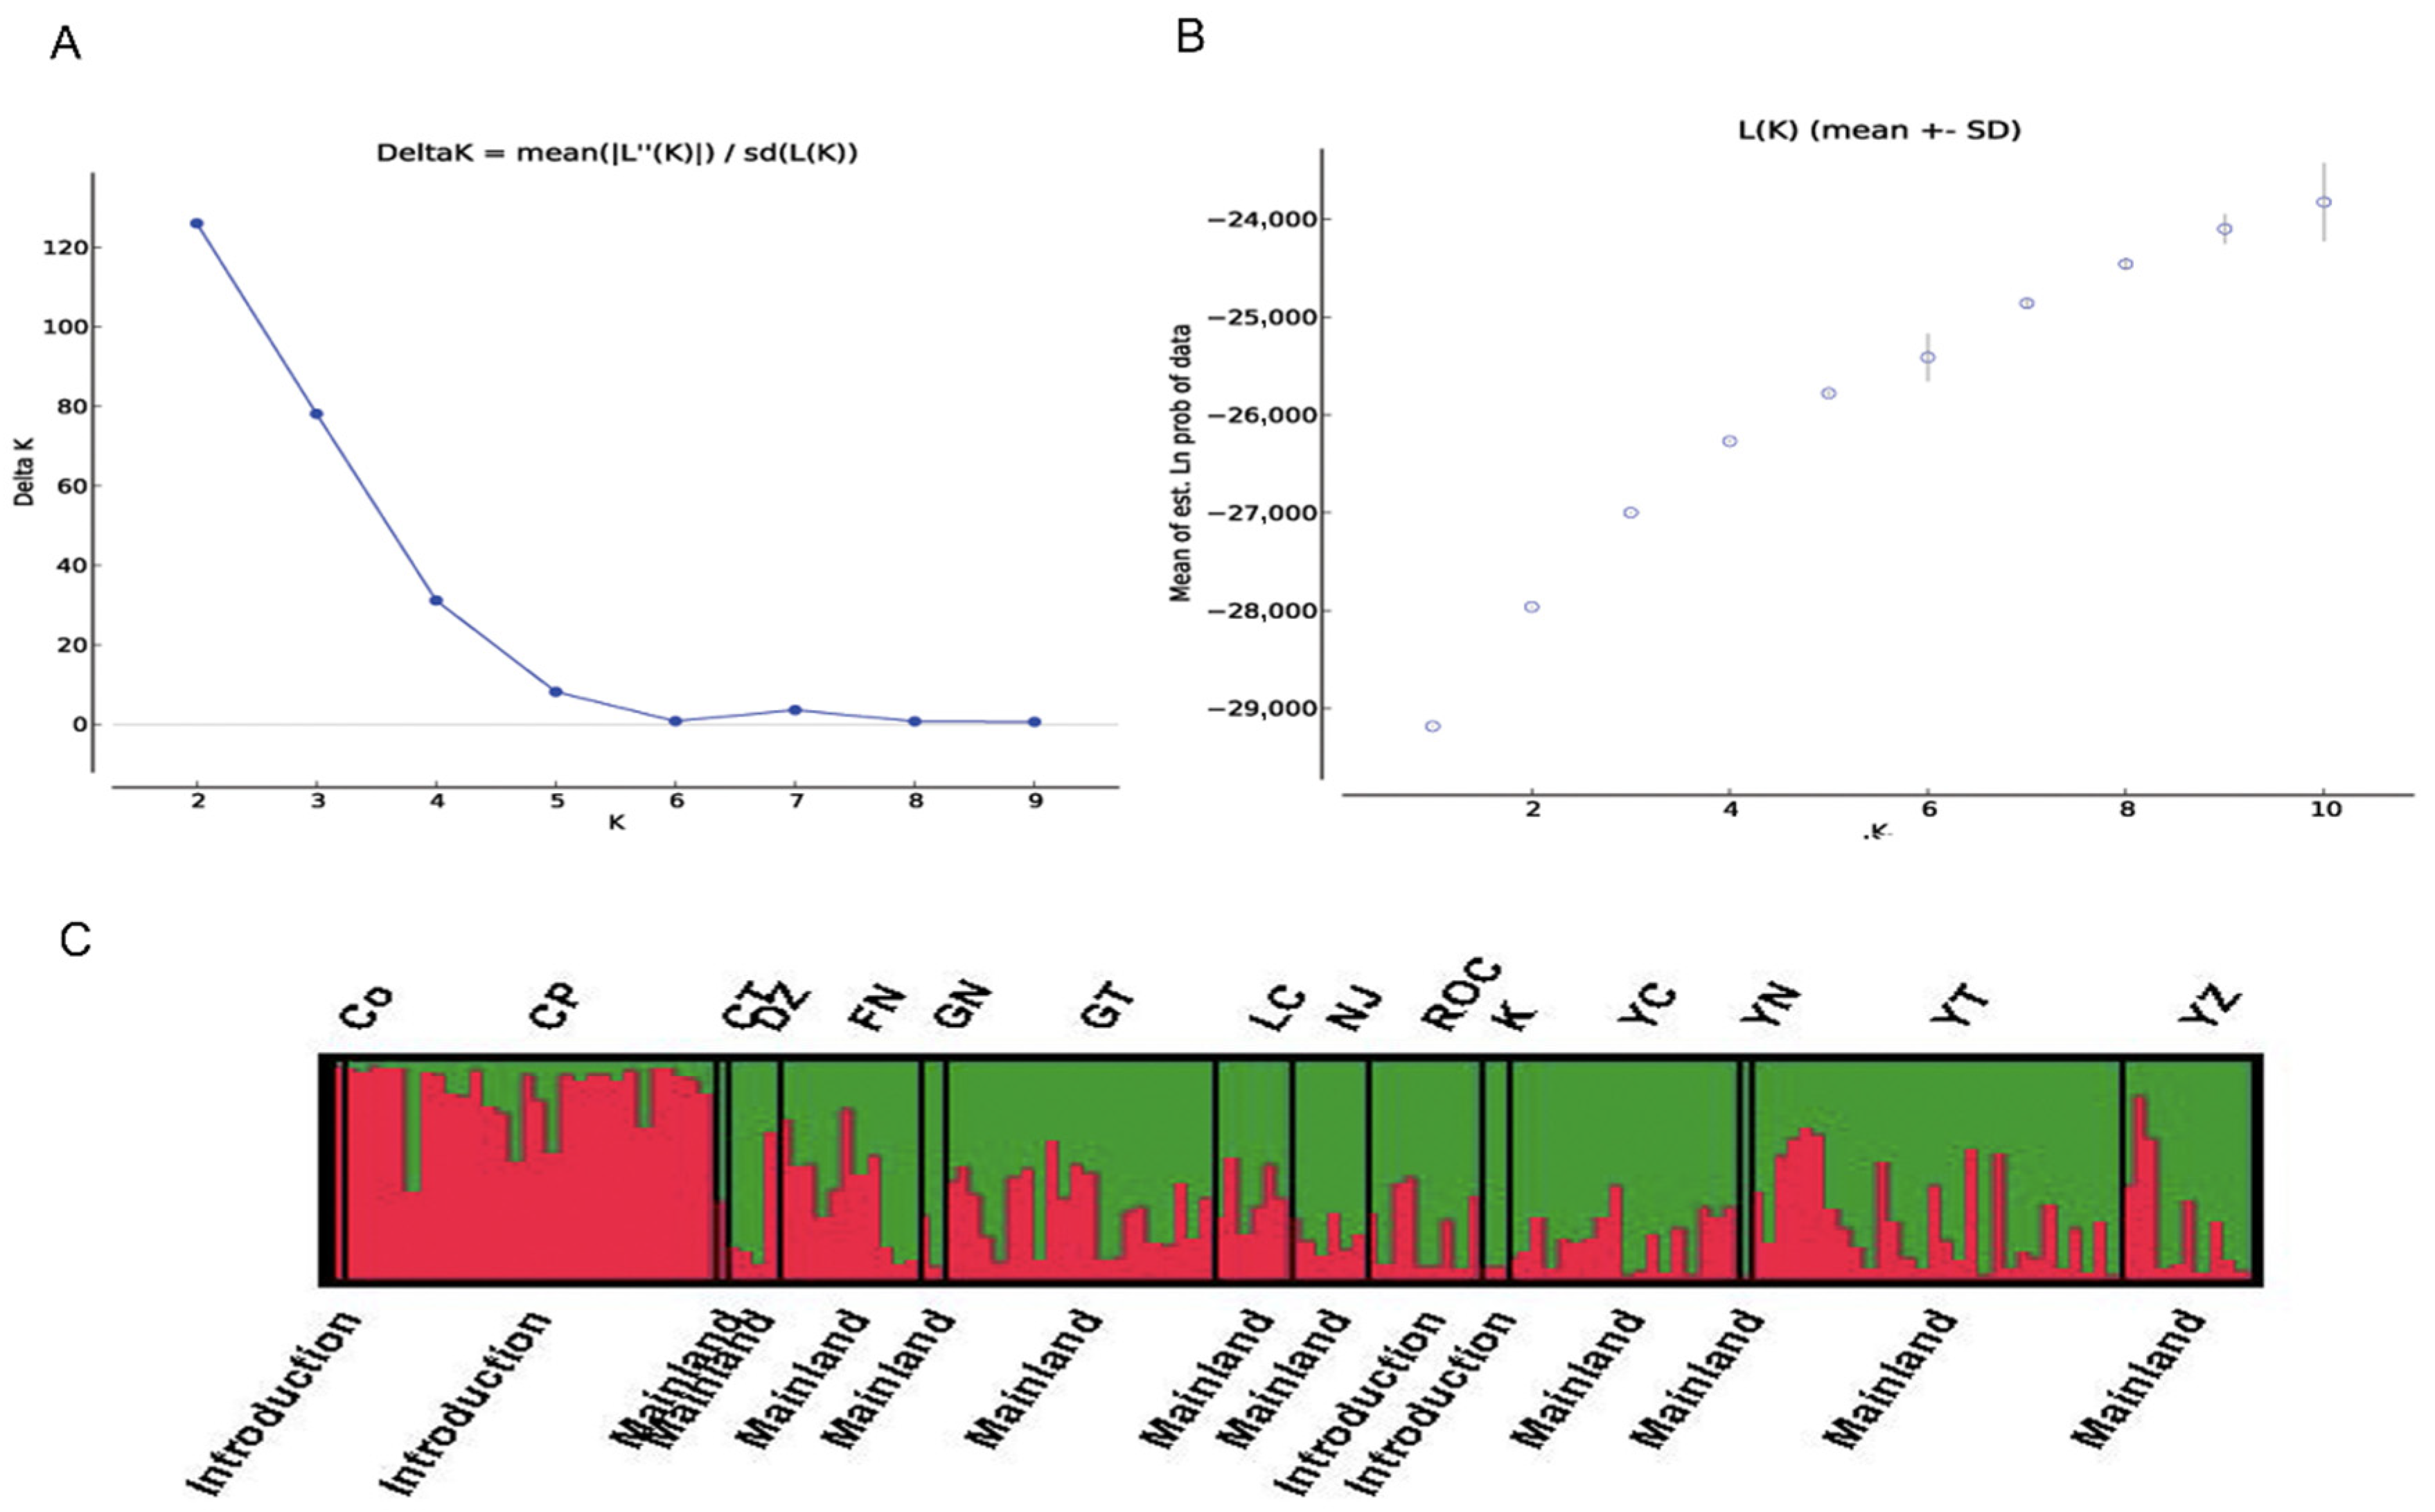
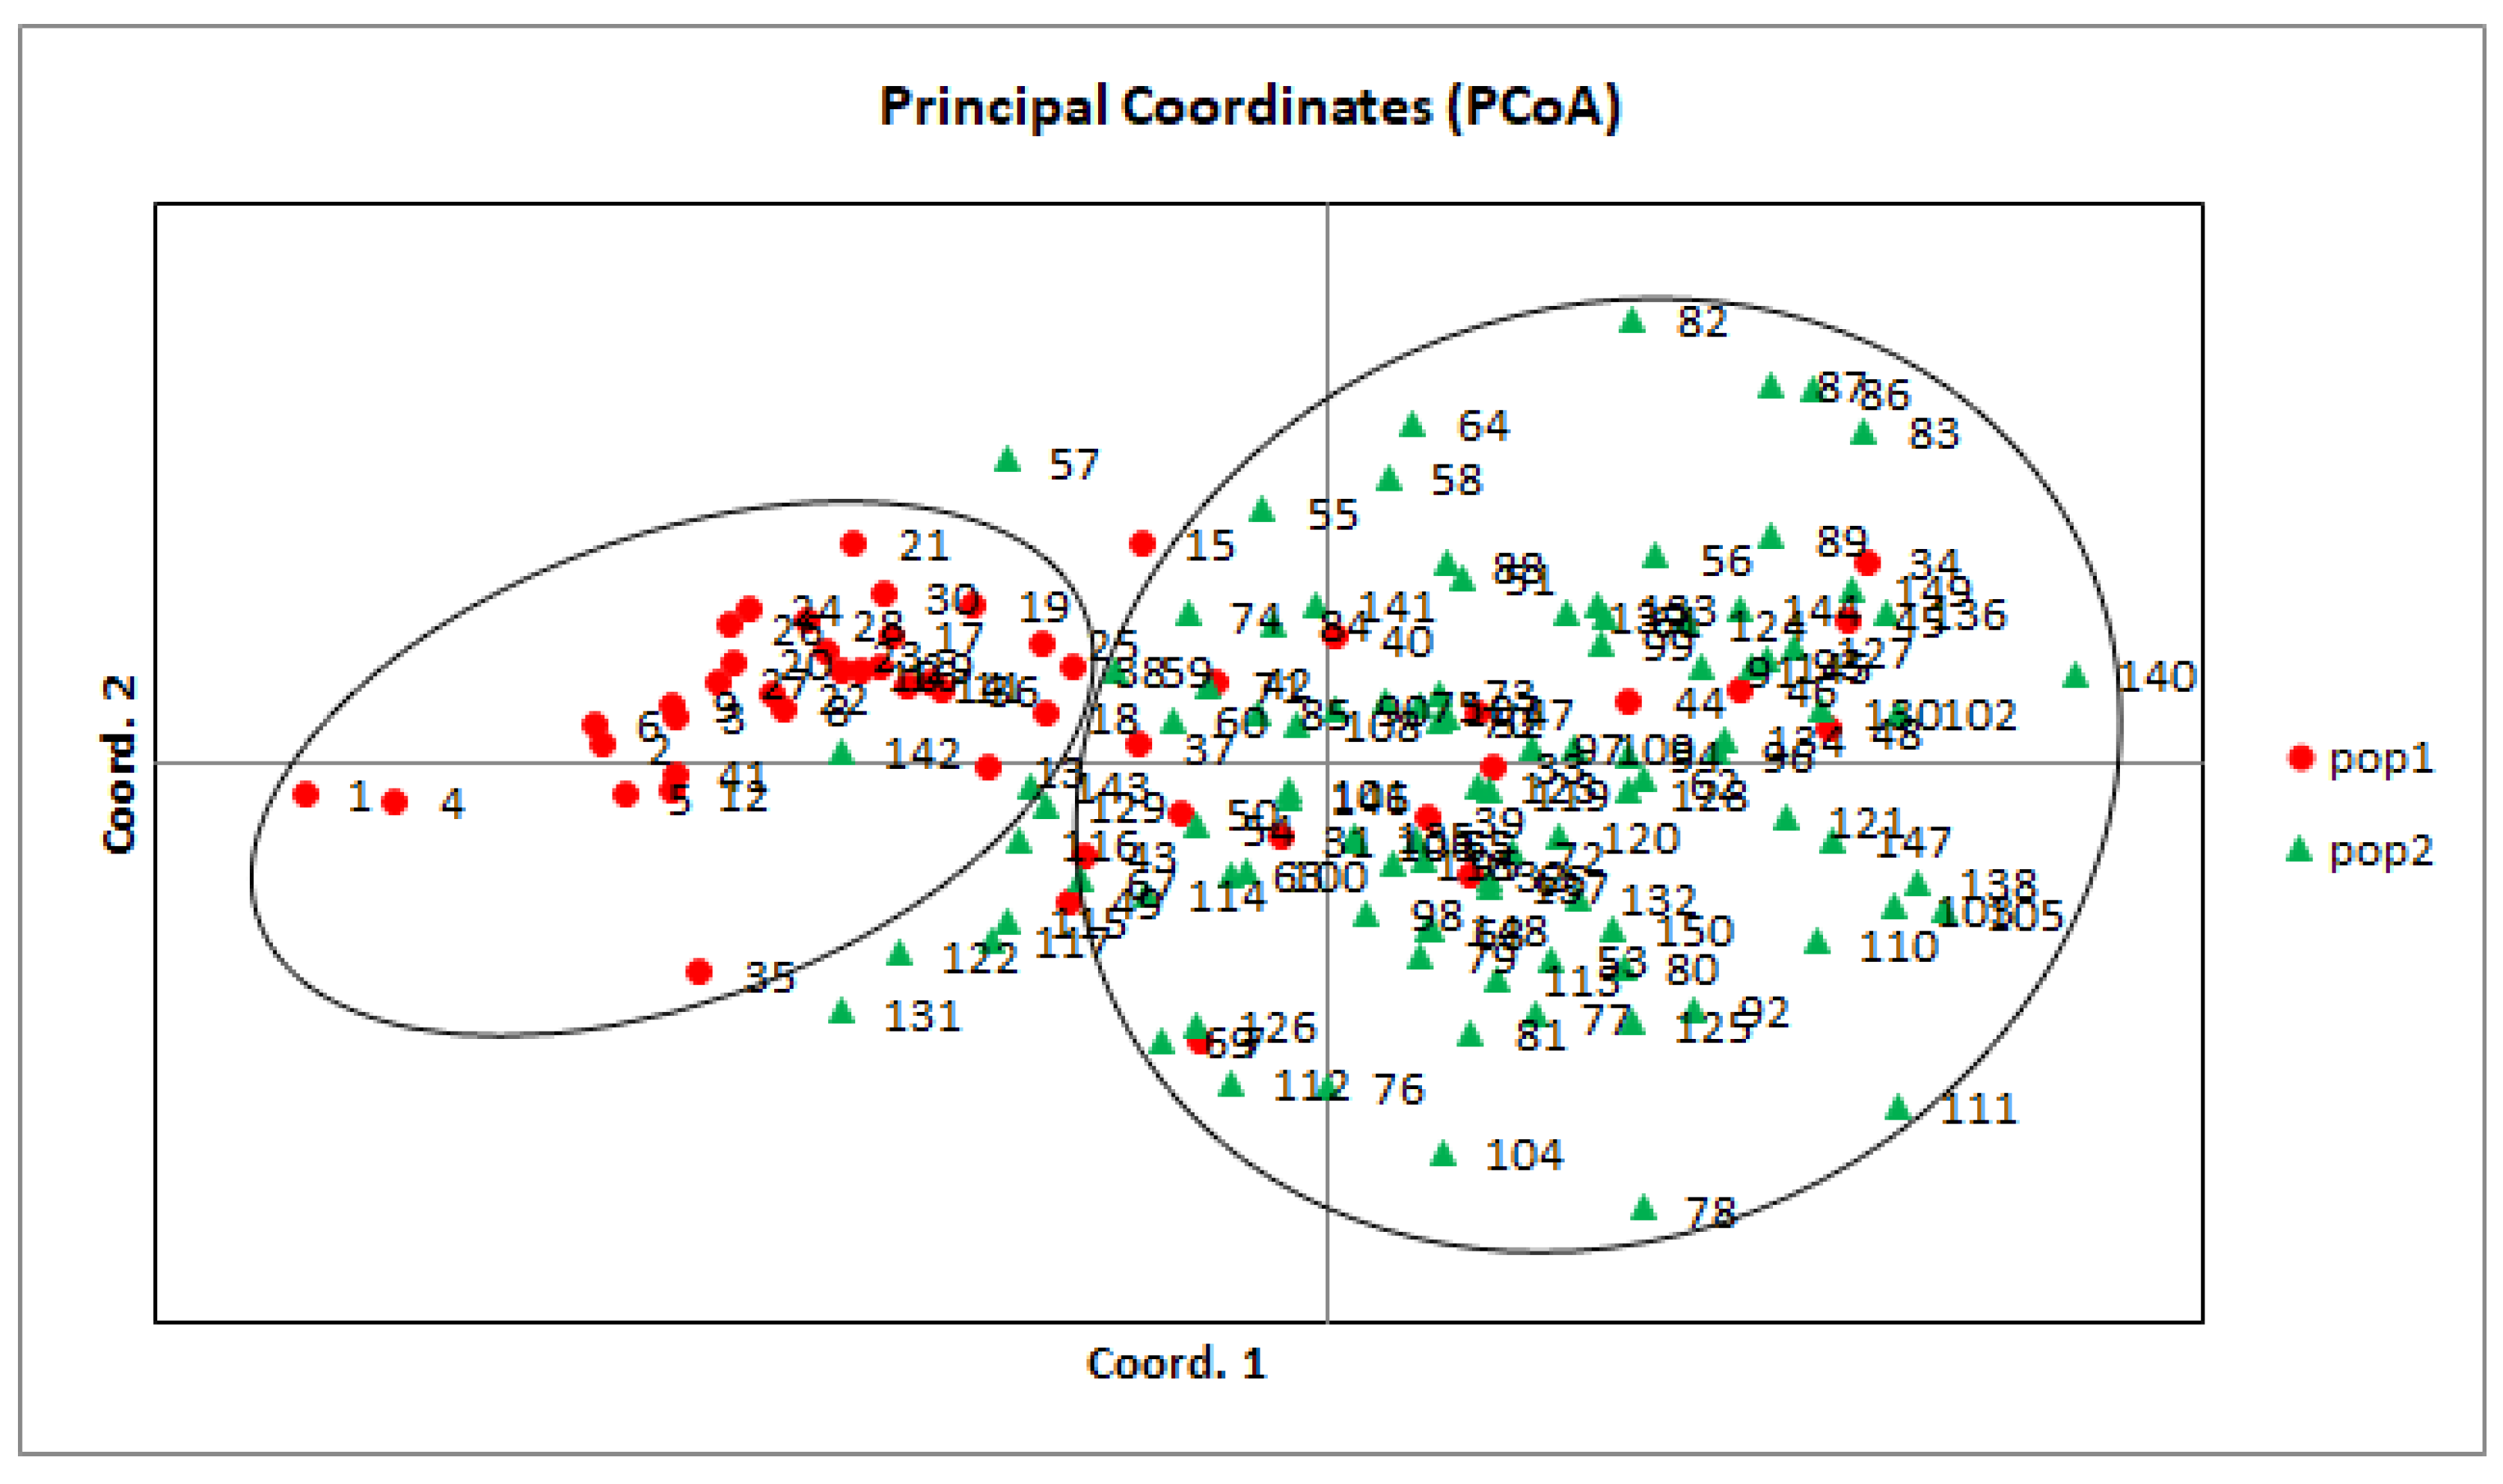
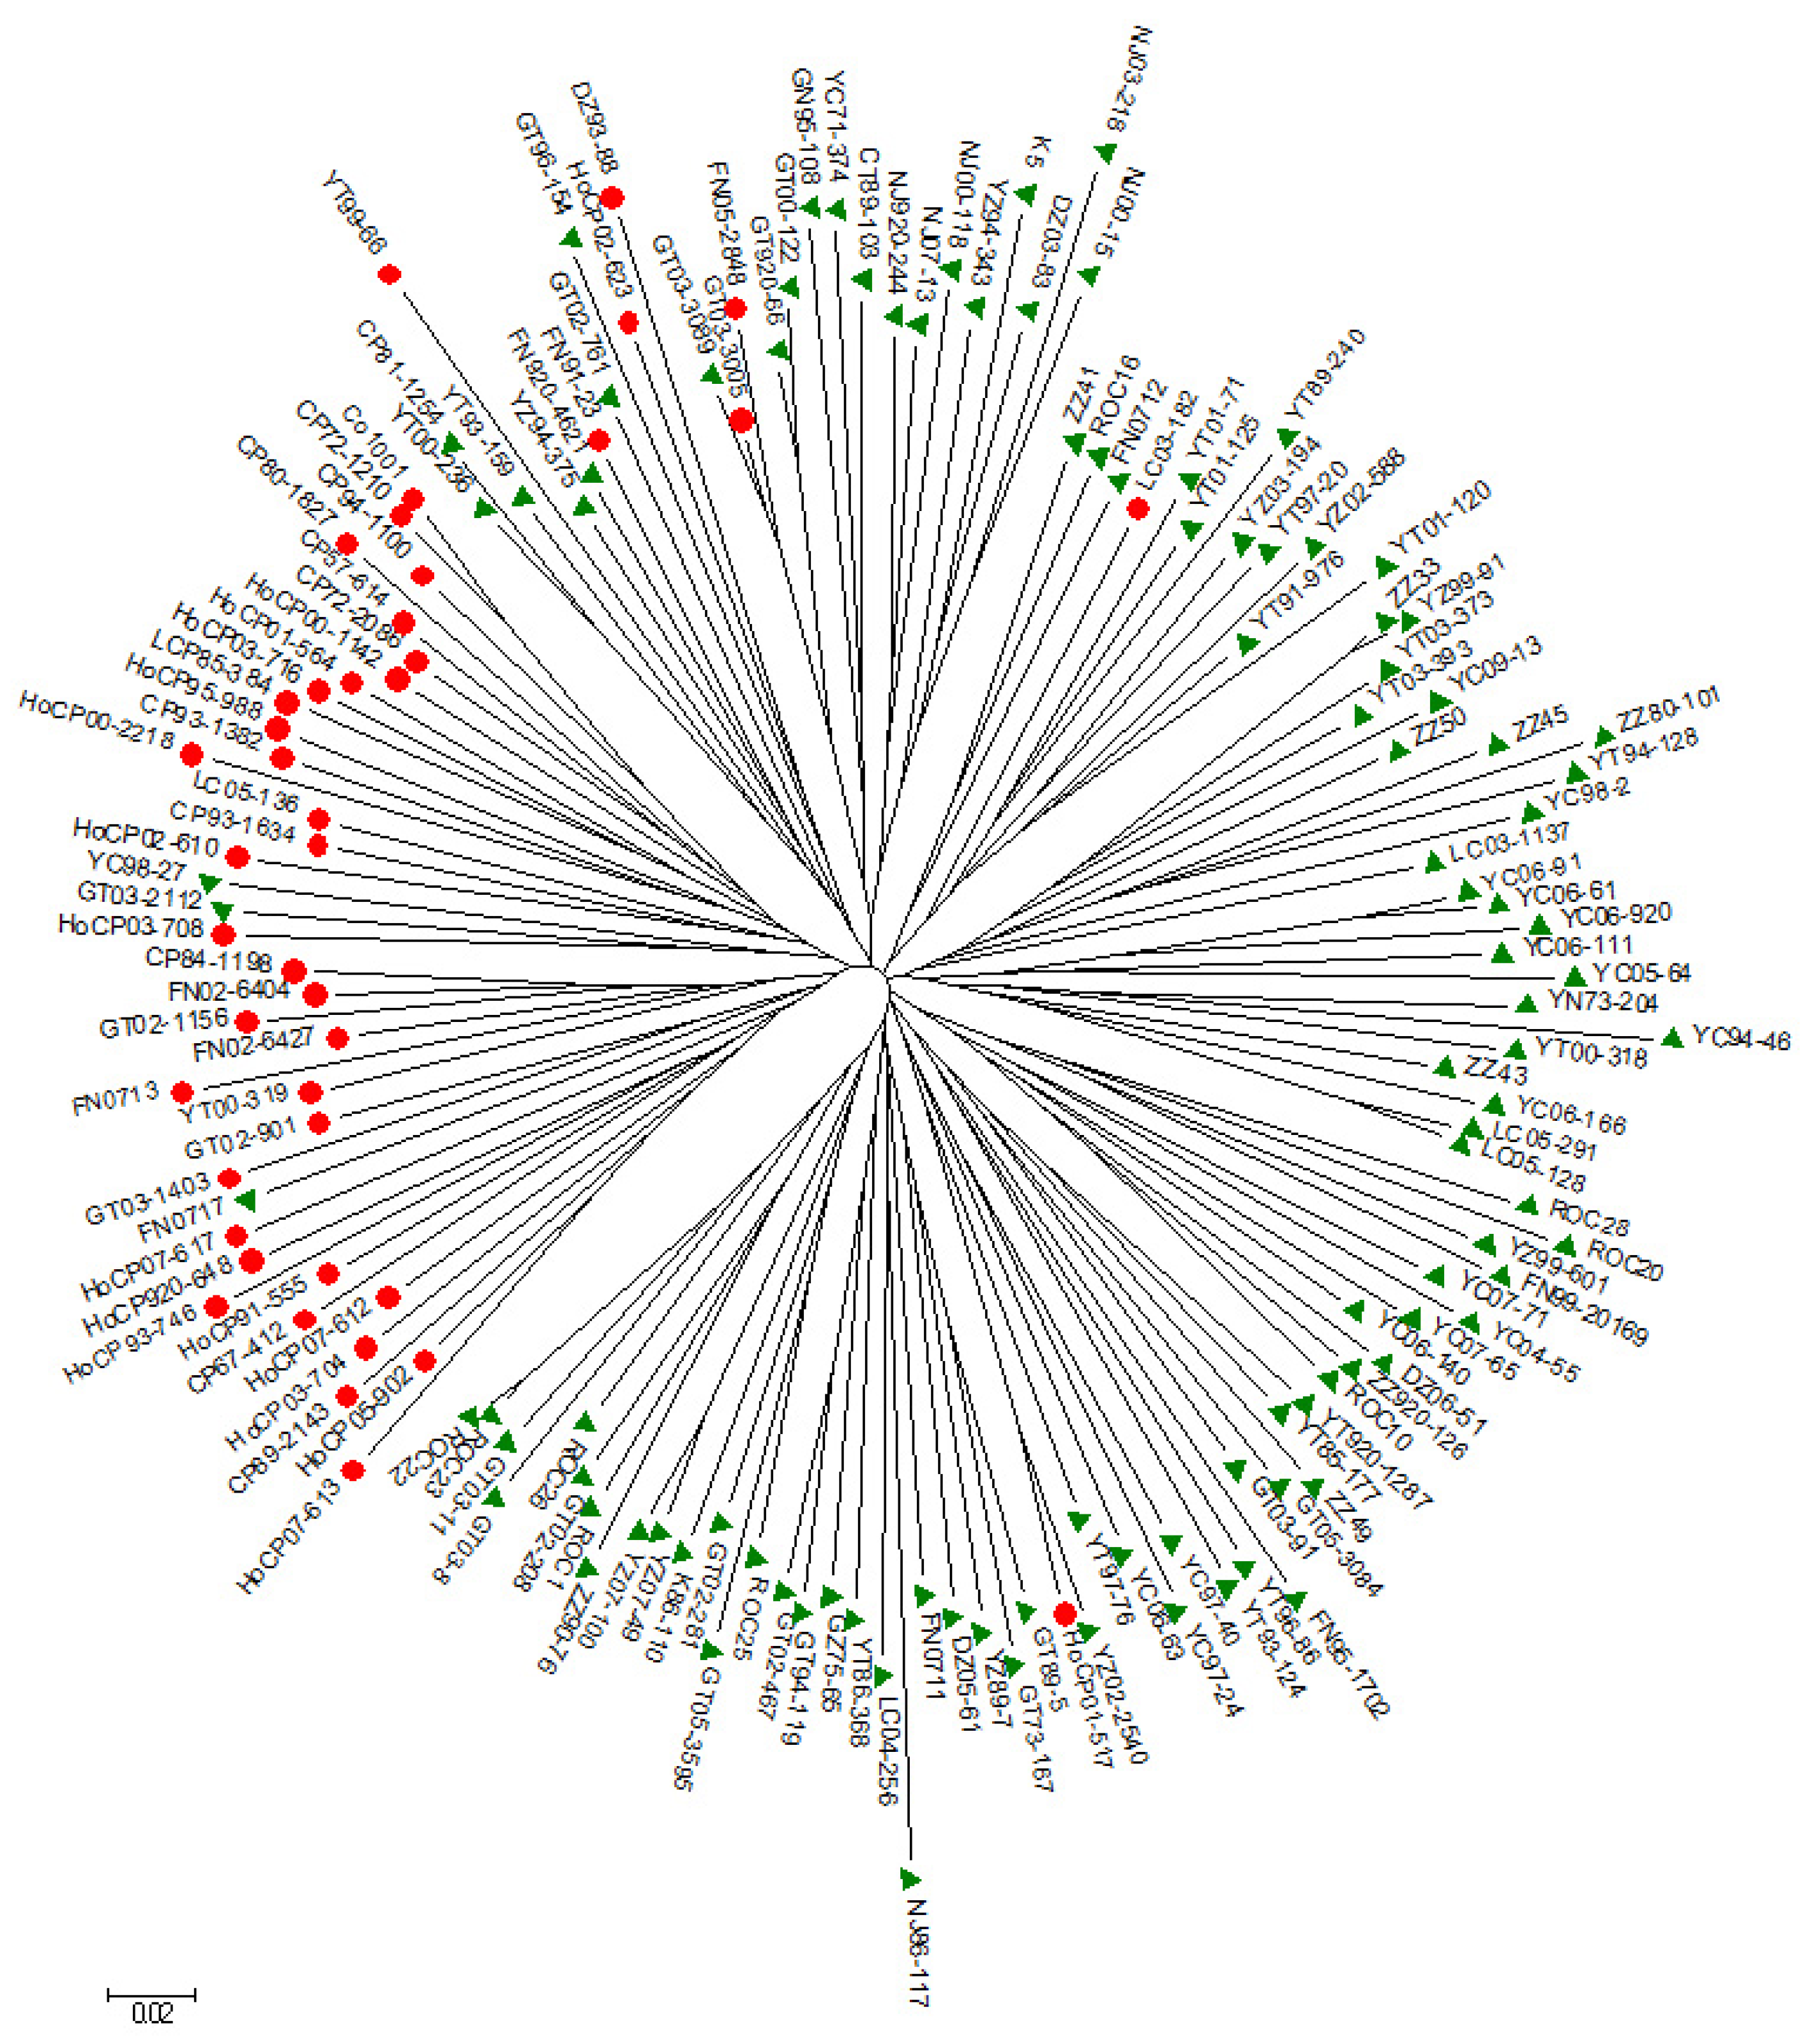
3.3. Population Structure and Phylogeny

The K-value was used to estimate the number of clusters of the clones based on the genotypic data. A continuous gradual increase was observed in the log-likelihood of K-value (LnP(K)) with the increase of K-value (Figure 1B and Table S2). The number of clusters (K) was plotted against Delta K (∆K), which revealed a sharp peak at K = 2 (Figure 1A and Table S2). The optimal K-value was K = 2, which revealed that the highest probability for the presence of two sub-populations (Pop1 and Pop2) among the 150 sugarcane clones (Figure 1C); Pop1 consisted of 50 clones and Pop2 contained 100 clones (Table S3). Pop1 clones were mainly introduction accessions and most of the Pop2 clones were from Mainland China.
In accordance with the population structure results, PCoA also showed two clusters with the first three axes together explained 20.04% of cumulative variation. In the PCoA plot, the first and second principal coordinates accounted for 8.41% and 6.71% of the total variations, respectively (Figure 2). Furthermore, the unrooted neighbor-joining phylogenetic tree (Figure 3) also showed two clusters. One cluster contained most of the clones of Pop1; the other cluster contained most of the clones of Pop2. However, the admixture of clones between the two sub-populations does exist. Few accessions (YC98-27, GT03-2112 and FN0717) native to China were clustered into Pop1 while several others (HoCP01-517, ROC10, ROC16, K5, ROC25, ROC22, ROC1) introduced to China Mainland were grouped into Pop2.

3.4. Genetic Differentiation and Allelic Pattern Across Populations

The two sub-populations Pop1 and Pop2 identified by the Structure analysis were subjected to the GeneALEx analysis to calculate the values of Analysis of Molecular Variance (AMOVA), Nei’s genetic distance and genetic diversity indices (Table 5). The variation value within the sub-populations (95% of total variation) was significantly higher than that between the sub-populations (5% of total variation). In addition, a high gene flow (Nm = 4.981) and a low fixation index value (Fst = 0.048) were obtained on the basis of Nei’s genetic distance analysis.
The mean value of the number of different alleles (Na) and effective alleles (Ne) of the two sub-populations were 1.885 ± 0.015 and 1.462 ± 0.017, respectively. The mean values for I, He and uHe among the 150 parental clones were 0.413 ± 0.011, 0.272 ± 0.008 and 0.274 ± 0.009, respectively. Pop2 (I = 0.423 ± 0.016, He = 0.278 ± 0.012, and uHe = 0.278 ± 0.012) showed higher levels of genetic diversity than Pop1 (I = 0.403 ± 0.017, He = 0.267 ± 0.012, and uHe = 0.269 ± 0.012). The percentage of polymorphic loci per population (PPL) ranged from 83.63% (Pop1) to 93.36% (Pop2) with an average of 88.50% (Figure 4).

4. Discussion

Cross hybridization has become the main breeding method for the sugarcane variety improvement. In the traditional sugarcane cross-breeding process, selecting parental clones for crossing is the most important step. Only parental clones sharing a highly level of genetic diversity and complementarity can generate high quality seedling populations [56,57]. Since the 1950s, some sugarcane cultivars from America and China Taiwan have played a very important role in China’s sugarcane cross-breeding programs [3]. Meanwhile, some new elite sugarcane parents are being created and utilized by the breeders every year. To make informed crossing choices, the genetic relationship among the parental clones involved in the latest sugarcane cross-breeding programs should be clarified.
In this study, we used 21 pairs of SSR primers to investigate the genetic diversity and population structure of 150 of the most commonly used parental clones. These primer pairs amplified 226 alleles, of which 97.3% were polymorphic. The mean PIC and the gene diversity (h) of the polymorphic alleles were 0.23 and 0.28, respectively, which were lower than the values reported on the “World Collections of Sugarcane and Related Grasses” (WGSRG) (PIC = 0.2568, h = 0.310) [23]. This may be largely due to the number of accessions involved in the world collection study. The WCSRG study involved 1002 highly diverse accessions, belonging to nine species, whereas only 150 clones were used in this study. Since 2000, a large number of genomic SSR and EST-SSR markers has been developed and applied effectively in estimating genetic diversity in the sugarcane [16,35,39,41,58]. After a lot of screening and identification (unpublished), we selected the best 21 primer pairs from these reports, including eight EST-SSR and 13 genomic SSR. We found that the number and mean PIC value of the EST-SSR alleles were lower than those of the genomic SSR alleles (Table 2). This can be due to the fact that the EST-SSR alleles are located in more conserved regions of the genome [16].
The probability of identity (PI) is an individual identification estimator that shows the probability of two different accessions sharing the same genotypes at one specific locus in a population [23]. In this study, the PI values of all SSR primer pairs were very low, ranging from 0.000001 (mSSCIR36) to 0.071332 (SMC569CS) (Table 2). The combined PI value for all markers was 9.04 × 10−57, indicating that these 21 SSR primer pairs are able to distinguish the 150 parental clones. The resolving power of the primer pair (Rp) is an index, which explains the primer pair’s ability to identify different genotypes. Rp is related to the distribution of alleles within the sampled genotypes [46] and has been found to correlate strongly with the genotype in evaluating 34 potato cultivars using four primers [46]. The mean Rp value (9.135) of the 21 SSR primer pairs is much higher than other studies, such as 2.37 by [59] and 2.2 by [12], indicating these primer pairs are more informative and could identify more cultivars.
Based on geographic origin, the 150 clones were sorted into 15 series. Among these series, the genetic diversity (h) indices ranged from 0 to 0.261 and the Shannon’s information index (I) ranged from 0 to 0.397. At the series level, the YC-series had the highest genetic diversity (h = 0.261, I = 0.397), which was similar to the previous results reported by You et al. [35,60]. The YC-series clones are from the Hainan Sugarcane Breeding Station of Guangzhou Sugarcane Industry Research Institute in Sanya city, Hainan province, where the primary sugarcane crossing facility of China is located. The YC-series clones were selected from crosses involving indigenous clones, foreign clones, and clones of closely related Saccharum species and genera [35]. Furthermore, the YC-series also had the greatest number of eight series-specific alleles. Only four, two, one, and one unique alleles were found in the CP-series, YT-series, ROC-series, FN-series and NJ-series clones, respectively. Series-specific alleles are the alleles found only in a single population among a broader collection of populations [61,62]. These alleles have been proven to be informative for population genetic studies [63,64] and we may use these alleles for variety identification and marker assisted selection.
The 150 parental clones were classified into two groups (Pop1 and Pop2) based on the PCoA, phylogenetic analysis and population structure analysis. Pop1 contained the majority of foreign accessions with the membership probabilities of >0.5, while most accessions from Mainland China were assigned to Pop2. Certain specific target traits intentionally selected by different germplasm collectors or breeders might also contribute to the population structure [54]. However, admixture of clones between the two sub-populations do exist (Figure 1, Figure 2 and Figure 3). For example, one out of the 29 CP-series clones, nine ROC-series clones and two K-series clones clustered into Pop2, but the majority of introduction clones clustered into Pop1. Likewise, one out of four DZ-series, five out of 11 FN-series, four out of 21 GT-series, two out of six LC-series, seven out of 29 YT-series, and two out 10 YZ-series clones clustered into Pop1, while the majority of the clones from Mainland China clustered into Pop2. This might be due to genetic exchange among different series, or the similar threshold (Pop1: 0.5098, Pop2: 0.4902) (Table S3) resulting in several clones to be clustered completely into a certain group (Pop1 or Pop1), while others being clustered into both groups.
The utilization data was based the most widely used 150 parental clones of sugarcane breeding programs in China during the recent five years. These included 32 of clones from foreign origin, 109 clones from the China Mainland, and nine ROC-series clones from China Taiwan. Among the 32 foreign clones, only one was from India (Co1001), two were from Thailand (K5 and K86-110) while the majority of them (29/32) were from the US (CP-series). Co1001 has been used as parental line extensively in the sugarcane breeding programs in the world. Some sugarcane cultivars, including the CP-series and China Mainland clones, were the progenies of Co-series varieties. Compared to clones from China Mainland, the CP-series clones may have closer genetic distance with the Co-series. So CP-series clones and Co-series clone can be clustered into Pop1. K5 and K86-110, which were from Thailand, were two of the most widely used parental clones in China. Some clones from China Mainland were the progenies of K5 and K86-110. Clones from China mainland may have the closer genetic distance with the two clones to be clustered into Pop2. The ROC-series varieties have been used as major cultivars in China Mainland accounting for greater than 80% of sugarcane planting areas [24]. In addition, the ROC-series accessions were also the most widely used parents in China Mainland during the recent five years (Table S1). In our study, the ROC-series accessions were clustered into Pop2 because of their closer genetic distance with China Mainland’s clones. It is suggested that less attention be continually paid on the utilization of ROC-series accessions in China Mainland’s sugarcane breeding programs.
Fixation index (Fst) measures the genetic distance between populations. An Fst value of zero indicates no differentiation between the sub-populations, while one indicates complete differentiation [65]. An Fst value less than 0.05 is considered no differentiation, while an Fst value greater than 0.15 is considered significant in differentiating populations [66]. In this study, the Fst value between the two sub-populations was 0.048 (Table 5), which was low and would indicate a very low genetic differentiation. This is consistent with the results obtained from the AMOVA, where the genetic variation within sub-populations (95%) was significantly higher than between sub-populations (5%). Gene flow (Nm) is the transfer of genetic variation from one population to another. If the value is less than one, then the gene exchange would be limited between sub-populations [67].In this study, the Nm value was high, 4.981 suggesting that a high level of genetic exchange may have occurred and this can result in a low genetic differentiation between the two sub-populations. Since the genetic diversity indices of Pop2, such as the number of different alleles (Na), effective alleles (Ne), I, He and uHe, were all higher than those of Pop1, Pop2 is more diverse than Pop1.
Selecting genetically distant accessions from Pop1 and Pop2 for crossing parents in sugarcane breeding programs will potentially lead to elite varieties with broadened genetic bases. Almost all the CP-series clones from the US were clustered into Pop1. These clones have been used extensively as parental lines in the sugarcane breeding programs in China; some have become or are elite progenitors of Chinese cultivars [67]. In addition, this study shows that several YC-series clones are also good crossing parents with a high level of genetic diversity.

5. Conclusions

Using a high-performance capillary electrophoresis (HPCE) detection system, the most widely used 150 sugarcane parental clones from 15 different series were fingerprinted with 21 SSR primer pairs. A total of 226 SSR alleles were identified and the distribution of these SSR alleles were subjected to genetic variation, phylogeny, population structure, and principal coordinate analyses. The results showed that the parental lines were clustered into two distinct groups, Pop1 and Pop2. Pop1 contained the majority of foreign clones, while Pop2 consisted of the majority of accessions from Mainland China. Genetic differentiation between the two groups was low. The YC-series clones of Pop2 displayed a high level of genetic diversity and the CP-series clones were elite parents of several Chinese cultivars. The introduction and utilization of more clones of the YC- and CP-series into China’s sugarcane breeding programs will broaden the genetic base of breeding germplasm and produce high quality seedlings for selection and development of elite varieties.

Supplementary Materials

The following are available online at https://www.mdpi.com/2073-4395/9/8/449/s1, Table S1: Utilization data of the most widely used 150 parental clones from sugarcane hybrid breeding programs in China during the recent five years. Table S2: Tabulated K values of 150 most popular parental clones from sugarcane hybrid breeding programs in China at K = 1 to 10. Table S3: Sub-population assignment of the 150 most popular parental clones from the sugarcane breeding programs in China based on the Q values.

Author Contributions

Methodology, J.W.; Validation, J.W. and Q.W.; Formal Analysis, J.W. and Y.-B.P.; Investigation, J.X., H.X. and J.W.; Resources, F.Z., C.Z., and W.Z.; Data Curation, J.X., Y.G. and H.C.; Writing—Original Draft Preparation, J.W., Y.-B.P. and J.X.; Writing—Review and Editing, Q.W. and Y.-B.P. Funding Acquisition, Q.W. and Y.Q.

Funding

This research was funded by the National Natural Science Foundation of China (31701488), the Earmarked Fund for China Agriculture Research System (CARS-170107), the Science and Technology Project of Guangdong Province (2017A030303049) and the Guangdong Provincial Team of Technical System Innovation for Sugarcane Sisal Industry (2019KJ104-02).

Acknowledgments

We thank Perng-Kuang Chang, James Todd and Yunlin Jia for their review comments and language editing.

Conflicts of Interest

The authors declare no conflict of interest. The funders had no role in the design of the study; in the collection, analyses, or interpretation of data; in the writing of the manuscript, or in the decision to publish the results.

References

  1. Lima, M.L.A.; Garcia, A.A.F.; Oliveira, K.M.; Matsuoka, S.; Arizono, H.; de Souza, C.L.; de Souza, A.P. Analysis of genetic similarity detected by AFLP and coefficient of parentage among genotypes of sugar cane (Saccharum spp.). Theor. Appl. Genet. 2002, 104, 30–38. [Google Scholar] [CrossRef] [PubMed]
  2. Ming, R.; Moore, P.H.; Wu, K.; D’Hont, A.; Glaszmann, J.C.; Tew, T.L.; Mirkov, T.E.; Da Silva, J.; Jifon, J.; Rai, M.; et al. Sugarcane Improvement through Breeding and Biotechnology; John Wiley & Sons, Ltd.: New York, NY, USA, 2010; pp. 15–118. [Google Scholar]
  3. Qi, Y.W.; Pan, Y.B.; Fang, Y.L.; Zhang, C.M.; Fan, L.N.; He, H.Y.; Liu, R.; Wang, Q.N.; Liu, S.M.; Liu, F.Y.; et al. Genetic structure and diversity of parental cultivars involved in China mainland sugarcane breeding programs as inferred from DNA microsatellites. J. Integr. Agric. 2012, 11, 1794–1803. [Google Scholar] [CrossRef]
  4. Nair, N.V.; Selvi, A.; Sreenivasan, T.V.; Pushpalatha, K.N. Molecular diversity in Indian sugarcane cultivars as revealed by Randomly Amplified DNA polymorphisms. Euphytica 2002, 127, 219–225. [Google Scholar] [CrossRef]
  5. Creste, S.; Sansoli, D.M.; Tardiani, A.C.S.; Silva, D.N.; Gonçalves, F.K.; Fávero, T.M.; Medeiros, C.N.F.; Festucci, C.S.; Carlini-Garcia, L.A.; Landell, M.G.A.; et al. Comparison of AFLP, TRAP and SSRs in the estimation of genetic relationships in sugarcane. Sugar Tech. 2010, 12, 150–154. [Google Scholar] [CrossRef]
  6. Jannoo, N.; Grivet, L.; Seguin, M.; Paulet, F.; Domaingue, R.; Rao, P.S.; Dookun, A.; D’Hont, A.; Glaszmann, J.C. Molecular investigation of the genetic base of sugarcane cultivars. Theor. Appl. Genet. 1999, 99, 171–184. [Google Scholar] [CrossRef]
  7. Silva, J.A.G.D.; Sorrells, M.E.; Burnquist, W.L.; Tanksley, S.D. RFLP linkage map and genome analysis of Saccharum spontaneum. Genome 1993, 36, 782–791. [Google Scholar] [CrossRef]
  8. Pan, Y.B.; Burner, D.M.; Legendre, B.L.; Grisham, M.P.; White, W.H. An assessment of the genetic diversity within a collection of Saccharum spontaneum L. with RAPD-PCR. Genet. Resour. Crop Evol. 2004, 51, 895–903. [Google Scholar] [CrossRef]
  9. Singh, P.; Singh, S.P.; Tiwari, A.K.; Sharma, B.L. Genetic diversity of sugarcane hybrid cultivars by RAPD markers. 3 Biotech 2017, 7, 222. [Google Scholar] [CrossRef]
  10. Garcia, A.A.F.; Mollinari, M.; Marconi, T.G.; Serang, O.R.; Silva, R.R.; Vieira, M.L.C.; Vicentini, R.; Costa, E.A.; Mancini, M.C.; Garcia, M.O.S.; et al. SNP genotyping allows an in-depth characterisation of the genome of sugarcane and other complex autopolyploids. Sci. Rep. UK 2013, 3, 3399. [Google Scholar] [CrossRef] [Green Version]
  11. Parida, S.K.; Kalia, S.K.; Kaul, S.; Dalal, V.; Hemaprabha, G.; Selvi, A.; Pandit, A.; Singh, A.; Gaikwad, K.; Sharma, T.R.; et al. Informative genomic microsatellite markers for efficient genotyping applications in sugarcane. Theor. Appl. Genet. 2009, 118, 327–338. [Google Scholar] [CrossRef]
  12. Devarumath, R.M.; Kalwade, S.B.; Kawar, P.G.; Sushir, K.V. Assessment of Genetic Diversity in Sugarcane Germplasm Using ISSR and SSR Markers. Sugar Tech. 2012, 14, 334–344. [Google Scholar] [CrossRef]
  13. Oliveira, L.A.R.; Machado, C.A.; Cardoso, M.N.; Oliveira, A.C.A.; Amaral, A.L.; Rabbani, A.R.C.; Silva, A.V.C.; Ledo, A.S. Genetic diversity of Saccharum complex using ISSR markers. Genet. Mol. Res. 2017, 16, 1–9. [Google Scholar] [CrossRef]
  14. Pinto, L.R.; Oliveira, K.M.; Marconi, T.; Garcia, A.A.F.; Ulian, E.C.; de Souza, A.P. Characterization of novel sugarcane expressed sequence tag microsatellites and their comparison with genomic SSRs. Plant Breed. 2006, 125, 378–384. [Google Scholar] [CrossRef]
  15. James, B.T.; Chen, C.; Rudolph, A.; Swaminathan, K.; Murray, J.E.; Na, J.; Spence, A.K.; Smith, B.; Hudson, M.E.; Moose, S.P.; et al. Development of microsatellite markers in autopolyploid sugarcane and comparative analysis of conserved microsatellites in sorghum and sugarcane. Mol. Breed. 2012, 30, 661–669. [Google Scholar] [CrossRef]
  16. Parthiban, S.; Govindaraj, P.; Senthilkumar, S. Comparison of relative efficiency of genomic SSR and EST-SSR markers in estimating genetic diversity in sugarcane. 3 Biotech 2018, 8, 144. [Google Scholar] [CrossRef]
  17. Pan, Y.B.; Burner, D.M.; Legendre, B.L. An Assessment of the Phylogenetic Relationship Among Sugarcane and Related Taxa Based on the Nucleotide Sequence of 5S rRNA Intergenic Spacers. Genetica 2000, 108, 285–295. [Google Scholar] [CrossRef]
  18. Que, Y.X.; Pan, Y.B.; Lu, Y.H.; Yang, C.; Yang, Y.T.; Huang, N.; Xu, L.P. Genetic analysis of diversity within a Chinese local sugarcane germplasm based on start codon targeted polymorphism. Biomed Res. Int. 2014, 2014, 468375. [Google Scholar] [CrossRef]
  19. Que, Y.X.; Chen, T.; Xu, L.; Chen, R.K. Genetic diversity among key sugarcane clones revealed by TRAP markers. J. Agric. Biotechnol. 2009, 17, 496–503. [Google Scholar]
  20. Alwala, S.; Suman, A.; Arro, J.A.; Veremis, J.C.; Kimbeng, C.A. Target region amplification polymorphism (TRAP) for assessing genetic diversity in sugarcane germplasm collections. Crop Sci. 2006, 46, 448. [Google Scholar] [CrossRef]
  21. Khan, M.; Pan, Y.B.; Iqbal, J. Development of an RAPD-based SCAR marker for smut disease resistance in commercial sugarcane cultivars of Pakistan. Crop Prot. 2017, 94, 166–172. [Google Scholar] [CrossRef] [Green Version]
  22. Ali, A.; Pan, Y.; Wang, Q.; Wang, J.; Chen, J.; Gao, S. Genetic diversity and population structure analysis of Saccharum and Erianthus genera using microsatellite (SSR) markers. Sci. Rep. UK 2019, 9, 395. [Google Scholar] [CrossRef]
  23. Nayak, S.N.; Song, J.; Villa, A.; Pathak, B.; Ayala-Silva, T.; Yang, X.; Todd, J.; Glynn, N.C.; Kuhn, D.N.; Glaz, B.; et al. Promoting Utilization of Saccharum spp. Genetic Resources through Genetic Diversity Analysis and Core Collection Construction. PLoS ONE 2014, 9, e110856. [Google Scholar] [CrossRef]
  24. Liu, H.L.; Yang, X.P.; You, Q.; Song, J.; Wang, L.P.; Zhang, J.S.; Deng, Z.H.; Ming, R.; Wang, J.P. Pedigree, marker recruitment, and genetic diversity of modern sugarcane cultivars in China and the United States. Euphytica 2018, 214, 48. [Google Scholar] [CrossRef]
  25. Pan, Y. Development and Integration of an SSR-Based Molecular Identity Database into Sugarcane Breeding Program. Agronomy 2016, 6, 28. [Google Scholar] [CrossRef]
  26. Marconi, T.G.; Costa, E.A.; Miranda, H.R.; Mancini, M.C.; Cardososilva, C.B. Functional markers for gene mapping and genetic diversity studies in sugarcane. BMC Res. Notes 2011, 4, 264. [Google Scholar] [CrossRef]
  27. Andru, S.; Pan, Y.; Thongthawee, S.; Burner, D.M.; Kimbeng, C.A. Genetic analysis of the sugarcane (Saccharum spp.) cultivar ‘LCP 85-384’. I. Linkage mapping using AFLP, SSR, and TRAP markers. Theor. Appl. Genet. 2011, 123, 77–93. [Google Scholar] [CrossRef]
  28. Banerjee, N.; Siraree, A.; Yadav, S.; Kumar, S.; Singh, J.; Kumar, S.; Pandey, D.K.; Singh, R.K. Marker-trait association study for sucrose and yield contributing traits in sugarcane (Saccharum spp. hybrid). Euphytica 2015, 205, 185–201. [Google Scholar] [CrossRef]
  29. Racedo, J.; Gutiérrez, L.; Perera, M.F.; Ostengo, S.; Pardo, E.M.; Cuenya, M.I.; Welin, B.; Castagnaro, A.P. Genome-wide association mapping of quantitative traits in a breeding population of sugarcane. BMC Plant Biol. 2016, 16, 142. [Google Scholar] [CrossRef]
  30. Ukoskit, K.; Posudsavang, G.; Pongsiripat, N.; Chatwachirawong, P.; Klomsa-ard, P.; Poomipant, P.; Tragoonrung, S. Detection and validation of EST-SSR markers associated with sugar-related traits in sugarcane using linkage and association mapping. Genomics 2019, 111, 1–9. [Google Scholar] [CrossRef]
  31. Pan, Y.B. Highly polymorphic microsatellite DNA markers for sugarcane germplasm evaluation and variety identity testing. Sugar Tech. 2006, 8, 246–256. [Google Scholar] [CrossRef]
  32. Chen, P.H.; Pan, Y.B.; Chen, R.K.; Xu, L.P.; Chen, Y.Q. SSR marker-based analysis of genetic relatedness among sugarcane cultivars (Saccharum spp. hybrids) from breeding programs in China and other countries. Sugar Tech. 2009, 11, 347–354. [Google Scholar] [CrossRef]
  33. Liu, P.W.; Que, Y.X.; Pan, Y.B. Highly Polymorphic Microsatellite DNA Markers for Sugarcane Germplasm Evaluation and Variety Identity Testing. Sugar Tech. 2011, 13, 129–136. [Google Scholar] [CrossRef]
  34. Pan, Y.B.; Liu, P.W.; Que, Y.X. Independently Segregating Simple Sequence Repeats (SSR) Alleles in Polyploid Sugarcane. Sugar Tech. 2015, 17, 235–242. [Google Scholar] [CrossRef]
  35. You, Q.; Pan, Y.; Xu, L.; Gao, S.; Wang, Q.; Su, Y.; Yang, Y.; Wu, Q.; Zhou, D.; Que, Y. Genetic Diversity Analysis of Sugarcane Germplasm Based on Fluorescence-Labeled Simple Sequence Repeat Markers and a Capillary Electrophoresis-based Genotyping Platform. Sugar Tech. 2016, 18, 380–390. [Google Scholar] [CrossRef]
  36. Ali, A.; Wang, J.; Pan, Y.; Deng, Z.; Chen, Z.; Chen, R.; Gao, S. Molecular identification and genetic diversity analysis of Chinese sugarcane (Saccharum spp. Hybrids) varieties using SSR markers. Trop. Plant Biol. 2017, 10, 194–203. [Google Scholar] [CrossRef]
  37. Fu, Y.; Pan, Y.; Lei, C.; Grisham, M.P.; Yang, C.; Meng, Q. Genotype-Specific Microsatellite (SSR) Markers for the Sugarcane Germplasm from the Karst Region of Guizhou, China. Am. J. Plant Sci. 2016, 7, 2209–2220. [Google Scholar] [CrossRef] [Green Version]
  38. Rogers, S.O.; Bendich, A.J. Extraction of DNA from plant tissues. Plant Molecular Biology Manual; Gelvin, S.B., Schilperoort, R.A., Verma, D.P.S., Eds.; Springer: Dordrecht, The Netherlands, 1989. [Google Scholar]
  39. Pan, Y.B.; Scheffler, B.E.; Richard, E., Jr. High throughput genotyping of commercial sugarcane clones with microsatellite (SSR) DNA markers. Sugar Tech. 2007, 9, 176–181. [Google Scholar]
  40. Singh, R.K.; Mishra, S.K.; Singh, S.P.; Mishra, N.; Sharma, M.L. Evaluation of microsatellite markers for genetic diversity analysis among sugarcane species and commercial hybrids. Aust. J. Crop Sci. 2010, 4, 116–125. [Google Scholar]
  41. Parida, S.K.; Pandit, A.; Gaikwad, K.; Sharma, T.R.; Srivastava, P.; Singh, N.K.; Mohapatra, T. Functionally relevant microsatellites in sugarcane unigenes. BMC Plant Biol. 2010, 10, 251. [Google Scholar] [CrossRef]
  42. Singh, R.K.; Singh, R.B.; Singh, S.P.; Sharma, M.L. Identification of sugarcane microsatellites associated to sugar content in sugarcane and transferability to other cereal genomes. Euphytica 2011, 182, 335–354. [Google Scholar] [CrossRef]
  43. Pan, Y.B.; Tew, T.L.; Schnell, R.J.; Viator, R.P.; Richard, E.P.; Grisham, M.P.; White, W.H. Microsatellite DNA marker-assisted selection of Saccharum spontaneum cytoplasm-derived germplasm. Sugar Tech. 2006, 8, 23–29. [Google Scholar] [CrossRef]
  44. Fan, W.Q.; Ge, H.M.; Sun, X.S.; Yang, A.G.; Zhang, Z.F.; Ren, M. DataFormater, A software for SSR data formatting to develop population genetics analysis. Mol. Plant Breed. 2016, 14, 1029–1034. [Google Scholar]
  45. Liu, K.; Muse, S.V. PowerMaker: An integrated analysis environment for genetic maker analysis. Bioinformatics 2005, 21, 2128–2129. [Google Scholar] [CrossRef]
  46. Prevost, A.; Wilkinson, M.J. A new system of comparing PCR primers applied to ISSR fingerprinting of potato cultivars. Theor. Appl. Genet. 1999, 98, 107–112. [Google Scholar] [CrossRef]
  47. Kalinowski, S.T.; Taper, M.L.; Marshall, T.C. Revising how the computer program CERVUS accommodates genotyping error increases success in paternity assignment. Mol. Ecol. 2007, 16, 1099–1106. [Google Scholar] [CrossRef]
  48. Peakall, R.; Smouse, P.E. GENALEX 6: Genetic analysis in Excel. Population genetic software for teaching and research. Mol. Ecol. Notes 2006, 6, 288–295. [Google Scholar] [CrossRef]
  49. Peakall, R.; Smouse, P.E. GenAlEx 6.5: genetic analysis in Excel. Population genetic software for teaching and research-an update. Bioinformatics 2012, 28, 2537–2539. [Google Scholar] [CrossRef]
  50. Falush, D.; Stephens, M.; Pritchard, J.K. Inference of Population Structure Using Multilocus Genotype Data: Linked Loci and Correlated Allele Frequencies. Genetics 2003, 164, 1567–1587. [Google Scholar]
  51. Evanno, G.; Regnaut, S.; Goudet, J. Detecting the number of clusters of individuals using the software STRUCTURE: A simulation study. Mol. Ecol. 2010, 14, 2611–2620. [Google Scholar] [CrossRef]
  52. Earl, D.A.; VonHoldt, B.M. Structure harvester: A website and program for visualizing structure output and implementing the Evanno method. Conserv. Genet. Resour. 2012, 4, 359–361. [Google Scholar] [CrossRef]
  53. Jakobsson, M.; Rosenberg, N.A. Clumpp: A cluster matching and permutation program for dealing with label switching and multimodality in analysis of population structure. Bioinformatics 2007, 23, 1801–1806. [Google Scholar] [CrossRef]
  54. Luo, Z.; Brock, J.; Dyer, J.M.; Kutchan, T.; Schachtman, D.; Augustin, M.; Ge, Y.; Fahlgren, N.; Abdel-Haleem, H. Genetic Diversity and Population Structure of a Camelina sativa Spring Panel. Front. Plant Sci. 2019, 10, 184. [Google Scholar] [CrossRef] [Green Version]
  55. Tamura, K.; Stecher, G.; Peterson, D.; Filipski, A.; Kumar, S. MEGA6: Molecular Evolutionary Genetics Analysis Version 6.0. Mol. Biol. Evol. 2016, 30, 2725–2729. [Google Scholar] [CrossRef]
  56. Jackson, P.A. Breeding for improved sugar content in sugarcane. Field Crop. Res. 2005, 92, 277–290. [Google Scholar] [CrossRef]
  57. Stevenson, G.C. Genetic and Breeding of Sugarcane; Longmans: London, UK, 1965. [Google Scholar]
  58. Cordeiro, G.M.; Casu, R.; McIntyre, C.L.; Manners, J.M.; Henry, R.J. Microsatellite markers from sugarcane (Saccharum spp.) ESTs cross transferable to erianthus and sorghum. Plant Sci. 2001, 160, 1115–1123. [Google Scholar] [CrossRef]
  59. Hameed, U.; Pan, Y.; Muhammad, K.; Afghan, S.; Iqbal, J. Use of simple sequence repeat markers for DNA fingerprinting and diversity analysis of sugarcane (Saccharum spp.) cultivars resistant and susceptible to red rot. Genet. Mol. Res. 2012, 11, 1195. [Google Scholar] [CrossRef]
  60. You, Q.; Xu, L.P.; Zheng, Y.F.; Que, Y.X. Genetic diversity analysis of sugarcane parents in Chinese breeding programmes using gSSR markers. Sci. World J. 2013, 2013, 613062. [Google Scholar] [CrossRef]
  61. Szpiech, Z.A.; Rosenberg, N.A. On the size distribution of private microsatellite alleles. Theor. Popul. Biol. 2011, 80, 100–113. [Google Scholar] [CrossRef] [Green Version]
  62. Slatkin, M. Rare alleles as indicators of gene flow. Evolution 1985, 39, 53–65. [Google Scholar] [CrossRef]
  63. Kalinowski, S.T. Counting Alleles with Rarefaction: Private Alleles and Hierarchical Sampling Designs. Conserv. Genet. 2004, 5, 539–543. [Google Scholar] [CrossRef]
  64. Schroeder, K.B.; Schurr, T.G.; Long, J.C.; Rosenberg, N.A.; Crawford, M.H.; Tarskaia, L.A.; Osipova, L.P.; Zhadanov, S.I.; Smith, D.G. A private allele ubiquitous in the Americas. Biol. Lett. 2007, 3, 218–223. [Google Scholar] [CrossRef] [Green Version]
  65. Bird, K.A.; An, H.; Gazave, E.; Gore, M.A.; Pires, J.C.; Robertson, L.D.; Labate, J.A. Population structure and phylogenetic relationships in a diverse panel of Brassica rapa L. Front. Plant Sci. 2017, 8, 321. [Google Scholar] [CrossRef]
  66. Wright, S. The interpretation of population structure by F-statistics with special regard to systems of mating. Evolution 1965, 19, 395–420. [Google Scholar] [CrossRef]
  67. Deng, H.H.; Li, Q.W. Utilization of CP72-1210 in sugarcane breeding program in mainland China. Guangdong Agric. Sci. 2007, 11, 18–21. [Google Scholar]
Figure 1. (A) Delta K (∆K) for different numbers of subpopulations (K); (B) average log-likelihood K-value (LnP(K)) against the number of K; (C) the population structure of 150 most popular parental clones in the hybrid breeding programs in China based on the distribution of 226 SSR alleles among these clones. Pop1 clones are coded in red and Pop2 clones in green.
Agronomy 09 00449 g001
Figure 2. Principal coordinates analysis (PCoA) scatter plots. Red circles represent the Pop1 clones and green triangles the Pop2 clones.
Agronomy 09 00449 g002
Figure 3. A neighbor-joining phylogenetic tree based on the pair-wise genetic distance between 150 most popular parental clones from hybrid breeding programs in China. Red circles represent the Pop1 clones and green triangles the Pop2 clones.
Agronomy 09 00449 g003
Figure 4. Allelic pattern of SSR across the two sub-populations Pop1 and Pop2. (A) Number of SSR alleles (Na); (B) number of effective SSR alleles (Ne); (C) Shannon’s information index (I); (D) expected heterozygosity (He); (E) expected unbiased heterozygosity (uHe); and (F) percentage of polymorphic loci (PPL).
Agronomy 09 00449 g004
Table 1. The 150 sugarcane accessions used in the experiment.
No.AccessionSeriesNo.AccessionSeriesNo.AccessionSeries
1Co1001Co51GZ75-65GN101YC06-92YC
2CP57-614CP52HoCP00-1142CP102YC07-65YC
3CP67-412CP53HoCP00-2218CP103YC07-71YC
4CP72-1210CP54HoCP01-517CP104YC09-13YC
5CP72-2086CP55HoCP01-564CP105YC71-374YC
6CP80-1827CP56HoCP02-610CP106YC94-46YC
7CP81-1254CP57HoCP02-623CP107YC97-24YC
8CP84-1198CP58HoCP03-704CP108YC97-40YC
9CP89-2143CP59HoCP03-708CP109YC98-2YC
10CP93-1382CP60HoCP03-716CP110YC98-27YC
11CP93-1634CP61HoCP05-902CP111YN73-204YN
12CP94-1100CP62HoCP07-612CP112YT00-236YT
13CT89-103CT63HoCP07-613CP113YT00-318YT
14DZ03-83DZ64HoCP07-617CP114YT00-319YT
15DZ05-61DZ65HoCP91-555CP115YT01-120YT
16DZ06-51DZ66HoCP92-648CP116YT01-125YT
17DZ93-88DZ67HoCP93-746CP117YT01-71YT
18FN02-6404FN68HoCP95-988CP118YT03-373YT
19FN02-6427FN69K5K119YT03-393YT
20FN05-2848FN70K86-110K120YT85-177YT
21FN0711FN71LC03-1137LC121YT86-368YT
22FN0712FN72LC03-182LC122YT89-240YT
23FN0713FN73LC04-256LC123YT91-976YT
24FN0717FN74LC05-128LC124YT92-1287YT
25FN91-23FN75LC05-136LC125YT93-124YT
26FN92-4621FN76LC05-291LC126YT93-159YT
27FN95-1702FN77LCP85-384CP127YT94-128YT
28FN99-20169FN78NJ00-118NJ128YT96-86YT
29GN95-108GN79NJ00-15NJ129YT97-20YT
30GT00-122GT80NJ03-218NJ130YT97-76YT
31GT02-1156GT81NJ07-13NJ131YT99-66YT
32GT02-208GT82NJ86-117NJ132YZ02-2540YZ
33GT02-281GT83NJ92-244NJ133YZ02-588YZ
34GT02-467GT84ROC1ROC134YZ03-194YZ
35GT02-761GT85ROC10ROC135YZ07-100YZ
36GT02-901GT86ROC16ROC136YZ07-49YZ
37GT03-11GT87ROC20ROC137YZ89-7YZ
38GT03-1403GT88ROC22ROC138YZ94-343YZ
39GT03-2112GT89ROC23ROC139YZ94-375YZ
40GT03-3005GT90ROC25ROC140YZ99-601YZ
41GT03-3089GT91ROC26ROC141YZ99-91YZ
42GT03-8GT92ROC28ROC142ZZ33YT
43GT03-91GT93YC04-55YC143ZZ41YT
44GT05-3084GT94YC05-64YC144ZZ43YT
45GT05-3595GT95YC06-111YC145ZZ45YT
46GT73-167GT96YC06-140YC146ZZ49YT
47GT89-5GT97YC06-166YC147ZZ50YT
48GT92-66GT98YC06-61YC148ZZ80-101YT
49GT94-119GT99YC06-63YC149ZZ90-76YT
50GT96-154GT100YC06-91YC150ZZ92-126YT
Table 2. The 21 simple sequence repeat (SSR) markers used in this study.
Primer NameType aRepeat MotifPrimer Sequence (5′-3′)Annealing Temperatures (°C)
mSSCIR36G-SSR(GA)18GT
(GA)4
CAACAATAACTTAACTGGTA CTGTCCTTTTTATTCTCTTT52
mSSCIR46G-SSR(GT)10ATGCTCCGCTTCTCACTC
AAGGGGAAAATGAAAACC
52
mSSCIR74G-SSR(CGC)9GCGCAAGCCACACTGAGA ACGCAACGCAAAACAACG56
SCM4E-SSR(CGGAT)4CATTGTTCTGTGCCTGCT
CCGTTTCCCTTCCTTCCC
52
SCM7E-SSR(GCAC)4ACGGTGCTCTTCACTGCT
GGGCATACTTCCTCCTCTAC
60
SCM18E-SSR(ATAC)3CATCAGTATCATTTCATCTTGG
CAGTCACAGTCGGGTAGA
60
SMC1825LAG-SSR(TG)11CACGTCCTTCCGCCTTGA TCATCGTTCGTCGCACTG56
SMC286CSG-SSR(TG)43TCAAATGGGACCTTATTGGAG
TCCCTCGATCTCCGTTGTT
52
SMC477CGG-SSR(CA)31CCAACAACGAATTGTGCATGT
CCTGGTTGGCTACCTGTCTTCA
60
SMC486CGG-SSR(CA)14GAAATTGCCTCCCAGGATTA
CCAACTTGAGAATTGAGATTCG
60
SMC569CSG-SSR(TG)37GCGATGGTTCCTATGCAACTT
TTCGTGGCTGAGATTCACACTA
60
SMC597CSG-SSR(AG)31GCACACCACTCGAATAACGGAT AGTATATCGTCCCTGGCATTCA52
SMC334BSG-SSR(TG)36CAATTCTGACCGTGCAAAGAT
CGATGAGCTTGATTGCGAATG
60
SMC36BUQG-SSR(TTG)7GGGTTTCATCTCTAGCCTACC
TCAGTAGCAGAGTCAGACGCTT
56
SMC7CUQG-SSR(CA)10(C)4GCCAAAGCAAGGGTCACTAGA
AGCTCTATCAGTTGAAACCGA
60
SEGM285G-SSR(GCAC)4AAGAAGAAGACTGAGAAGAACACT
TAGCAACAACTTAATTTAGCAATC
56
UGSM345E-SSR(TG)6CTGTACTGGTATTACATGTGACCT
TCTACTAATCACAAGAGAAGATGC
60
UGSM10E-SSR(GGC)11GCTACTATGGACAACAGGG
ATGAAGAGACGAGACGAAGA
56
UGSuM50E-SSR(TC)14CTACTGCCGAGGAAAGATCG
GGAAAAGTTTGTGGCAAGGA
56
MCSA068G08E-SSR(CAG)6CTAATGCCATGCCCCAGAGG
GCTGGTGATGTCGCCCATCT
56
MCSA176C01E-SSR(GGT)5GAGTCAGTTGGTGCCGAGATTG
GAACAGGTTAAAGCCCATGTC
56
a G-SSR: SSR primer pair designed from genomic sequence; E-SSR: SSR primer pair designed from UniGene or cDNA sequences.
Table 3. Genetic diversity parameters of 150 of the most popular parental clones from sugarcane hybrid breeding programs.
Primer NameAllele (No.)Product Size (bp)Range of PIC a ValuesMean of PIC ValuesPIbRPc
mSSCIR3621127–1680.01–0.380.150.0000017.09
mSSCIR4612146–1770.01–0.370.150.00285813.04
mSSCIR746215–2280.00–0.370.170.0421354.69
SCM42592–2090.01–0.370.170.0000874.16
SCM77155–1880.03–0.370.180.0486723.68
SCM189226–2510.00–0.380.190.0101578.67
SMC1825LA1091–1190.01–0.370.200.0012406.53
SMC286CS13128–1520.01–0.370.210.0004117.31
SMC477CG15115–1340.00–0.360.210.0001254.11
SMC486CG7222–2430.06–0.360.220.0510664.88
SMC569CS6166–2200.04–0.380.240.07133214.05
SMC597CS14143–1660.03–0.370.240.00003410.99
SMC334BS12145–1630.01–0.380.240.0001406.27
SMC36BUQ12103–2510.00–0.370.250.0104487.49
SMC7CUQ7156–1700.00–0.370.260.0241189.76
SEGM28513306–3890.03–0.380.260.00014321.01
UGSM3458320–3340.01–0.380.270.00577213.68
UGSM101097–1250.00–0.380.280.0052899.31
UGSuM506123–1390.05–0.380.280.0230956.24
MCSA068G088179–2020.06–0.380.290.00303515.57
MCSA176C015427–4400.11–0.380.290.02601313.31
a PIC: Polymorphism information content; b PI: Probability of identity; c RP: Resolving power.
Table 4. Gene diversity, Shannon’s information index, percentage of polymorphic loci and series-specific alleles of different series.
SeriesSample SizehaIbPPLcSeries-Specific Alleles
CP290.2390.3610.743SCM7-188, SCM18-238, SMC486CG-225, SMC486CG-233
DZ40.2350.3410.562
FN110.2450.3650.677mSSCIR46-153
GN20.1480.2050.296
GT210.2510.3760.721
LC60.1970.2930.522
NJ60.2050.3020.527SMC36BUQ-125
ROC90.2010.3010.558SMC36BUQ-184, SEGM285-359
K20.1640.2270.327
YC180.2610.3970.805mSSCIR46-146, mSSCIR46-149, SCM7-175, SMC569CS-174, SMC569CS-202, SMC36BUQ-106, SMC36BUQ-132, UGSM10-113
YT290.2540.3860.814SMC36BUQ-105, SMC36BUQ-139
YZ100.2410.3580.650
Mean 0.1760.2610.480
ah, Gene diversity; bI, Shannon’s information index; cPPL, percentage of polymorphic loci.
Table 5. Analysis of molecular variance (AMOVA) of SSR-based genetic variation between and within two sub-populations of Pop1 and Pop2.
Source of VariationDegrees of FreedomSum of SquaresMean Sum of SquaresEstimated Variance Percentage of Variation
Between sub-Pops1546.240546.2406.3085%
Within sub-Pop14818,601.600125.686125.68695%
Total14919,147.840 131.995100%
Fixation IndexFst = 0.048
Gene FlowNm = 4.981

