Genetic Dissection of the Seminal Root System Architecture in Mediterranean Durum Wheat Landraces by Genome-Wide Association Study


Abstract
1. Introduction
2. Materials and Methods
2.1. Plant Material
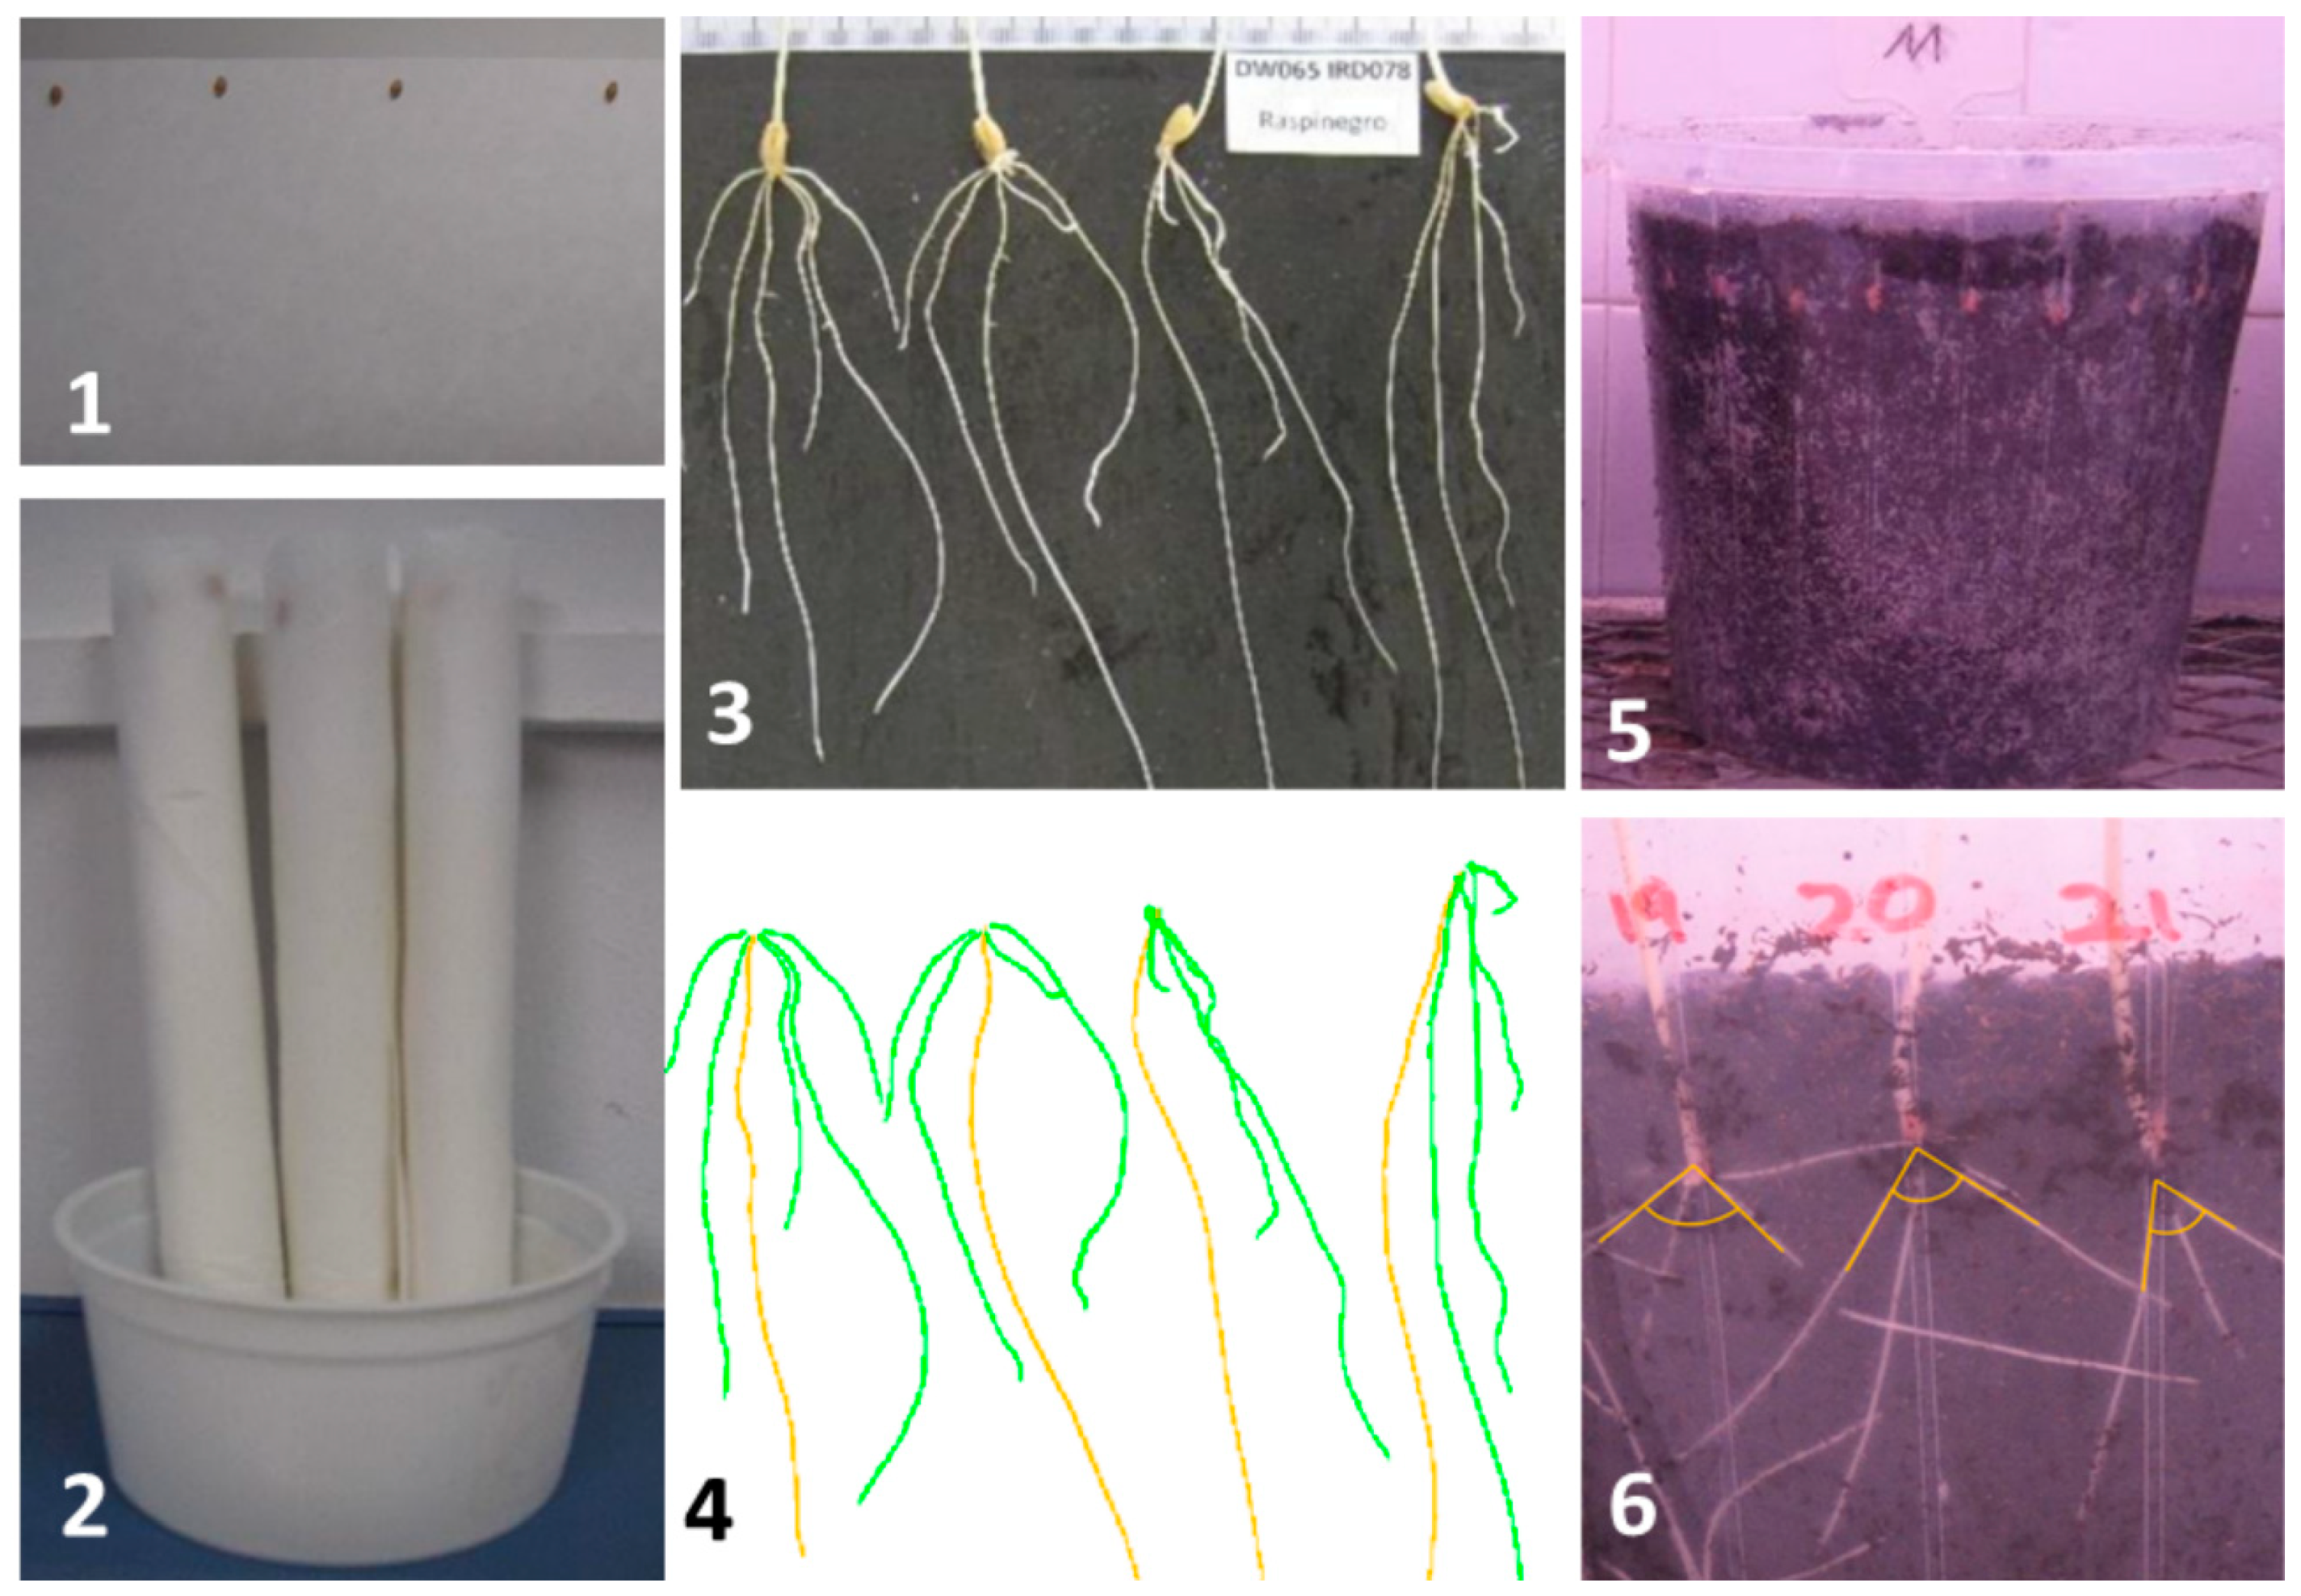
2.2. Phenotyping
2.3. Statistical Analysis
2.4. Genotyping
2.5. Linkage Disequilibrium
2.6. Genome-Wide Association Study
2.7. Gene Annotation
3. Results
3.1. Phenotypic Analyses
3.2. Marker-Trait Associations
3.3. Gene Annotation
4. Discussion
4.1. Phenotypic Variation
4.2. Marker-Trait Associations
5. Conclusions
Supplementary Materials
Author Contributions
Funding
Acknowledgments
Conflicts of Interest
Abbreviations
| BP | Before Present |
| DArTseq | Diversity Arrays Technology sequencing |
| EB + T | Eastern Balkans and Turkey |
| EM | Eastern Mediterranean |
| FDR | False Discovery Rate |
| GWAS | Genome Wide Association Study |
| GY | Grain Yield |
| LRD | Lateral Roots Diameter |
| LRL | Lateral Roots Length |
| LRS | Lateral Roots Surface |
| LRV | Lateral Roots Volume |
| MTA | Marker-Trait Association |
| NGm2 | Number of Grains per square meter |
| NSm2 | Number of Spikes per square meter |
| PAV | Presence/Absence Variants |
| PRD | Primary Root Diameter |
| PRL | Primary Root Length |
| PRS | Primary Root Surface |
| PRV | Primary Root Volume |
| PVE | Phenotypic Variance Explained |
| QTL | Quantitative Trait Loci |
| RSA | Root System Architecture |
| SNP | Single Nucleotide Polymorphism |
| SP | Subpopulation |
| SRA | Seminal Root Angle |
| TKW | Thousand Kernel Weight |
| TRN | Total Root Number |
| WB + E | Western Balkans and Egypt |
| WM | Western Mediterranean |
References
- Feldman, M. Origin of cultivated wheat. In The World Wheat Book: A History of Wheat Breeding; Bonjean, A.P., Angus, W.J., Eds.; Lavoisier Publishing: Paris, France, 2001; pp. 3–56. ISBN 1898298726. [Google Scholar]
- Nazco, R.; Villegas, D.; Ammar, K.; Peña, R.J.; Moragues, M.; Royo, C. Can Mediterranean durum wheat landraces contribute to improved grain quality attributes in modern cultivars? Euphytica 2012, 185, 1–17. [Google Scholar] [CrossRef]
- Lopes, M.S.; El-Basyoni, I.; Baenziger, P.S.; Singh, S.; Royo, C.; Ozbek, K.; Aktas, H.; Ozer, E.; Ozdemir, F.; Manickavelu, A.; et al. Exploiting genetic diversity from landraces in wheat breeding for adaptation to climate change. J. Exp. Bot. 2015, 66, 3477–3486. [Google Scholar] [CrossRef] [PubMed]
- Reynolds, M.P.; Mujeeb-Kazi, A.; Sawkins, M. Prospects for utilising plant-adaptive mechanisms to improve wheat and other crops in drought- and salinity-prone environments. Ann. Appl. Biol. 2005, 146, 239–259. [Google Scholar] [CrossRef]
- Maccaferri, M.; Sanguineti, M.C.; Demontis, A.; El-Ahmed, A.; García del Moral, L.; Maalouf, F.; Nachit, M.; Nserallah, N.; Ouabbou, H.; Rhouma, S.; et al. Association mapping in durum wheat grown across a broad range of water regimes. J. Exp. Bot. 2011, 62, 409–438. [Google Scholar] [CrossRef] [PubMed]
- Royo, C.; García del Moral, L.; Slafer, G.A.; Nachit, M.; Araus, J.L. Selection tools for improving yield-associated physiological traits. In Durum Wheat Breeding: Current Approaches and Future Strategies; Royo, C., Nachit, M.M., Di Fonzo, N., Araus, J., Pfeiffer, W., Slafer, G., Eds.; Food Products Press: New York, NY, USA, 2005; pp. 563–598. [Google Scholar]
- Royo, C.; Villegas, D. Field measurements of canopy spectra for biomass assessment of small-grain cereals. In Biomass—Detection, Production and Usage; Darko, M., Ed.; InTech Open: London, UK, 2011; pp. 27–52. ISBN 978-953-307-492-4. [Google Scholar]
- Tuberosa, R. Phenotyping for drought tolerance of crops in the genomics era. Front. Physiol. 2012, 3, 347. [Google Scholar] [CrossRef] [PubMed]
- Løes, A.-K.; Gahoonia, T.S. Genetic variation in specific root length in Scandinavian wheat and barley accessions. Euphytica 2004, 137, 243–249. [Google Scholar] [CrossRef]
- Manschadi, A.M.; Hammer, G.L.; Christopher, J.T.; Manschadi, A.M.; Hammer, G.L.; Christopher, J.T. Genotypic variation in seedling root architectural traits and implications for drought adaptation in wheat (Triticum aestivum L.). Plant Soil 2008, 303, 115–129. [Google Scholar] [CrossRef]
- Wasson, A.P.; Richards, R.A.; Chatrath, R.; Misra, S.C.; Prasad, S.V.S.; Rebetzke, G.J.; Kirkegaard, J.A.; Christopher, J.; Watt, M. Traits and selection strategies to improve root systems and water uptake in water-limited wheat crops. J. Exp. Bot. 2012, 63, 3485–3498. [Google Scholar] [CrossRef]
- Canè, M.A.; Maccaferri, M.; Nazemi, G.; Salvi, S.; Francia, R.; Colalongo, C.; Tuberosa, R. Association mapping for root architectural traits in durum wheat seedlings as related to agronomic performance. Mol. Breed. 2014, 34, 1629–1645. [Google Scholar] [CrossRef]
- Soriano, J.M.; Álvaro, F. Discovering consensus genomic regions in wheat for root-related traits by QTL meta-analysis. Sci. Rep. 2019, in press. [Google Scholar]
- Sanguineti, M.C.; Li, S.; Maccaferri, M.; Corneti, S.; Rotondo, F.; Chiari, T.; Tuberosa, R. Genetic dissection of seminal root architecture in elite durum wheat germplasm. Ann. Appl. Biol. 2007, 151, 291–305. [Google Scholar] [CrossRef]
- Ayalew, H.; Liu, H.; Börner, A.; Kobiljski, B.; Liu, C.; Yan, G. Genome-wide association mapping of major root length QTLs under PEG induced water stress in wheat. Front. Plant Sci. 2018, 9, 1759. [Google Scholar] [CrossRef] [PubMed]
- Alahmad, S.; El Hassouni, K.; Bassi, F.M.; Dinglasan, E.; Youssef, C.; Quarry, G.; Aksoy, A.; Mazzucotelli, E.; Juhász, A.; Able, J.A.; et al. A major root architecture QTL responding to water limitation in durum wheat. Front. Plant Sci. 2019, 10, 436. [Google Scholar] [CrossRef] [PubMed]
- Beyer, S.; Daba, S.; Tyagi, P.; Bockelman, H.; Brown-Guedira, G.; IWGSC; Mohammadi, M. Loci and candidate genes controlling root traits in wheat seedlings—A wheat root GWAS. Funct. Integr. Genom. 2019, 19, 91–107. [Google Scholar] [CrossRef] [PubMed]
- Li, L.; Peng, Z.; Mao, X.; Wang, J.; Chang, X.; Reynolds, M.; Jing, R. Genome-wide association study reveals genomic regions controlling root and shoot traits at late growth stages in wheat. Ann. Bot. 2019, 1–14. [Google Scholar] [CrossRef]
- Soriano, J.; Villegas, D.; Aranzana, M.; García del Moral, L.; Royo, C. Genetic structure of modern durum wheat cultivars and mediterranean landraces matches with their agronomic performance. PLoS ONE 2016, 11, e0160983. [Google Scholar] [CrossRef] [PubMed]
- Rahnama, A.; Munns, R.; Poustini, K.; Watt, M. A screening method to identify genetic variation in root growth response to a salinity gradient. J. Exp. Bot. 2011, 62, 69–77. [Google Scholar] [CrossRef] [PubMed]
- Watt, M.; Moosavi, S.; Cunningham, S.C.; Kirkegaard, J.A.; Rebetzke, G.J.; Richards, R.A. A rapid, controlled-environment seedling root screen for wheat correlates well with rooting depths at vegetative, but not reproductive, stages at two field sites. Ann. Bot. 2013, 112, 447–455. [Google Scholar] [CrossRef] [PubMed]
- Lobet, G.; Pagès, L.; Draye, X. A Novel image-analysis toolbox enabling quantitative analysis of root system architecture. Breakthr. Technol. 2011, 157, 29–39. [Google Scholar] [CrossRef] [PubMed]
- Richard, C.A.I.; Hickey, L.T.; Fletcher, S.; Jennings, R.; Chenu, K.; Christopher, J.T. High-throughput phenotyping of seminal root traits in wheat. Plant Methods 2015, 11, 13. [Google Scholar] [CrossRef] [PubMed]
- Abramoff, M.D.; Magalhaes, P.J.; Ram, S.J. Image Processing with ImageJ. Biophotonics Int. 2004, 11, 36–42. [Google Scholar]
- Roselló, M.; Villegas, D.; Álvaro, F.; Soriano, J.M.; Lopes, M.S.; Nazco, R.; Royo, C. Unravelling the relationship between adaptation pattern and yield formation strategies in Mediterranean durum wheat landraces. Eur. J. Agron. 2019, 107, 43–52. [Google Scholar] [CrossRef]
- Tukey, J.W. Comparing individual means in the analysis of variance. Biometrics 1949, 5, 99–114. [Google Scholar] [CrossRef] [PubMed]
- Little, R.; Milliken, G.; Stroup, W.; Wolfinger, R. SAS system for mixed models. Technometrics 1997, 39, 344. [Google Scholar]
- SAS Institute. SAS Enterprise Guide; SAS Institute: Cary, NC, USA, 2014. [Google Scholar]
- Doyle, J.; Doyle, J. A rapid DNA isolation procedure for small quantities of fresh leaf tissue. Phytochem. Bull. 1987, 19, 11–15. [Google Scholar]
- Sansaloni, C.; Petroli, C.; Jaccoud, D.; Carling, J.; Detering, F.; Grattapaglia, D.; Kilian, A. Diversity arrays technology (DArT) and next-generation sequencing combined: Genome-wide, high throughput, highly informative genotyping for molecular breeding of Eucalyptus. BMC Proc. 2011, 5, 54. [Google Scholar] [CrossRef]
- Bradbury, P.J.; Zhang, Z.; Kroon, D.E.; Casstevens, T.M.; Ramdoss, Y.; Buckler, E.S. TASSEL: Software for association mapping of complex traits in diverse samples. Bioinformatics 2007, 23, 2633–2635. [Google Scholar] [CrossRef] [PubMed]
- Benjamini, Y.; Hochberg, Y. Controlling the false discovery rate: A practical and powerful approach to multiple testing. J. R. Stat. Soc. 1995, 57, 289–300. [Google Scholar] [CrossRef]
- Voorrips, R.E. MapChart: Software for the graphical presentation of linkage maps and QTLs. J. Hered. 2002, 93, 77–78. [Google Scholar] [CrossRef]
- IWGSC. Shifting the limits in wheat research and breeding using a fully annotated reference genome. Science 2018, 361, eaar7191. [Google Scholar] [CrossRef]
- Mwadzingeni, L.; Shimelis, H.; Rees, D.J.G.; Tsilo, T.J. Genome-wide association analysis of agronomic traits in wheat under drought-stressed and non-stressed conditions. PLoS ONE 2017, 12, e0171692. [Google Scholar] [CrossRef] [PubMed]
- Wang, S.-X.; Zhu, Y.-L.; Zhang, D.-X.; Shao, H.; Liu, P.; Hu, J.-B.; Zhang, H.; Zhang, H.-P.; Chang, C.; Lu, J.; et al. Genome-wide association study for grain yield and related traits in elite wheat varieties and advanced lines using SNP markers. PLoS ONE 2017, 12, e0188662. [Google Scholar] [CrossRef] [PubMed]
- Mangini, G.; Gadaleta, A.; Colasuonno, P.; Marcotuli, I.; Signorile, A.M.; Simeone, R.; De Vita, P.; Mastrangelo, A.M.; Laidò, G.; Pecchioni, N.; et al. Genetic dissection of the relationships between grain yield components by genome-wide association mapping in a collection of tetraploid wheats. PLoS ONE 2018, 13, e0190162. [Google Scholar] [CrossRef] [PubMed]
- Sukumaran, S.; Reynolds, M.P.; Sansaloni, C. Genome-wide association analyses identify QTL hotspots for yield and component traits in durum wheat grown under yield potential, drought, and heat stress environments. Front. Plant Sci. 2018, 9, 81. [Google Scholar] [CrossRef] [PubMed]
- Christopher, J.; Christopher, M.; Jennings, R.; Jones, S.; Fletcher, S.; Borrell, A.; Manschadi, A.M.; Jordan, D.; Mace, E.; Hammer, G. QTL for root angle and number in a population developed from bread wheats (Triticum aestivum) with contrasting adaptation to water-limited environments. Theor. Appl. Genet. 2013, 126, 1563–1574. [Google Scholar] [CrossRef] [PubMed]
- Paez-García, A.; Motes, C.; Scheible, W.-R.; Chen, R.; Blancaflor, E.; Monteros, M. Root traits and phenotyping strategies for plant improvement. Plants 2015, 4, 334–355. [Google Scholar] [CrossRef] [PubMed]
- Ruiz, M.; Giraldo, P.; González, J.M. Phenotypic variation in root architecture traits and their relationship with eco-geographical and agronomic features in a core collection of tetraploid wheat landraces (Triticum turgidum L.). Euphytica 2018, 214, 54. [Google Scholar] [CrossRef]
- Royo, C.; Nazco, R.; Villegas, D. The climate of the zone of origin of Mediterranean durum wheat (Triticum durum Desf.) landraces affects their agronomic performance. Genet. Resour. Crop Evol. 2014, 61, 1345–1358. [Google Scholar] [CrossRef]
- Dedkova, O.S.; Badaeva, E.D.; Amosova, A.V.; Martynov, S.P.; Ruanet, V.V.; Mitrofanova, O.P.; Pukhal’skiy, V.A. Diversity and the origin of the European population of Triticum dicoccum (Schrank) Schuebl. As revealed by chromosome analysis. Russ. J. Genet. 2009, 45, 1082–1091. [Google Scholar] [CrossRef]
- Roselló, M.; Royo, C.; Sansaloni, C.; Soriano, J.M. GWAS for yield and related traits under rainfed mediterranean environments revealed different genetic architecture in pre- and post-green revolution durum wheat collections. Front. Plant Sci. 2019, in press. [Google Scholar]
- Lei, L.; Li, S.; Gu, Y. Cellulose synthase complexes: Composition and regulation. Front. Plant Sci. 2012, 3, 75. [Google Scholar] [CrossRef] [PubMed]
- Zhu, X.F.; Sun, Y.; Zhang, B.C.; Mansoori, N.; Wan, J.X.; Liu, Y.; Wang, Z.W.; Shi, Y.Z.; Zhou, Y.H.; Zheng, S.J. Trichome Birefringence-Like27 affects aluminum sensitivity by modulating the O-acetylation of xyloglucan and aluminum-binding capacity in Arabidopsis. Plant Physiol. 2014, 166, 181–189. [Google Scholar] [CrossRef] [PubMed]
- Hua, Z.; Vierstra, R.D. The cullin-RING ubiquitin-protein ligases. Annu. Rev. Plant Biol. 2011, 62, 299–334. [Google Scholar] [CrossRef] [PubMed]
- Li, Q.; Wang, W.; Wang, W.; Zhang, G.; Liu, Y.; Wang, Y.; Wang, W. Wheat f-box protein gene TaFBA1 is involved in plant tolerance to heat stress. Front. Plant Sci. 2018, 9, 521. [Google Scholar] [CrossRef] [PubMed]
- Zhang, S.J.; Song, G.Q.; Li, Y.L.; Gao, J.; Liu, J.J.; Fan, Q.Q.; Huang, C.Y.; Sui, X.X.; Chu, X.S.; Guo, D.; et al. Cloning of 9-cis-epoxycarotenoid dioxygenase gene (TaNCED1) from wheat and its heterologous expression in tobacco. Biol. Plant. 2014, 58, 89–98. [Google Scholar] [CrossRef]
- Gao, J.; Lan, T. Functional characterization of the late embryogenesis abundant (LEA) protein gene family from Pinus tabuliformis (Pinaceae) in Escherichia coli. Sci. Rep. 2016, 6, 19467. [Google Scholar] [CrossRef]
- Sornaraj, P.; Luang, S.; Lopato, S.; Hrmova, M. Basic leucine zipper (bZIP) transcription factors involved in abiotic stresses: A molecular model of a wheat bZIP factor and implications of its structure in function. Biochim. Biophys. Acta 2016, 1860, 46–56. [Google Scholar] [CrossRef]
- Zhang, W.; Chen, S.; Abate, Z.; Nirmala, J.; Rouse, M.N.; Dubcovsky, J. Identification and characterization of Sr13, a tetraploid wheat gene that confers resistance to the Ug99 stem rust race group. Proc. Natl. Acad. Sci. USA 2017, 114, E9483–E9492. [Google Scholar] [CrossRef]
- He, L.; Jing, Y.; Shen, J.; Li, X.; Liu, H.; Geng, Z.; Wang, M.; Li, Y.; Chen, D.; Gao, J.; et al. Mitochondrial pyruvate carriers prevent cadmium toxicity by sustaining the TCA cycle and glutathione synthesis. Plant Physiol. 2019, 180, 198–211. [Google Scholar] [CrossRef]
- Ranocha, P.; Dima, O.; Nagy, R.; Felten, J.; Corratgé-Faillie, C.; Novák, O.; Morreel, K.; Lacombe, B.; Martinez, Y.; Pfrunder, S.; et al. Arabidopsis WAT1 is a vacuolar auxin transport facilitator required for auxin homoeostasis. Nat. Commun. 2013, 4, 2625. [Google Scholar] [CrossRef]


| Source of Variation | df | TRN | SRA | PRL | LRL | PRS | LRS | PRV | LRV | PRD | LRD |
|---|---|---|---|---|---|---|---|---|---|---|---|
| Genotype | 158 | 84.1 *** | 69.4 *** | 87.0 *** | 86.8 *** | 85.3 *** | 86.1 *** | 82.9 *** | 86.8 *** | 63.41 *** | 90.57 *** |
| Between subpopulations | 4 | 30.5 *** | 16.6 *** | 15.4 *** | 22.7 *** | 11.6 *** | 18.5 *** | 8.5 ** | 12.7 *** | 10.44 ** | 17.96 *** |
| Within subpopulations | 154 | 70.1 *** | 83.4 *** | 85.0 *** | 77.8 *** | 88.6 *** | 82.0 *** | 91.5 *** | 87.6 *** | 89.33 ** | 81.87 *** |
| Replicate | 1 | 0.001 | 1.83 ** | 0.00 | 0.43 * | 0.36 * | 0.36 * | 0.86 ** | 0.33 ** | 1.35 * | 0.12 |
| Error | 157 | 15.9 | 28.8 | 13.0 | 12.9 | 14.3 | 13.6 | 16.1 | 12.9 | 35.25 | 9.33 |
| Total | 316 |
| TRN | SRA | PRL | LRL | PRS | LRS | PRV | LRV | PRD | LRD | |
|---|---|---|---|---|---|---|---|---|---|---|
| EM | 4.8 b | 94.7 ab | 13.8 a | 25.1 a | 2.5 a | 4.6 a | 38.3 a | 67.2 a | 0.57 b | 0.57 b |
| EB + T | 4.8 b | 98.2 a | 10.3 c | 17.2 b | 1.9 c | 3.2 b | 28.5 b | 47.6 b | 0.57 b | 0.58 b |
| WB + E | 4.3 c | 87.6 bc | 10.4 c | 16.5 b | 2.1 bc | 3.2 b | 33.6 ab | 52.3 b | 0.61 a | 0.62 a |
| WM | 5.2 a | 84.5 c | 11.8 ab | 23.5 a | 2.2 bc | 4.3 a | 33.0 ab | 63.9 a | 0.58 b | 0.58 b |
| Modern | 4.5 bc | 93.9 ab | 12.8 ab | 20.8 ab | 2.4 ab | 3.7 ab | 35.2 ab | 54.5 ab | 0.56 b | 0.57 b |
| MTA-QTLs | Chromosome | Position (cM) | MTAs | Trait |
|---|---|---|---|---|
| mtaq-1A.1 | 1A | 9.24 | 1 | SRA |
| mtaq-1A.2 | 1A | 29.71 | 4 | PRS PRV LRV PRD |
| mtaq-1A.3 | 1A | 88.15 | 1 | LRD |
| mtaq-1A.4 | 1A | 135.37 | 2 | LRS LRV |
| mtaq-1A.5 | 1A | 160.75–163.11 | 3 | PRV |
| mtaq-1A.6 | 1A | 173.41 | 3 | PRS PRV PRD |
| mtaq-1A.7 | 1A | 231.76 | 1 | LRL |
| mtaq-1A.8 | 1A | 246.3 | 1 | LRD |
| mtaq-1B.1 | 1B | 31.69 | 1 | PRV |
| mtaq-1B.2 | 1B | 45.68 | 1 | TRN |
| mtaq-1B.3 | 1B | 51.29 | 1 | LRD |
| mtaq-1B.4 | 1B | 90.37 | 1 | TRN |
| mtaq-1B.5 | 1B | 196.56 | 3 | LRL LRS LRV |
| mtaq-1B.6 | 1B | 199.9–201.49 | 3 | LRS LRV LRD |
| mtaq-1B.7 | 1B | 223.51–227.36 | 12 | PRL PRS PRV LRD |
| mtaq-2A.1 | 2A | 31.13 | 1 | LRD |
| mtaq-2A.2 | 2A | 46.78 | 1 | PRV |
| mtaq-2A.3 | 2A | 68.39–68.96 | 4 | LRL PRS PRV |
| mtaq-2A.4 | 2A | 115.8–118.32 | 4 | SRA PRD |
| mtaq-2B.1 | 2B | 6.7 | 2 | PRD LRD |
| mtaq-2B.2 | 2B | 75.09–75.13 | 13 | LRL LRS LRV |
| mtaq-2B.3 | 2B | 80.79–83.84 | 16 | LRL LRS LRV |
| mtaq-2B.4 | 2B | 106.98–107.03 | 8 | TRN PRL LRL PRS LRS PRV LRV |
| mtaq-3A.1 | 3A | 3.32–3.58 | 3 | PRV |
| mtaq-3A.2 | 3A | 11.88–12.93 | 2 | TRN LRD |
| mtaq-3A.3 | 3A | 18.37–20.39 | 3 | SRA PRV |
| mtaq-3A.4 | 3A | 23.99 | 1 | TRN |
| mtaq-3A.5 | 3A | 40.97 | 1 | PRD |
| mtaq-3A.6 | 3A | 48.06–49.67 | 3 | PRV LRD |
| mtaq-3A.7 | 3A | 61.57 | 2 | LRS LRV |
| mtaq-3B.1 | 3B | 24.98–25 | 2 | TRN |
| mtaq-3B.2 | 3B | 50.7 | 1 | LRL |
| mtaq-3B.3 | 3B | 68.36 | 4 | PRS PRV LRV |
| mtaq-3B.4 | 3B | 96.48 | 1 | PRD |
| mtaq-3B.5 | 3B | 100.07–101.44 | 3 | PRS PRV |
| mtaq-3B.6 | 3B | 112.86 | 4 | LRD |
| mtaq-3B.7 | 3B | 115.61 | 3 | PRL PRS PRV |
| mtaq-4A.1 | 4A | 20.42–26.03 | 2 | LRS LRV |
| mtaq-4A.2 | 4A | 26.03 | 1 | LRL |
| mtaq-4A.3 | 4A | 28.85–28.87 | 2 | SRA |
| mtaq-4A.4 | 4A | 74.09 | 2 | PRV |
| mtaq-4A.5 | 4A | 96.08 | 2 | PRV |
| mtaq-4A.6 | 4A | 109.72 | 1 | PRS |
| mtaq-4A.7 | 4A | 127.56 | 1 | LRL |
| mtaq-4A.8 | 4A | 131.42–132.72 | 2 | LRL PRD |
| mtaq-4B.1 | 4B | 2.79 | 1 | PRS |
| mtaq-4B.2 | 4B | 31.93 | 4 | PRS PRV |
| mtaq-4B.3 | 4B | 51.22 | 3 | PRL PRS |
| mtaq-4B.4 | 4B | 70.04 | 1 | LRL |
| mtaq-5A.1 | 5A | 38.83 | 1 | PRL |
| mtaq-5A.2 | 5A | 40.51 | 1 | PRD |
| mtaq-5A.3 | 5A | 48.57–48.65 | 2 | TRN LRV |
| mtaq-5A.4 | 5A | 69.82 | 1 | TRN |
| mtaq-5A.5 | 5A | 84.51 | 5 | SRA PRL PRS PRD |
| mtaq-5A.6 | 5A | 112.96 | 1 | PRD |
| mtaq-5A.7 | 5A | 155.41 | 1 | PRD |
| mtaq-5B.1 | 5B | 33.99 | 1 | LRV |
| mtaq-5B.2 | 5B | 40.83 | 1 | PRV |
| mtaq-5B.3 | 5B | 65.51 | 2 | PRV LRV |
| mtaq-5B.4 | 5B | 111.15 | 1 | PRD |
| mtaq-5B.5 | 5B | 120.34 | 2 | LRS LRV |
| mtaq-5B.6 | 5B | 135.45 | 1 | LRV |
| mtaq-5B.7 | 5B | 138.69 | 4 | PRL PRS |
| mtaq-5B.8 | 5B | 142.12 | 1 | PRV |
| mtaq-6A.1 | 6A | 7.11 | 1 | TRN |
| mtaq-6A.2 | 6A | 11.95–14.24 | 8 | LRS PRV LRV |
| mtaq-6A.3 | 6A | 27.82–28.69 | 3 | SRA PRS PRV |
| mtaq-6A.4 | 6A | 42.36 | 3 | SRA PRV |
| mtaq-6A.5 | 6A | 48.39–50.08 | 2 | SRA |
| mtaq-6A.6 | 6A | 98.51–98.82 | 2 | TRN PRS |
| mtaq-6B.1 | 6B | 2.41–3.31 | 5 | SRA LRL LRS |
| mtaq-6B.2 | 6B | 14.26 | 1 | TRN |
| mtaq-6B.3 | 6B | 31.49–33.46 | 3 | LRV PRD LRD |
| mtaq-6B.4 | 6B | 53.66 | 1 | LRL |
| mtaq-7A.1 | 7A | 5.7–9.43 | 15 | SRA LRV PRD |
| mtaq-7A.2 | 7A | 16.28 | 1 | LRL |
| mtaq-7A.3 | 7A | 47.85 | 3 | TRN LRS LRV |
| mtaq-7A.4 | 7A | 92.69–94.34 | 2 | TRN PRL |
| mtaq-7A.5 | 7A | 145.94–150.31 | 11 | TRN |
| mtaq-7B.1 | 7B | 24.48 | 2 | PRV LRV |
| mtaq-7B.2 | 7B | 74.86–75.24 | 2 | SRA LRL |
| mtaq-7B.3 | 7B | 97.45 | 2 | TRN PRV |
| Trait | Phenotype | Marker | Chromosome | Position | R2 | Most Frequent Allele | |||||
|---|---|---|---|---|---|---|---|---|---|---|---|
| Mean | UP 10th | LOW 10th | UP | Frequency | LOW | Frequency | |||||
| TRN (N) | 4.9 | 5.8 a | 3.7 b | 2260740_SNP | 7A | 148.38 | 0.09 | T | 0.80 | C | 0.81 |
| 1252655_PAV | 7B | 97.45 | 0.11 | 1 | 0.94 | 0 | 0.67 | ||||
| SRA (°) | 88.5 | 111.0 a | 67.1 b | 1125557_PAV | 2A | 115.80 | 0.09 | 0 | 1.00 | 1 | 1.00 |
| 1117775_PAV | 2A | 118.32 | 0.10 | 1 | 0.75 | 0 | 0.71 | ||||
| LRL (cm) | 21.8 | 36.5 a | 9.3 b | 4408432_PAV | 6B | 3.31 | 0.09 | 1 | 0.88 | 0 | 0.73 |
| 4408958_PAV | 6B | 3.31 | 0.09 | 1 | 0.88 | 0 | 0.73 | ||||
| 1098568_PAV | 6B | 53.66 | 0.08 | 1 | 0.77 | 0 | 0.86 | ||||
| PRS (cm2) | 2.2 | 3.2 a | 1.3 b | 4406631_PAV | 4B | 31.93 | 0.09 | 0 | 0.71 | 0 | 0.86 |
| 4406980_PAV | 4B | 31.93 | 0.09 | 1 | 0.71 | 1 | 0.86 | ||||
| LRS (cm2) | 4.0 | 6.5 a | 1.8 b | 1201756_PAV | 2B | 107.03 | 0.15 | 1 | 1.00 | 0 | 0.73 |
| 987263_PAV | 3A | 61.57 | 0.10 | 0 | 0.92 | 1 | 0.88 | ||||
| 4408432_PAV | 6B | 3.31 | 0.09 | 1 | 0.81 | 0 | 0.79 | ||||
| 4408958_PAV | 6B | 3.31 | 0.09 | 1 | 0.81 | 0 | 0.79 | ||||
| PRV (mm3) | 33.7 | 49.8 a | 20.2 b | 997799_SNP | 1B | 31.69 | 0.12 | A | 0.86 | G | 0.77 |
| 1201756_PAV | 2B | 107.03 | 0.11 | 1 | 0.87 | 0 | 0.71 | ||||
| 4406631_PAV | 4B | 31.93 | 0.09 | 0 | 0.93 | 1 | 0.87 | ||||
| 4406980_PAV | 4B | 31.93 | 0.09 | 0 | 0.93 | 1 | 0.87 | ||||
| LRV (mm3) | 60.5 | 99 a | 27.7 b | 1201756_PAV | 2B | 107.03 | 0.15 | 1 | 0.94 | 0 | 0.73 |
| 987263_PAV | 3A | 61.57 | 0.10 | 0 | 0.93 | 1 | 0.81 | ||||
| 1126050_SNP | 5B | 33.99 | 0.07 | A | 0.81 | M | 0.81 | ||||
| 1149356_PAV | 7B | 24.48 | 0.08 | 0 | 0.87 | 1 | 0.81 | ||||
| PRD (mm) | 0.58 | 0.66 a | 0.48 b | 1113225_SNP | 5A | 84.51 | 0.09 | G | 0.87 | C | 0.92 |
| 1864057_SNP | 6B | 33.46 | 0.07 | C | 0.81 | M | 0.81 | ||||
| LRD (mm) | 0.58 | 0.66 a | 0.51 b | 4005012_PAV | 1B | 51.29 | 0.10 | 0 | 0.67 | 1 | 0.93 |
| DArTseq Marker | MTA-QTL | Gene Model | Position | Description |
|---|---|---|---|---|
| 1109244_SNP | mtaq-1A.5 | TraesCS1A01G363600 | 540.1 | Jacalin lectin family protein |
| 1210090_SNP | mtaq-1A.7 | TraesCS1A01G424800 | 579.8 | Cellulose synthase |
| 997799_SNP | mtaq-1B.1 | TraesCS1B01G022500 | 10.1 | Protein trichome birefringence |
| 1003552_SNP | mtaq-1B.7 | TraesCS1B01G430400 | 654.8 | F-box domain protein |
| 1085277_SNP * | mtaq-2A.3 | TraesCS2A01G250600 | 378.4 | 9-cis-epoxycarotenoid dioxygenase |
| 1083104_SNP | mtaq-2A.3 | TraesCS2A01G281000 | 469.4 | Dynamin-like family protein |
| 1117775_PAV | mtaq-2A.4 | TraesCS2A01G541700 | 752.9 | LEA hydroxyproline-rich glycoprotein family |
| 1075469_SNP | mtaq-2B.1 | TraesCS2B01G004500 | 2.4 | Cytochrome P450 family protein |
| 1256467_PAV | mtaq-3A.1 | TraesCS3A01G018600 | 11.5 | F-box domain protein |
| 1082068_PAV | mtaq-3A.2 | TraesCS3A01G034100 | 19.3 | Receptor-like kinase |
| 1130621_PAV | mtaq-3A.5 | TraesCS3A01G132300 | 108.9 | Blue copper protein |
| 987263_PAV * | mtaq-3A.7 | TraesCS3A01G393600 | 641.6 | Pectin lyase-like superfamily protein |
| 1101009_SNP | mtaq-3B.4 | TraesCS3B01G516800 | 759.9 | Ribosomal protein S4 |
| 3034109_PAV | mtaq-4A.6 | TraesCS4A01G419000 | 688.9 | Histone acetyltransferase of the CBP family 5 |
| 1250077_PAV * | mtaq-4B.3 | TraesCS4B01G345800 | 639.4 | Basic helix-loop-helix DNA-binding protein |
| 1240561_PAV | mtaq-6A.3 | TraesCS6A01G041500 | 21.7 | Transmembrane protein 97 |
| 1047867_PAV | mtaq-6A.3 | TraesCS6A01G415600 | 615.3 | Cobyric acid synthase |
| 1105573_PAV | mtaq-6A.5 | TraesCS6A01G242300 | 453.9 | 50S ribosomal protein L19 |
| 989287_PAV * | mtaq-6A.6 | TraesCS6A01G417400 | 615.8 | F-box domain protein |
| 1129380_PAV * | mtaq-6B.1 | TraesCS6B01G000200 | 0.1 | NBS-LRR resistance-like protein |
| 1864057_SNP * | mtaq-6B.3 | TraesCS6B01G335600 | 590.9 | Hexosyltransferase |
| 1098568_PAV * | mtaq-6B.4 | TraesCS6B01G399700 | 675.2 | bZIP transcription factor family protein |
| 1130796_PAV | mtaq-7A.1 | TraesCS7A01G015100 | 0.0 | Mitochondrial pyruvate carrier |
| 2253648_PAV | mtaq-7A.1 | TraesCS7A01G016700 | 7.3 | Transmembrane protein DUF594 |
| 1139027_PAV | mtaq-7A.1 | TraesCS7A01G015400 | 6.7 | Signal peptidase complex catalytic subunit SEC11 |
| 1076865_PAV | mtaq-7A.1 | TraesCS7A01G024800 | 9.7 | WAT1-related protein |
| 1059554_SNP * | mtaq-7A.3 | TraesCS7A01G100600 | 61.8 | GDSL esterase/lipase |
| 1665955_PAV | mtaq-7A.4 | TraesCS7A01G442400 | 636.7 | BTB/POZ domain |
| 1149356_PAV | mtaq-7B.1 | TraesCS7B01G058300 | 60.6 | Glutamate receptor |
| 1075278_SNP | mtaq-7B.2 | TraesCS7B01G378200 | 642.6 | Receptor-like kinase |
| 1252655_PAV | mtaq-7B.3 | TraesCS7B01G421300 | 690.2 | NBS-LRR resistance-like protein |
© 2019 by the authors. Licensee MDPI, Basel, Switzerland. This article is an open access article distributed under the terms and conditions of the Creative Commons Attribution (CC BY) license (http://creativecommons.org/licenses/by/4.0/).
Share and Cite
Roselló, M.; Royo, C.; Sanchez-Garcia, M.; Soriano, J.M. Genetic Dissection of the Seminal Root System Architecture in Mediterranean Durum Wheat Landraces by Genome-Wide Association Study. Agronomy 2019, 9, 364. https://doi.org/10.3390/agronomy9070364
Roselló M, Royo C, Sanchez-Garcia M, Soriano JM. Genetic Dissection of the Seminal Root System Architecture in Mediterranean Durum Wheat Landraces by Genome-Wide Association Study. Agronomy. 2019; 9(7):364. https://doi.org/10.3390/agronomy9070364
Chicago/Turabian StyleRoselló, Martina, Conxita Royo, Miguel Sanchez-Garcia, and Jose Miguel Soriano. 2019. "Genetic Dissection of the Seminal Root System Architecture in Mediterranean Durum Wheat Landraces by Genome-Wide Association Study" Agronomy 9, no. 7: 364. https://doi.org/10.3390/agronomy9070364
APA StyleRoselló, M., Royo, C., Sanchez-Garcia, M., & Soriano, J. M. (2019). Genetic Dissection of the Seminal Root System Architecture in Mediterranean Durum Wheat Landraces by Genome-Wide Association Study. Agronomy, 9(7), 364. https://doi.org/10.3390/agronomy9070364