Next Article in Journal
Effect of Organic Fertilizers on Antioxidant Activity and Bioactive Compounds of Fenugreek Seeds in Intercropped Systems with Buckwheat
Next Article in Special Issue
Potato Germplasm Enhancement Enters the Genomics Era
Previous Article in Journal
Erratum: Prats-Llinàs, M.T., et al. Post-Harvest Regulated Deficit Irrigation in Chardonnay Did Not Reduce Yield but at Long-Term, It Could Affect Berry Composition. Agronomy 2019, 9, 328
 
 
Erratum published on 8 April 2020, see Agronomy 2020, 10(4), 532.
Article

Chromosomes I and X Harbor Consistent Genetic Factors Associated with the Anthocyanin Variation in Potato

1
Departamento de Agronomía, Facultad de Ciencias Agrarias, Universidad Nacional de Colombia—sede Bogotá, Carrera 30 No. 45-03, Building 500, Bogotá 111321, Colombia
2
Departamento de Biología, Facultad de Ciencias, Universidad Nacional de Colombia—sede Bogotá, Carrera 30 No. 45-03, Building 421, Bogotá 111321, Colombia
*
Author to whom correspondence should be addressed.
Agronomy 2019, 9(7), 366; https://doi.org/10.3390/agronomy9070366
Submission received: 19 March 2019 / Revised: 24 May 2019 / Accepted: 15 June 2019 / Published: 10 July 2019
(This article belongs to the Special Issue Potato Genetics and Breeding in the Genomics Era)

Abstract

:
Potatoes are an important staple food worldwide and are the third main source of antioxidants in the human diet. One of the most important antioxidant compounds in potatoes is the anthocyanin pigments. Some reports indicate a high positive correlation between color intensity, anthocyanins content, and antioxidant level in potato tubers. The variation in anthocyanins composition and content in potato tubers among diverse germplasm sources has important nutritional and health implications and constitutes an interesting trait for potato breeding programs focused on enhancing the anthocyanin and antioxidant contents of potato materials. We identified and quantified five anthocyanidins (delphinidin, cyanidin, petunidin, pelargonidin, and peonidin) on tubers from the Colombian germplasm collection of Solanum tuberosum L. Group Phureja. The phenotypic data were merged into a genome-wide association study in order to identify genomic regions associated with the nutritional compounds’ variation in potatoes. The association was conducted using a 7520 single nucleotide polymorphisms markers matrix. Seven quantitative trait loci were identified. Chromosomes I and X harbored the most stable quantitative trait loci (QTL). Three quantitative trait loci were identified close to previously reported genes involved in the regulation of anthocyanins in potato tubers. The genomic regions of these QTL reveal presumptive candidate genes as genetic factors that are the basis for a better understanding of the genetic architecture of the regulation of nutritional compounds in potatoes.

1. Introduction

Potato (Solanum tuberosum L.) is a basic non-cereal crop worldwide [1] and constitutes the third most important source of antioxidants in human diets [2,3], therefore, it plays an important role in food security and nutrition around the world [4,5]. The main diverse wild potatoes are found in the Andes natural region of South America [6,7]. Recent evidence suggests that the Solanum tuberosum Group Phureja, a cultivated potato group, which is mainly comprised of diploid genotypes, contains higher nutritional value than other potato species [8,9,10]. These potatoes possess a wide variability in important nutritional traits, flesh and skin colors from yellow to purple [8,11,12,13], and contain health-promoting compounds such as polyphenols, including anthocyanins, and carotenoids [14,15,16,17]. In recent years, there has been an increasing interest in potatoes with red and purple flesh or skin, and they have attracted the attention of researchers, as well as consumers, due to their antioxidant properties, taste, and appearance [18,19,20,21]. The antioxidant activity in red or purple potatoes is associated with the presence and concentration of anthocyanin pigments [22,23,24,25]. Anthocyanins are phenolic secondary metabolites, belonging to the group of flavonoids, and are responsible for the red to purple colors of plant tissues [26]. Chemically, anthocyanins are glucosides and acylglucosides of anthocyanidins, that is, they are compounds with an anthocyanidin molecule or aglycone, linked to a sugar by a β-glucosidic bond [26]. Like other phenolic compounds, anthocyanins are involved in a series of essential biological processes, such as antioxidative protection against reactive oxygen species and in signaling the response to biotic and abiotic stresses [27]. Some studies have also reported the potential health benefits of consuming anthocyanin-pigmented potatoes to provide protection against several diseases [3,15,28,29,30]. Given the substantial variation of levels of anthocyanins in tubers [22,31,32,33,34] from potato landraces, it should be possible to exploit this genetic diversity using marker-assisted selection programs that target specific anthocyanins.
The cytosol-located anthocyanin biosynthetic pathway enzymes are encoded by a series of well described genes in various plant systems: snapdragon (Antirrhinum majus L.), maize (Zea mays L.), petunia (Petunia × hybrida Hort.) [35,36,37], and potato [38,39,40]. An early study conducted in tetraploid potatoes (Solanum tuberosum L.) identified three loci—D (developer), R (red), and P (purple)—that determine variation in the color of potato tubers [41]. A parallel three-gene system, but using the gene symbols I (inhibitor), R, and P, was subsequently described in diploid potatoes [40,42], implying that D is equivalent to I [43]. The Pf gene for pigmented flesh was identified in cultivated diploids “which is closely linked to I” [43]. The loci I, R, and P have been mapped on chromosomes X, II, and XI, respectively [38]. The R locus co-segregates with dihydroflavonol 4-reductase (dfr) and is required to produce red pelargonidin-based pigments [44]. Locus P is required for the production of purple delphinidin-based pigments, and corresponds to flavonoid 3′,5′-hydroxylase (f3′5′h) activity [45], while locus I is required for tissue-specific expression in the tuber skin, and corresponds to the potato ortholog of Petunia an2, an Myb domain transcription factor (R2R3MYB regulator) and it maps on the chromosome X [39].
Additional regulatory elements of the anthocyanin pathway genes expression are controlled by a complex of MYB transcription factors (TFs), basic helixloop-helix (bHLH) TFs, WD-repeat proteins, and the MYB-bHLH-WD40 ‘MBW’ complex—the latter making up the “late” synthesis of anthocyanins. These regulatory elements are known to regulate the expression of the pathway’s structural genes, such as dfr (dihydroflavonol 4-reductase) and 3gt (flavonoid 3-glucosyltransferase), over the expression of the ‘early’ anthocyanin biosynthesis genes, such as chs (chalcone synthase), chi (chalcone isomerase), and f3h (flavanone 3-hydroxylase) [46,47,48]. The over-expression of the specific MYB transcription factors has been related to the increase of phenylpropanoids in potato tubers [49,50] and the enzymes in the pathway have been characterized [51]. It is not clear, however, how the expression of these enzymes or the regulation by transcription factors generates the final anthocyanin compounds in the vacuole, which allows the variation of anthocyanin compounds and colors. This variation is reflected in the diversity of phenotypes in potatoes [52].
The anthocyanin content in potato tubers has been described as a quantitative and complex trait [25,38,53]. The genomic regions involved in the regulation of the anthocyanins pathway are not necessarily those known enzyme genes coding regions; conversely, other genomic regions could be playing an important controlling role. Few quantitative traits loci (QTL) have been identified for anthocyanin content from analyses of biparental populations in tetraploid potatoes [25,54]. For instance, two QTL on chromosome 8 and 9 explaining 8.1% and 11% of the phenotypic variation [54]. Thus, it is relevant to identify loci that underlie this trait, identify allelic variants associated with flavonoid metabolism regulation in a non-biparental population with different metabolic behavior, and employ potato diversity to analyze this novel trait—the anthocyanin concentration and its variation.
Association mapping in diverse diploid potato germplasms with high-density single-nucleotide polymorphism (SNP) markers contributes to the process of resolving QTL down to single genes or causative variants. The aim of this study was to explore the biodiversity of the Solanum tuberosum Group Phureja in the Working Collection of the Potato Breeding Program at Universidad Nacional de Colombia, for individual anthocyanidins amount in the main consumption form, cooked tubers [13]. This working collection is highly diverse and has materials that differ in tuber skin color, among other interesting traits. Additionally, it has not been explored in this sense. Therefore, we hypothesize that a number of unexplored genomic regions could exist which are responsible for the quantitative variation of anthocyanins that have not been identified, and which, if they exist, can be revealed through a genome-wide association study (GWAS) from the phenotypic data of this working collection. The identification of genomic regions and favorable alleles associated with anthocyanins content and composition in potato tubers could be validated and then could be useful for breeding programs for bioactive compounds in potato landraces, which are cultivated especially by native and indigenous communities in the Andean mountains.

2. Materials and Methods

2.1. Plant Material

For the anthocyanin phenotyping, a panel of 109 diploid landrace accessions from the Solanum tuberosum Group Phureja, included from Working Collection of the Potato Breeding Program at Universidad Nacional de Colombia, was employed. Three biological replicates (composed of ten plants each) per accession were planted at three randomized blocks in a field at Facatativá, Cundinamarca, Colombia (4°48’ N, 74°21’ W), 2,650 m above sea level (masl), average temperature 15 °C and relative humidity of 75%. For the anthocyanin extraction, each replicate sample consisted of ten tubers, taken randomly from the ten plants. Tubers were harvested at physical maturity, when they had developed an appropriate degree of skin set [55]. Samples from each accession were washed, cooked unpeeled, and freeze-dried, according to the methodology validated by Duarte-Delgado [56].

2.2. Anthocyanin Extraction

The extraction of anthocyanins was carried out using the standardized procedure, as follows: 0.05 g of freeze-dried material was placed in an extractive solvent consisting of a mixture of water/acetonitrile/formic acid (87:3:10, v:v:v) [33]. Samples were submitted to cavitation and the supernatant was removed. Subsequently, a solid phase extraction (SPE) was performed to purify the anthocyanin extracts. The SPE had three steps, (i) conditioning the supernatant in a reverse phase silica cartridge C18, (ii) rinsing and cleaning the sample, and (iii) eluting and recuperation of anthocyanin compounds in the separation step, with a known volume of acidified ethanol (0.01% HCl). To minimize degradation, the extracted product from each sample was stored at −80 °C under dark conditions.

2.3. Quantification of Anthocyanins in Cooked Tubers

Potato anthocyanin pigments were analyzed using high performance liquid chromatography (HPLC), elucidating their structures in their aglycone form. For this, an acid hydrolysis was used to reduce the complex pattern of anthocyanins in six large groups of reference compounds (anthocyanidins), separating aglycones from sugars: delphinidin, cyanidin, petunidine, pelargonidine, peonidin, and malvidin. The hydrolysis was performed using HCl 4 N in a 1:1 ratio, v:v with the extracted product. The mixture was hydrolyzed at 100 °C for 30 min, and introduced immediately into an ice bath, then stored at −20 °C for 20 min. The product was dried totally using a Büchi Rotavapor R-114. Finally, 500 µL of mobile phase water/acetonitrile/formic acid were added. The analysis was performed in an ultra-high performance liquid chromatography (UHPLC) ultimate 3000 (Dionex, Sunnyvale, CA, USA, EE.UU) equipped with a diode array detector (DAD-3000RS).
The separation of each anthocyanidin was performed with a Hypersil Gold RP 18 column (150 × 2.1 mm × 1.2 µm, Thermo Fisher Scientific, Waltham, MA, USA) operated at 21 °C [33]. The reversed-phase column used allowed the separation of compounds through hydrophobic interactions between a stationary phase and a mobile phase. Two solvent mixtures were employed as mobile phase, solvent A: acetonitrile/water/formic acid (3:87:10, v/v/v), and solvent B: acetonitrile/water/formic acid (50:40:10 v/v/v), at a flow of 0.4 mL/min. A linear gradient was conducted as follows: 6% to 20% solvent B for 10 min, 20% to 40% for 10 min, 40% to 50% for 10 min, and 50% to 60% for 5 min. The anthocyanidins detection was recorded at the maximum absorption visible at 520 nm. Anthocyanidin quantification was performed by means of calibration curves from pure standards, with a combined analysis of retention times and the visible absorption spectrum obtained by a diode array detector. To compensate for any anthocyanidin degradation during acid treatment, the preparation of the standards followed the same acid hydrolysis process mentioned above. The results of individual anthocyanidins were expressed as mg of compound/100 g dry matter (DM) sample using the starting masses.
The results of the composition and quantification of anthocyanidins were analyzed to confirm a normal distribution using the Shapiro–Wilk test (α = 0.05). A principal component analysis (PCA) was applied to illustrate the direction of the increase of the variables represented by vectors and their degree of correlation. Kaiser’s criteria followed [57], which retains the main components with values greater than unity. Subsequently, to phenotypically describe the association panel, data were subjected to a hierarchical cluster analysis from the quantitative variables using the farthest neighbor method, which incorporates in the PCA biplot the information of the clusters. The number of groups was determined from the analysis of a dendrogram (Supplementary Material 1), dividing at the level of the different groups with biological importance. Multivariate analysis was performed using the R software [58].

2.4. QTL Identification and Candidate Gene for Anthocyanin Concentration

For GWAS, a matrix of 7520 single nucleotide polymorphisms (SNPs) from a genotyping by sequencing (GBS) of 96 evaluated potato accessions out of 109 was used, since for these accessions the phenotypic data were complete. The GBS method used a two-enzymes system that included one ‘‘rare-cutter’’ and one ‘‘common-cutter’’, PstI/MspI, respectively, for the digestion step [59], and selective amplification was performed as described by Sonah et al. [60]. Raw data (fastq format) from the GBS methods were analyzed to detect SNPs, according to the pipeline of NGSTools Eclipse Plugin (NGSEP) [61]. The reference genome from the double monoploid of S. tuberosum group Phureja clone DM1-3 (DM–v4.03) was used to identify SNPs [62]. SNP markers with more than 10% missing data and markers with a minimum allelic frequency of less than 0.05 were excluded from the analysis [63] (Supplementary Material 2). A lack of population structure in the Phureja accessions studied was assumed, as previously described [64]. The GWAS was conducted by using the whole phenotype data set and separately for each of the anthocyanidin compounds applying a compression mixed linear model (CMLM) [65], using the Genome Association and Prediction Integrated Tool (GAPIT) R package ® [66].
The quantile–quantile (QQ) representations of the probabilities of the expected and observed F test for the SNPs markers were evaluated to identify the appropriate model in the control of Type I errors caused by kinship relationships [67,68]. Principal components (PCs) were used to control for population structure (quantile–quantile plots showed over fitting of a PC + K model). A Bonferroni-corrected threshold probability based on individual tests was calculated to correct for multiple comparisons [69]. The QTL association threshold was established with the dimension of the marker matrix, the significant cutoff value was defined as 0.1, divided by the number of markers. QTL were selected when the p-values of the SNPs were less than the cutoff value. Possible candidate genes were identified within an estimated 100 kb window of linkage disequilibrium (LD) decay. The genes were annotated according to DM–v4. to the positions of the closest significant SNPs [62].

3. Results

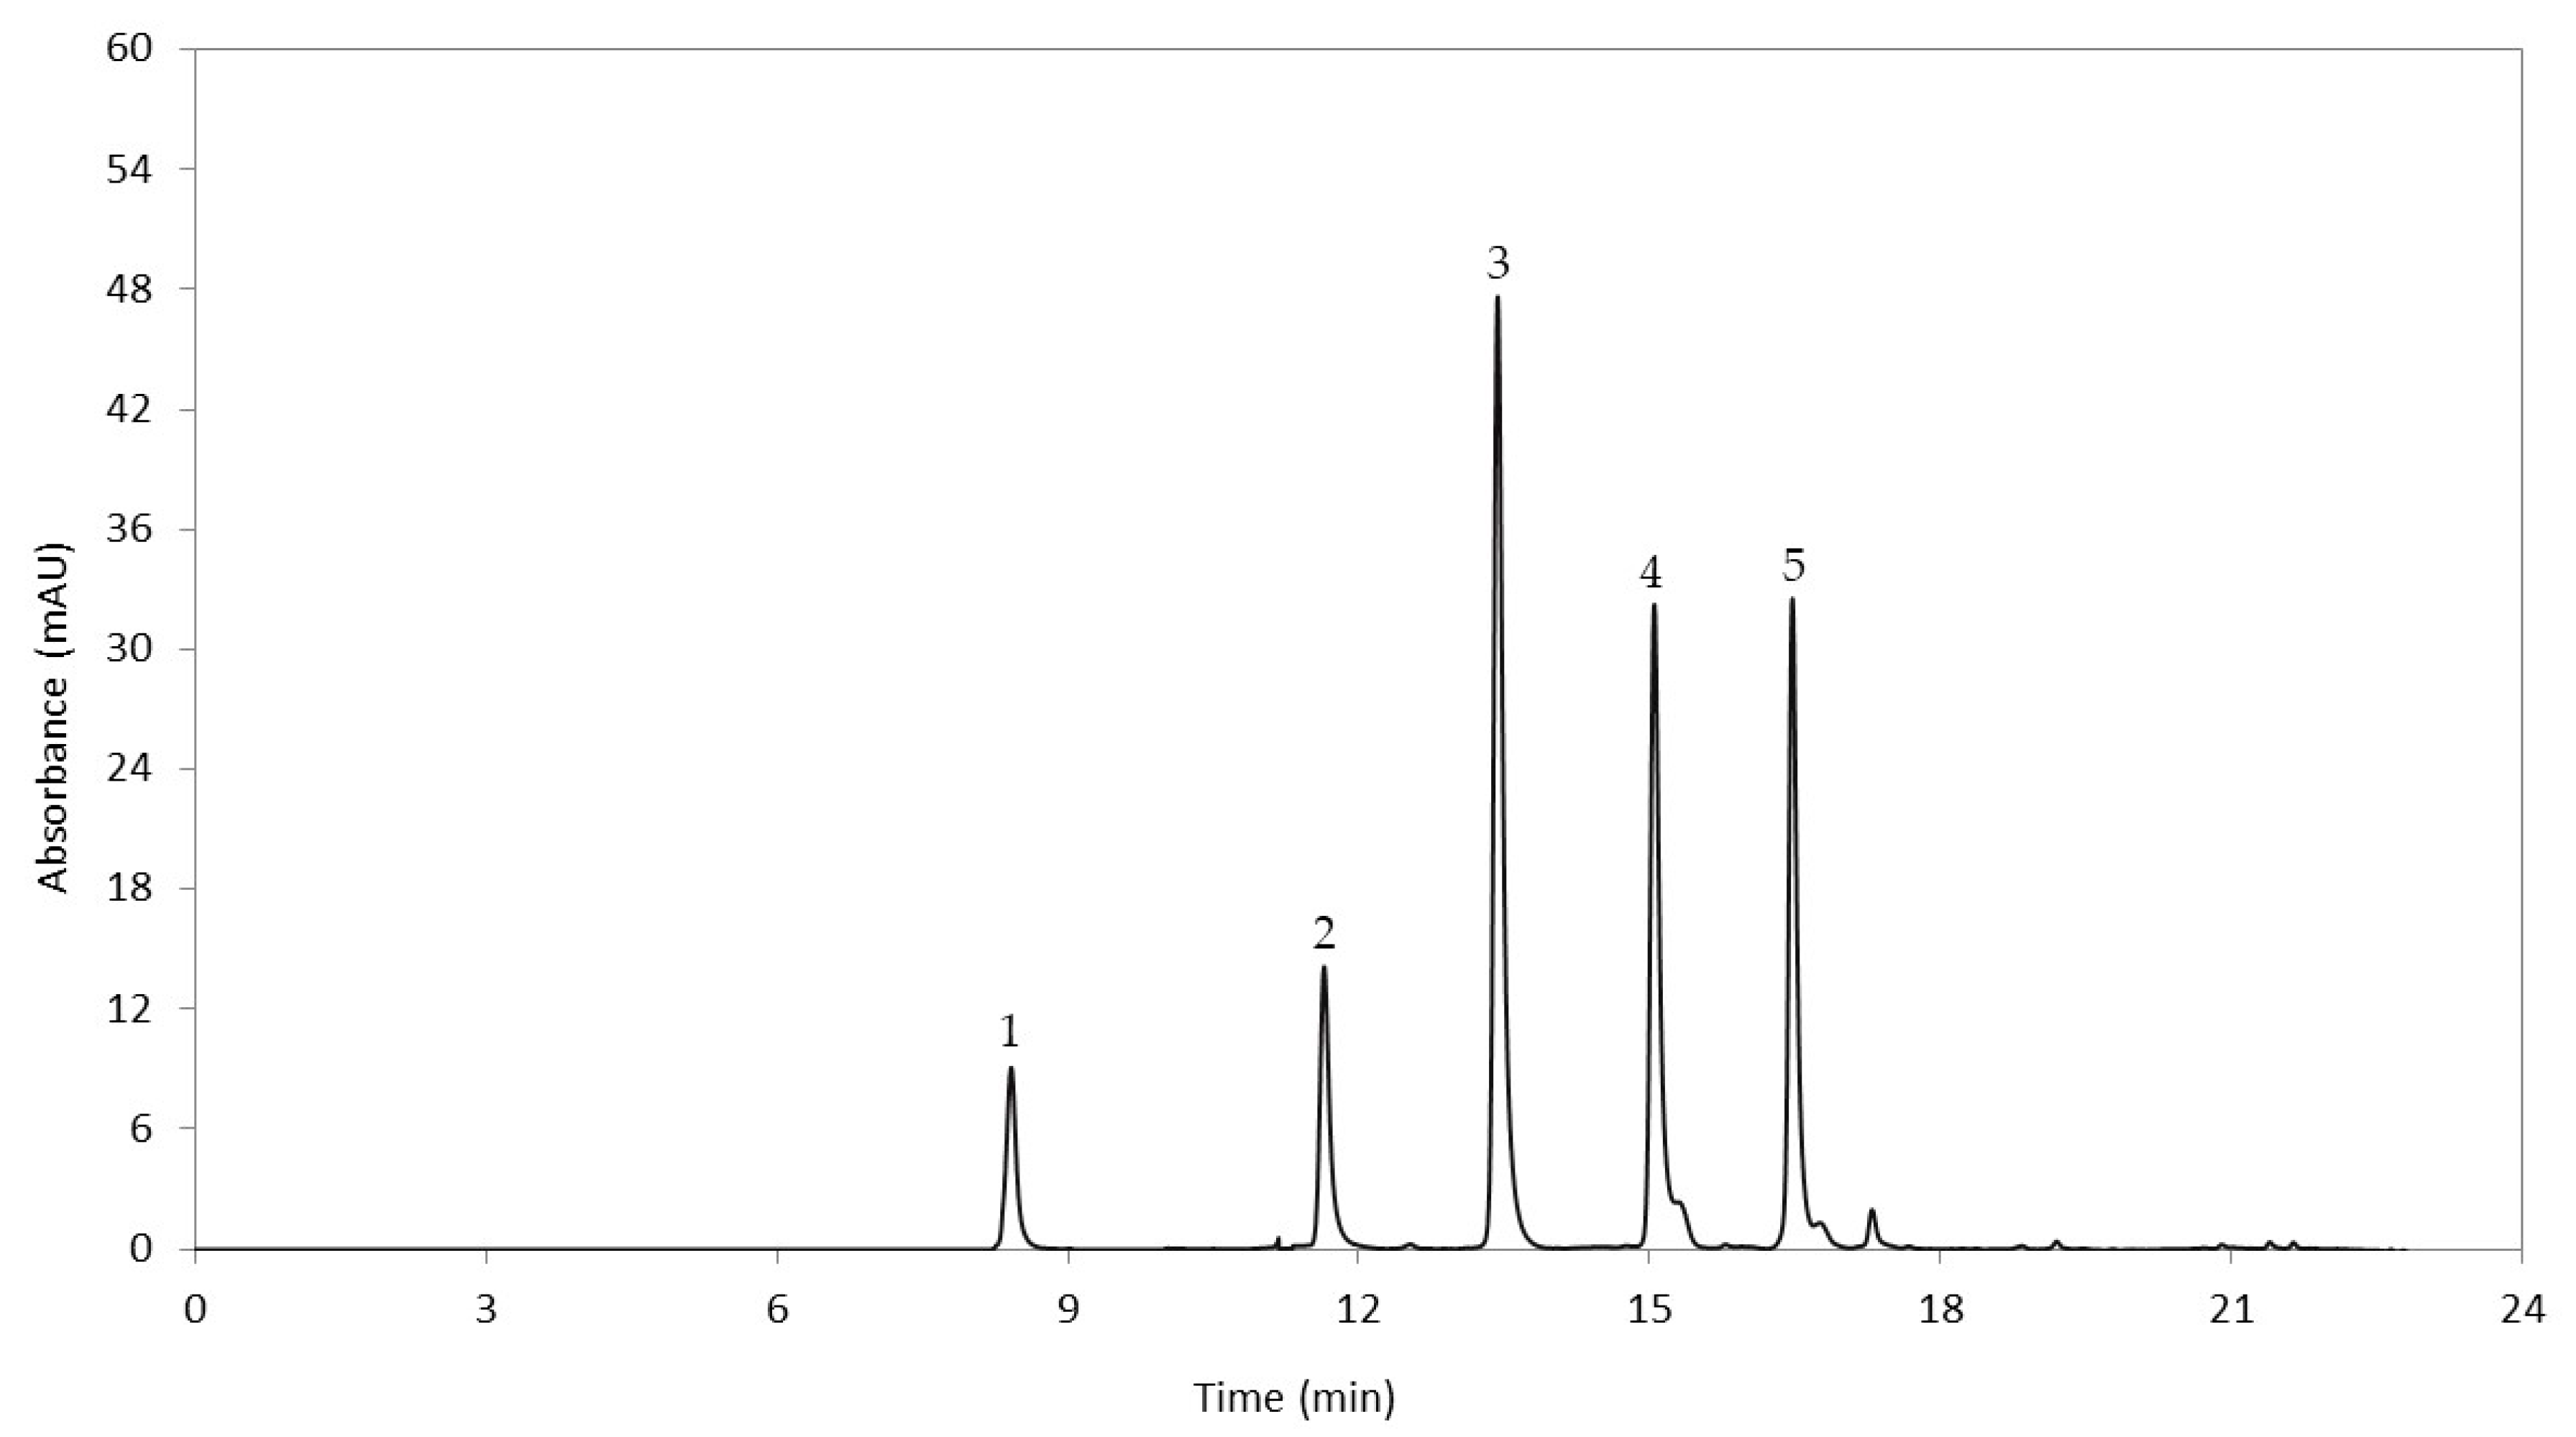
3.1. Quantification of Anthocyanidins in Cooked Tubers

Anthocyanidins delphinidin, cyanidin, petunidin, pelargonidin, and peonidin were identified in a potato association panel constituted by accessions of diploid potatoes of Group Phureja. The anthocyanidins eluted at retention times ranging from 6 to 16 min: delphinidin at 8.07 min, 11.59 min for cyanidin, 13.21 min for petunidin, 14.92 min for pelargonidin, and 16.31 min for peonidin (Figure 1). A high phenotypic variation in the concentration of individual anthocyanidins within the potato accession collection was evident. Delphinidin concentrations ranged from below quantification limit (BQL) to 18.84 mg/100 g dry matter (DM), cyanidin ranged from BQL to 25.99 mg/100 g DM, peonidin from BQL to 31.04 mg/100 g DM, petunidin from BQL to 94.41 mg/100 g DM, and pelargonidin with a range from BQL to 167.76 mg/100 g DM. The mean concentrations of anthocyanins with their standard deviations of the 109 accessions evaluated from cooked tubers are displayed in Supplementary Material 3.
The PCA-cluster analysis explained 88.37% of the variation (Figure 2). The direction of the five vectors corresponds to the individual anthocyanins identified in the potato accessions. It is shown that the composition of pelargonidin is independent on the other four anthocyanins, due to the correlation of 0.0075 found between pelargonidin and petunidin, 0.1376 with cyanidin, and 0.5556 with peonidin, whose vector is the closest one. Among the four remaining anthocyanins, correlations between 0.62 and 0.84 were observed.
The cluster analysis identified six different groups or anthocyanidin content profiles for the 109 potato accessions analyzed (Supplementary Materials 3 and 4). Group 1, represented by 71.55% of the analyzed accessions, presented the lowest concentration of the five anthocyanidin compounds. Group 2 included a considerable concentration of pelargonidin, with values between 16.92 and 37.86 mg/100 g DM, however, it had low contents of the remaining four compounds. Group 3 had a considerable concentration of petunidin, between 19.41 to 76.51 mg/100 g DM, and peonidin at concentrations of up to 22.77 mg/100 g DM, or contents at up to 32.70 mg/100 g DM of pelargonidin. Group 4 contained genotypes with pelargonidin concentrations ranging from 64.34 to 84.90 mg/100 g DM, and also had petunidin concentrations at up to 27.8 mg/100 g DM. Group 5 involved 4.59% of the genotypes, and contained the highest reported pelargonidin content, 86.84 to 167.75 mg/100 g DM, however, it presented the lowest contents of the remaining four anthocyanins. Group 6 represented 2.75% of the analyzed genotypes, had low concentrations of pelargonidin, but presented the highest delphinidin, cyanidin, petunidin, and peonidin contents of the analyzed genotypes. A chromatogram from HPLC (processed at 520 nm) representative of an accession from each anthocyanidin content profiles or group identified from the phenotyping data is shown in Supplementary Material 5.

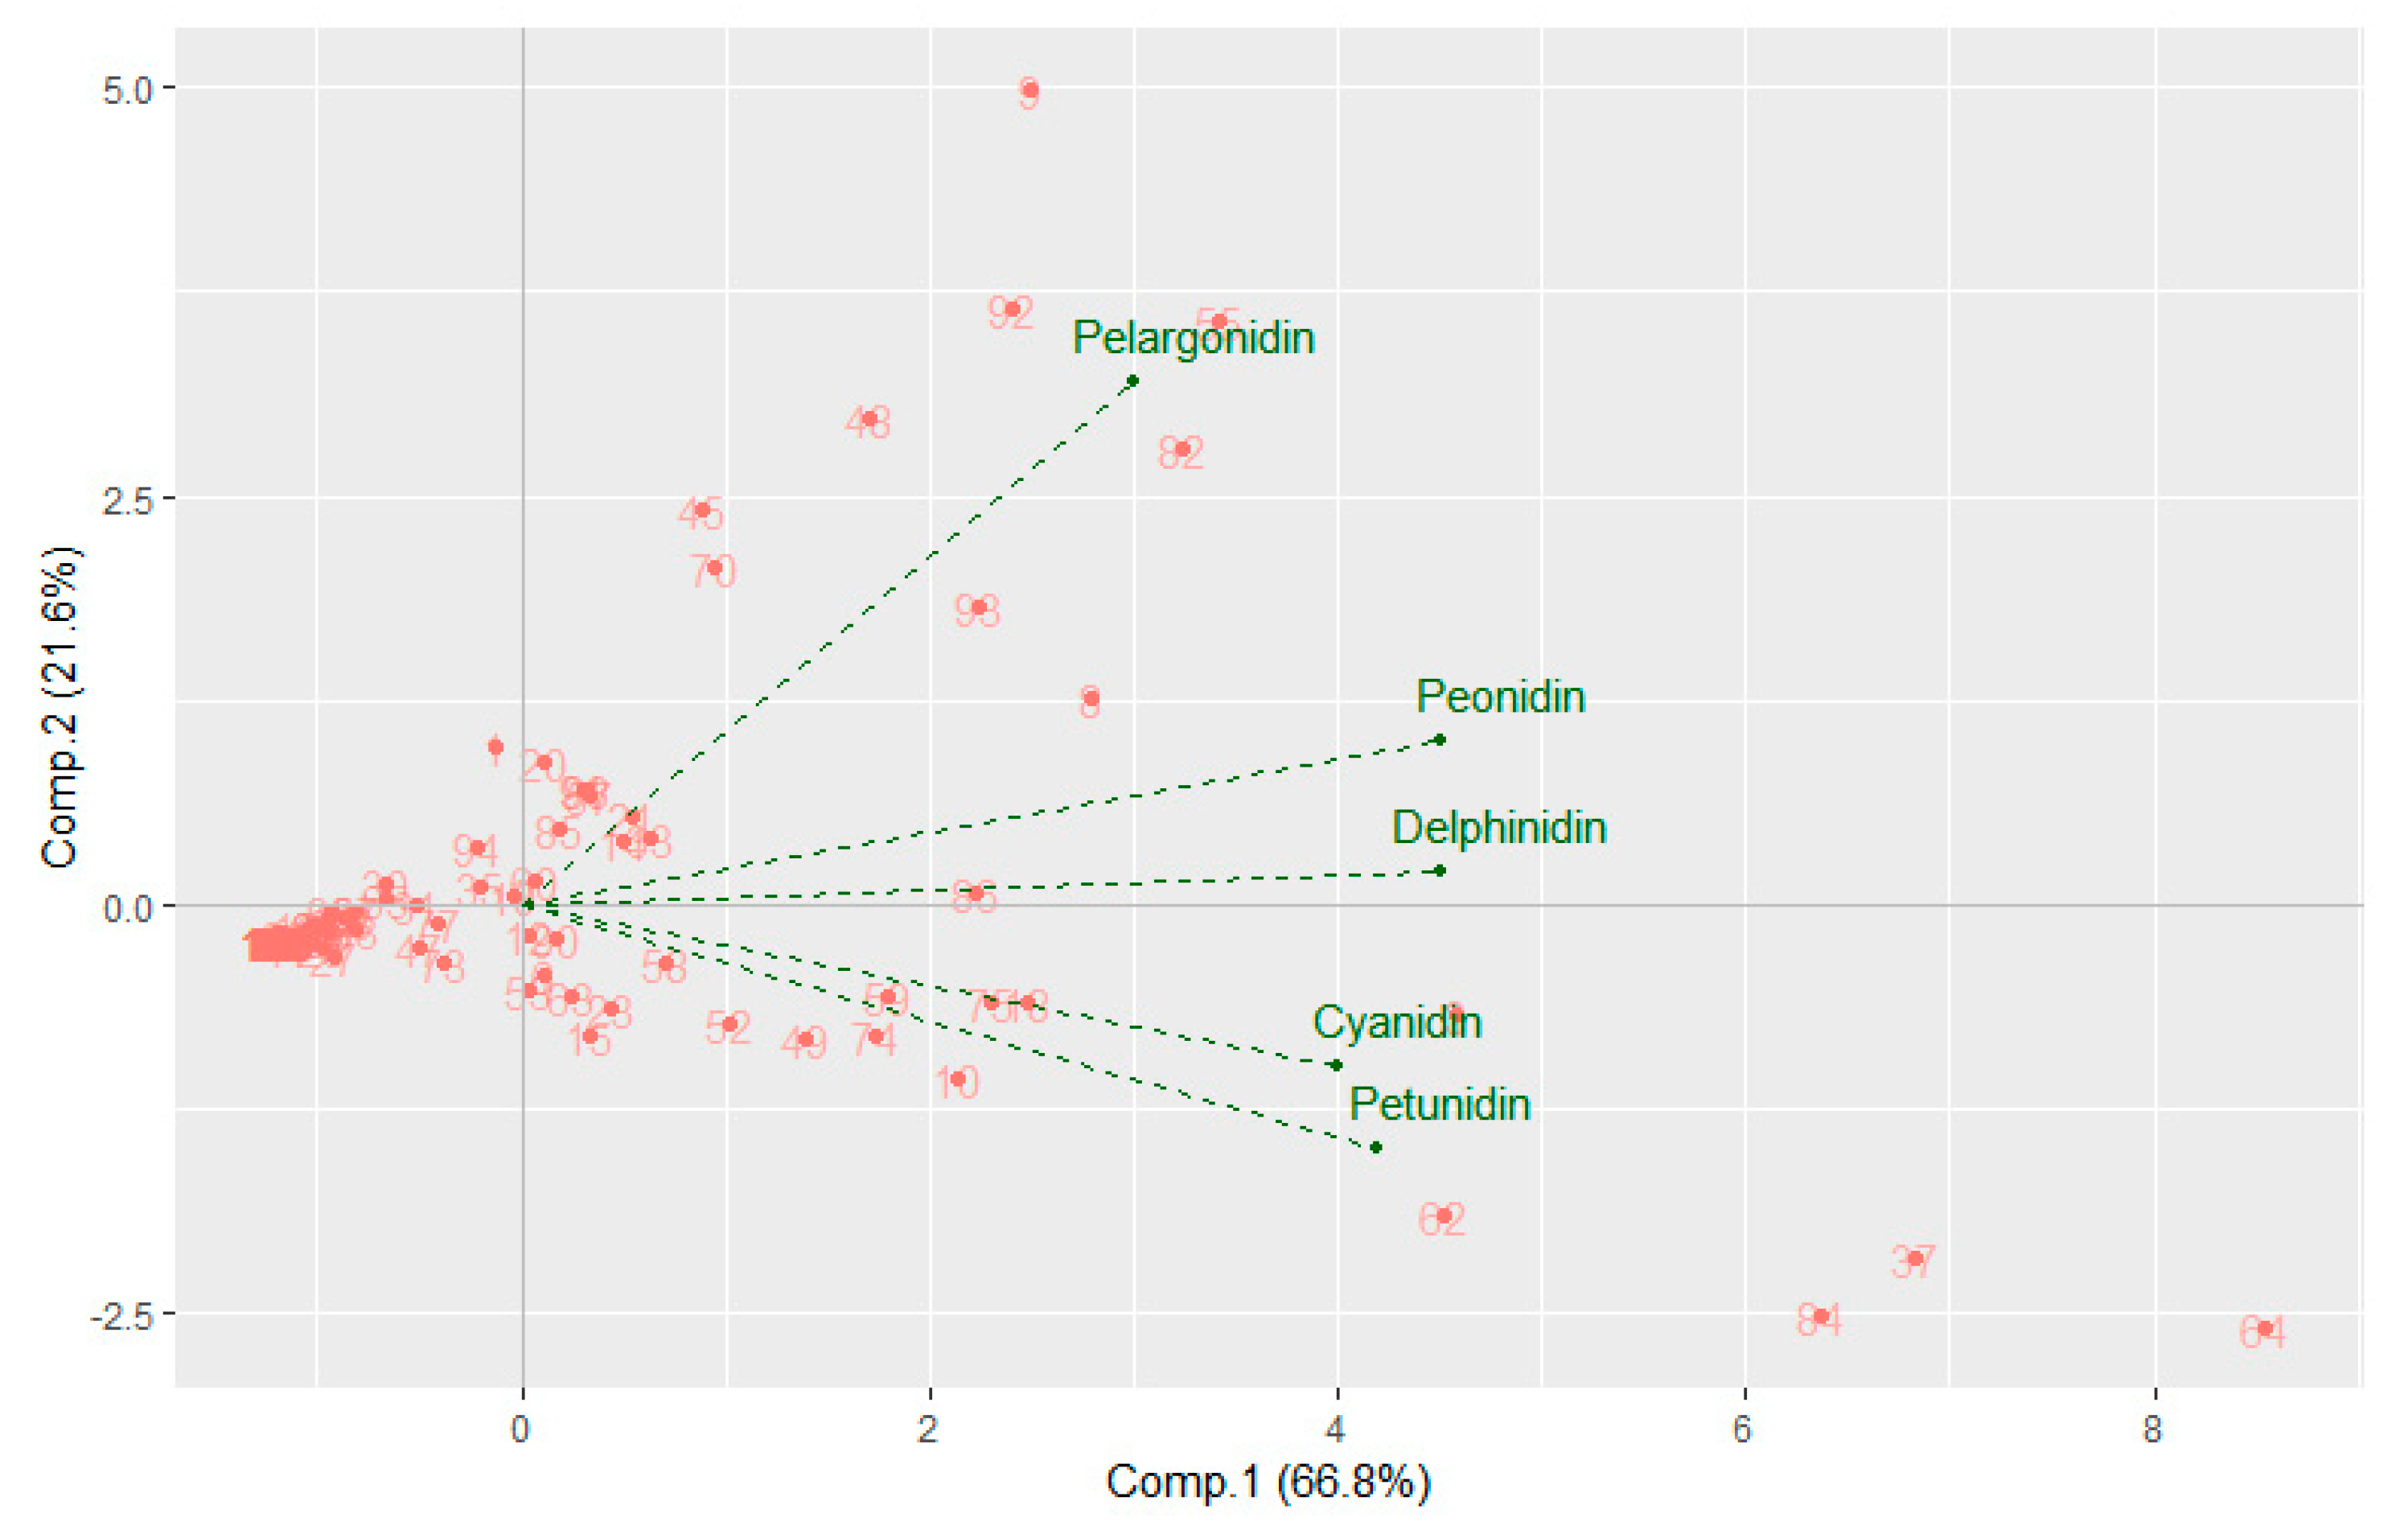
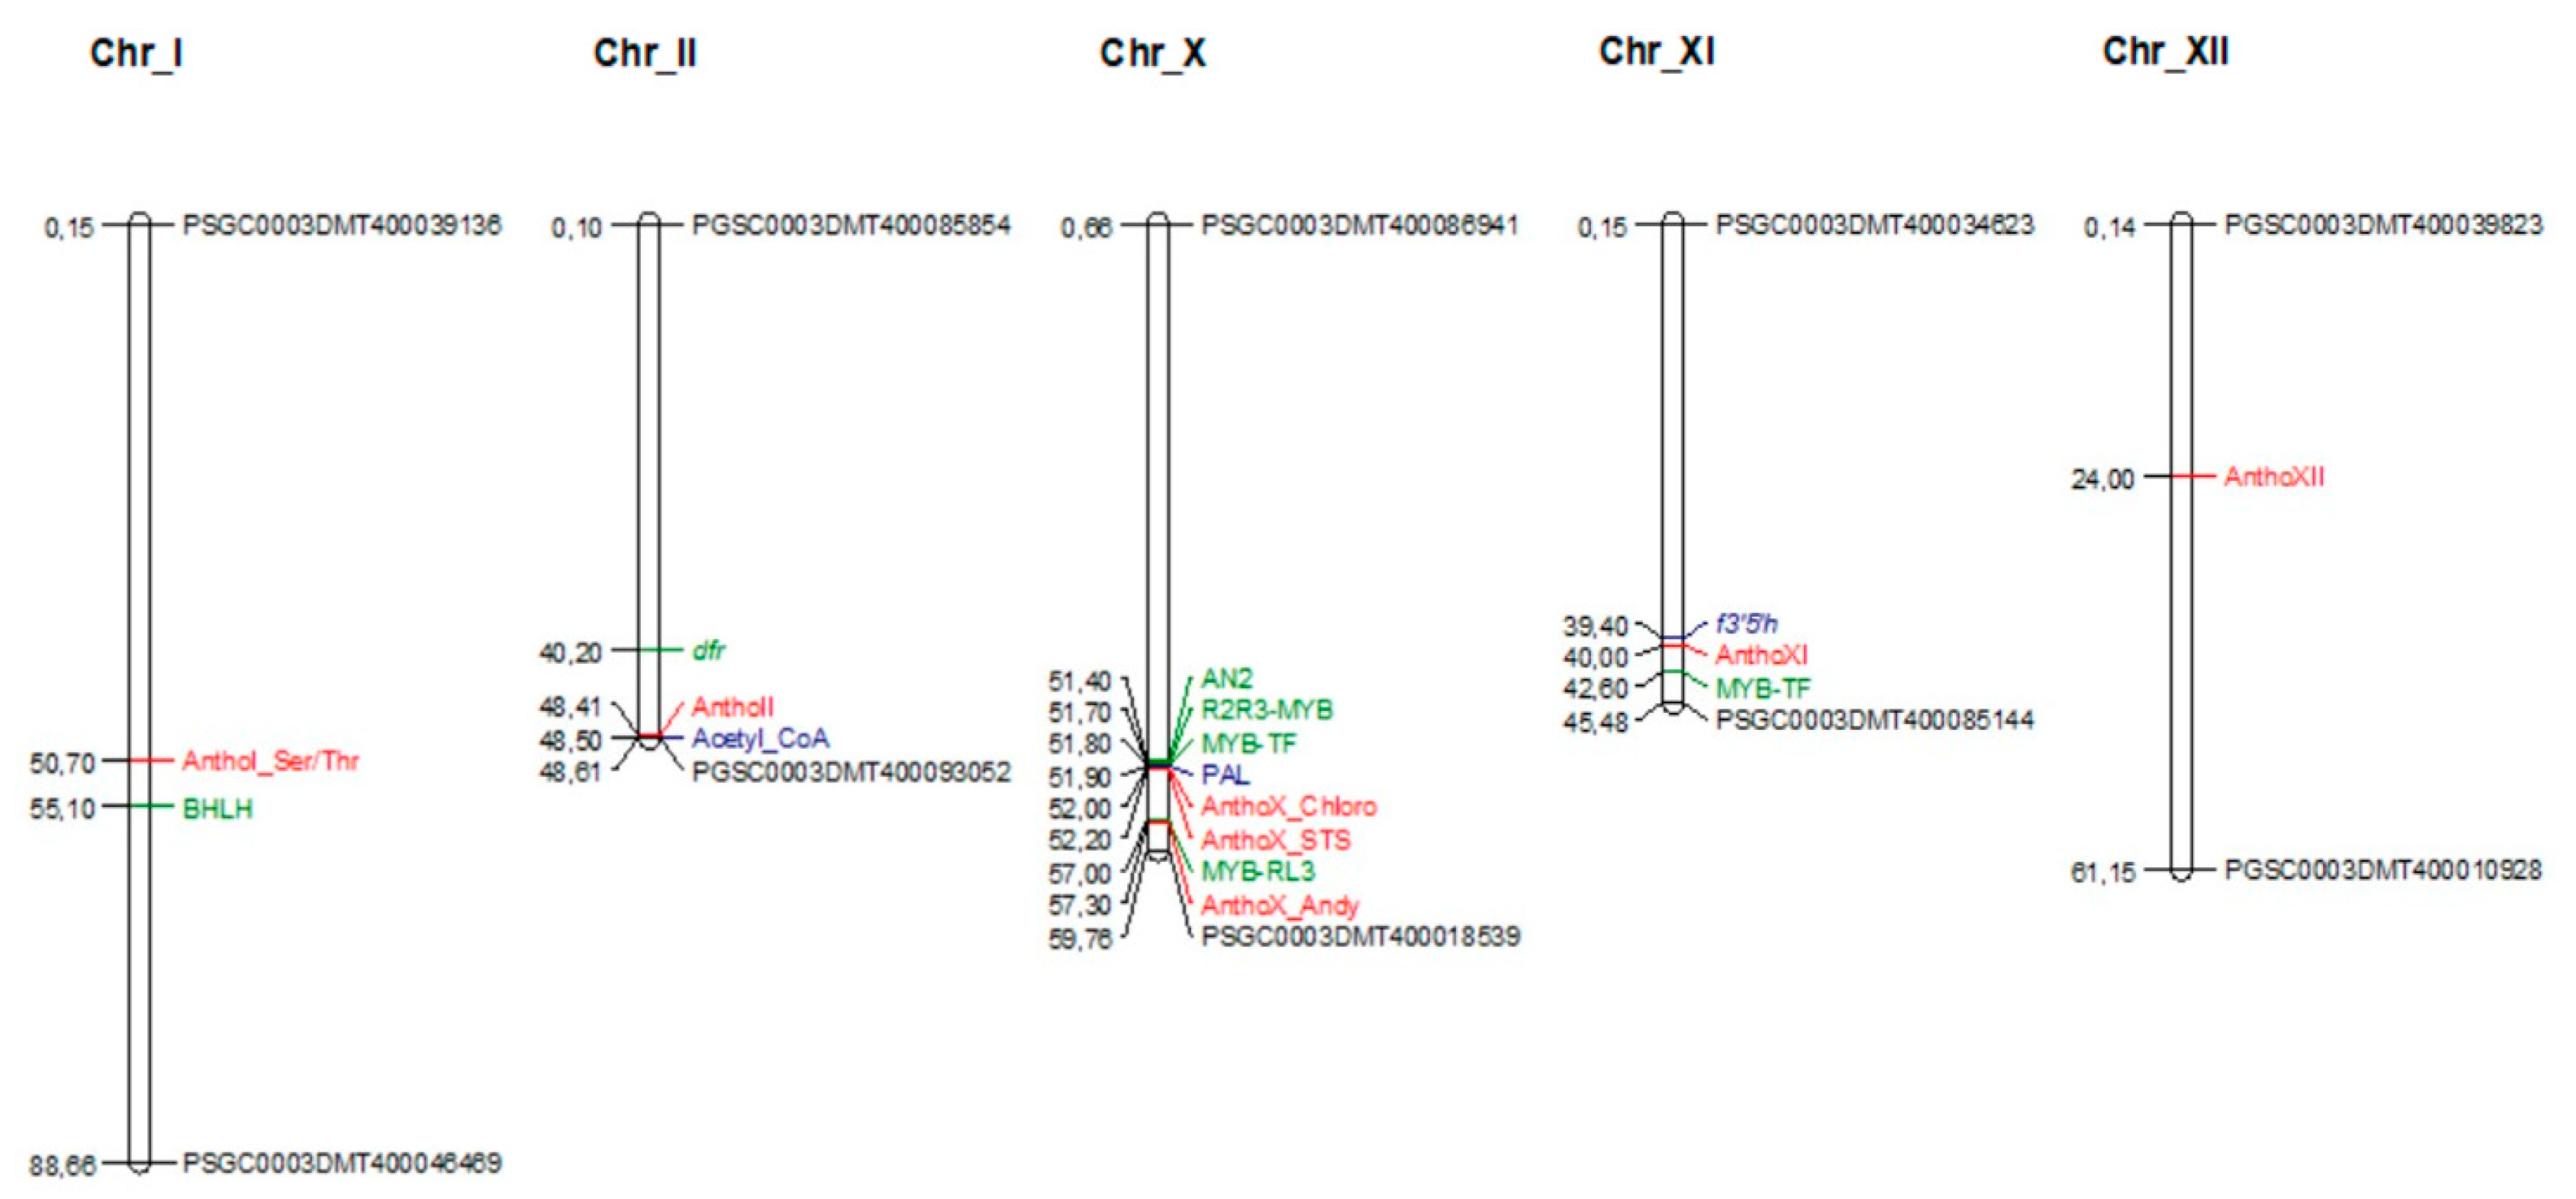
3.2. Genome-Wide Association Study for Anthocyanidins Concentration Regulation

The genetic basis of natural variation for anthocyanins levels from cooked potato tubers was explored, employing an association panel of 96 accessions genotyped with 7520 SNP markers for use in a GWAS of five anthocyanidins traits with a compression mixed linear model. A total of seven QTL were identified. These QTL would be involved in the genetic control of the anthocyanin content in cooked tubers (Supplementary Material 6). These QTL explain from 31.3% to 44.4% of the phenotypic variance (anthocyanidin content and composition). Three QTL map in chromosomes X, one in chromosome I, and one QTL in chromosomes II, XI, and XII (Table 1).
Two of the seven QTL were considered stable QTL, as they were detected for the five anthocyanidins. The QTLs identified as AnthoX_Chloro and AnthoX_STS, belonging to the X chromosome, were detected in a genome-wide association for the five traits. One of the strongest association signal was detected for pelargonidin with the peak SNP locus AnthoX_Chloro localized within the Chloroplast threoninedeaminase 1 gene (PGSC0003DMT400045363/Chloroplast threonine deaminase 1 gene), explaining the 43.9% of the phenotypic variance. In a search window of 100 kb according to the LD decay, we found a Phenylalanine ammonia-lyase-gene (PAL-PGSC0003DMT400080548) within the flanking region of AnthoX_Chloro, which corresponds to the first enzyme involved in the anthocyanin biosynthetic pathway [51]. AnthoX_STS was localized at chr10:52261553 (PGSC0003DMT400045346/STS14 protein gene), and is strongly associated with pelargonidin, explaining 43.3% of the phenotypic variance. On chromosome X, we also reported the QTL AnthoX_Adeny, colocalized at chr10:57301864 (PGSC0003DMT400060833/Adenylyl-sulfate kinase gene), explaining 41.1% of the phenotypic variance of pelargonidin. The QTL AnthoI_Ser/Thr belonging to the chromosome I, was associated with the concentration of cyanidin co-localized with chr01:50785405 (PGSC0003DMT400013570/Serine/threonine-protein phosphatase gene) and explained 31% of the phenotypic variance. The QTL AnthoII was associated with the petunidin concentration on chromosome II (chr02:48517142), we found the acetyl-CoAcarboxylase-gene (ACCase–PGSC0003DMT400052139) within the flanking region of 100 kb of AnthoII. The QTL AnthoXI was associated with the delphinidin concentration, co-localized chr11:40001900 (PGSC0003DMT400019149/conserved gene of unknown function) and explained 37.4% of the phenotypic variance. Finally, the QTL AnthoXII was associated with the petunidin concentration, is located inchr12:24259182 (PGSC0003DMT400090245/Hypothetical gene of unknown function) and explained 38.2% of the phenotypic variance (Table 1, Figure 3).

4. Discussion

Five different anthocyanidins were identified and quantified in the Solanum tuberosum L. Group Phureja Working Collection of the Potato Breeding Program at Universidad Nacional de Colombia. Among them, pelargonidin was the predominant anthocyanidin. The anthocyanidins identified in this study are consistent with those found in previous studies in S. tuberosum, employing chromatographic methods [22]. Pillai et al. [31] analyzed anthocyanidin content in 15 Phureja potato genotypes and established the predominance of petunidin and pelargonidin as compared to other anthocyanidins, with some traces of malvidin and cyanidin. Likewise, in the current study, a wide phenotypic variation was observed in the concentration of individual anthocyanidins within the 109 accessions analyzed. A range of total anthocyanidins content from below quantification limit to 189.13 mg/100 g DM was found. Such variation occurred in the total content and in each individual anthocyanidin analyzed within the potato collection. Cluster analysis of individual anthocyanidins contents revealed promising materials to be used by future plant breeding programs as sources of high levels of antioxidants.
The genetic control of the regulation of nutritional compounds in potatoes is a complex trait. The genomic regions involved in the regulation of the anthocyanidin pathway are not necessarily those known enzyme gene coding regions, conversely, other genomic regions could be playing an important control role. Therefore, identifying the underlying genetic factors of the quantitative variation of anthocyanidin through a GWAS approach with a robust phenotyping characterization becomes the basis for a better understanding of the complex genetic control of the regulation of nutritional compounds in potatoes. Here, we report the identification of seven QTLs associated with the potato anthocyanidins concentration on the chromosomes I, II, X, XI, and XIX. We found chromosomes I and X to be special interest since they contain the strongest association signal and stable QTL. All seven QTLs constitute putative genomic regions involved in the regulation of the traits, and do not necessarily represent the genes responsible for anthocyanin regulation in potatoes. Taking into account the typical linkage disequilibrium (LD) exhibited by cultivated potatoes [71], which correlates with the LD reported here, 1 Mbp (Supplementary Material 7), it is to be expected that these regions are flanking the genes that govern the trait of interest. However, we explored a window of 100 Kb according to the LD estimated for marker pairs with each peak SNP loci.
Two significant QTLs associated with the accumulation of cyanidin in potato tubers were located in chromosome I, AnthoI_Ser/Thr. AnthoI_Ser/Thr colocalizes in a gene coding for a serine/threonine-protein phosphatase protein. In addition, the TF MYB, bHLH localized 5 Mbp from the QTL AnthoI_Ser/Thr, which co-regulates the anthocyanin-specific genes together with the AN2 potato locus [72].
Chromosome X harbors the QTL AnthoX_STS whose genomic position co-localizes to the sts14 gene, which encodes a protein that belongs to the SCP_PR-1 (SCP-like extracellular protein domain, PR-1 like subfamily) family. On the other hand, QTLs AnthoX_Chloro and AnthoX_STS also located in chromosome X, are physically 256.685 bp apart, and could be considered the same QTL given their proximity. However, despite this physical proximity, we consider them independent QTLs, given that the percentage of variability explained by each is different, and that they co-localize with different genes. Interestingly, the gene anthocyanin2 (an2) is located at 1.4 Mbp from the genomic localization of these QTLs. The an2-gene encodes an Myb domain transcriptional regulator factor involved in the anthocyanin pathway (Figure 3) [38,49,70]. Furthermore, some transcription factors (TFs), belonging to the MYB superfamily, have been reported to regulate anthocyanins metabolism in potatoes and they co-localize in chromosome X [39,48]. Remarkably, we found that TFs R2R3-MYB and MYB-FT TFs are located at 1.7 Mbp and 1.8 Mb, respectively, from QTL AnthoX_Chloro. We found a Phenylalanine ammonia-lyase-gene (PAL) in the 100 Kb search window with the peak SNP AnthoX_Chloro. This gene encodes the PAL enzyme, which is the first stage in the anthocyanin biosynthetic pathway, in the conversion of phenylala- nine to coumarate-CoA [51], which can be an important genomic region in the regulation of anthocyanin concentration. The genome position of QTL AnthoX_Adeny, a third QTL found in chromosome X, is 300 Kb from a gene encoding for a TF MYB-RL3 (Figure 3). It is known that among some MYBs, the TFs, R2R3 MYB family plays an important role in regulating the expression of catalytic enzymes, including the anthocyanin pathway [73]. In addition, several R2R3 MYB regulators have been demonstrated to be transcriptional activators of the anthocyanin biosynthetic pathway from many species, such as Arabidopsis [74], petunia [72], and tomatoes [75].
We also highlight the identification of the QTL AnthoXI in chromosome XI, which is physically close, less than 500 Kb, to the previously reported locus P (flavonoid 3′,5′-hydroxylase–f3′5′h). This gene is required for the production of purple delphinidin-based pigments [45]. Due to the LD decay reported here, this finding is not surprising, as it seems that our results restore the f3′5′h gene as a key gene involved in the genetic regulation of anthocyanidins. In addition, the QTL AnthoXI is nearby to TF MYB-FT and MYB1-2. These TFs belong to the TF complex (MYB-bHLH- WD40) which has been reported to allow the expression of anthocyanin pathway genes [47].
Due to the high concentrations of pelargonidin found in some accessions of the potato association panel evaluated, it is expected that some QTLs would be found on chromosome II, co-localizing with the R locus (dfr—dihydroflavonol 4-reductase). The R locus has been reported to require the production of red pelargonidin-based pigments [44]. The lack of representativeness of SNP markers in the physical location where the R locus and other gene members of the phenylpropanoid pathway reside can explain the non-identification of them.
Three of the seven QTLs detected in this study co-localize physically close to previously reported genetic regions related to the anthocyanidins synthesis at different levels. Even though three of the presumptive candidate genes derived from the QTL regions do not belong to genes directly related to the anthocyanin biosynthetic pathway, they still need to be considered as presumptive candidate genes for the regulation of anthocyanin compounds in potato tubers, and their functional validation in the immediate future should be the next step.

5. Conclusions

We reported the identification and quantification of five anthocyanidins in cooked tubers of diploid potatoes belonging to the Colombian germplasm of Solanum tuberosum Group Phureja. A GWAS analysis of the concentration of individual anthocyanidins per genotype revealed seven QTLs strongly associated with the anthocyanidin contents. The genome position of the QTLs AnthoX_Chloro and AnthoX_STS suggests a co-localization with the potato gene an2 (I locus), while the QTL AnthoX1 co-localizes in the previously reported f3′5′h potato gene (P locus). Both loci I and P have been reported as important genes for the pigment of diploid potato tuber flesh. Besides this, the rediscovery of a QTL previously involved in the regulation of anthocyanins in potatoes, we introduced four new genetic factors that may be playing important roles in the control of this interesting trait. These genetic factors constitute key pieces for a deep understanding of the regulation of anthocyanin concentration in potatoes. In the future, it would be worth performing further investigation with large population sizes and potentiate this with the precision of the phenotyping obtained with UHPLC for identification and measuring bio compounds.

Supplementary Materials

The following are available online at https://www.mdpi.com/2073-4395/9/7/366/s1, Supplementary Material 1: Anthocyanidins amount dendrogram of 109 accessions of Solanum tuberosum Group Phureja, Supplementary Material 2: Genotyping by sequencing data, Supplementary Material 3: Anthocyanin mean concentrations from 109 accessions from cooked tubers of Solanum tuberosum Group Phureja, Supplementary Material 4: Average concentration of individual anthocyanidins quantified by UHPLC of the six anthocyanidin concentration profiles for Solanum tuberosum Group Phureja, Supplementary Material 5: Chromatograms from HPLC (processed at 520 nm) representative of one accession from each anthocyanidin content profiles or group identified from the phenotyping data of Solanum tuberosum Group Phureja, Supplementary Material 6: Manhattan graph and Q-Q plot graph to visualize the distribution of association P-values from the genome-wide association study for anthocyanidins content in cooked tubers of Solanum tuberosum Group Phureja, Supplementary Material 7: Linkage disequilibrium measure LD(R2) plotted versus the potato physical map distance between all pairs SNP markers of the X and XI chromosomes.

Data Availability Statement

The genotyping data supporting the conclusions of this manuscript is available in Supplementary Materials 3.

Author Contributions

M.-A.P.-G.: Designed and established the experiments, took the data, analyzed the results and prepared the draft of manuscript. C.P.-N.: Optimized the anthocyanin the extraction method and established the experiment in field and laboratory conditions. J.C.S.-S.: Revised and analyzed the results, prepared the draft of manuscript. T.M.-V.: Conceptualized the original idea, supervised the whole research, designed the experiments, revised the results and analyses and revised the manuscript. All the co-authors revised and approved the manuscript.

Funding

This research was funded by the International Development Research Centre (IDRC) and Global affairs Canada through the Canadian International Food Security Research Fund (CIFSRF) that funded the project SAN Nariño number 108125-002, and the “Departamento Administrativo de Ciencia, Tecnología e Innovación” COLCIENCIAS for funding the Project 110171250437.

Acknowledgments

We are grateful to Carlos-Eduardo Narváez-Cuenca for his critical reading of the manuscript, to María Cecilia Delgado for her collaboration in the establishment of the experiments in field and laboratory conditions and to Danilo Lozano for his support preparing plants and materials.

Conflicts of Interest

The authors declare no conflict of interest.

References

  1. Food and Agriculture Organization. 2018. Available online: http://www.fao.org/faostat/en/#home (accessed on 19 March 2019).
  2. Chun, O.K.; Kim, D.O.; Smith, N.; Schroeder, D.; Han, J.T.; Chang, Y.L. Daily consumption of phenolics and total antioxidant capacity from fruit and vegetables in the American diet. J. Sci. Food Agric. 2005, 85, 1715–1724. [Google Scholar] [CrossRef]
  3. Thompson, M.D.; Thompson, H.J.; McGinley, J.N.; Neil, E.S.; Rush, D.K.; Holm, D.G.; Stushnoff, C. Functional food characteristics of potato cultivars (Solanum tuberosum L.): Phytochemical composition and inhibition of 1-methyl-1-nitrosourea induced breast cancer in rats. J. Food Compos. Anal. 2009, 22, 571–576. [Google Scholar] [CrossRef]
  4. Andre, C.; Ghislain, M.; Bertin, P.; Oufir, M.; Herrera, M.; Hoffmann, L. Andean potato cultivars (Solanum tuberosum L.) as a source of antioxidant and mineral micronutrients. J. Agric. Food Chem. 2007, 55, 366–378. [Google Scholar] [CrossRef] [PubMed]
  5. Godfray, H.C.; Garnett, T. Food security and sustainable intensification. Philos. Trans. R. Soc. B Biol. Sci. 2014, 369, 20120273. [Google Scholar] [CrossRef] [PubMed]
  6. Brown, K.J. Roots and Tubers Galore: The Story of CIP’s Global Research Program and the People Who Shaped It; CIP: Lima, Peru, 1993. [Google Scholar]
  7. Estrada, R.N. La Biodiversidad en el Mejoramiento Genético de la Papa; Hardy, B., Martinez, E., Eds.; Editorial del Centro de información para el desarrollo: La Paz, Bolivia, 2004. [Google Scholar]
  8. Ezekiel, R.; Singh, N.; Sharma, S.; Kaur, A. Beneficial phytochemicals in potato—A review. Food Res. Int. 2013, 50, 487–496. [Google Scholar] [CrossRef]
  9. Huamán, Z.; Spooner, D.M. Reclassification of landrace populations of cultivated potatoes (Solanum sect. Petota). Am. J. Bot. 2002, 89, 947–965. [Google Scholar] [CrossRef]
  10. Nassar, A.; Sabally, K.; Kubow, S.; Leclerc, N.Y.; Donnelly, D.J. Some Canadian-grown potato cultivars contribute to a substantial content of essential dietary minerals. J. Agric. Food Chem. 2012, 60, 4688–4696. [Google Scholar] [CrossRef]
  11. André, C.M.; Schafleitner, R.; Legay, S.; Lefèvre, I.; Aliaga, C.A.; Nomberto, G.; Hoffmann, L.; Hausman, J.F.; Larondelle, Y.; Evers, D. Gene expression changes related to the production of phenolic compounds in potato tubers grown under drought stress. Phytochemistry 2009, 70, 1107–1116. [Google Scholar] [CrossRef]
  12. Hawkes, J.G. The Potato: Evolution, Biodiversity, and Genetic Resources; Belhaven Press: London, UK, 1990. [Google Scholar]
  13. Peña, C.; Restrepo-Sánchez, L.P.; Kushalappa, A.; Rodríguez-Molano, L.E.; Mosquera, T.; Narváez-Cuenca, C.E. Nutritional contents of advanced breeding clones of Solanum tuberosum group Phureja. LWT-Food Sci. Technol. 2015, 62, 76–82. [Google Scholar] [CrossRef]
  14. André, C.; Oufir, M.; Hoffmann, L.; Hausman, J.; Rogez, H.; Larondelle, Y. Influence of environment and genotype on polyphenol compounds and in vitro antioxidant capacity of native andean potatoes (Solanum tuberosum L.). J. Food Compos. Anal. 2009, 22, 517–524. [Google Scholar] [CrossRef]
  15. Ji, L.; Yogendra, K.N.; Mosa, K.A.; Kushalappa, A.C.; Piñeros-Niño, C.; Mosquera, T.; Narváez-Cuenca, C.E. Hydroxycinnamic acid functional ingredients and their biosynthetic genes in tubers of Solanum tuberosum Group Phureja. Cogent Food Agric. 2016, 2, 1138595. [Google Scholar] [CrossRef]
  16. Kubow, S.; Iskandar, M.M.; Sabally, K.; Azadi, B.; Ekbatan, S.S.; Kumarathasan, P.; Das, D.D.; Prakash, S.; Burgos, G.; zum Felde, T. Biotransformation of anthocyanins from two purple-fleshed sweet potato accessions in a dynamic gastrointestinal system. Food Chem. 2016, 192, 171–177. [Google Scholar] [CrossRef] [PubMed]
  17. Piñeros-Niño, C.; Narváez-Cuenca, C.E.; Kushalappa, A.C.; Mosquera, T. Hydroxycinnamic acids in cooked potato tubers from Solanum tuberosum group Phureja. Food Sci. Nutr. 2017, 5, 380–389. [Google Scholar] [CrossRef] [PubMed]
  18. Brown, C.R.; Wrolstad, R.; Durst, R.; Yang, C.P.; Clevidence, B. Breeding studies in potatoes containing high concentrations of anthocyanins. Am. J. Potato Res. 2003, 80, 241–249. [Google Scholar] [CrossRef]
  19. Brown, C.R.; Culley, D.; Bonierbale, M.; Amoros, W. Anthocyanin, carotenoid content, and antioxidant values in native South American potato cultivars. HortScience 2007, 42, 1733–1736. [Google Scholar] [CrossRef]
  20. Kaspar, K.L.; Park, J.S.; Brown, C.R.; Weller, K.; Ross, C.F.; Mathison, B.D.; Chew, B.P. Sensory Evaluation of Pigmented Flesh Potatoes (Solanum tuberosum L.). Food Nutr. Sci. 2013, 4, 77–81. [Google Scholar] [CrossRef]
  21. Tsuda, T.; Horio, F.; Osawa, T. The role of anthocyanins as an antioxidant under oxidative stress in rats. Biofactors 2000, 13, 133–139. [Google Scholar] [CrossRef]
  22. Eichhorn, S.; Winterhalter, P. Anthocyanins from pigmented potato (Solanum tuberosum L.) varieties. Food Res. Int. 2005, 38, 943–948. [Google Scholar] [CrossRef]
  23. Lachman, J.; Hamouz, K.; Šulc, M.; Orsák, M.; Pivec, V.; Hejtmánková, A.; Dvořák, P.; Čepl, J. Cultivar differences of total anthocyanins and anthocyanidins in red and purple-fleshed potatoes and their relation to antioxidant activity. Food Chem. 2009, 114, 836–843. [Google Scholar] [CrossRef]
  24. Lewis, C. Anthocyanins and Related Compounds in Potatoes (Solanum tuberosum L.). Ph.D. Thesis, University of Canterbury, Christchurch, New Zealand, 1996. [Google Scholar]
  25. Zhang, Y.; Jung, C.S.; De Jong, W.S. Genetic analysis of pigmented tuber flesh in potato. Theor. Appl. Genet. 2009, 119, 143–150. [Google Scholar] [CrossRef] [Green Version]
  26. He, F.; Mu, L.; Yan, G.L.; Liang, N.N.; Pan, Q.H.; Wang, J.; Reeves, M.J.; Duan, C.Q. Biosynthesis of anthocyanins and their regulation in colored grapes. Molecules 2010, 15, 9057–9091. [Google Scholar] [CrossRef] [PubMed]
  27. Champagne, A.; Hilbert, G.; Legendre, L.; Lebot, V. Diversity of anthocyanins and other phenolic compounds among tropical root crops from Vanuatu, South Pacific. J. Food Compos. Anal. 2011, 24, 315–325. [Google Scholar] [CrossRef]
  28. Jiao, Y.; Jiang, Y.; Zhai, W.; Yang, Z. Studies on antioxidant capacity of anthocyanin extract from purple sweet potato (Ipomoea batatas L.). Afr. J. Biotechnol. 2012, 11, 7046–7054. [Google Scholar] [CrossRef]
  29. Hamouz, K.; Lachman, J.; Pazderů, K.; Tomášek, J.; Hejtmánková, K.; Pivec, V. Differences in anthocyanin content and antioxidant activity of potato tubers with different flesh colour. Plant Soil Environ. 2011, 57, 478–485. [Google Scholar] [CrossRef] [Green Version]
  30. Han, K.H.; Sekikawa, M.; Shimada, K.I.; Hashimoto, M.; Hashimoto, N.; Noda, T.; Tanaka, H.; Fukushima, M. Anthocyanin-rich purple potato flake extract has antioxidant capacity and improves antioxidant potential in rats. Br. J. Nutr. 2006, 96, 1125–1134. [Google Scholar] [CrossRef] [PubMed] [Green Version]
  31. Pillai, S.S.; Navarre, D.A.; Bamberg, J. Analysis of Polyphenols, Anthocyanins and Carotenoids in Tubers from Solanum tuberosum Group Phureja, Stenotomum and Andigena. Am. J. Potato Res. 2013, 90, 440–450. [Google Scholar] [CrossRef]
  32. Fossen, T.; Øvstedal, D.O.; Slimestad, R.; Andersen, Ø.M. Anthocyanins from a Norwegian potato cultivar. Food Chem. 2003, 81, 433–437. [Google Scholar] [CrossRef]
  33. Burmeister, A.; Bondiek, S.; Apel, L.; Kühne, C.; Hillebrand, S.; Fleischmann, P. Comparison of carotenoid and anthocyanin profiles of raw and boiled Solanum tuberosum and Solanum phureja tubers. J. Food Compos. Anal. 2011, 24, 865–872. [Google Scholar] [CrossRef]
  34. Hejtmánková, K.; Kotíková, Z.; Hamouz, K.; Pivec, V.; Vacek, J.; Lachman, J. Influence of flesh colour, year and growing area on carotenoid and anthocyanin content in potato tubers. J. Food Compos. Anal. 2013, 32, 20–27. [Google Scholar] [CrossRef]
  35. Grotewold, E. The genetics and biochemistry of floral pigments. Rev. Plant Biol. 2006, 57, 761–780. [Google Scholar] [CrossRef]
  36. Holton, T.A.; Cornish, E.C. Genetics and biochemistry of anthocyanin biosynthesis. Plant Cell 1995, 7, 1071–1083. [Google Scholar] [CrossRef] [PubMed]
  37. Martin, C.; Prescott, A.; Mackay, S.; Bartlett, J.; Vrijlandt, E. Control of anthocyanin biosynthesis in flowers of Antirrhinum majus. Plant J. 1991, 1, 37–49. [Google Scholar] [CrossRef] [PubMed]
  38. Van Eck, H.J.; Jacobs, J.M.E.; Van Den Berg, P.M.M.M.; Stiekema, W.J.; Jacobsen, E. The inheritance of anthocyanin pigmentation in potato (Solatium tuberosum L.) and mapping of tuber skin colour loci using RFLPs. Heredity (Edinb.) 1994, 73, 410–421. [Google Scholar] [CrossRef]
  39. De Jong, W.S.; Eannetta, N.T.; De Jong, D.M.; Bodis, M. Candidate gene analysis of anthocyanin pigmentation loci in the Solanaceae. Theor. Appl. Genet. 2004, 108, 423–432. [Google Scholar] [CrossRef] [PubMed]
  40. Dodds Ks Long, D.H. The inheritance of colour in diploid potatoes. J. Genet. 1955, 53, 136–149. [Google Scholar] [CrossRef]
  41. Salaman, R.N. The inheritance of colour and other characters in the potato. J. Genet. 1910, 1, 7–46. [Google Scholar] [CrossRef]
  42. Dodds, E.S.; Long, D.H. The inheritance oe colour in diploid potatoes II. A three-factor linkage group. J. Genet. 1956, 54, 27. [Google Scholar] [CrossRef]
  43. De Jong, H. Inheritance of anthocyanin pigmentation in the cultivated potato: A critical review. Am. Potato J. 1991, 68, 585–593. [Google Scholar] [CrossRef]
  44. De Jong, W.S.; De Jong, D.M.; De Jong, H.; Kalazich, J.; Bodis, M. An allele of dihydroflavonol 4-reductase associated with the ability to produce red anthocyanin pigments in potato (Solanum tuberosum L.). Theor. Appl. Genet. 2003, 107, 1375–1383. [Google Scholar] [CrossRef]
  45. Jung, C.S.; Griffiths, H.M.; De Jong, D.M.; Cheng, S.; Bodis, M.; De Jong, W.S. The potato P locus codes for flavonoid 3′, 5′-hydroxylase. Theor. Appl. Genet. 2005, 110, 269–275. [Google Scholar] [CrossRef]
  46. Baudry, A.; Caboche, M.; Lepiniec, L. TT8 controls its own expression in a feedback regulation involving TTG1 and homologous MYB and bHLH factors, allowing a strong and cell-specific accumulation of flavonoids in Arabidopsis thaliana. Plant J. 2006, 46, 768–779. [Google Scholar] [CrossRef] [PubMed]
  47. Hall, R.D.; Beekwilder, J. Control of anthocyanin and non-flavonoid compounds by anthocyanin-regulating MYB and bHLH transcription factors in Nicotiana benthamiana leaves. Front. Plant Sci. 2014, 5, 519. [Google Scholar] [CrossRef]
  48. Liu, Y.; Wang, K.L.; Espley, R.V.; Wang, L.; Yang, H.; Yu, B.; Dare, A.; Varkonyi-Gasic, E.; Wang, J.; Zhang, J.; et al. Functional diversification of the potato R2R3 MYB anthocyanin activators AN1, MYBA1, and MYB113 and their interaction with basic helix-loop-helix cofactors. J. Exp. Bot. 2016, 67, 2159–2176. [Google Scholar] [CrossRef] [PubMed]
  49. Payyavula, R.; Singh, R.; Navarre, D. Transcription factors, sucrose and sucrose metabolic genes interact to regulate potato phenylpropanoid metabolism. J. Exp. Bot. 2013, 64, 5115–5131. [Google Scholar] [CrossRef] [PubMed]
  50. Rommens, C.M.; Richael, C.M.; Yan, H.; Navarre, D.A.; Ye, J.; Krucker, M.; Swords, K. Engineered native pathways for high kaempferol and caffeoylquinate production in potato. Plant Biotechnol. J. 2008, 6, 870–886. [Google Scholar] [CrossRef] [PubMed]
  51. Springob, K.; Nakajima, J.; Yamazaki, M.; Saito, K. Recent advances in the biosynthesis and accumulation of anthocyanins. Nat. Prod. Rep. 2003, 20, 288–303. [Google Scholar] [CrossRef] [PubMed]
  52. Mano, H.; Ogasawara, F.; Sato, K.; Higo, H.; Minobe, Y. Isolation of a Regulatory Gene of Anthocyanin Biosynthesis in Tuberous Roots of Purple-Fleshed Sweet Potato. Plant Physiol. 2007, 143, 1252–1268. [Google Scholar] [CrossRef] [Green Version]
  53. Zhang, Y.; Cheng, S.; De Jong, D.; Griffiths, H.; Halitschke, R.; De Jong, W. The potato R locus codes for dihydroflavonol 4-reductase. Theor. Appl. Genet. 2009, 119, 931–937. [Google Scholar] [CrossRef] [Green Version]
  54. D’hoop, B.B.; Keizer, P.L.C.; Paulo, M.J.; Visser, R.G.F.; van Eeuwijk, F.A.; van Eck, H.J. Identification of agronomically important QTL in tetraploid potato cultivars using a marker-trait association analysis. Theor. Appl. Genet. 2014, 127, 731–748. [Google Scholar] [CrossRef]
  55. Kumar, D.; Singh, B.P.; Kumar, P. An overview of the factors affecting sugar content of potatoes. Ann. Appl. Biol. 2004, 145, 247–256. [Google Scholar] [CrossRef]
  56. Duarte-Delgado, D.; Ñústez-López, C.E.; Narváez-Cuenca, C.E.; Restrepo-Sánchez, L.P.; Melo, S.E.; Sarmiento, F.; Kushalappa, A.C.; Mosquera-Vásquez, T. Natural variation of sucrose, glucose and fructose contents in Colombian genotypes of Solanum tuberosum Group Phureja at harvest. J. Sci. Food Agric. 2016, 96, 4288–4294. [Google Scholar] [CrossRef] [PubMed] [Green Version]
  57. Colmenares, G.A. Stratified/PCA: Un método de preprocesamiento de datos y variables para la construcción de modelos de redes neuronales. Rev. Econ. 2000, 16, 1–31. [Google Scholar]
  58. Ripley, B.D. The R project in statistical computing. MSOR Connect. Newsl. LTSN Maths Stats OR Netw. 2001, 1, 23–25. [Google Scholar] [CrossRef]
  59. Poland, J.A.; Rife, T.W. Genotyping-by-sequencing for plant breeding and genetics. Plant Genome 2012, 5, 92–102. [Google Scholar] [CrossRef]
  60. Sonah, H.; Bastien, M.; Iquira, E.; Tardivel, A.; Légaré, G.; Boyle, B.; Normandeau, É.; Laroche, J.; Larose, S.; Jean, M.; et al. An Improved Genotyping by Sequencing (GBS) Approach Offering Increased Versatility and Efficiency of SNP Discovery and Genotyping. PLoS ONE 2013, 8, e54603. [Google Scholar] [CrossRef]
  61. Duitama, J.; Quintero, J.C.; Cruz, D.F.; Quintero, C.; Hubmann, G.; Foulquie-Moreno, M.R.; Verstrepen, K.J.; Thevelein, J.M.; Tohme, J. An integrated framework for discovery and genotyping of genomic variants from high-throughput sequencing experiments. Nucleic Acids Res. 2014, 42, e44. [Google Scholar] [CrossRef] [PubMed]
  62. Potato Genome Sequencing Consortium. Genome sequence and analysis of the tuber crop potato. Nature 2011, 475, 189–195. [Google Scholar] [CrossRef]
  63. Marchini, J.; Howie, B. Genotype imputation for genome-wide association studies. Nat. Rev. Genet. 2010, 11, 499–511. [Google Scholar] [CrossRef] [PubMed]
  64. Juyó, D.; Sarmiento, F.; Álvarez, M.; Brochero, H.; Gebhardt, C.; Mosquera, T. Genetic diversity and population structure in diploid potatoes of Solanum tuberosum group phureja. Crop Sci. 2015, 55, 760–769. [Google Scholar] [CrossRef]
  65. Zhang, Z.; Ersoz, E.; Lai, C.Q.; Todhunter, R.J.; Tiwari, H.K.; Gore, M.A.; Bradbury, P.J.; Yu, J.; Arnett, D.K.; Ordovas, J.M.; et al. Mixed linear model approach adapted for genome-wide association studies. Nat. Genet. 2010, 42, 355–360. [Google Scholar] [CrossRef] [Green Version]
  66. Lipka, A.E.; Tian, F.; Wang, Q.; Peiffer, J.; Li, M.; Bradbury, P.J.; Gore, M.A.; Buckler, E.S.; Zhang, Z. GAPIT: Genome association and prediction integrated tool. Bioinformatics 2012, 28, 2397–2399. [Google Scholar] [CrossRef] [PubMed]
  67. Sukumaran, S.; Xiang, W.; Bean, S.R.; Pedersen, J.F.; Kresovich, S.; Tuinstra, M.R.; Tesso, T.T.; Hamblin, M.T.; Yu, J. Association Mapping for Grain Quality in a Diverse Sorghum Collection. Plant Genome J. 2012, 5, 126–135. [Google Scholar] [CrossRef]
  68. Turner, S.D. qqman: An R package for visualizing GWAS results using QQ and manhattan plots. Biorxiv 2014, 005165. [Google Scholar] [CrossRef]
  69. Johnson, R.C.; Nelson, G.W.; Troyer, J.L.; Lautenberger, J.A.; Kessing, B.D.; Winkler, C.A.; O’Brien, S.J. Accounting for multiple comparisons in a genome-wide association study (GWAS). BMC Genom. 2010, 11, 724. [Google Scholar] [CrossRef] [PubMed]
  70. Jung, C.S.; Griffiths, H.M.; De Jong, D.M.; Cheng, S.; Bodis, M.; Kim, T.S.; De Jong, W.S. The potato developer (D) locus encodes an R2R3 MYB transcription factor that regulates expression of multiple anthocyanin structural genes in tuber skin. Theor. Appl. Genet. 2009, 120, 45–57. [Google Scholar] [CrossRef] [Green Version]
  71. Vos, P.G.; Paulo, M.J.; Voorrips, R.E.; Visser, R.G.F.; van Eck, H.J.; van Eeuwijk, F.A. Evaluation of LD decay and various LD-decay estimators in simulated and SNP-array data of tetraploid potato. Theor. Appl. Genet. 2017, 130, 123–135. [Google Scholar] [CrossRef] [PubMed]
  72. Spelt, C.; Quattrocchio, F.; Mol, J.N.; Koes, R. Anthocyanin1 of Petunia Encodes a Basic Helix-Loop-Helix Protein That Directly Activates Transcription of Structural Anthocyanin Genes. Plant Cell 2000, 12, 1619–1631. [Google Scholar] [CrossRef]
  73. Allan, A.; Hellens, R.; Laing, W. MYB transcription factors that colour our fruit. Trends Plant Sci. 2008, 13, 99–102. [Google Scholar] [CrossRef]
  74. Gonzalez, A.; Zhao, M.; Leavitt, J.; Lloyd, A. Regulation of the anthocyanin biosynthetic pathway by the TTG1/bHLH/Myb transcriptional complex in Arabidopsis seedlings. Plant J. 2008, 53, 814–827. [Google Scholar] [CrossRef]
  75. Mathews, H.; Clendennen, S.K.; Caldwell, C.G.; Liu, X.L.; Connors, K.; Matheis, N.; Schuster, D.K.; Menasco, D.J.; Wagoner, W.; Lightner, J.; et al. Activation tagging in tomato identifies a transcriptional regulator of anthocyanin biosynthesis, modification, and transport. Plant Cell 2003, 15, 1689–1703. [Google Scholar] [CrossRef]
Figure 1. Chromatographic profile of anthocyanidins in the genotype CCC023 recorded at 520 nm. Retention times were: 1: delphinidin (8.07 min); 2: cyanidin (11.59 min); 3: petunidin (13.21 min); 4: pelargonidin (14.92 min); 5: peonidin (16.31 min).
Agronomy 09 00366 g001
Figure 2. Principal component analysis-cluster analysis, over two principal components, of Solanum tuberosum L. accessions Group Phureja in cooked tubers. The direction of the vectors represents the anthocyanidins: petunidin, cyaniding, delphinidin, peonidin, and pelargonidin values.
Agronomy 09 00366 g002
Figure 3. Physical position of Single-nucleotide polymorphisms (SNPs) for anthocyanidin content in cooked tubers of S. tuberosum Group PhurejaIn red it is shown SNP markers significantly associated in this study. In blue genes that are within ± 100 kb of the associated SNPs involved in the anthocyanin biosynthetic pathway. In green other transcription factors and genes reported as associated with the anthocyanin biosynthetic pathway [45,48,49,70]. The genetic distances are given in Mbp, according to the current reference genome DM–v4. Black represents the markers that limit each chromosome in the potato genome. Diagram plotted with MapChart software.
Agronomy 09 00366 g003
Table 1. Summary of genome associations for anthocyanidins content. Anthocyanidin, quantitative trait loci (QTL) name, chromosome, genome position, their significance, and gene annotation are shown.
AnthocyanidinsQTL NameChrPositionp-ValueModel R2EffectGene Annotation
CyanidinAnthoX_ChloroX520048681.23 × 10−60.400−0.222Chloroplast threonine deaminase 1
AnthoX_STSX522615534.75 × 10−60.374−0.024STS14 protein
AnthoI_Ser/Thr I507854051.51 × 10−40.3130.313Serine/threonine-protein phosphatase
DelphinidinAnthoX_ChloroX520048685.97 × 10−50.3840.121Chloroplast threonine deaminase 1
AnthoX_STSX522615535.97 × 10−50.3840.048STS14 protein
AnthoXIXI400019001.04 × 10−40.374−0.100No functional annotation
PelargonidinAnthoX_ChloroX522615536.06 × 10−70.439−0.670STS14 protein
AnthoX_STSX520048688.58 × 10−70.433−0.308Chloroplast threonine deaminase 1
AnthoX_AdenyX573018642.91 × 10−60.411−0.670Adenylyl-sulfate kinase
AnthoX_ChloroIX520049401.02 × 10−50.389−0.330Chloroplast threonine deaminase 1
PeonidinAnthoX_ChloroX520048682.87 × 10−50.444−0.071Chloroplast threonine deaminase 1
AnthoX_STSX522615532.87 × 10−50.444−0.052STS14 protein
PetunidinAnthoXIIXII242591821.99 × 10−50.382−0.483Hypothetical gene of unknown function
AnthoX_ChloroX520048687.11 × 10−50.361−0.103Chloroplast threonine deaminase 1
AnthoIIII485171421.08 × 10−40.354−0.523No functional annotation

