Article

Effect of Traditional Cultivation Management on CO2 Flux in the Dry Tropical Cropland of South India

1
Graduate School of Agriculture, Tokyo University of Agriculture and Technology, 3-5-8 Saiwai-cho, Fuchu-shi, Tokyo 183-8509, Japan
2
National Museum of Ethnology, 10-1 Senri Expo Park, Suita-shi, Osaka 565-8511, Japan
3
Faculty of Education, Wakayama University, 930 Sakaedani, Wakayama-shi, Wakayama 640-8510, Japan
4
Tamil Nadu Agricultural University, Coimbatore 641003, Tamil Nadu, India
5
Research Institute for Humanity and Nature, 457-4 Motoyama, Kamigamo, Kita-ku, Kyoto-shi, Kyoto 603-8047, Japan
*
Author to whom correspondence should be addressed.
Agronomy 2019, 9(7), 347; https://doi.org/10.3390/agronomy9070347
Submission received: 22 March 2019 / Revised: 17 June 2019 / Accepted: 21 June 2019 / Published: 1 July 2019

Abstract

:
Soils in tropical croplands are becoming degraded because of soil carbon (C) depletion. Local farmers in South India use a specific management of traditional cultivation, i.e., broadcast seeding. However, for sustainable C management, there is no quantitative data on the CO2 flux under this management. Our objectives were to (1) estimate the annual CO2 flux, and (2) evaluate the effect of traditional cultivation management (seeding rate) on the CO2 flux. Our field experiment was conducted in South India, from 2015 to 2017, including two cultivation periods with four cultivation management treatments (traditional cultivation management plot (T), fixed density plot (FD), no thinning plot (NT), and bare plot (B)). The seeding rate in the FD plot was ca. 50% of the T plot. We applied 1.1 Mg C ha−1 farmyard manure just before the experiment as a C input. We found that broadcasting, thinning, and cultivation increased soil moisture, while the CO2 efflux rate showed no significant difference between treatments throughout the experimental period. This indicates that cultivation management did not affect the CO2 flux. The total CO2 fluxes for two years were estimated at 2.2–2.7 Mg C ha−1. Our results indicate that it is necessary to apply larger or more frequent C inputs to prevent C depletion.

1. Introduction

Soil organic carbon (SOC) plays an important role in global carbon cycling and soil productivity, so the evaluation of soil carbon (C) dynamics worldwide is crucial in relation to climate change and soil fertility [1,2,3]. In tropical areas, due to high rates of soil organic matter decomposition [4,5], soils are facing an urgent problem of soil degradation, caused by the depletion of soil C stocks [6,7]. Srinivasarao et al. [8] conducted a survey at 21 locations in different land uses, covering 13 states in the dry tropical area of India, and found that these soils were low in SOC (<5 g kg−1). To maintain SOC levels in the degraded croplands of India, the application of higher or repeated C inputs, such as crop residues and organic materials, is needed [9,10]. Traditionally, most local Indian farmers use the harvested plant residues for livestock fodder, and no plant material is returned to the cropland soil [10], but they make the farmyard manure (FYM) from livestock excreta and soil, to maintain soil fertility [11]. Thus, it is important to evaluate the SOC dynamics, based on the in situ data of C flows, such as C inputs and C outputs, for sustainable C management in the dry tropical area of India [11].
There are many studies related to SOC dynamics in the tropics, but most of these studies evaluate only changes in soil C stocks (i.e., C stocks), but not the CO2 flux (i.e., C flow). In the case of India, most studies were conducted in forests [12,13,14], grasslands [15,16], and savannas [17], but few studies occurred in croplands [18,19]. In addition, dry tropical ecosystems have a substantial annual variability in precipitation (30–40% coefficient of variation), compared to humid and mesic climate zones [20], and monitoring environmental factors, such as precipitation and soil moisture, every year is desirable to estimate the annual CO2 flux in these areas. Therefore, it is necessary to evaluate the CO2 efflux rate, such as the heterotrophic soil CO2 efflux rate, with environmental factors to estimate the annual CO2 flux for a multi-year period in the dry tropical croplands of India.
In dry tropical croplands of South India, according to traditional sorghum cultivation management, local farmers broadcast the seeds of sorghum (seeding rate is ca. 34.4 kg ha−1), while most modern cereal crops are generally planted by fixed density (rather than broadcasting). Indian farmers thin out the plants about one month after broadcast seeding, depending on the precipitation and the soil moisture’s condition (seeding rate generally becomes ca. 15.6–20.0 kg ha−1 (16 plants m−2) after thinning, i.e., roughly half of the seeding rate of the initial broadcast). Many studies report that the seeding rate significantly affects plant transpiration, resulting in different soil moisture conditions [21,22]. Because studies have shown that soil moisture is the most important controlling factor in CO2 flux in dry tropical areas [23,24], it is assumed that traditional cultivation management (i.e., broadcasting the sorghum seeds and thinning) could affect the soil moisture dynamics and CO2 flux, compared with so-called general cultivation management, such as fixed seeding density. There is little quantitative information about the effect of traditional cultivation management on the CO2 flux in dry tropical croplands of India. Thus, it is necessary to evaluate the effect of traditional cultivation management on the CO2 flux.
In this study, we hypothesized that traditional cultivation management, that is, broadcasting the seeds and thinning after one month, would affect the CO2 flux through different soil moisture dynamics, compared with the fixed seeding density management. Therefore, our objectives were to: (1) Estimate the annual CO2 flux by measuring the CO2 efflux rate and monitoring environmental factors under different cultivation managements and (2) evaluate the effect of traditional cultivation management on the CO2 flux (C flow) in a dry tropical cropland of South India.

2. Materials and Methods

2.1. Description of Study Sites

We conducted a field experiment from September 2015 to August 2017 (2 years total) in an agricultural field of a local farmer in Madurai, Tamil Nadu state, India. The field was located at 9°43′22.37″ N and 77°46′51.61″ E and elevation was 175 m. The mean annual temperature was 28.2 °C and the annual precipitation was 857–1048 mm (2015–2017). In this area, about 40–75% of annual precipitation occurs in the rainy season (September–December). According to interviews with the local farmer, the field has been continuously cultivated with various crops for more than 100 years; for example, sorghums, finger millets, and groundnuts. Soil was classified into Typic Haplustepts [25]. The soil chemical properties of the surface layer (0–15 cm depth; plowing layer) were as follows: Soil pH (1:5 water) was 8.5, total carbon (TC) was 3.3 g kg−1, soil organic carbon (SOC) was 3.2 g kg−1, soil inorganic carbon was 0.1 g kg−1, clay content was 27.2%, cation exchange capacity was 25.1 cmolc kg−1, and soil bulk density was 1.57 g cm−3. The surface SOC stock (0–15 cm depth) was 7.9 Mg C ha−1.

2.2. Experimental Design

The experimental design involved the following four treatments:
  • Traditional cultivation management plot (sorghum seeds were broadcast and thinned); hereafter referred as the traditional cultivation management ‘(T) plot’;
  • Fixed density plot (sorghum seeds sowed at fixed density (distance between plants was 30 cm) and not thinned); hereafter referred as the fixed density ‘(FD) plot’;
  • No thinning plot (sorghum seeds were broadcast but not thinned); hereafter referred as the no thinning ‘(NT) plot’;
  • No cultivation plot; hereafter referred as the bare ‘(B) plot’.
The experiment was laid out in a randomized block design using three replicate plots per treatment (4 treatments × 3 replications = 12 plots); an unplanted strip of 1 m separated each block, and each experimental plot was 64 m2 (8 m × 8 m). The cultivation crop was sorghum (Sorghum bicolor K8). The seeding rate was 220 g plot−1 (34.4 kg ha−1) in the T and NT plot and 100 g plot−1 (15.6 kg ha−1) in the FD plot. In the FD plot, we made small holes in the soil surface and sowed sorghum seeds in these holes at a fixed density (16 plants m−2). Plant density in the traditional cultivation management was generally ca. 13–19 plants m−2 after thinning, therefore, we used this density in the FD plot. The NT plot was used to evaluate the effect of thinning on the CO2 flux, compared with the T plot, while the B plot was treated as a control plot to evaluate the effect of crop cultivation on the CO2 flux.
Table 1 shows the summary of the 2-year field experimental schedule. In all treatment plots, 1.1 Mg C ha−1 FYM made from livestock excreta with soil was applied and incorporated into the soil (to 15 cm depth) using a plow just before the experiment, as usual in this area. The amount of FYM was the representative and conventional amount used in this area, and local farmers generally applied FYM every 2–3 years in recent years. The amount of applied FYM C was determined by measuring the dry weight, as well as the C content of FYM using a dry combustion method with a CN analyzer SUMIGRAPH NC TR-22 (Sumika Chemical Analysis Service, Osaka, Japan). The C:N ratio of FYM was ca. 10.8. Chemical fertilizer was also applied every year in all plots as follows: Urea and diammonium phosphate (DAP) were broadcast separately, that is, 13 kg N ha−1 and 20 kg P ha−1 at the time of seeding and 27 kg N ha−1 4 weeks after seeding. These amounts of chemical fertilizer followed the recommendation of the Southern Indian government [26]. Sorghum was planted in October and was harvested at the end of January in 2016 and 2017. Every cultivation period, we conducted hand weeding every month after seeding and removed all short grass biomass in all treatment plots. After harvest, aboveground plant biomass (stems and leaves) was removed from the field in all plots, as local farmers traditionally use these biomasses for animal feeds.

2.3. Measurement of Environmental Factors

The volumetric moisture content, air temperature, soil temperature, and precipitation were measured using a data logger system (CR1000 data logger; Campbell Scientific, Inc., Logan, UT, USA). The volumetric moisture content in the surface soil (0–15 cm depth) was monitored every 30 min in three replicates for only one plot per each cultivation management plot (CS616 probes for soil volumetric moisture were connected to the CR1000 data logger system). The moisture probes were installed near the polyvinyl chloride (PVC) columns (see below). Air temperature was monitored every 30 min c.a. 100 cm above the ground using a 41303-5B radiation shield (Campbell Scientific, Inc.), and soil temperature (5 cm depth) was monitored every 30 min in three replicates for only one plot per each cultivation management plot (Model 108 thermistor probes for temperature were connected to the CR1000 data logger system). Precipitation was also monitored every 30 min using a TE525MM rain gauge (Campbell Scientific, Inc.).

2.4. Measurement of Heterotrophic Soil CO2 Efflux Rate

The CO2 efflux rate, i.e., the heterotrophic soil CO2 efflux rate in this study, was measured, using a closed-chamber system at a frequency of approximately 2 weeks in the rainy season and 1 month in the dry season, a total of 32 times during the 2 years of the experiment. Within the 32 measurements, we measured the heterotrophic soil CO2 efflux rate 10 times 1 or 2 days after the precipitation (>10 mm day−1) to consider the effect of the precipitation event on the CO2 flux. PVC columns (diameter 13 cm, height 30 cm) were installed randomly in each plot at the end of August 2015, i.e., after FYM application. To not disturb the plots when installing the PVC columns, we waited at least 1 week after the installation before measuring the heterotrophic soil CO2 efflux rate. Columns were re-installed within a plot every year, as mentioned above. As soil respiration consists of plant-root respiration and microbial respiration, we excluded the plant-root respiration using the trenching method, according to Shinjo et al. [27], as follows. PVC columns were installed into the soil to a depth of 15 cm, i.e., the main rooting zone, and the bottom of the collars was covered with a fine plastic mesh to support the soil in the PVC column sample and to maintain the same soil moisture condition as outside the PVC column. For each measurement, to block CO2 from plant-root respiration, we first removed the PVC column containing soil and covered the bottom of the column by a plastic sheet. We then put the column in the hole again. After that, we sampled the gases in the headspace of the PVC column at 0 min (before covering) and 40 min after the top of the column was covered with a plastic vinyl sheet. We had already checked the linear increase in CO2 concentration in the PVC column for 40 min both in the dry and rainy seasons. The gas samples were collected into pre-evacuated 30 mL glass vials using a 50 mL syringe and analyzed with an infrared CO2 analyzer (ZFP9-AA11; Fuji Electric, Tokyo, Japan) equipped with a voltage capture detector (C-R8A; Shimadzu, Kyoto, Japan) and N2 carrier gas [27]. The CO2 analyzer was calibrated using more than five concentrations of each standard CO2 gas (1000–8000 ppm). The CO2 efflux rate was calculated based on the increase of CO2 concentration in the column after 40 min. Five columns were inserted in each plot, and we used the average of the five measurements per treatment plot. All field measurements were conducted between 8:00 and 11:00 h.

2.5. Measurement of Sorghum Root-C as C Input

To estimate the amount of belowground C input, we collected the main roots from the soil surface (0–15 cm depth) only in the T plot by digging the root system manually at the end of the experiment (3 replications). The root samples were completely dried for more than two days at 70 °C and the C content was measured, as mentioned above. In this experiment, we used the root-C in the T plot as the representative in this study, because there was little variability of root biomass between the treatments based on our field observation. Generally, belowground C input can be calculated by the sum of root-C and net rhizodeposition [28]. Pausch and Kuzyakov [28] reviewed and estimated that the net rhizodeposition-to-root ratios were 0.5 ± 0.1 in the croplands based on the 20 studies, including 99 datasets. Thus, we underestimated the actual total belowground C input because we did not measure net rhizodeposition, though we could estimate it as ca. 50% of measured root-C.

2.6. Data Analyses

All statistical analyses were performed with SYSTAT 12.5 (SYSTAT Software, Richmond, CA, USA). All data is expressed on a dry weight basis. To assess the effect of broadcasting on soil moisture and CO2 efflux rate between the T and FD plot, a two-way repeated-measures analysis of variance (RM-ANOVA) was used for each experimental year (from September 2015 to August 2016 and from September 2016 to August 2017). Similarly, to assess the effect of thinning on soil moisture and CO2 efflux rate between the T and NT plot, and to assess the effect of cultivation on soil moisture and CO2 efflux rate between the T and B plot, during each experimental year, two-way RM-ANOVA was conducted. All variables were tested for normality of distribution before the analysis. In all cases, p < 0.05 was considered significant.
To estimate the annual CO2 flux from the field data, we first derived an equation that represented the relationship between the in situ soil respiration rate and environmental factors, such as soil moisture and soil temperature by multiple regression analysis, according to Sugihara et al. [29]. We then calculated the daily soil respiration rate by substituting each parameter of the equation using monitored data and summed up the daily soil respiration rates for a given period. In the first step, we assumed that the Arrhenius relationship was as follows:
Cem = aMb exp(−E/RT)
where Cem is the hourly CO2 efflux rate (mol C ha−1 h−1), M is the volumetric soil moisture content (m3 m−3; 0.12 < M < 0.27), E is the activation energy (J mol−1), R is the gas constant (8.31 J mol−1 K−1), T is the absolute soil temperature (K), b is a coefficient related to the contribution of soil moisture, and a is a constant (adopted in Funakawa et al. [30] and Shinjo et al. [27]). The equation was then rewritten in the logarithm form:
InCem = Ina + blnME/RT
A series of coefficients, a, b, and E were then calculated by stepwise multiple regression analysis, using the measured data, Cem, M, and T. Due to the large annual variation of precipitation and disturbance, such as mechanical plowing and cultivation, we separately conducted the above analysis for each year, that is, the first year (from September 2015 to August 2016) and second year (from September 2016 to August 2017). In this paper, after the stepwise regression analysis, due to the multicollinearity for soil moisture and soil temperature in this experiment, the CO2 efflux rate was significantly correlated only with soil moisture in all plots in both years, except for the NT and B plot in the first year, and thus the estimation was conducted by single regression equation.

3. Results

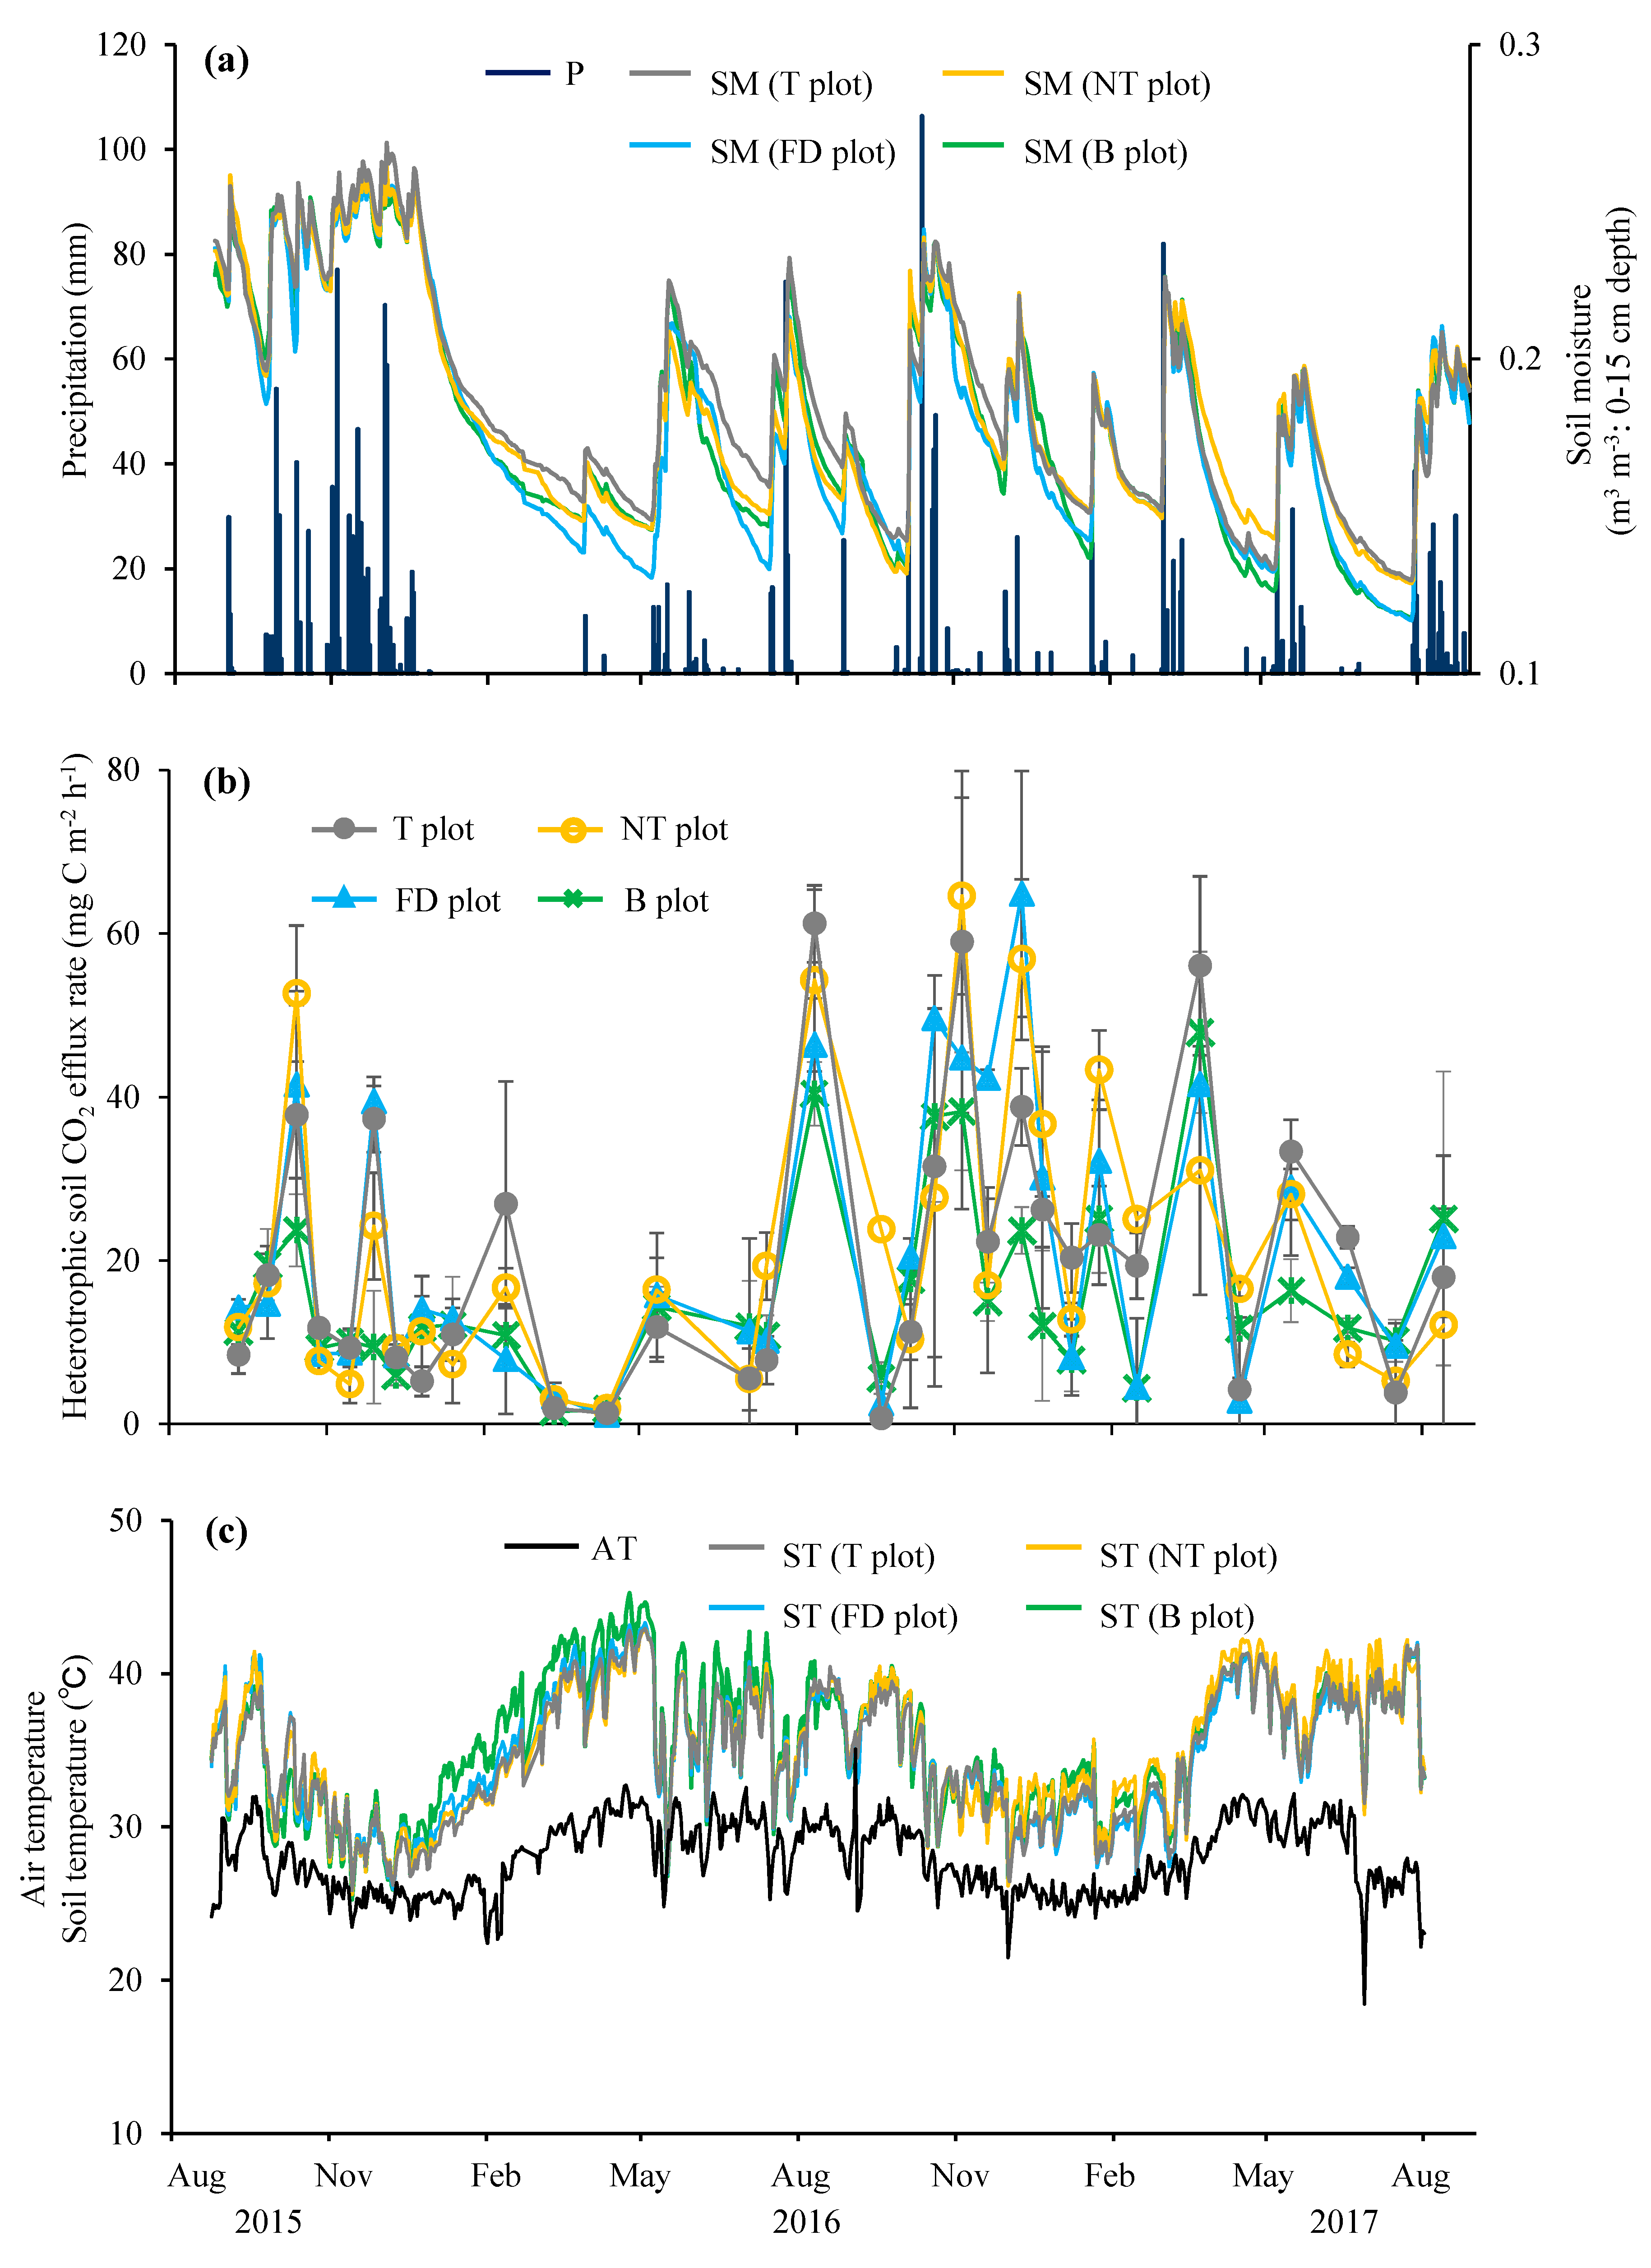
3.1. Environmental Factors

Figure 1a presents the seasonal fluctuations of precipitation and soil moisture content (m3 m−3) (0–15 cm) during the experimental period. Annual precipitation in the first experimental year (from September 2015 to August 2016) (1048 mm) was higher than that of the second experimental year (from September 2016 to August 2017) (857 mm). During the rainy season (from September to December) of the first year, it rained continuously, and 75% of annual precipitation (790 mm) was concentrated. In contrast, there was only 40% of the annual precipitation (341 mm) in the rainy season of the second year, and it rained intermittently throughout the second year. During the rainy season of the first year, the average soil moisture content was 0.24 m3 m−3 and soil moisture remained high (over 0.20 m3 m−3), while soil moisture in the second year showed a distinct fluctuation (0.12–0.24 m3 m−3) in response to each precipitation event. Table 2 presents the summary of the two-way RM-ANOVA for the effect of broadcasting, thinning, and cultivation on soil moisture in each experimental year. Broadcasting and thinning significantly affected the soil moisture only in the first year, while cultivation also significantly affected the soil moisture in both years. Based on the results of soil moisture fluctuation in Figure 1a, the above managements clearly increased the soil moisture.
Figure 1c presents the seasonal fluctuations of air temperature and soil temperature (5 cm depth) during the experimental period. Air temperature fluctuated from 18.4 °C to 35.1 °C, and averaged air temperature was 27.8 °C throughout the experimental period. Soil temperature fluctuated in response to air temperature throughout the experimental period, and the difference between air temperature and soil temperature was up to c.a. 10 °C. Average soil temperature was 34.6, 34.9, 34.7, and 35.6 °C (first year) and 34.7, 34.5, 35.4, and 35.1 °C (second year) in the T, FD, NT, and B plot, respectively, and there was no clear difference between treatments.

3.2. Seasonal Fluctuation of Heterotrophic Soil CO2 Efflux Rate

Figure 1b presents the rate of CO2 emissions at measurement days. The average CO2 efflux rate was 13.5, 14.2, 13.9, and 11.0 mg C m−2 h−1 (the first year) and 28.7, 35.9, 36.6, and 22.7 mg C m−2 h−1 (the second year) in the T, FD, NT, and B plots, respectively. In all plots, the CO2 efflux rate in the first year was smaller than that in the second year. The CO2 efflux rate in the first year showed small seasonal fluctuations compared to that in the second year, which fluctuated with precipitation events. Over the experimental period, the average CO2 efflux rate was 20.5 mg C m−2 h−1 in the T plot. Two-way RM-ANOVA showed that no treatment significantly affected the CO2 efflux rate throughout the experimental period (Table 2).

3.3. Estimation of Annual CO2 Flux

Table 3 presents the result of regression analysis and estimated CO2 flux in each treatment plot in each year. The CO2 efflux rate was significantly correlated only with soil moisture in all plots in both years, except for the NT and B plot in the first year. In the NT plot of the first year, the CO2 efflux rate was positively correlated with soil moisture, though it was not significant (R = 0.42, p = 0.11). In the B plot of the first year, the CO2 efflux rate was significantly correlated with soil temperature (R = 0.56, p = 0.03). Estimated annual CO2 flux in the first year was 0.8, 0.9 and 0.8 Mg C ha−1 year−1 in the T, FD, and B plot, respectively, and in the second year it was 1.7, 1.8 and 1.4 Mg C ha−1 year−1 in the T, FD, and B plot, respectively. The estimated annual CO2 flux in the NT plot in the second year was 1.7 Mg C ha−1 year−1. The annual CO2 flux was not clearly different between the treatments in both years, while the annual CO2 flux in the first year was lower than that in the second year in all plots. Throughout the experimental period, the CO2 flux as the C output was 2.6, 2.7 and 2.2 Mg C ha−1 over the two-year experimental periods in the T, FD, and B plots, respectively.
Plant root biomass was 0.2 Mg C ha−1 in a year and, therefore, C input from plant roots was estimated as 0.4 Mg C ha−1 2 years−1. This value was consistent with former studies in India [31,32]. Because FYM application was 1.1 Mg C ha−1, the total C input for two years, which we measured, was 1.5 Mg C ha−1 in the present study, though there should be another C input, such as net rhizodeposition, which could be estimated as ca. 0.1 Mg C ha−1 in a year [28].

4. Discussion

4.1. Effect of Cultivation Management on the CO2 Flux

In this study, we observed that the CO2 efflux rate showed no significant difference between treatments. This indicates that different cultivation managements, that is, different seeding rates, did not affect the CO2 flux, in contrast to our hypothesis. Liu et al. [33] observed that there was no significant difference of the CO2 flux between the different plant density treatments (55,000, 75,000, 100,000 plants ha−1) in the maize cropland on the North China Plain. Considering that broadcasting, thinning, and cultivation management increased the soil moisture, except for the second year of broadcasting and thinning, the possible reason for the above might be a critically low C substrate of soil, which would cause an insensitive response of soil microbes to soil moisture dynamics. Sugihara et al. [34] observed that there was no clear CO2 flush after adding 10 mm of artificial rainfall to the dry soil, which corresponded to the precipitation during the early rainy season in this region. They indicated that the scarcity of the C substrate should induce the soil microbial community to conserve energy to adapt to the poor C environment, and these adapted soil microbes could not immediately respond to precipitation in the degraded cropland of Niger (SOC content was 1.5 g kg−1). In this study, the average CO2 efflux rate in the T plot was 20.5 mg C m−2 h−1, and this value was very small compared with that in previous studies in similar dry tropical regions, e.g., 46.0 mg C m−2 h−1 in Tanzanian cropland (TC; 13.8 g kg−1) [29], 69.8 mg C m−2 h−1 in Zimbabwean cropland (SOC; 9.8 g kg−1) [35], and 63.1 mg C m−2 h−1 in a tropical bare land of Brazil (TC; 12.2 g kg−1) [36]. Because the C content of soil in the experimental field was also small (TC; 3.3 g kg−1, SOC; 3.2 g kg−1), low CO2 efflux rate may be due to low C in this study, compared with that in the above previous studies, and therefore, the limited amount of substrate might cause the insensitive response of soil microbes to different soil moisture conditions in the treatments in this study.
In this study, we observed the clear effect of the seeding rate on the soil moisture condition (Table 2). Ritchie [37] reported that soil evaporation accounted for 76% of the total evapotranspiration from the entire field in early crop growth stage, while plant transpiration accounted for 87% of the total in the latter crop growth stage. In our case, the differences in the soil moisture between the treatments (Table 2; (1) T and FD, (2) T and NT, and (3) T and B plot) might be due to the low evapotranspiration in the T plot as follows: (1,3) Low soil evaporation in the T plot, due to the high seeding rate and/or crop cultivation (covering the soil surface by sorghum) and (2) low plant transpiration in the T plot, due to thinning. It is unclear why the seeding rate affected soil moisture only in the first year, but not in the second year. At present, we consider that the high and continuous precipitation in the rainy season of the first year should cause a shallower root distribution [38], and consequently, the differences of soil moisture between treatments would be observed only in the first year. Fu et al. [39] also found that shallow root biomass resulted in the difference of surface soil water content, while deeper root distribution might affect soil water content in deeper soil layers, in a semi-arid shrubland in North China.
We also observed that the averaged CO2 efflux rate in the first year was smaller than that in the second year, although soil moisture content stayed higher during the rainy season in the first year, compared with that in the second year. Many studies have shown that soil microbial activity decreased due to excessive soil moisture [23,40,41]. Liang et al. [42] also observed that excessive water noticeably suppressed microbial activity in the semi-arid cropland of China. Because soil moisture was maintained over 0.20 m3 m−3 in our study, excessive soil moisture might have decreased microbial activity in the first year of this experiment. Further study is necessary to evaluate the effect of soil moisture conditions on the CO2 flux in dry tropical croplands, including in excessive water conditions. In addition, we also found that the difference between air temperature and soil temperature was up to c.a. 10 °C. This was also found in a cropland in Tanzania and might be due to the rapid evaporation rate in the dry tropical regions [43].

4.2. Effect of Traditional Cultivation Management on The Balance of C Output and Input

We found that the CO2 flux as the C output (2.2–2.7 Mg C ha−1 2 years−1) was larger than the C input by FYM (1.1 Mg C ha−1 2 years−1) and plant root-C (0.4 Mg C ha−1 2 years−1) in all plots. In order to estimate the C input, we used the net rhizodeposition-to-root ratios (i.e., 0.5) reported in Pausch and Kuzyakov [28] and estimated the total belowground C input as 0.6 Mg C ha−1 2 years−1, at most, in this study. Though further study should be necessary to see the accuracy of this value, it is almost consistent with the result of Domanski et al. [44], which estimated the same Gramineae (ryegrass) rhizosphere of root as this study (sorghum). Even considering this estimation, the estimated total C input was 1.7 Mg C ha−1 2 years−1, and the CO2 flux as the C output was still larger than the estimated total C input. This indicates that the traditional cultivation management, i.e., the conventional amount of FYM (1.1 Mg C ha−1 2 years−1), cannot maintain SOC level. On the basis of our estimation, to make the difference between the CO2 flux and the C input positive in this agro-ecosystem, it is necessary to apply another 0.5–1.0 Mg C ha−1 for two years. This suggests that at least an annual application of the conventional amount of FYM is necessary, though we should also consider that most of the added FYM is decomposed and contributes to the larger C output. There are few studies evaluating the annual soil CO2 flux in croplands in India [4], but many studies have estimated the fluctuations of soil C stocks and found the necessary amount of C input to maintain SOC level [45,46]. Srinivasarao et al. [32] reported that a minimum of 1.1 Mg C ha−1 year−1 input was needed to maintain 0 change in SOC in sSuth Indian croplands, based on a 20-year field experiment. Kundu et al. [47] also found that 0.9 Mg C ha−1 year−1 input was required to maintain SOC storage equilibrium in a central Indian cropland, based on a 7-year field experiment. These reported values were consistent with our estimation and, therefore, it is necessary to apply larger or more frequent C inputs, such as crop residues or organic materials, to prevent SOC depletion and improve the soil C stocks in the degraded croplands of India [9,10,48].

5. Conclusions

We observed that the heterotrophic soil CO2 efflux rate was not different between the treatments, indicating that different cultivation management, such as different seeding rate, did not affect the CO2 flux, in contrast to our hypothesis. Considering that most cultivation management clearly affected the soil moisture dynamics, except for the second year of broadcasting and thinning, the insensitive response of soil microbes to different soil moisture dynamics in this experiment might be caused by a critically low C substrate of soil, although further study is necessary to assess this possibility. Based on our estimation, total CO2 fluxes as the C output were 2.2–2.7 Mg C ha−1 2 years−1, while the C input as FYM (1.1 Mg C ha−1) and root biomass-C (0.4 Mg C ha−1) was 1.5 Mg C ha−1 2 years−1. This result suggests that traditional cultivation management, including the conventional amount of FYM (1.1 Mg C ha−1 2 years−1), cannot maintain the soil C stock and, therefore, it is necessary to increase the amount or frequency of organic matter application, to achieve sustainable land management in South India.

Author Contributions

Conceptualization: S.S., H.M., M.J., and U.T.; data curation: M.S. and S.S.; investigation: M.S., S.S., H.M., R.A., M.J., S.I., and H.T.; methodology, S.S.; project administration: S.S.; writing—original draft: M.S.; writing—review and editing, S.S., H.M., R.A., M.J., S.I., U.T., and H.T.

Funding

This research and APC was funded by the Japanese Society for the Promotion of Science KAKENHI, Grant Numbers #2630015, #17H06171 and #17K19308.

Acknowledgments

We thank the staffs of Tamil Nadu Agricultural University for their kind technical support in the field survey and various sampling in India.

Conflicts of Interest

The Authors declare no conflict of interest.

References

  1. Lal, R. Soil carbon sequestration impacts on global climate change and food security. Science 2004, 304, 1623–1627. [Google Scholar] [CrossRef]
  2. Loveland, P.; Webb, J. Is there a critical level of organic matter in the agricultural soils of temperate regions: A review. Soil Till. Res. 2003, 70, 1–18. [Google Scholar] [CrossRef]
  3. Raich, J.W.; Schlesinger, W.H. The global carbon dioxide flux in soil respiration and its relationship to vegetation and climate. Tellus 1992, 44, 81–99. [Google Scholar] [CrossRef] [Green Version]
  4. Powlson, D.S.; Stirling, C.M.; Thierfelder, C.; White, R.P.; Jat, M.L. Does conservation agriculture deliver climate change mitigation through soil carbon sequestration in tropical agro-ecosystems? Agric. Ecosyst. Environ. 2016, 220, 164–174. [Google Scholar] [CrossRef]
  5. Wani, S.P.; Pathak, P.; Jangawad, L.S.; Eswaran, H.; Singh, P. Improved management of Vertisols in the semiarid tropics for increased productivity and soil carbon sequestration. Soil Use Manag. 2003, 19, 217–222. [Google Scholar] [CrossRef]
  6. Ghosh, A.; Bhattacharyya, R.; Dwivedi, B.S.; Meena, M.C.; Agarwal, B.K.; Mahapatra, P.; Shahi, D.K.; Salwani, R.; Agnihorti, R. Temperature sensitivity of soil organic carbon decomposition as affected by long-term fertilization under a soybean based cropping system in a sub-tropical Alfisol. Agric. Ecosyst. Environ. 2016, 233, 202–213. [Google Scholar] [CrossRef]
  7. Srinivasarao, C.; Venkateswarlu, B.; Lal, R.; Singh, A.K.; Kundu, S. Sustainable Management of Soils of Dryland Ecosystems of India for Enhancing Agronomic Productivity and Sequestering Carbon. Adv. Agron. 2013, 121, 253–329. [Google Scholar]
  8. Srinivasarao, C.; Vittal, K.P.R.; Venkateswarlu, B.; Wani, S.P.; Sahrawat, K.L.; Subramanian, M.; Kundu, S. Carbon Stocks in Different Soil Types under Diverse Rainfed Production Systems in Tropical India. Commun. Soil Sci. Plan. 2009, 40, 2338–2356. [Google Scholar] [CrossRef]
  9. Minasny, B.; Malone, B.P.; McBratney, A.B.; Angers, D.A.; Arrouays, D.; Chambers, A.; Chaplot, V.; Chen, Z.; Cheng, K.; Das, B.S.; et al. Soil carbon 4 per mille. Geoderma 2017, 292, 59–86. [Google Scholar] [CrossRef]
  10. Srinivasarao, C.; Venkateswarlu, B.; Lal, R.; Singh, A.K.; Kundu, S.; Vittal, K.P.R.; Patel, J.J.; Patel, M.M. Long-term manuring and fertilizer effects on depletion of soil organic carbon stocks under pearl millet-cluster bean-castor rotation in Western India. Land Degrad. Dev. 2014, 25, 173–183. [Google Scholar] [CrossRef]
  11. Bhattacharyya, R.; Ghosh, B.N.; Mishra, P.K.; Mandal, B.; Srinivasarao, C.; Sarkar, D.; Das, K.; Anil, K.S.; Lalitha, M.; Hati, K.M.; et al. Soil degradation in India: Challenges and potential solutions. Sustainability 2015, 7, 3528–3570. [Google Scholar] [CrossRef]
  12. Das, S.; Ganguly, D.; Ray, R.; Jana, T.K.; De, T.K. Microbial activity determining soil CO2 emission in the Sundarban mangrove forest, India. Trop. Ecol. 2017, 58, 525–537. [Google Scholar]
  13. Devi, N.B.; Yadava, P.S. Seasonal dynamics in soil microbial biomass C, N and P in a mixes-oak forest ecosystem of Manipur, North-east India. Appl. Soil Ecol. 2006, 31, 220–227. [Google Scholar] [CrossRef]
  14. Mohanty, R.B.; Panda, T. Soil respiration and microbial population in a tropical deciduous forest soil of Orissa, India. Flora 2011, 206, 1040–1044. [Google Scholar] [CrossRef]
  15. Gupta, S.R.; Singh, J.S. Soil respiration in a tropical grassland. Soil Biol. Biochem. 1981, 13, 261–268. [Google Scholar] [CrossRef]
  16. Thokchom, A.; Yadava, P.S. Carbon dynamics in an Imperata grassland in Northeast India. Trop. Grassl. 2016, 4, 19–28. [Google Scholar] [CrossRef]
  17. Grace, J.; Jose, J.S.; Meir, P.; Miranda, H.S.; Montes, R.A. Productivity and carbon fluxes of tropical savannas. J. Biogeogr. 2006, 33, 387–400. [Google Scholar] [CrossRef]
  18. Sahu, C.; Basti, S.; Sahu, S.K. Carbon dioxide evolution and enzymatic activities of soil under different land use practices located near Bhawanipatna town in Odisha, India. Fresen. Environ. Bull. 2016, 25, 5432–5439. [Google Scholar]
  19. Sandeep, S.; Manjaiah, K.M.; Mayadevi, M.R.; Singh, A.K. Monitoring temperature sensitivity of soil organic carbon decomposition under maize–wheat cropping systems in semi-arid India. Environ. Monit. Assess. 2016, 188, 451. [Google Scholar] [CrossRef]
  20. Fatichi, S.; Ivanov, V.Y.; Caporali, E. Investigating Interannual Variability of Precipitation at the Global scale: Is There a Connection with Seasonality? J. Clim. 2012, 25, 5512–5523. [Google Scholar] [CrossRef]
  21. Hu, C.; Zheng, C.; Sadras, V.O.; Ding, M.; Yang, X.; Zhang, S. Effect of straw mulch and seeding rate on the harvest index, yield and water use efficiency of winter wheat. Sci. Rep. 2018, 8, 8167. [Google Scholar] [CrossRef] [Green Version]
  22. Kuhling, I.; Redozubov, D.; Broll, G.; Trautz, D. Impact of tillage, seeding rate and seeding depth on soil moisture and dryland spring wheat yield in Western Siberia. Soil Till. Res. 2017, 170, 43–52. [Google Scholar] [CrossRef]
  23. Gong, J.; Wang, Y.; Liu, M.; Huang, Y.; Yan, X.; Zhang, Z.; Zhang, W. Effects of land use on soil respiration in the temperate steppe of Inner Mongolia, China. Soil Till. Res. 2014, 144, 20–31. [Google Scholar] [CrossRef]
  24. Han, Y.; Zhang, Z.; Wang, C.H.; Jiang, F.; Xia, J. Effects of mowing and nitrogen addition on soil respiration in three patches in an oldfield grassland in Inner Mongolia. J. Plant Ecol. 2012, 5, 219–228. [Google Scholar] [CrossRef]
  25. Soil Survey Staff. Key to Soil Taxonomy, 12th ed.; USDA-Natural Resources Conservation Service: Washington, DC, USA, 2014. [Google Scholar]
  26. Department of Evaluation and Applied Research. Tamil Nadu—An Economical Appraisal 2011–2012 to 2013–2014. Available online: http://www.tn.gov.in/dear/ (accessed on 19 March 2019).
  27. Shinjo, H.; Kato, A.; Fujii, K.; Mori, K.; Funakawa, S.; Kosaki, T. Carbon dioxide emission derived from soil organic matter decomposition and root respiration in Japanese forests under different ecological conditions. Soil Sci. Plant Nutr. 2006, 52, 233–242. [Google Scholar] [CrossRef]
  28. Pausch, J.; Kuzyakov, Y. Carbon input by roots into the soil: Quantification of rhizodeposition from root to ecosystem scale. Glob. Chang. Biol. 2018, 24, 1–12. [Google Scholar] [CrossRef]
  29. Sugihara, S.; Funakawa, S.; Kilasara, M.; Kosaki, T. Effect of land management on CO2 flux and soil C stock in two Tanzanian croplands with contrasting soil texture. Soil Biol. Biochem. 2012, 46, 1–9. [Google Scholar] [CrossRef]
  30. Funakawa, S.; Nakamura, I.; Akshalov, K.; Kosaki, T. Soil organic matter dynamics under grain farming in Northern Kazakhstan. Soil Sci. Plant Nutr. 2004, 50, 1211–1218. [Google Scholar] [CrossRef]
  31. Srinivasarao, C.; Deshpande, A.N.; Venkateswarlu, B.; Lal, R.; Singh, A.K.; Kundu, S.; Vittal, K.P.R.; Mishra, P.K.; Prasad, J.V.N.S.; Mandal, U.K.; et al. Grain yield and carbon sequestration potential of post monsoon sorghum cultivation in Vertisols in the semi arid tropics of central India. Geoderma 2012, 175–176, 90–97. [Google Scholar] [CrossRef]
  32. Shrinivasarao, C.; Venkateswarlu, B.; Lal, R.; Singh, A.K.; Kundu, S.; Vittal, K.P.R.; Balaguravaiah, G.; Malayanur, V.S.B.; Chary, G.R.; Prasadbabu, M.B.B.; et al. Soil carbon sequestration and agronomic productivity of an Alfisol for a groundnut-based system in a semiarid environment in southern India. Eur. J. Agron. 2012, 43, 40–48. [Google Scholar] [CrossRef]
  33. Liu, Q.; Liu, X.; Bian, C.; Changjian, M.; Lang, K.; Han, H.; Li, Q. Response of Soil CO2 Emission and Summer Maize Yield to Plant Density and Straw Mulching in the North China Plain. Sci. World J. 2014, 2014, 180219. [Google Scholar]
  34. Sugihara, S.; Funakawa, S.; Ikazaki, K.; Shinjo, H.; Kosaki, T. Rewetting of Dry Soil did not Stimulate the Carbon and Nitrogen Mineralization in Croplands with Plant Residue Removed in the Sahel, West Africa. Trop. Agric. Dev. 2014, 58, 8–17. [Google Scholar]
  35. Mapanda, F.; Mupini, J.; Wuta, M.; Nyamangara, J.; Rees, R.M. A cross-ecosystem assessment of the effects of land cover and land use on soil emission of selected greenhouse gases and related soil properties in Zimbabwe. Eur. J. Soil Sci. 2010, 61, 721–733. [Google Scholar] [CrossRef]
  36. La Scala, N., Jr.; Marques, J., Jr.; Pereira, G.T.; Cora, J.E. Carbon dioxide emission related to chemical properties of a tropical B soil. Soil Biol. Biochem. 2000, 32, 1469–1473. [Google Scholar] [CrossRef]
  37. Ritchie, J.T. Model for Predicting Evaporation from a Row Crop with Incomplete Cover. Water Resour. Res. 1972, 8, 1204–1213. [Google Scholar] [CrossRef]
  38. Pal, D.K.; Wani, S.P.; Sahrawat, K.L. Vertisols of tropical Indian environments: Pedology and edaphology. Geoderma 2012, 189–190, 28–49. [Google Scholar] [CrossRef]
  39. Fu, W.; Huang, M.; Shao, M.A.; Horton, R. Soil carbon dioxide (CO2) efflux of two shrubs in response to plant density in the northern Loess Plateau of China. Afr. J. Biotechnol. 2010, 9, 6916–6926. [Google Scholar]
  40. Adachi, M.; Bekku, Y.S.; Rashidah, W.; Okuda, T.; Koizumi, H. Differences in soil respiration between different tropical ecosystems. Appl. Soil Ecol. 2006, 34, 258–265. [Google Scholar] [CrossRef]
  41. Linn, D.M.; Doran, J.W. Effect of Water-Filled Pore Space on Carbon Dioxide and Nitrous Oxide Production in Tilled and Nontilled Soils. Soil Sci. Soc. Am. J. 1984, 48, 1267–1272. [Google Scholar] [CrossRef] [Green Version]
  42. Liang, G.; Houssou, A.; Wu, H.; Cai, D.; Wu, X.; Gao, L.; Li, J.; Wang, B.; Li, S. Seasonal Patterns of Soil Respiration and Related Soil Biochemical Properties under Nitrogen Addition in Winter Wheat Field. PLoS ONE 2015, 10, e0144115. [Google Scholar] [CrossRef]
  43. Sugihara, S.; Funakawa, S.; Kadono, A.; Tanaka, Y.; Sawada, K.; Fujii, K.; Kosaki, T. In situ short-term dynamics of CO2 flux and microbial biomass after simulated rainfall in dry croplands in four tropical and continental ecosystems. Soil Sci. Plant Nutr. 2015, 61, 392–403. [Google Scholar] [CrossRef]
  44. Domanski, G.; Kuzyakov, Y.; Siniakina, S.V.; Stahr, K. Carbon flows in the rhizosphere of ryegrass (Lolium perenne). J. Plant Nutr. Soil Sci. 2001, 164, 381–387. [Google Scholar]
  45. Manna, M.C.; Subba Rao, A.; Mandal, A. Impact of agricultural land management practices on soil carbon sequestration. Indian J. Soil Conserv. 2015, 43, 204–212. [Google Scholar]
  46. Pathak, H.; Byjesh, K.; Chakrabarti, B.; Aggarwal, P.K. Potential and cost of carbon sequestration in Indian agriculture: Estimates from long-term field experiments. Field Crop. Res. 2011, 120, 102–111. [Google Scholar] [CrossRef] [Green Version]
  47. Kundu, S.; Singh, M.; Saha, J.K.; Biswas, A.; Tripathi, A.K.; Acharya, C.L. Relationship between C addition and storage in a Vertisol under soybean-wheat cropping system in sub-tropical central India. J. Plant Nutr. Soil Sci. 2001, 164, 483–486. [Google Scholar] [CrossRef]
  48. Lal, R. Soil carbon sequestration in India. Clim. Chang. 2004, 65, 277–296. [Google Scholar] [CrossRef]
Figure 1. (a) Fluctuations in precipitation (P) and soil moisture (SM) (m3 m−3: 0–15 cm depth). (b) Fluctuations in the heterotrophic soil CO2 efflux rate during the two-year experimental period. Bars indicate standard error. (c) Fluctuations in soil temperature (ST) (5 cm depth). Traditional cultivation management plot (T), fixed density plot (FD), no thinning plot (ND), bare plot (B).
Agronomy 09 00347 g001
Table 1. Description of the crop cultivation and land management in each experimental year.
YearMonthCrop CultivationLand Management
2015End of August Farmyard manure application (1.1 Mg C ha−1)
Mid OctoberSeedingChemical fertilizer application (40 kg N; 20 kg P; 0 kg K ha−1)
Mid NovemberThinning
2016End of JanuaryHarvesting
Early OctoberSeedingChemical fertilizer application (40 kg N; 20 kg P; 0 kg K ha−1)
Early NovemberThinning
2017End of JanuaryHarvesting
Thinning was conducted only in the traditional cultivation management (T) plot. Nitrogen was broadcast separately, 13 kg N ha−1 at the time of seeding and 27 kg N ha−1 at 4 weeks after seeding.
Table 2. Summary of two-way repeated-measures analysis of variance for the effect of broadcasting, thinning, cultivation, and sampling time on the soil moisture content and CO2 flux.
September 2015–August 2016September 2016–August 2017
Soil MoistureCO2 FluxSoil MoistureCO2 Flux
F ValueF ValueF ValueF Value
Broadcasting197.7 **0.23.80.0
Sampling time14.1 **17.5 **13.5 **3.0 **
Broadcasting × Sampling time0.30.70.40.5
Thinning95.4 **0.13.60.0
Sampling time14.6 **22.0 **10.8 **4.3 **
Thinning × Sampling time0.11.10.31.2
Cultivation82.0 **5.4 *93.5 **3.7
Sampling time32.4 **20.3 **18.0 **4.2 **
Cultivation × Sampling time0.23.6 **0.60.5
* = p < 0.05, ** = p < 0.01.
Table 3. Estimated annual CO2 flux in each treatment plot in each experimental year.
PlotSeptember 2015–August 2016September 2016–August 2017For Two Years
CO2 FluxFactorRp ValueCO2 FluxFactorRp ValueCO2 Flux
T0.8SM0.530.041.7SM0.630.012.6
FD0.9SM0.530.041.8SM0.700.002.7
NTSM0.420.111.7SM0.540.03
B0.8ST0.560.031.4SM0.660.012.2
The details about the single regression analysis were provided in the materials and methods. Due to the large annual precipitation change, we used the above analysis every year, i.e., the first year (from September 2015 to August 2016) and second year (from September 2016 to August 2017) separately. Traditional cultivation management plot (T), fixed density plot (FD), no thinning plot (NT), bare plot (B). Soil moisture (SM), soil temperature (ST). The CO2 efflux rate in the NT plot from September 2015 to August 2016 was positively, but not significantly, correlated with soil moisture (R = 0.42, p = 0.11), and therefore, we did not calculate the C output from September 2015 to August 2016.

