Article

Soil Macronutrient Responses in Diverse Landscapes of Southern Tallgrass to Two Stocking Methods

United States Department of Agriculture-Agricultural Research Service, 7207 West Cheyenne St., El Reno, OK 73036, USA
*
Author to whom correspondence should be addressed.
Agronomy 2019, 9(6), 329; https://doi.org/10.3390/agronomy9060329
Submission received: 22 March 2019 / Revised: 4 June 2019 / Accepted: 15 June 2019 / Published: 20 June 2019
(This article belongs to the Special Issue Grassland Management for Sustainable Agroecosystems)

Abstract

:
Macronutrient (N, P, S, K, Ca, and Mg) availability and distribution in soils of grassland ecosystems are affected by diverse factors, including landscape position, climate, and forms of management. This study examined flux in plant-available macronutrients in production-scale (60 to 80 ha) paddocks of southern tallgrass prairie of central Oklahoma, United States, managed (2009–15) under two contrasting stocking methods (continuous yearlong; rotational stocking among 10 sub-paddocks). Macronutrient availability within the 0–7.5 cm and 7.5–15 cm soil depths were determined with sets of anion-cation exchange membrane probes at 16 locations within paddocks, oriented along transects from water sources to far corners. No clear overall effect related to stocking method was recorded for all macronutrient distributions. The only significant stocking method × location interaction occurred for K (p = 0.01). All other macronutrients displayed significant (p < 0.08) location effects that were common across stocking methods. Effects relatable to stocking method occurred in interactions with soil depth or time of year (p < 0.10), but responses of macronutrient flux to stocking method in these interactions varied. Higher flux occurred in available S, Ca, and Mg in proximity (<24 m) to water sources, which may be related to grazing, but local features of the landscape may also have been involved. More attention to landscape features included within paddocks, and standardized organization of water and other features within paddocks, would improve the potential to define grazing effects on macronutrient distribution.

1. Introduction

Macronutrients are present in a range of forms within soils of grasslands, and are related to the nature of underlying parent materials [1]. Macronutrient availability and distributions are also affected by type and productivity of plant communities, position within landscape, and climate, and varies with time [1,2,3]. Livestock grazing has been considered an important component of altering availability of macronutrients within grassland ecosystems. Cattle consume plant biomass, and redistribute macronutrients within consumed biomass through removal by grazing, movement of nutrients off-paddock in body weight, and recycling through excreta that is returned to the landscape [3,4,5,6]. Re-distribution of macronutrients in excreta tends to be non-uniform, and can result in high concentrations within localized areas of paddocks [7,8]. Increased amounts of labile N, P, K, and S were reported in areas adjacent to watering facilities, corners, and other paddock structures [6,9,10].
Methods of stocking cattle (grazing systems) are thought to be capable of altering distribution of grazing and excreta within grazed landscapes, and hence improve the distribution of labile macronutrients [3,10,11]. Dividing larger land units into smaller sub-paddocks and applying rotational stocking to shift timing and frequency of grazing among paddocks is thought to be capable of achieving more uniform levels of grazing, and use of paddock areas [10,12,13]. However, both availability and distribution of macronutrients in production-scale paddocks are both primarily related to local soil properties, at pedon (m2) through catena (100’s m2) scales of organization [2,14,15]. Macronutrient availability and distributions are further affected by type of plant community, position within landscape, and climate [1,2,3,16,17,18]. Such features tend to result in variable distribution patterns without overlaying any effects related to grazing [2,16,17,18].
United States southern tallgrass prairies are diverse native ecosystems (up to 120 herbaceous and woody species within 1.0 ha areas) that can be productive components of livestock production in the region, with proper management and adequate precipitation [19]. They are definable as low-input–low-output ecosystems and function without fertilizer or irrigation applications [2,12]. However, the tallgrasses still require adequate amounts of macronutrients to be productive during growing seasons, and grazing by cattle can re-distribute important resources within the landscape of paddocks [2,8]. A companion paper to this study [20] reported a lack of uniform responses in the distribution of 8 macronutrients among a limited set of contrasting locations in paddocks of southern tallgrass prairie managed under four different stocking methods. The most notable effect [20] was that levels of plant-available macronutrients either changed among locations, or times of growing season, within paddocks under the different applied stocking methods. Local landscape conditions within paddocks were noted as possible drivers of responses [20], and results indicated the need for a more comprehensive examination of macronutrient distributions within larger production-scale paddocks. This result, combined with the dichotomy related to management effects versus inherent natural variability of landscapes, points to the question of whether grazing applied in different stocking methods influences distribution of excreta, and hence plant-available macronutrients, within production-scale paddocks of rangeland.
This study was undertaken to define the degree of flux in plant-available macronutrients (NO3, NH4+, P, S, K, Ca, and Mg) in soils within larger areas of southern tallgrass prairie encompassed in production-scale paddocks under two contrasting stocking methods. The working null hypotheses were: (1) no difference would occur in distributions and levels of 8 plant-available macronutrients at a range of locations within landscapes of production-scale paddocks, and (2) no difference would occur among times of growing seasons or soil depths, in response to stocking methods.

2. Materials and Methods

2.1. Study Site

This study was conducted within sets of production-scale paddocks of tallgrass prairie at the United States Department of Agriculture–Agricultural Research Service, Grazinglands Research Laboratory (35°33′29″ N, 98°1′50″ W) in central Oklahoma, United States. The entire site was located in a rolling upland landscape, with a range of landscape features present. Included were local easterly and westerly-facing slopes of 3 to 6% on riser positions, and toe and tread slope positions with 0 to 2% slope, bordering the risers [21]. The long-term average (±1 standard deviation (s.d.)) precipitation (long-term average (LTA); 1977 to 2012) during calendar years was 941 (±174) mm. Annual amounts ranged from 1468 mm (2007) to 646 mm (2011), with a bimodal distribution pattern. Maxima occurred during April through June (334 ± 58 mm), and September through October (175 ± 54 mm). Long-term minimum and maximum monthly temperatures occurred during January (2.8 (±2.7) °C; −4.0 to 8.6 °C) and July (28.1 (±1.5) °C; 25.6 to 32.4 °C).
The ecosystem of the study area (346 ha) was defined as southern tallgrass prairie, and was identified as a Loamy Prairie ecological site [21]. These perennial grasslands are remnant plant communities of the original southern tallgrass ecosystems that existed in central Oklahoma, United States, prior to European settlement. They were never cultivated, nor replanted to native species following cultivation. The dominant species were the perennial warm-season tallgrasses big bluestem (Andropogon gerardii), Indiangrass (Sorghastrum nutans), and little bluestem (Schizachyrium scoparium). These three species provide an average (±1 s.d.) of 70% (±10%) of the total annual biomass produced at the study area [21]; annual productivity ranges from 1 to 5 Mg ha−1, depending on amount and timing of precipitation [20,21,22,23]. The area has historically (1970’s to 2009) supported cowherds that were managed to produce calves for research on growth and production of yearling stocker cattle [22,23]. Stocking methods applied throughout the historical period were not consistent. They were changed regularly to meet management requirements for calves used in research projects. Included were periods of management under either, or both, continuous and rotational stocking during growing seasons (April to September) at lower densities (2.0 to 3.0 ha cow/calf pair−1 year−1).
A range of soil series belonging to different families and subgroups of the Mollisol order have been recorded in the area, based on landscape position within the site [24,25]. All listed soils evolved from parent material that was Permian-aged Dog Creek shale, a reddish-brown shale containing thin inter-beds of sandstones and siltstones [24]. Three sub-types of Norge series silt loams (Fine-silty, mixed, active thermic Udic Paleustolls) situated on riser (mid-slope) positions of the landscape were the most-common [21]. Kirkland or Renfrow silt loams (Fine, mixed superactive, thermic Udertic Paleustolls) situated on tread positions (summit locations) and Port silt loams (Fine-silty, mixed superactive, thermic Cumulic Haplustolls) at toe positions bounded the Norge series. Six additional related soils exist as inclusions, or complexes, within boundaries of each of these primary soils [20]. The surface soils (upper 30 cm) of these series have variable, but near-neutral pH (6.7 (±0.6)), cation exchange capacity of 13.5 (±3.8) cmol kg−1 soil, low water-holding capacities (3 (±1) mm cm−1 soil), and variable rates of permeability (33 (±17) mm h−1) [20].

2.2. Experimental Design

The study area included sets of paddocks assigned to different stocking methods [25]. Two replicate, 61 (±2) ha paddocks were managed by continuous yearlong stocking as controls. The remaining area included two ~80 ha sites that were each sub-divided into sets of 10 sub-paddocks of rotationally stocked rangeland. These sub-paddocks were managed by application of shorter grazing periods, with timing and frequency changed annually to mimic an adaptive system of rotational stocking [12,13]. Paddocks were managed under their assigned stocking methods from 2009 through 2015, to define impacts of stocking methods on plant communities and soil properties. Grazing pressure of the different treatments were achieved with herds of cow-calf pairs (~600 kg cows and ~249 kg calves at weaning, hereafter defined as animal units (AU)), that were assigned to each replicate paddock. Annual (2009–2015) herd sizes in the continuous and groups of rotational-stocked sub-paddocks were 18 (±3.4) and 26 (±2.5) head, respectively. Animal units assigned to rotationally stocked paddocks during 2009 to 2015 grazed sub-paddocks in 7- to 10-day grazing bouts, 2 to 4 times annually, with timing of bouts varied annually. Daily allotment of forage per AU was 17 kg day−1, or ~6.2 Mg AU−1 year−1. Total grazing pressure applied to the continuous and rotational-stocked paddocks was, respectively, 108 (±20) and 119 (±11) animal unit days (AUD) ha−1 year−1.

2.3. Data Collection

Data were collected twice during the 2015 growing season—mid-March and early-August. These two periods represented (1) the time when growth by native grasses initiated during growing seasons (March), and (2) the time when peak living biomass occurs (August) for southern tallgrass prairies during late summer [21]. Availability of macronutrients within the 0 to 7.5 cm and 7.5 to 15 cm depth increments of soil were determined on each date, at a series of 16 locations oriented along transects from water sources (W) to far corners (FC), and three additional points, within paddocks (Figure 1). Sampled locations included a set (n = 7) within paddocks that were at the same physical distances, between 1.5 to 37 m between sampled locations and water sources (W) within paddocks, and at W. Past research at other US sites noted increased amounts of macronutrients in soils in “zones” close to water or shade, but not specific distances [8,10]. The intense spacing of these 8 locations was to determine if exact areas in proximity to water exist where high amounts of macronutrients might occur.
Data were also collected from eight additional locations (Figure 1) that were identified as potential high- and low-traffic areas [7,8,10,11]. Included were nearest and furthest corners (NC and FC, respectively), nearest and furthest fence lines (NF and FF, respectively), paddock midpoint (PMP), and 25%, 37%, 50%, and 75% of distances between W and PMP (0.25 PMP, 0.37 PMP, 0.50 PMP, and 0.75 PMP, respectively). Distances from W to locations were defined by measuring wheel, and elevation of locations defined by hand-held Global Positioning System (GPS) units. The sampled locations for NF and FF were at closest points along fences that were immediately north or south of water sources. While similar in geographic terms, the actual location of these eight positions and FC within paddocks and sub-paddocks varied in distance from W (Table 1). This variance in distance for the same position within paddocks was due to differences in size, shape, and dimensions of paddocks, and locations of water within paddocks, assigned to the applied stocking methods [25].
Macronutrient availability (hereafter also noted as flux) within soils was determined with Plant Root SimulatorTM probes (Western Ag Innovations Inc., Saskatoon, SK, Canada). The probes are comprised of paired sets of anion and cation exchange membranes encased in plastic housings. The probes provide estimates of nutrient uptake by plant roots, and represent a rate-based process (µg uptake cm−2 probe surface area 14 days−1 soil depth−1) of the soil–plant interface [26,27]. At each location within paddocks, two sets of probes with anion and cation membranes were located at each depth. The probes were buried in situ during the March sampling for 14-d incubation periods, as soil moisture approximated field capacity (21.5% (±3%) volumetric water) in response to precipitation events immediately before, and early in, incubation periods.
Soil moisture during the August sampling approximated permanent wilt point (12.5% (±1%) volumetric water) due to a summer drought. Therefore, replicate (n = 4) cores (5.38 cm diameter) of soil at each location and soil depth were collected by plunging hammer and core tubes. These cores were removed from core tubes in a laboratory, wetted with deionized water to field capacity, and dissected into two longitudinal sections. Replicate (n = 2) anion and cation membrane probes were sandwiched within dissected cores for 14-d incubation periods at a temperature of 23 °C.
The probes used during both incubation periods were removed from soil post-incubation, lightly washed with deionized water to remove soil, packaged in groups, refrigerated, and sent to the probe manufacturer for analyses. The manufacturer used colorimetric analyses by automated flow injection to determine NO3-N and NH4-N, and all other macronutrients (ions) were measured using inductively-coupled plasma spectrometry.
Two sets of soil samples were collected by plunging hammer and 5.38 cm diameter core tubes on each sampling date at each location within paddocks, to define physical properties of soils for the two depth increments. Collected samples were placed in soil tins for transport and storage. Moist bulk densities of one set of samples were defined [28], followed by analyses for particle fractions by hydrometer methods in a sodium hexa-metasulfate solution [29]. The second set of soil samples was passed through a 2.0 mm sieve and used to define estimates of soil organic matter based on low temperature loss on ignition [30].

2.4. Statistical Analyses

Probe-measured availability of total mineral N (NH4+ + NO3), NO3-N, NH4-N, P, S, K, Ca, and Mg in soils were explored (Table 2) to determine whether data transformations were required for statistical tests [31]. The natural logarithm (Ln) transform was applied, as required, to improve cumulative distribution functions of the populations of observations to more closely fit a normal distribution. Transformed levels of flux of total minerals of N, NO3, NH4, P, S, and K, and the raw values for Ca and Mg were analyzed in SAS 9.3 (SAS Institute, Cary, NC, USA).
Data were analyzed by longitudinal (repeated) measures analyses [32] within mixed models (PROC MIXED). Grazing regime, soil depth, and time of growing season were main effects in analyses, while sampled locations within paddocks were the longitudinal element. Preliminary analyses of variance applied to macronutrients attempted to utilize different physical attributes of soils and distances between paddock locations and water sources as covariates to improve the function of statistical models. However, all attempts to use these attributes as covariates were non-significant (p > 0.13) and failed to improve statistical tests. An examination of correlation coefficients of the relationship between macronutrient fluxes and physical attributes showed weak relationships in all cases (Table 3). The most effective variance-covariance matrix to account for covariance and autocorrelation among the varied locations within paddocks would be the unstructured (UN) procedure [33]. However, there were not enough degrees of freedom (d.f.) to produce stable models with this, or other more complex (i.e., power, exponential) matrix structures [32,33]. Therefore, the compound symmetry (CS) structure was used to account for covariance and autocorrelation among locations within paddocks. The limited number of d.f. also forced analyses to be restricted to main effects and 2-way interactions between stocking methods, and remaining main effects and longitudinal factor [32]. Reported means for significant main and interaction effects were back-transformed to original scales [31]. Level of significance of statistical tests was set at p = 0.10.

3. Results and Discussion

3.1. Soil Properties

The means and standard deviations (s.d.) of the measured physical attributes are presented here to provide estimates of soil properties at the sampled locations within paddocks (Table 4). Soils on the study site showed a degree of variability in physical attributes among paddocks assigned to the two stocking methods. Percentages of different particle fractions of soils in paddocks assigned to continuous stocking were less consistent than in sub-paddocks assigned to rotational stocking, which was likely due to the greater number of soils encountered within these larger units [25]. Paddocks receiving continuous stocking had greater percentages of sand and lower amounts of silt than in rotational-stocked sub-paddocks, while percentages of clay in soils were similar. Moist bulk densities of soils within paddocks receiving rotational stocking were lower than in paddocks receiving continuous stocking, most likely due to the higher percentage of sand in soils of continuously stocked paddocks [34]. Amounts of soil organic matter showed distinct differences among stocking methods. Paddocks managed by continuous stocking had lower concentrations than were recorded in paddocks managed under rotational stocking. However, organic matter in soils was more variable in paddocks receiving rotational stocking (c.v. = 29% vs. 24%).
A review of these properties (Table 4) indicates the two stocking methods may have affected some of the physical properties of soil, as has been noted in responses to both longer- and shorter-term applications of stocking methods [13,35,36]. However, the amount of natural variability (e.g., standard deviation) present in the measured attributes, which is also a component of the landscapes enclosed within paddock boundaries [1], indicated the means were not consistent within different paddocks assigned to the same stocking method. The location of paddocks within the landscape of the study area likely affected these properties. The continuous stocked paddocks had predominantly western exposures, while rotationally stocked sub-paddocks had largely easterly exposures. Such differences in exposure can have large effects on catena-based soil development within landscapes [1,2,34]. This difference in predominant exposure likely contributed to the higher amounts of sand, corresponding greater bulk densities, and lower amounts of silt, noted in the continuously stocked paddocks.
Stocking methods have some capacity to result in changes in soil organic matter and bulk density in the US Southern Great Plains (SGP) over time. Research in south-central Oklahoma, United States [35], noted increasing bulk densities of soils of perennial grassland in response to 10 years of different animal densities applied by rotational stocking, compared to no grazing. However, the higher bulk density of soils in the continuously stocked paddocks of the current study may be related to the greater amounts of sand that were recorded [34]. Concentrations of soil organic matter were lower in the continuously stocked paddocks, though amounts were variable within paddocks managed under both stocking methods. However, the distribution of soil properties and the native grasslands they support varies within landscapes without grazing [2]. For example, variable patterns were recorded in the spatial distribution of bulk density and organic matter of soils in 1.6 ha paddocks of southern tallgrass prairie within 2 km of this study site, after 25 years of three sustained stocking methods [15]. Distribution patterns noted within those paddocks were definable both within and across multiple paddocks, often within 20 m of spatial scale, which defined the catenae-scale organization of the landscape. Such patterns indicate soils in the area of the current study, which were defined as members of different families and subgroups of Mollisols, likely had similar non-uniform distributions, and variable, fine-scale patterns of spatial distribution.

3.2. Mineral N

Main effects related to stocking method (0.15 < p < 0.76) and stocking interactions with paddock locations (0.21 < p < 0.34) were not significant for NO3, NH4+, or total N. This lack of effect by stocking method in general, and their effects on N fluxes at paddock locations, was unexpected given the number of years of applied treatments and broad range of sampled locations (n = 16). These locations included a series with a low likelihood of animal visitation, such as the middle area of paddocks under continuous stocking under the low animal densities that were applied. In comparison, studies in introduced perennial grasslands reported significantly greater amounts of NO3 and total mineral N with increase in length of time cattle grazed rotationally stocked sub-paddocks, but found no differences between effects of longer rotational or continuous stocking [10,37]. Studies on the effects of stocking methods on soil properties of native prairie in northcentral Texas, United States, also reported no differences in NO3-N concentrations between continuous and rotationally stocked native prairie [13].
Stocking methods interacted with soil depth for NO3 (F1, 194 = 3.4; p = 0.07) and total N (F1, 194 = 3.4; p = 0.07). The stocking method × with time of year interaction on NH4+ flux was also significant (F1, 194 = 16.6; p < 0.01). Main effects related to paddock location were also significant (0.01 < p < 0.08) for NO3, NH4+ and total N. The highest amount of total mineral and NO3N within the stocking method × soil depth interactions (Table 5) were noted for the upper 7.5 cm of the profile under rotational stocking, with the second-highest amounts recorded for the upper 7.5 cm under continuous stocking. The lowest amounts of NO3 flux were recorded in the upper soil depth under rotational stocking. Within the stocking method × time of year interaction on NH4+, the highest and second-highest amounts of flux were recorded, respectively, in response to rotational and continuous stocking during March. The lowest amounts of flux were noted for responses to rotational stocking during August. The greater total and NO3-N fluxes recorded in the upper 7.5 cm of soil was similar to results noted in studies on other warm-season grasslands [10]. The higher amounts noted during March were likely related to cooler soil temperatures that occur during winter and early-spring in the region, which result in lower amounts of mineralization of NH4+ to NO3 [3]. Research in paddocks of other warm-season grasses in Florida, United States, noted no differences in concentrations of NH4+ among different forms of rotational and continuous stocking [10].
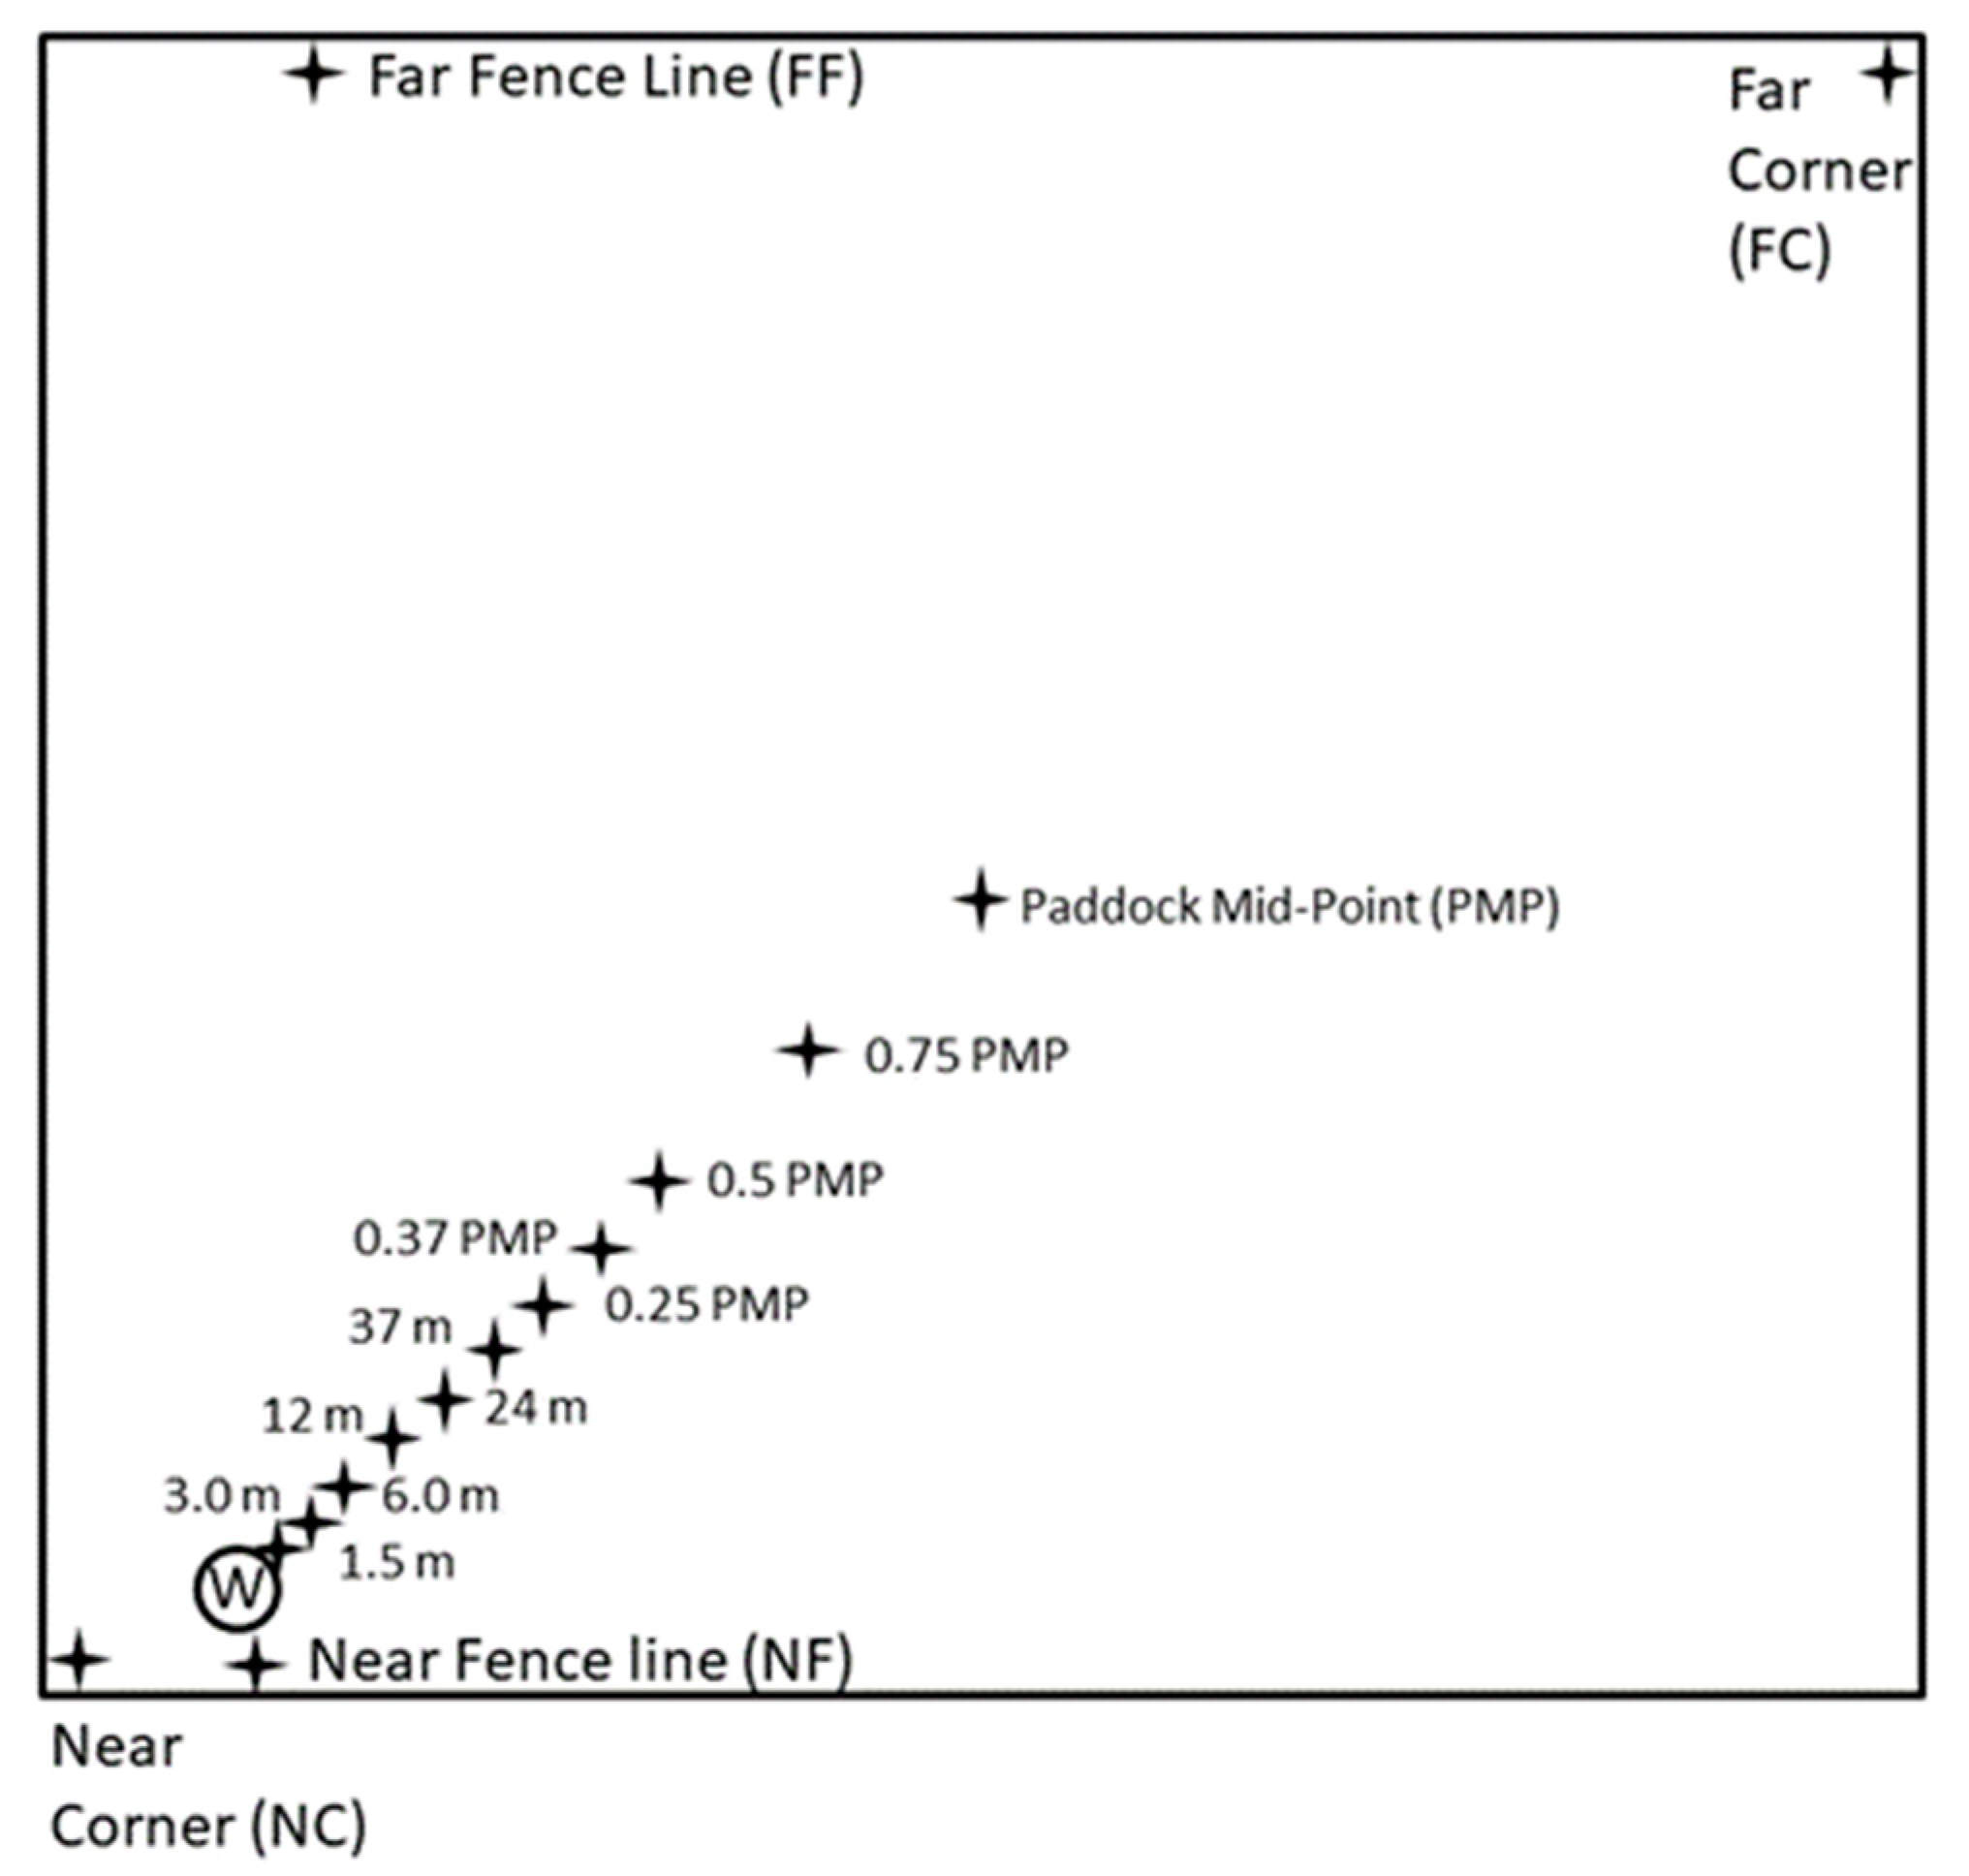
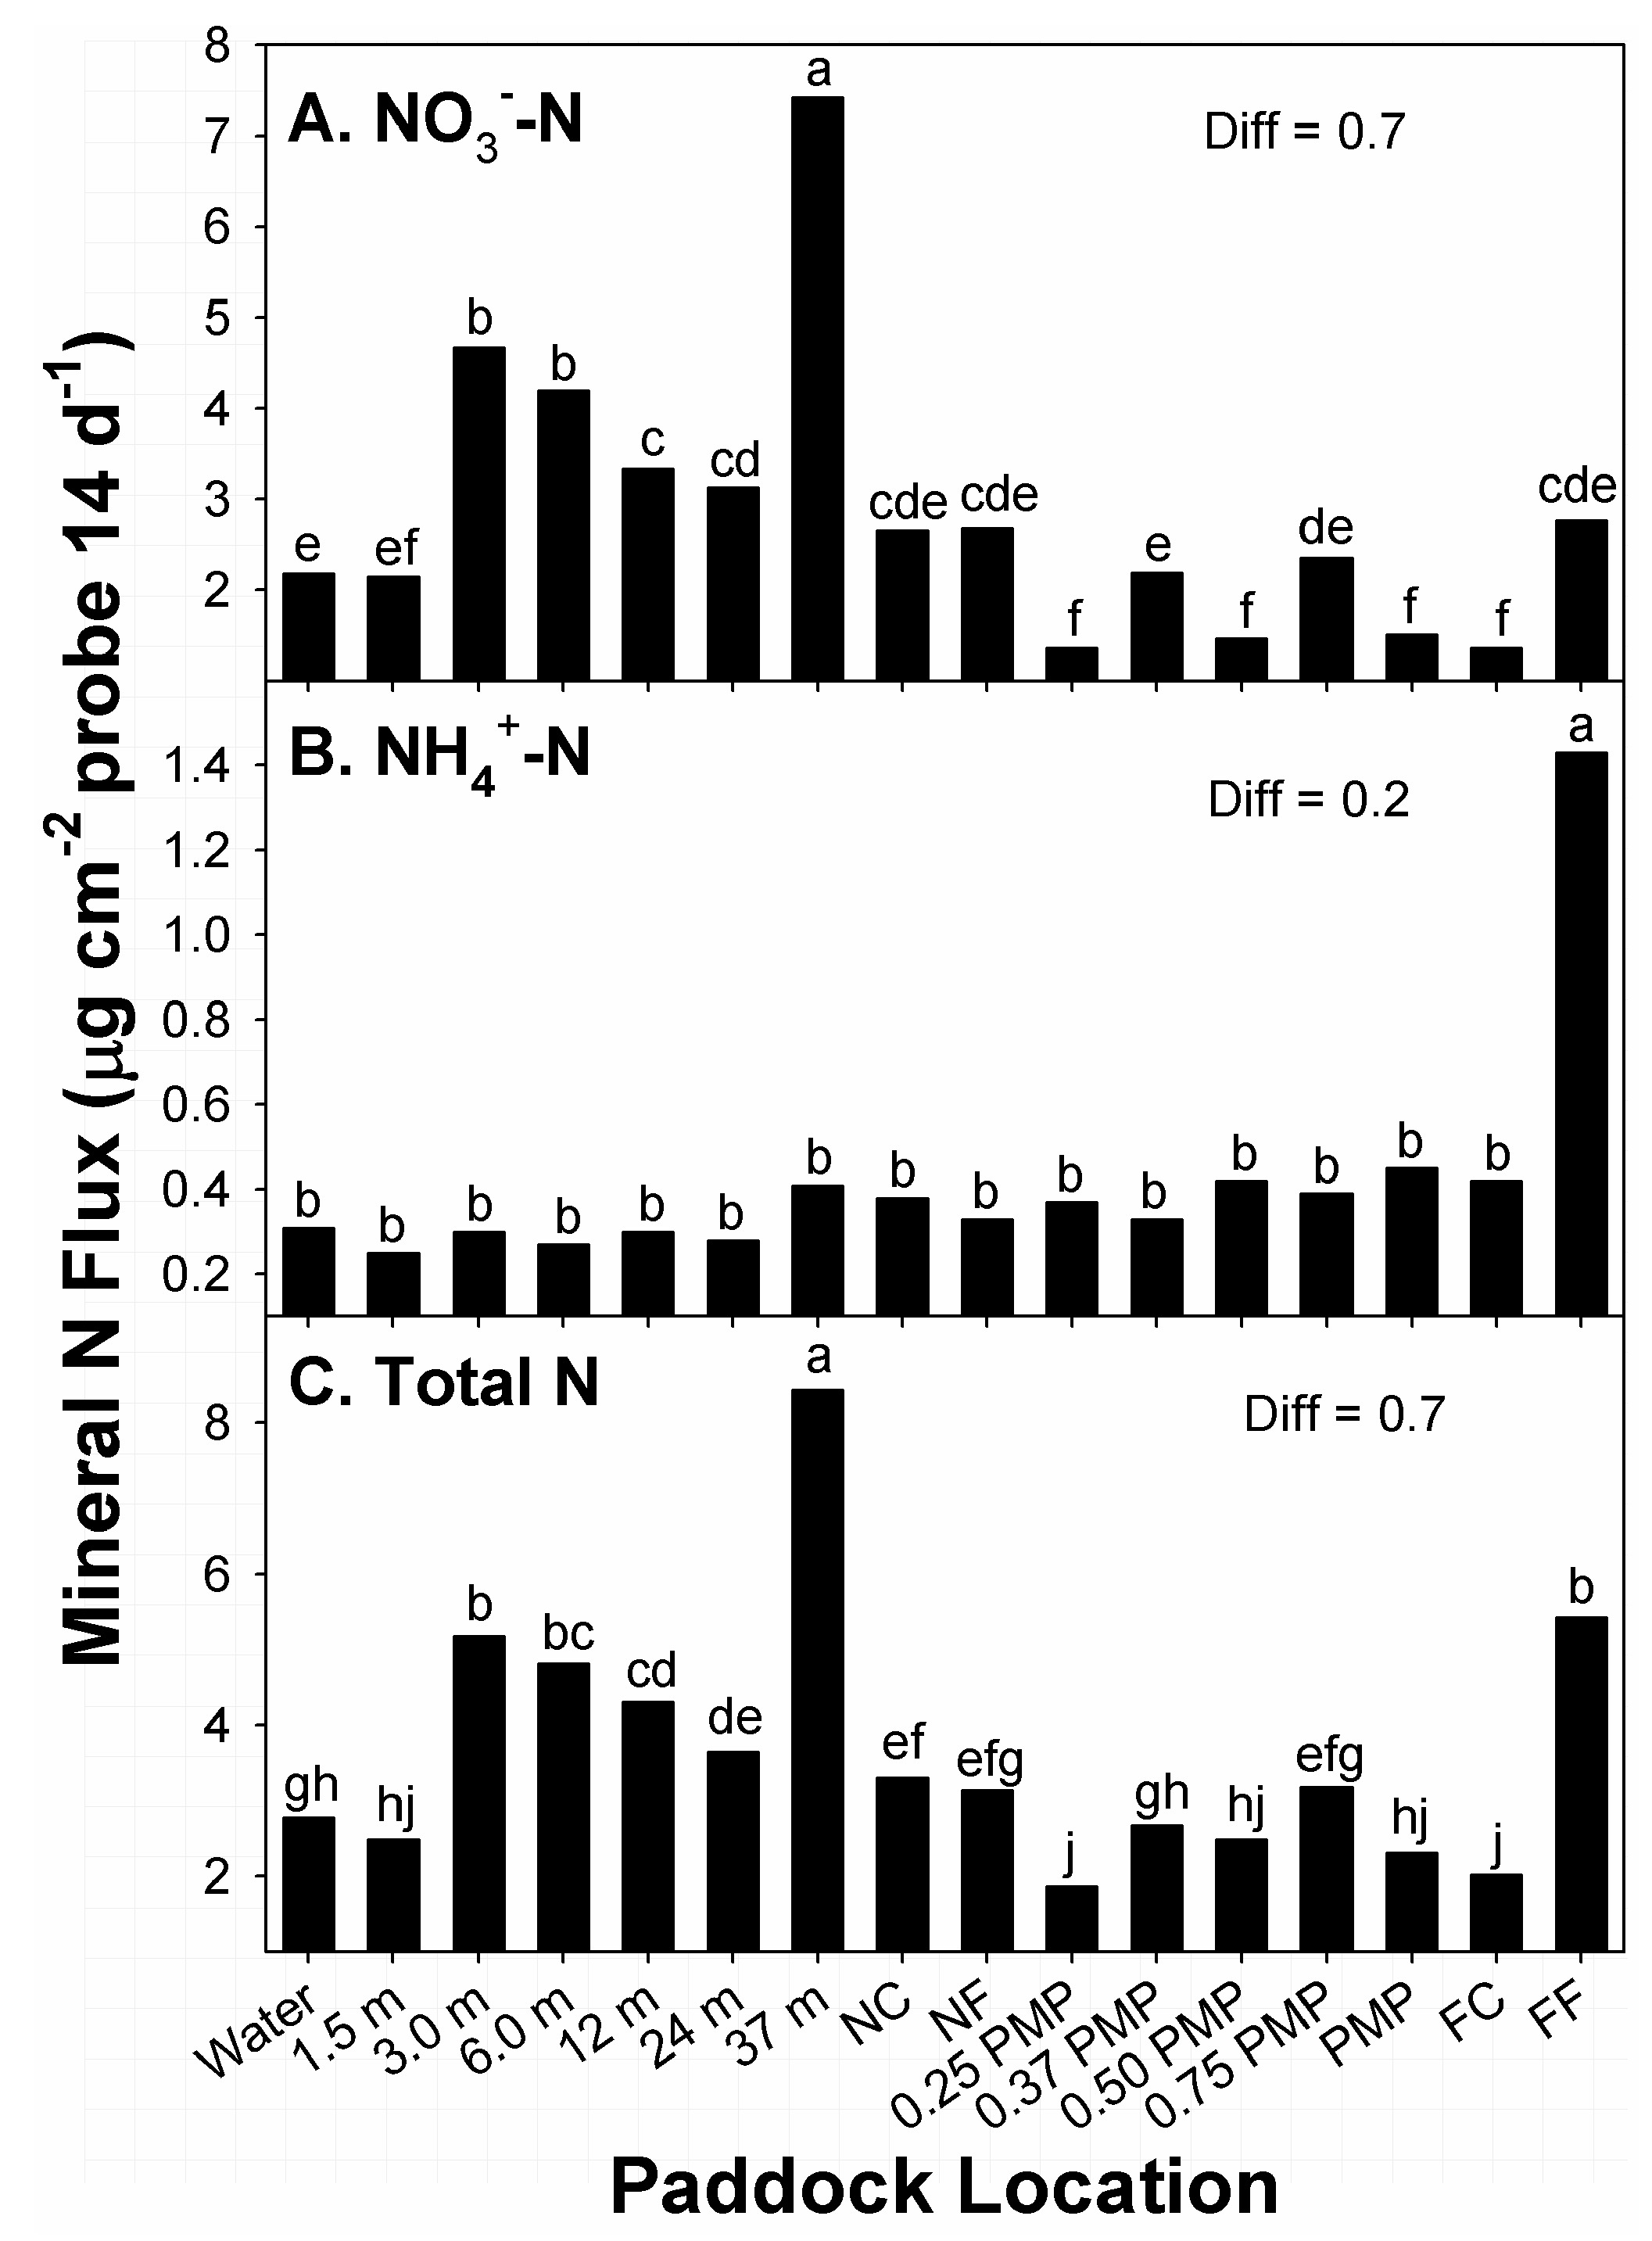
The greatest amounts of flux in NO3 among paddock locations occurred at locations 37 m from water sources, with the second-greatest amounts noted from 3 to 6 m from water (Figure 2A). Alternatively, the lowest amounts of flux were recorded at locations near 0.25 PMP, 0.5 PMP, PMP, and FC. Locations with the second-lowest amounts of flux in NO3 were noted at water sources and 1.5 m from water. Amounts of flux at remaining locations belonged to groups with intermediate amounts. Overall, there was a general decline in amounts of NO3 flux from 3 m from water sources to the far corner of paddocks (FC), with the notable exception of 37 m.
The distribution of amounts of NH4+ flux recorded at paddock locations differed from the distribution noted for NO3 (Figure 2B). The greatest amounts of flux in NH4+ among paddock locations occurred along fence lines furthest from water sources (FF). Amounts of flux (0.3 to 0.5 µg NH4+ cm−2) at all remaining sampled locations were ≤31% of this level, and belonged to the same means group. The distribution of NH4+ within paddocks was unusual, given the 3- to 7-fold greater amounts at FF, across stocking methods, compared to the other locations. Studies in paddocks of tame warm-season grasses noted greater amounts of NH4+ in zones of paddocks that were closest and furthest from water, relative to intermediate locations [37]. The driver for high amounts of NH4+ flux at FF in the current study was not clear, as these locations were not consistent in terms of landscape positions, or distances from water. The FF locations were situated at both tread and toe positions of the landscapes of the two continuously stocked and four rotationally stocked units that were sampled. However, the amounts of NH4+ flux recorded in differences among locations were small, covering a range of 1.1 µg cm−2 of surface areas of probes.
The distribution of amounts of flux in total mineral N recorded at paddock locations were somewhat similar to the distribution pattern noted for NO3 (Figure 2C). This similarity was related to the high amounts of NO3 relative to the total amount; 65% to 88% of total mineral N at 14 of 16 locations was NO3. The greatest amounts of flux in total N among paddock locations occurred at locations 37 m from water sources, with the second-greatest amounts noted from 3.0 from water, and at sampled locations along the fence furthest from water sources. Alternatively, the lowest amounts of flux were recorded at locations near 0.25 PMP and FC. Locations with the second-lowest amounts of flux in total N were noted within 1.5 m of water sources, 0.37 PMP, 0.5 PMP, and PMP. Amounts of flux at remaining locations belonged to different groups with intermediate amounts. As with NO3, there was a general decline in amounts of flux in total N from 3.0 m from water sources to the far corner of paddocks, with the notable exception of 37 m.
Other studies have noted hotspots of mineral N in soils at specific locations within paddocks, especially in closer proximity to water, corners, and along fences, due to uneven distribution of animal use of paddock areas [38]. For example, research [8] reported that cattle grazing shortgrass rangeland in northeast Colorado, United States, spent ~27% of the time on paddocks at locations near water sources and corners, which represented 2.5% of the total area of paddocks, resulting in shifts in N distributions. Studies undertaken to define redistribution of N in tamegrass paddocks in Florida, United States, noted greater amounts of mineral N in zones closer to water and shade, relative to the remainder of paddock areas [10,37]. These distribution patterns were similar across different forms of rotational and continuous stocking applied to bermudagrass (Cynodon dactylon) and bahiagrass (Paspalum notatum) paddocks [10,37]. In comparison, the distribution of flux in plant available NO3 and total mineral N in the current study showed variability among sampled locations, but higher amounts occurred at locations other than in immediate proximity to water. Further, fluxes in plant available N at other (supposed) high-traffic locations (i.e., NC and FC) were among the lower groups of mean responses that were recorded. Other studies on native rangeland noted positive correlations between heterogeneity in paddock use by cattle and size of paddocks [11]. Given the variable distributions of mineral N in the current study, the large sizes of paddocks and sub-paddocks may have limited uniform use of paddock (and sub-paddock) areas by cattle.

3.3. Phosphorus and Magnesium

There were significant soil depth (F1, 194 = 86.8; p < 0.01) and paddock location (F15, 194 = 5.3; p < 0.01) main effects on flux of available P. The interaction between stocking method and time of year was also significant (F1, 194 = 24.8; p < 0.01) for flux in available P. Among effects of soil depth, greater amounts of P flux were noted within the upper 7.5 cm depth than the 7.5–15 cm increment (0.75 versus 0.28 µg P cm−2; Diff = 0.45 µg). Greater amounts of flux in plant-available P within the uppermost segment of the soil profile was not unexpected, as such responses have been reported elsewhere for a range of different grasslands [3]. Larger concentrations in P were recorded in the upper 15 cm of soil than in deeper increments of bermudagrass paddocks in Florida, United States, managed under continuous and rotational stocking methods, with similar responses across stocking methods [10].
Within the stocking method × time of year interaction (Table 6), the largest fluxes in plant-available P occurred in response to rotational stocking during March, while the second-largest occurred under continuous stocking during August. The lowest flux in available P within the interaction was recorded for responses to rotational stocking during August. Differences among mean amounts of plant-available P during the growing season are driven by amounts present in soil solution at the start of growing seasons, plus amounts that become soluble during growing seasons [3]. Responses to continuous stocking indicated a degree of consistency between these factors and uptake by plants (Table 6), while declines in P flux under rotational stocking in summer may indicate depletion of available pools. However, the concentration of plant-available P in soils is generally low [3], so the effects of stocking methods during different times of the growing season are unclear. It is difficult to assess what such low fluxes in plant-available P represent, as it is only a portion of the entire P pool. Other research on P distributions within paddocks of grassland under rotational and continuous stocking noted differences in amounts related to lengths of applied grazing [10,37].
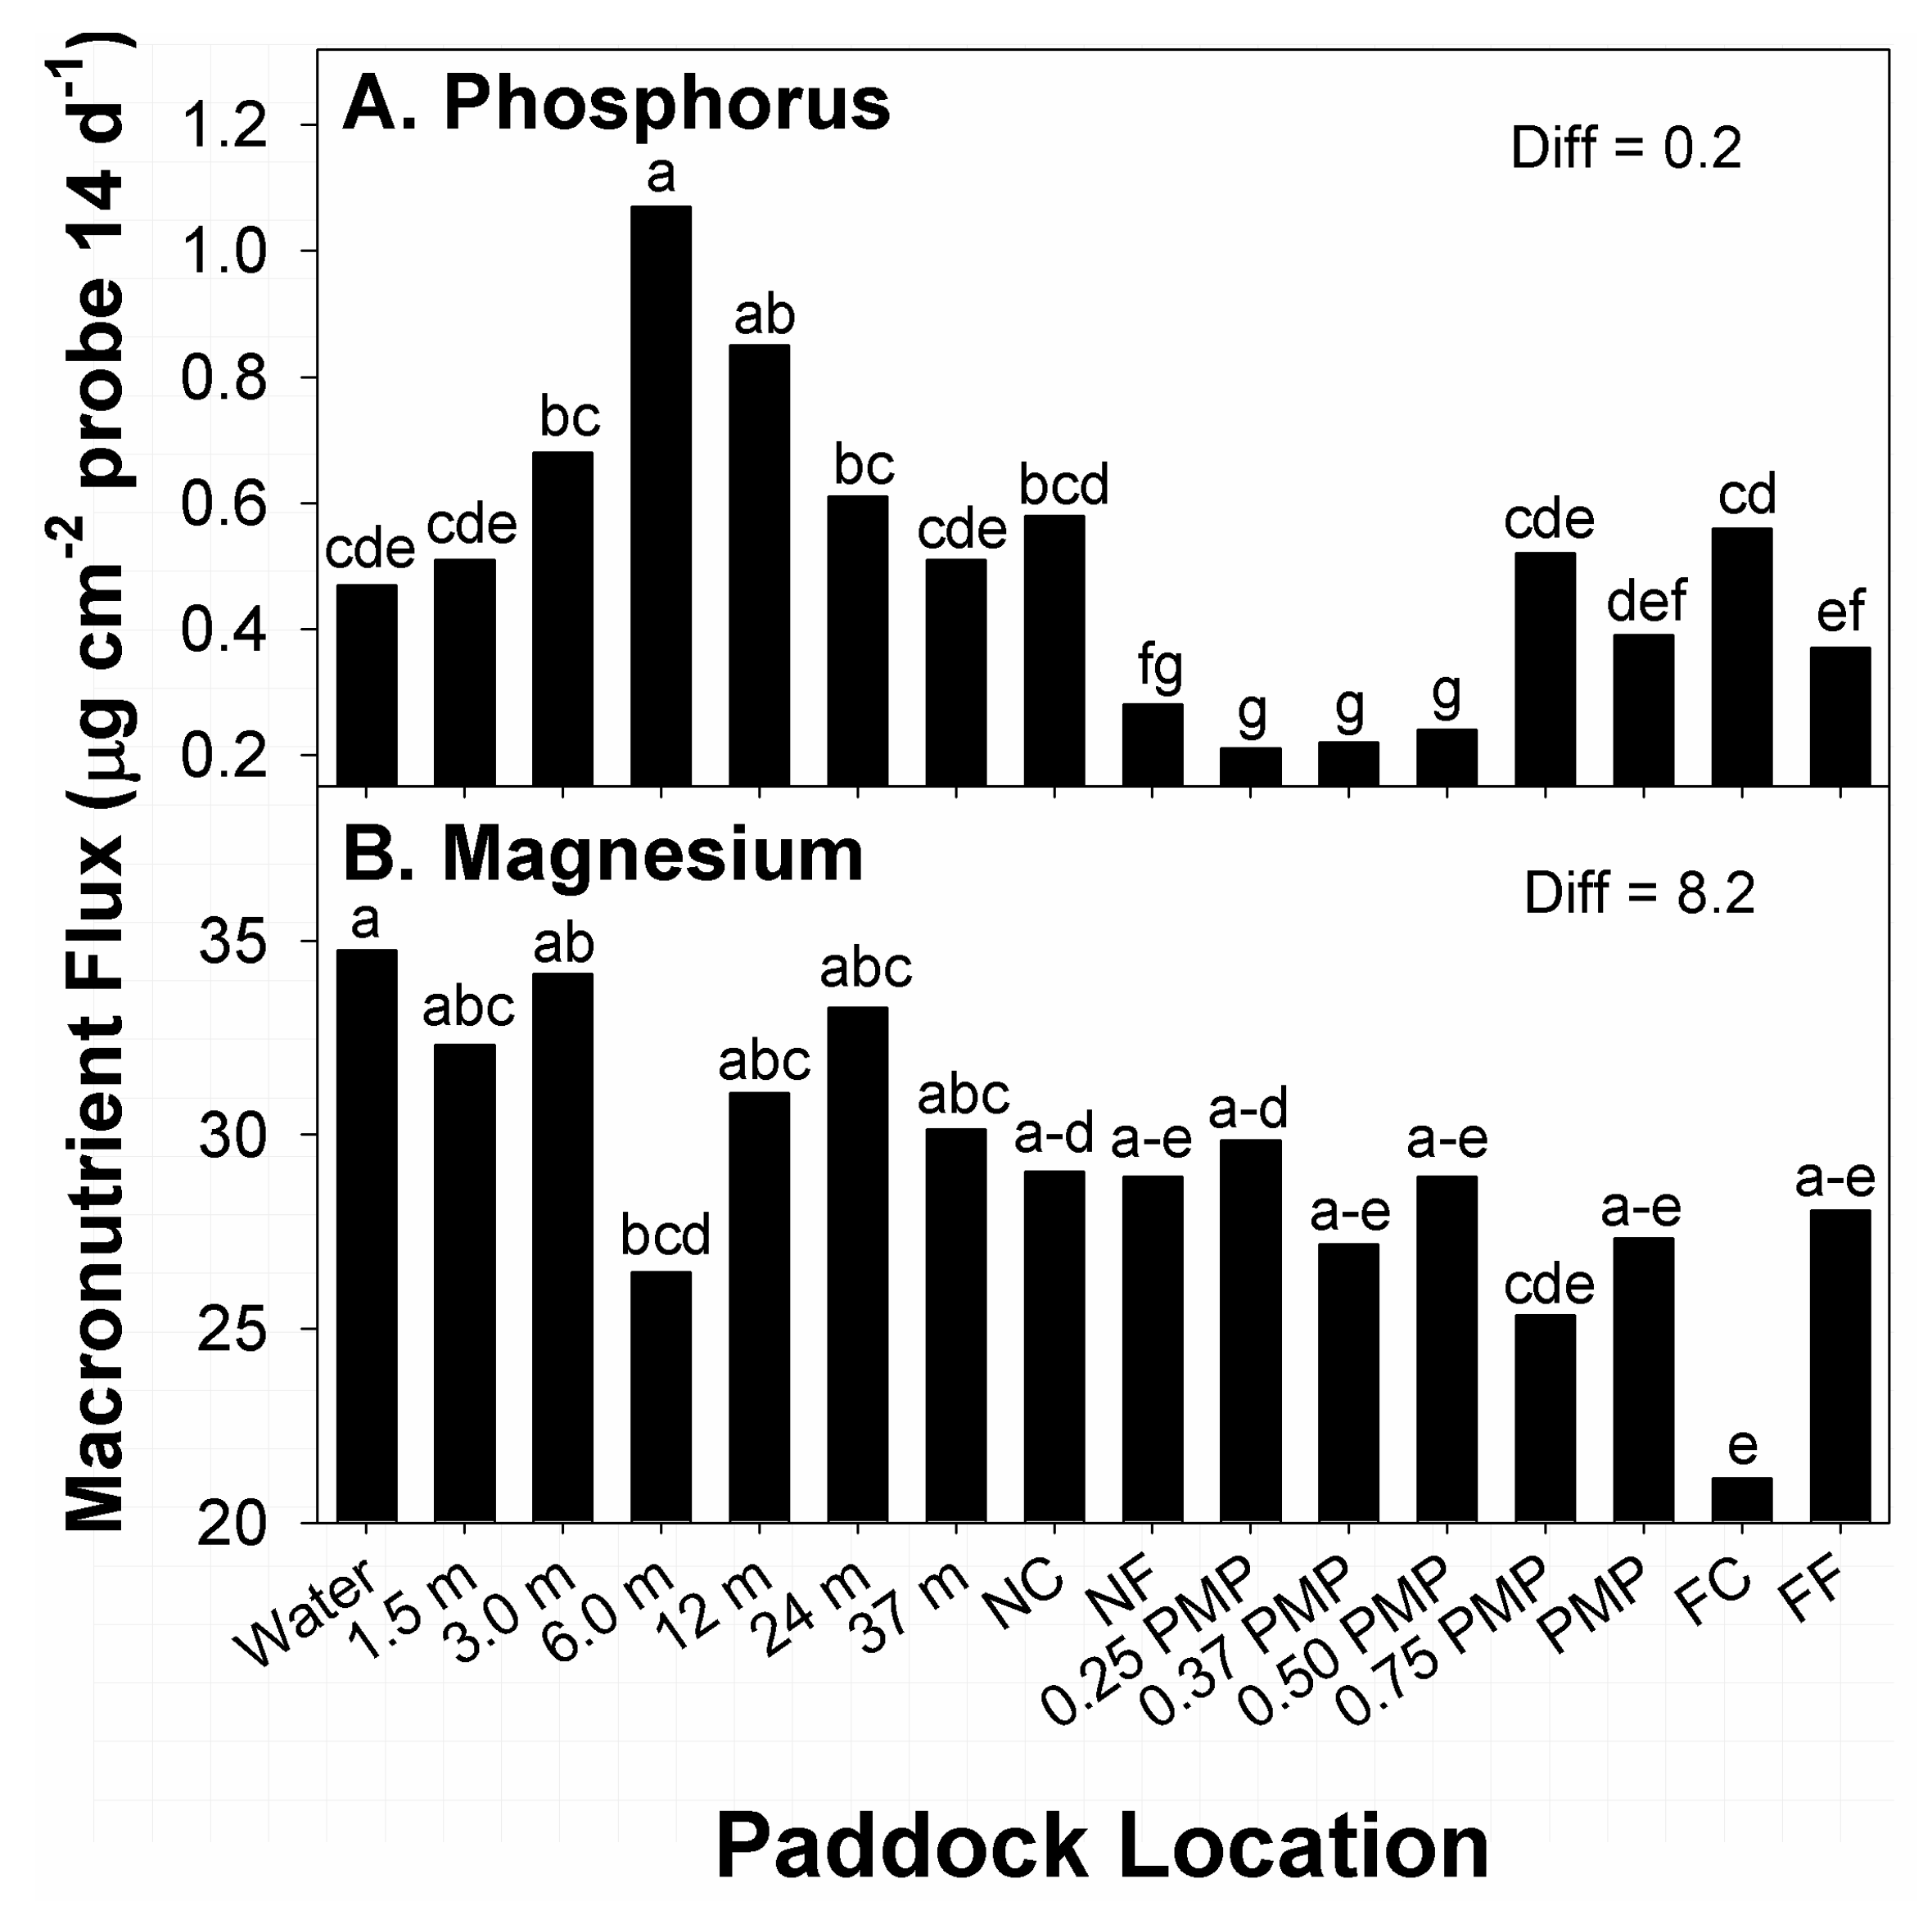
Among effects related to paddock location, the greatest amounts of flux in P were recorded at 6 m from water, while the second-greatest amounts occurred at 12 m from water (Figure 3A). In contrast, locations with the lowest amounts of P flux were noted at 0.25 PMP through 0.5 PMP. Locations with the second-lowest amounts of P flux occurred at NF and FF. Flux in P at all other locations belonged to different means groups, with intermediate amounts recorded. The potential of the two applied stocking methods to affect distribution of plant-available P within different areas of paddocks (sub-paddocks) was not entirely clear. While there were definite areas with high and low P flux, these zones did not translate to locations normally considered high-traffic areas, such as water sources, corners, or fences [37,38]. Cattle could have loafed roughly 6 to 12 m from water in all sampled paddocks and sub-paddocks, but that would have also resulted in higher flux in other neighboring locations.
The primary sources of plant-available P in soils during growing seasons is derived from recycling of P in soil organic matter via microbes, and through inputs and decomposition of livestock feces, which are slow processes [3,10]. Small amounts are also derived by weathering of parent materials of soils. In this instance, a likely contributing factor for the lower amounts of flux in available P at the more centrally-located positions in paddocks could be a lack of use of these areas by cattle [10], or a lack of deposition of excreta in these areas when frequented by cattle. Cattle grazing larger areas of rangeland can travel up to 1.6 km day−1 while searching for forage, though areas frequented in such travel may not be grazed or used for loafing [38,39]. Other research on P distributions within paddocks of grasslands under rotational and continuous stocking noted higher amounts of inorganic P closer to water or shade compared to paddock centers and more distant locations (78–130 [10], and 8–17 [40] ppm), or different times of growing seasons (11–27 ppm [9]), but no effects of stocking method on distributions, as was recorded in the current study.
Among effects on plant available Mg, main effects related to paddock location (F15, 195 = 1.8; p = 0.03) and stocking method × time of year interactions (F1, 194 = 12.2; p < 0.01) were significant. All other main and interaction effects were not (0.11 < p < 0.60). Within stocking method × time of year interactions (Table 6), the largest fluxes in plant-available Mg occurred in response to rotational stocking during March, while the second-largest occurred under continuous stocking during August. The lowest flux in Mg occurred in response to rotational stocking during August.
Differences in mean responses in this interaction varied compared to results of other studies. Studies on both native prairie and tame pasture have reported higher amounts of Mg in soils under rotational than continuous stocking [3,13], as was noted in the current study, in addition to changes in distribution patterns related to stocking methods [37]. Research has also recorded declines in Mg concentrations in soils through leaching under grazing [3,39], as in the decline in flux recorded under rotational stocking between March and August. In contrast, the increase in Mg over the growing season under continuous stocking may be related to inputs via feces, which is the primary input source, due to yearlong residency on paddocks [3,37]. Soil type can also have some effects on flux in available Mg, with lower amounts recorded in sandier soils. However, the primary sources of plant-available Mg are found in animal excreta, and primarily (>75% of total) in feces [3], so the longer grazing time afforded by continuous stocking provided a greater opportunity for Mg enrichment. The current study noted higher amounts under rotational stocking in March, but continuous stocked paddocks, dominated by sandier soils, generated similar high fluxes in August.
The greatest amounts of flux in available Mg among paddock locations, across stocking methods, occurred at water sources, with the second-greatest amounts noted at 3 m from water (Figure 3B). Alternatively, the lowest amounts of flux were recorded at FC locations. Locations with the second-lowest amounts of flux in Mg were noted at 0.75 PMP. Amounts of Mg flux at remaining locations belonged to groups with intermediate amounts, with some mean fluxes belonging to 5 means groups. Therefore, there was a degree of similarity in amounts of Mg flux at different locations along transects. A total of 13 means belonged to the group containing the largest response, while 7 responses belonged to the means group with the lowest amounts of flux. Overall, there was a general decline in Mg flux from water sources to FC, but the degree of variability present in flux among paddock locations makes identifying the presence of hot spots difficult. Research on paddocks of introduced perennial grasses managed by different stocking methods reported greater amounts of Mg in larger zones of paddocks closer to water or shade [10,37]. A similar effect was noted in the current study in the lower means of Mg flux with increasing distance from water, though the test for differences noted a degree of similarity between locations near water through FF, which were distances of 423 and 976 m from water.

3.4. Calcium and Sulfur

Main effects of time of growing season (F1, 194 = 155.7; p < 0.01) and paddock location (F15, 194 = 2.3; p < 0.01) on flux in available Ca were significant; all other main and interaction effects were not (0.11 < p < 0.90). The lack of effects related to stocking methods was unexpected. Earlier research on native prairie in north-central Texas, United States, noted greater amounts of Ca in surface soils of rotational stocked sub-paddocks than in larger, continuously stocked paddocks [13]. Among times of growing season, higher flux in available Ca was noted at time of sampling during August, compared to March (181 vs. 116 µg Ca cm
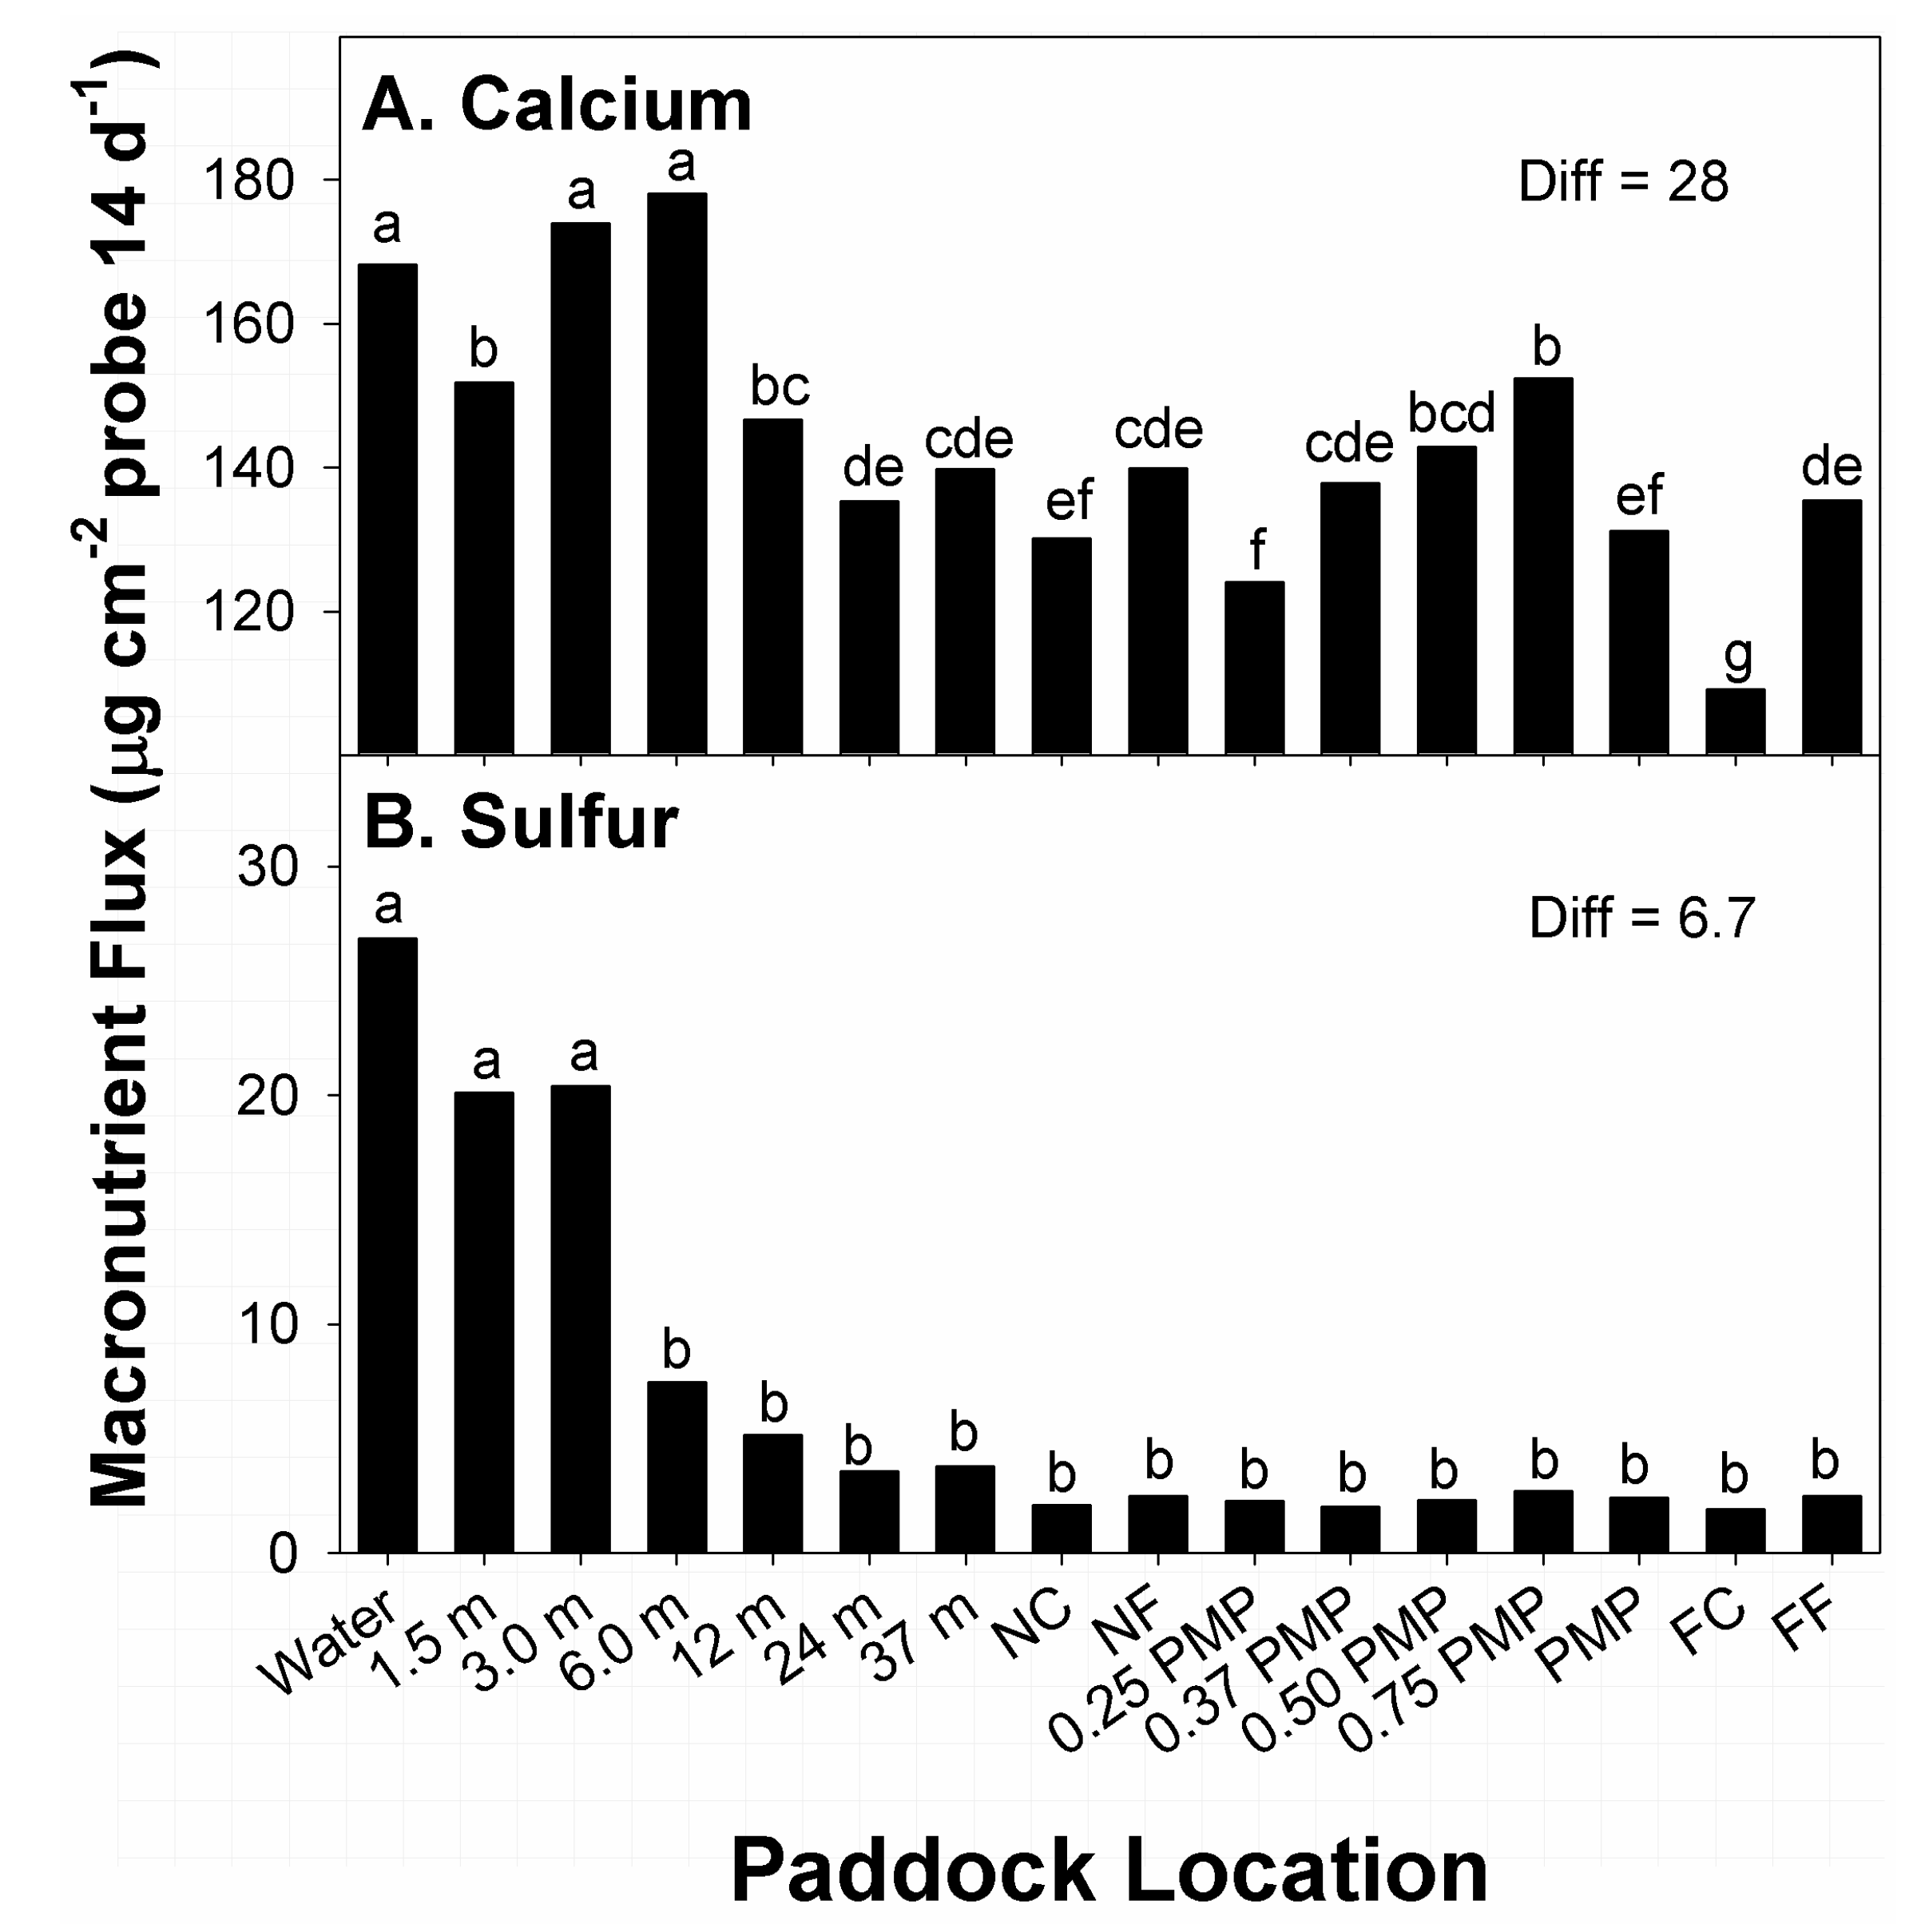
−2 probe; Diff = 5.4 µg). Among effects related to paddock location, the greatest amounts of flux in Ca were recorded at water sources 3.0 and 6.0 m from water (Figure 4A). Locations with the second greatest amounts of Ca flux were noted at 1.5 m from water, and 0.75 PMP. Locations with the lowest and second-lowest amounts of Ca flux were noted at far corners from water sources, and 0.25 PMP, respectively. Flux in Ca at all other locations belonged to different means groups with intermediate amounts recorded.
Calcium in excreta from animals is primarily found in feces, with <3% of animal inputs to soil found in urine. Fecal sources of Ca are also more significant drivers of Ca flux in grassland soils than amounts derived from decomposition of plant residues, or breakdown of parent materials of soils [3]. However, reports of Ca inputs to grassland soils via cattle excreta varies widely. Further, Ca movement from dung into available pools in soils is not well defined, particularly in native rangelands of the United States. A study on soil responses of native prairie ecosystems in northcentral Texas, United States, reported higher concentrations of Ca in soils of paddocks managed by rotational than continuous stocking, with both concentrations lower than was recorded under no grazing [13]. While the current study did show greater amounts of Ca flux in close proximity to water across stocking methods, other locations that would be considered high-traffic zones for cattle (i.e., corners and fences) tended to show lower flux, despite the application of stocking methods for 6 years.
Differences in amounts of flux of plant-available Ca during different seasons have been previously reported. Dickinson and Craig [40] reported Ca in soils increased with amount of precipitation received. However, the current study showed lower amounts of Ca flux during spring, under wetter conditions in conjunction with precipitation events, compared to flux recorded in summer. Precipitation received during individual calendar years in the US SGP, including the study site, is highly variable in amount and timing of precipitation [41]. Such variability in received precipitation would result in some level of variability of plant-available Ca and other macronutrients. Larger precipitation events than were encountered during this study may be required. As such, Ca movement from dung into soil without such events likely occurs at rates that are similar to amounts derived from organic matter in dung [42,43].
The main effects of time of growing season (F1, 194 = 5.4; p = 0.02) and paddock location (F15, 194 = 2.0; p = 0.02) on flux in available S were significant; all other main and interaction effects were not (0.34 < p < 0.98). Among times of growing season, higher flux in available S was recorded at time of sampling during August than March (4.8 vs. 3.7 µg S cm−2 probe; Diff = 0.7 µg). Among effects of paddock location, the greatest amounts of flux in available S were recorded within 3.0 m of water sources (Figure 4B). Thereafter, amounts of S flux at 6.0 m from water to FC belonged to the same means group and displayed low and consistent amounts of flux. Flux of available S at these locations ranged from 6 to 28% of amounts recorded closer to water sources.
The majority (>90%) of plant-available S within the uppermost sections of soil profiles in grazed temperate grasslands are present in labile organic forms derived from animal excreta and plant residues [44]. Inputs of plant-available S from grazing animals is related to relationships between retention and throughput of consumed forage in animals. Amounts of S in urine and feces varies with type of grassland, location within landscape where deposited, and form of management. Research in Australia and New Zealand reported 50 to 70% of S excreted by cattle was labile forms of sulfate in urine [44,45]. Alternatively, S concentration in dung tends to be small (~0.3% of dung dry matter) and generally in organic forms that mineralize at slow rates, similar to soil organic matter [3,44].
Cattle retain roughly 25% of S within biomass of consumed forage, with the remainder excreted, primarily in urine [3]. The current study showed redistribution of S within grazed paddocks was limited, and largely occurred in proximity (≤3.0 m) to water, compared to other locations. Further, other high traffic areas (corners and fences) showed low amounts of flux compared to water sources. In comparison, research in Florida, United States, [10] reported no significant effects of stocking method or paddock locations related to S distribution within grazed bermudagrass paddocks.

3.5. Potassium

There were significant differences in main effects related to time of year (F1, 194 = 37.4; p < 0.01) and soil depth (F1, 194 = 66.9; p < 0.01) on plant-available K, as was the stocking method × paddock location interaction (F15, 194 = 2.3; p = 0.01). All other main and interaction effects were not significant (0.14 < p < 0.96). Greater amounts of flux were noted during March than were recorded in August (24.4 vs. 14.7 μg K cm−2 probe; Diff = 7.4 µg). Among soil depths, greater amounts of flux were noted within the upper 7.5 cm depth of profile than the 7.5 to 15 cm increment (26.1 vs. 13.7 μg K cm−2 probe; Diff = 7.4 µg). Main effects of time of year and soil depth were similar to results reported in the broader literature, with greater amounts of K flux noted during periods with greater amounts soil water and in sections of soil profiles near the surface [3,15]. Sampling during March of the current study occurred after a series of precipitation events that allowed moisture in the upper sections of soil profile to approximate field capacity. Such conditions are important in movement of K from plant residues and excreta into soil solution [3]; drought conditions prior to sampling in August would limit such movement, and reduce amounts of plant-available K in soils.
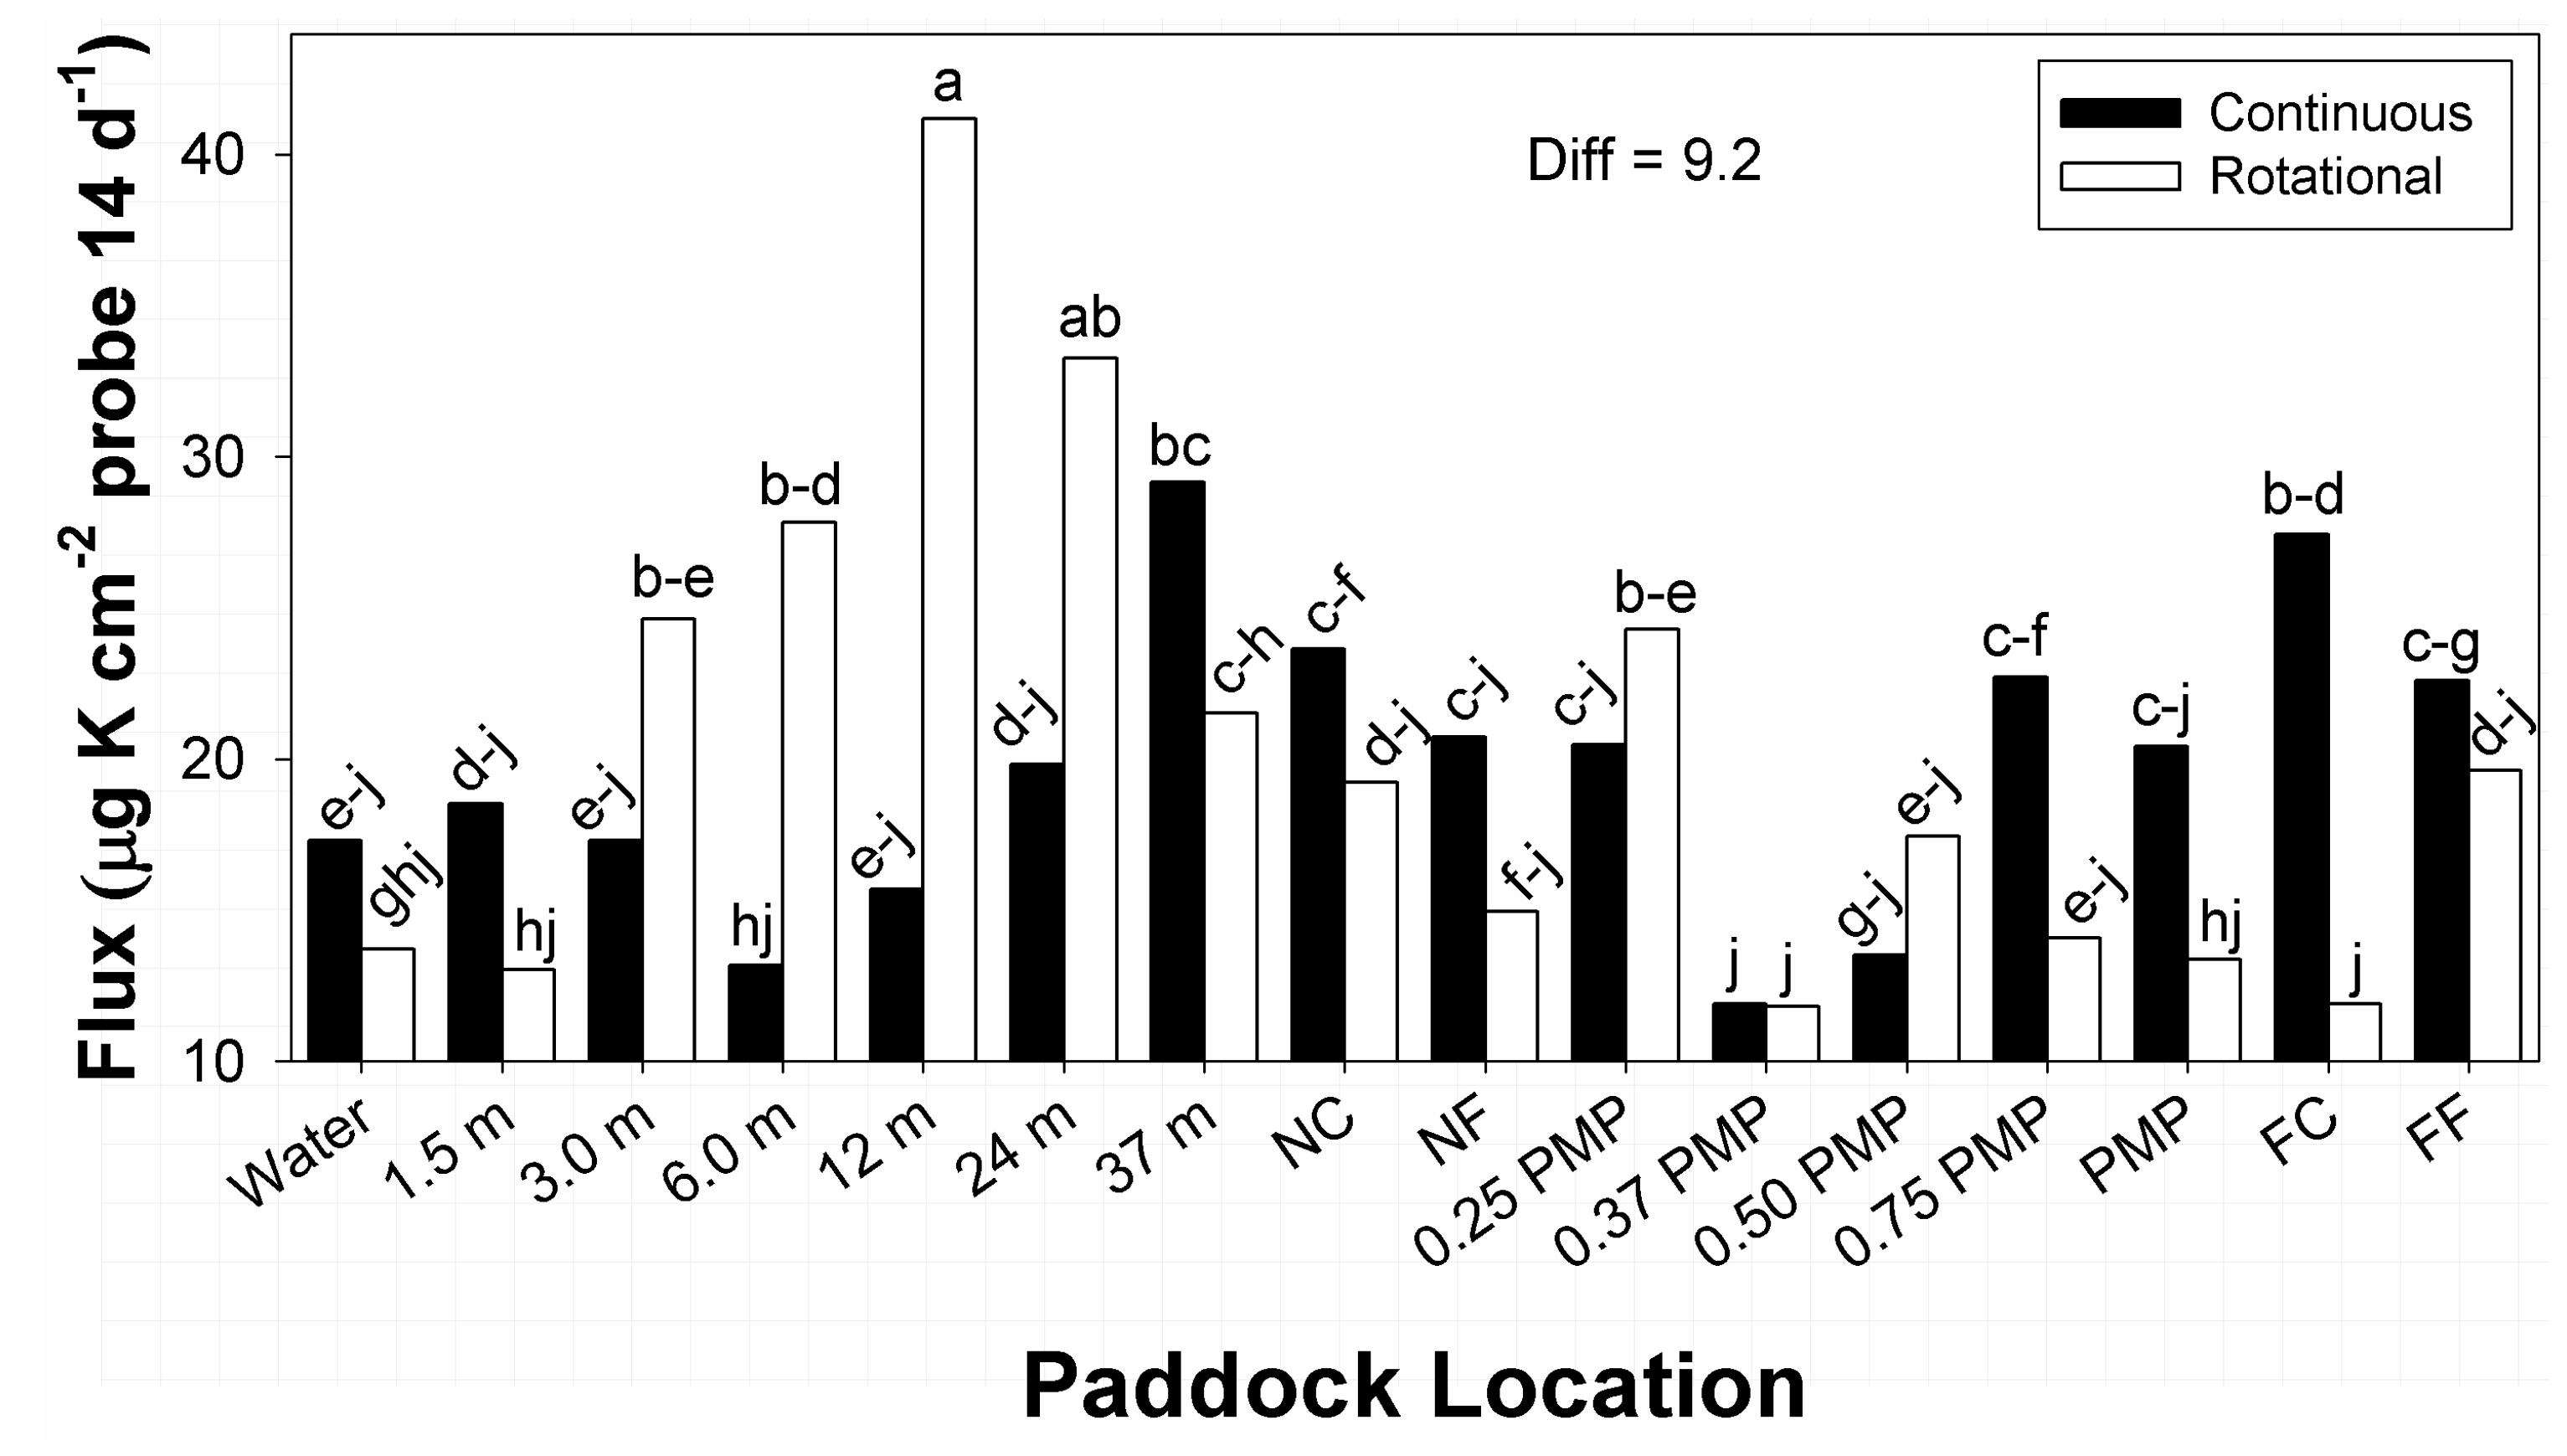
Within the stocking method × paddock location interaction in flux of available K, the greatest and second greatest amounts occurred, respectively, under rotational stocking at 12 and 24 m from water sources (Figure 5). Amounts at 37 m from water in continuous stocked paddocks had some similarity to amounts at 24 m locations in rotational stocked paddocks. In contrast, the lowest flux in available K were recorded at 0.37 PMP under both stocking methods, and FC in rotational stocked paddocks. All remaining means within the interaction belonged to ranges of means groups, with many values belonging to 7 means groups within the interaction. Amounts of flux in plant available K under both stocking methods displayed undulations among low and high amounts with increasing distance from water, though at different locations.
The interaction between stocking method and paddock location on K flux (Figure 5) was the only occurrence of stocking method affecting the distribution of a macronutrient within paddock space. However, this impact is not clear and displayed a degree of variability, as was recorded for most of the macronutrients. Potassium is highly labile and can be easily leached from excreta and grassland soils, particularly with occurrences of high rainfall [3], which are uncommon in the US SGP [41]. Cattle excreta (particularly urine) is a primary source of plant-available K, and amounts in urine patches tend to exceed uptake requirements of plants [3,35]. Therefore, amounts of K flux could be related to some combination of conservation of K in soils by drought and local distribution of urine patches, though many of these locations did not translate to areas normally noted for high animal use [37,38]. Effects related to stocking method and paddock location on K flux showed both similarities and differences from results of other studies. Experiments testing distributions of macronutrients within paddocks of bahiagrass reported no difference among rotational and continuous stocking for soil K, but higher concentrations of K in zones near water and shade [37]. In comparison, experiments on stocking methods applied to bermudagrass paddocks also reported no difference in K concentrations in soils among stocking methods [10]. Similarly, K concentrations in soils of native prairie in northcentral Texas, United States, reported no differences among continuous and rotational stocking [13]. In contrast, amounts of flux in available K in the current study showed differences among stocking methods that occurred as undulations across paddocks and sub-paddocks.

4. Conclusions

Responses noted during this study did not provide clear definitions of the impact of stocking methods on amounts and distributions of flux in most plant-available macronutrients within paddocks. There was some evidence of redistribution in the higher fluxes of S, Ca, and Mg close to water sources, but little evidence related to effects of individual stocking methods, despite the differences between rotational (multiple grazing periods per year) and continuous (year-round) stocking. There were effects recorded for amounts of macronutrient flux among times of year and soil depths, with both stocking methods generating hot spots of flux, as was noted in other research. However, flux of 7 of the macronutrients at different locations within paddocks and sub-paddocks assigned to the stocking methods were similar, despite the large differences in paddock (and sub-paddock) sizes (and transect lengths) under the two stocking systems. One factor that likely contributed to the lack of effects of stocking methods on distributions of fluxes within paddocks and sub-paddocks was the non-uniform distribution and orientation of different features of landscapes within paddocks in relation to water sources [46], and differences in the primary exposure of landscapes within these paddocks and sub-paddocks.
Such variability in landscape features is not unusual in paddocks at production-scales, compared to smaller experimental paddocks, and can affect distribution of grazing and pasture use by cattle [47]. One feature that defines the occurrence of non-uniform landscapes within production-scale paddocks of the US SGP is related to the organization of land ownership by the Public Land Survey System. This system results in regular grids organized by township and range, on a sectional (259 ha) and sub-sectional basis. Therefore, paddocks and sub-paddocks applied to rangelands are largely organized without regard to positions within the larger landscape, resulting in multiple landscape features with multiple soils, and local plant communities, within paddock boundaries. This variability, in turn, limits the capacity of research to determine if stocking methods influence macronutrient distributions through landscape use, and placement of excreta, in production-scale paddocks and sub-paddocks. Therefore, if large production-scale paddocks are to be used in research, attention to how landscape features and locations of water sources are organized within paddocks is required [48]. Such an approach would improve the capacity of studies to define effects of stocking methods on macronutrient distributions, and landscape use by grazing cattle [49].

Author Contributions

Conceptualization, P.J.S. and K.E.T.; methodology and experimental design, B.K.N., P.J.S. and K.E.T.; statistical analysis, B.K.N.; resource management and project administration, P.J.S., K.E.T. and B.K.N.; data curation, P.J.S. and B.K.N.; writing—original draft preparation, B.K.N.; review and editing, B.K.N., K.E.T. and P.J.S.; funding acquisition, P.J.S.

Funding

This research was partially supported by funds from the Agriculture and Food Research Initiative Competitive Projects 2012-02355 and 2013-69002-23146, from United States Department of Agriculture (USDA), National Institute of Food and Agriculture.

Acknowledgments

This research is a contribution from the Long-Term Agroecosystem Research (LTAR) network. The authors wish to recognize Agricultural Research Service technicians Kory Bollinger and Jeff Weik for their assistance in managing the experiment. Mention of trademarks, proprietary products, or vendors does not constitute guarantee or warranty of products by USDA and does not imply its approval to the exclusion of other products that may be suitable. All programs and services of the USDA are offered on a nondiscriminatory basis, without regard to race, color, national origin, religion, sex, age, marital status, or handicap.

Conflicts of Interest

The authors declare no conflicts of interest.

References

  1. Jenny, H. Factors of Soil Formation: A System for Quantitative Pedology; Dover Publications: Mineola, NY, USA, 1994. [Google Scholar]
  2. Archer, S.; Smeins, F.E. Ecosystem-level processes. In Grazing Management: An Ecological Perspective; Heitschmidt, R.K., Stuth, J.W., Eds.; Timber Press: Portland, OR, USA, 1991; pp. 109–139. [Google Scholar]
  3. Whitehead, D.C. Nutrient Elements in Grassland: Soil-Plant-Animal Relationships; CABI Publishing: New York, NY, USA, 2000. [Google Scholar]
  4. Norman, M.J.T.; Green, J.O. The local influence of cattle dung and urine upon yield and botanical composition of permanent pasture. J. Br. Grassl. Soc. 1958, 13, 39–45. [Google Scholar] [CrossRef]
  5. Sheldrick, W.; Syers, J.K.; Lindgard, J. Contribution of livestock excreta to nutrient balances. Nutr. Cycl. Agroecosyst. 2003, 66, 119–131. [Google Scholar] [CrossRef]
  6. Orwin, K.H.; Bertram, J.E.; Clough, T.J.; Condron, L.M.; Sherlock, R.R.; O’Callaghan, M. Short-term consequences of spatial heterogeneity in soil nitrogen concentrations caused by urine patches of different sizes. Appl. Soil Ecol. 2009, 42, 271–278. [Google Scholar] [CrossRef]
  7. Schnyder, H.; Locher, F.; Auerswald, K. Nutrient redistribution by grazing cattle drives patterns of topsoil N and P stocks in a low-input pasture ecosystem. Nutr. Cycl. Agroecosyst. 2010, 88, 183–195. [Google Scholar] [CrossRef]
  8. Augustine, D.J.; Milchunas, D.G.; Derner, J.D. Spatial redistribution of nitrogen by cattle in semiarid rangeland. Rangel. Ecol. Manag. 2013, 66, 56–62. [Google Scholar] [CrossRef]
  9. Saunders, W.H.M. Effects of cow urine and its major constituents on pasture properties. N. Z. J. Agric. Res. 1982, 25, 61–68. [Google Scholar] [CrossRef]
  10. Mathews, B.W.; Sollenberger, L.E.; Nair, V.D.; Staples, C.R. Impact of grazing management on soil nitrogen, phosphorus, potassium, and sulfur distribution. J. Environ. Qual. 1994, 23, 1006–1013. [Google Scholar] [CrossRef]
  11. Barnes, M.K.; Norton, B.E.; Maeno, M.; Malachek, J.C. Paddock size and stocking density affect spatial heterogeneity of grazing. Rangel. Ecol. Manag. 2008, 61, 380–388. [Google Scholar] [CrossRef]
  12. Briske, D.D.; Derner, J.D.; Brown, J.R.; Fuhlendorf, S.D.; Teague, W.R.; Havstad, K.M.; Gillen, R.L.; Ash, A.J.; Willms, W.D. Rotational grazing on rangelands: Reconciliation of perception and experimental evidence. Rangel. Ecol. Manag. 2008, 61, 3–17. [Google Scholar] [CrossRef]
  13. Teague, W.R.; Dowhower, S.L.; Baker, S.A.; Haile, N.; DeLaune, P.B.; Conover, D.M. Grazing management impacts on vegetation, soil biota and soil chemical, physical and hydrological properties in tall grass prairie. Agric. Ecosyst. Environ. 2011, 141, 310–322. [Google Scholar] [CrossRef]
  14. Williams, R.D.; Ahuja, L.R.; Naney, J.W.; Ross, J.D.; Barnes, B.B. Spatial trends and variability of soil properties and crop yield in a small watershed. Trans. ASAE 1987, 30, 1653–1660. [Google Scholar] [CrossRef]
  15. Northup, B.K.; Daniel, J.A. Distribution of soil bulk density and organic matter along an elevation gradient in central Oklahoma. Trans. ASABE 2010, 53, 1749–1757. [Google Scholar] [CrossRef]
  16. Oades, J.M. The role of biology in the formation, stabilization, and degradation of soil structure. Geoderma 1993, 56, 377–400. [Google Scholar] [CrossRef]
  17. Burke, I.; Lauenroth, W.; Vinton, M.; Hook, P.; Kelly, R.; Epstein, H.; Agular, M.; Robles, M.; Aguilera, M.; Murphy, M.; et al. Plant-soil interactions in temperate grasslands. Biogeochemistry 1998, 42, 121–143. [Google Scholar] [CrossRef]
  18. Hook, P.; Burke, I.C. Biogeochemistry in a shortgrass landscape: Control by topography, soil texture and microclimate. Ecology 2000, 81, 2686–2703. [Google Scholar] [CrossRef]
  19. Northup, B.K.; Phillips, W.A.; Daniel, J.A.; Mayeux, H.S. Managing southern tallgrass prairie: Case studies on grazing and climatic effects. In Proceedings: 2nd National Conference on Grazing Lands, Nashville, TN, USA; Theurer, M., Peterson, J., Golla, M., Eds.; Omnipress Inc.: Madison, WI, USA, 2003; pp. 834–890. [Google Scholar]
  20. Northup, B.K.; Starks, P.J.; Turner, K.E. Effects of stocking methods on soil macronutrient availability at contrasting locations in tallgrass paddocks. Agronomy 2019, 9, 281. [Google Scholar] [CrossRef]
  21. USDA-NRCS. Soil Survey of Canadian County, Oklahoma. Supplement Manuscript; US Department of Agriculture–Natural Resource Conservation Service, and Oklahoma Agricultural Experiment Station: Stillwater, OK, USA, 1999.
  22. Phillips, W.A.; Coleman, S.A. Productivity and economic return of three warm-season grass stocker systems of the southern Great Plains. J. Prod. Agric. 1995, 8, 334–339. [Google Scholar] [CrossRef]
  23. Phillips, W.A.; Northup, B.K.; Mayeux, H.S.; Daniel, J.A. Performance and economic returns of stocker cattle on tallgrass prairie under different grazing management strategies. Prof. Anim. Sci. 2003, 19, 416–423. [Google Scholar] [CrossRef]
  24. Goodman, J.M. Physical environments of Oklahoma. In Geography of Oklahoma; Morris, J.W., Ed.; Oklahoma Historical Society: Oklahoma City, OK, USA, 1977; pp. 9–25. [Google Scholar]
  25. Zhou, Y.; Gowda, P.H.; Wagle, P.; Ma, S.; Neel, J.P.S.; Kakani, V.G.; Steiner, J.L. Climate effects on tallgrass prairie responses to continuous and rotational grazing. Agronomy 2019, 9, 219. [Google Scholar] [CrossRef]
  26. Szillery, J.E.; Fernandez, I.J.; Norton, S.A.; Rustad, L.E.; White, A.S. Using ion-exchange resins to study soil response to experimental watershed acidification. Environ. Monit. Assess. 2006, 116, 383–398. [Google Scholar] [CrossRef]
  27. Dick, W.A.; Culman, S.W. Biological and biochemical tests for assessing soil fertility. In Soil Fertility Management in Agroecosystems; Chatterjee, A., Clay, D., Eds.; ASA, CSSA, and SSSA: Madison, WI, USA, 2016; pp. 134–147. [Google Scholar]
  28. Grossman, R.B.; Reinsch, T.G. Bulk density and linear extensibility. In Methods of Soil Analysis: Part 4. Physical Methods; Dane, J.H., Topp, G.C., Eds.; SSSA: Madison, WI, USA, 2002; pp. 201–228. [Google Scholar]
  29. Gee, G.W.; Bauder, J.W. Particle-size analysis. In Methods of Soil Analysis, Part I. Physical and Mineralogical Methods; Klute, A., Campbell, G.S., Jackson, R.D., Mortland, M.M., Nielsen, D.R., Eds.; ASA and SSSA: Madison, WI, USA, 1986; pp. 383–411. [Google Scholar]
  30. Nelson, D.W.; Sommers, L.E. Total carbon, organic carbon, and organic matter. In Methods of Soil Analysis: Part 3. Chemical Methods; Sparks, D.L., Page, A.L., Helmke, P.A., Loeppert, R.H., Soltonpour, P.N., Tabatabai, M.A., Johnston, C.T., Sumner, M.E., Eds.; SSSA and ASA: Madison, WI, USA, 1996; pp. 961–1010. [Google Scholar]
  31. Steel, R.G.D.; Torrie, J.H. Principles and Procedures of Statistics: A Biometrical Approach, 2nd ed.; McGraw-Hill: New York, NY, USA, 1980. [Google Scholar]
  32. Littel, R.C.; Milliken, G.A.; Stroup, W.W.; Wolfinger, R.D. SAS Systems for Mixed Models; SAS Institute Inc.: Cary, NC, USA, 1996. [Google Scholar]
  33. Patetta, M. Longitudinal Data Analysis with Discrete and Continuous Responses: Course Notes for Instructor-Based Training; SAS Institute Inc.: Cary, NC, USA, 2005. [Google Scholar]
  34. Buol, S.W.; Hole, F.D.; McCracken, R.J. Soil Genesis and Classification, 2nd ed.; Iowa State University Press: Ames, IA, USA, 1980. [Google Scholar]
  35. Daniel, J.A.; Potter, K.N.; Altom, W.; Aljoe, H.; Stevens, R. Long-term grazing density impacts on soil compaction. Trans ASAE 2002, 45, 1911–1915. [Google Scholar] [CrossRef]
  36. Wheeler, M.A.; Trilica, M.J.; Fraser, G.W.; Reeder, J.D. Seasonal grazing effects soil physical properties of a montane riparian community. J. Range Manag. 2002, 55, 49–56. [Google Scholar] [CrossRef]
  37. Dubeux, J.C.B., Jr.; Sollenberger, L.E.; Vendramini, J.M.B.; Interrante, S.M.; Lira, M.A., Jr. Stocking methods, animal behavior, and soil nutrient redistribution: How are they linked? Crop Sci. 2014, 54, 2341–2350. [Google Scholar] [CrossRef]
  38. Bailey, D.W.; Gross, J.E.; Laca, E.A.; Rittenhouse, L.R.; Coughenor, M.B.; Swift, D.M.; Sims, P.L. Mechanisms that result in large herbivore grazing patterns. J. Range Manag. 1996, 49, 386–400. [Google Scholar] [CrossRef]
  39. Arnold, G.W.; Dudzinski, M.L. Ethology of Free-Ranging Domestic Animals; Elsevier Scientific Publ.: New York, NY, USA, 1979. [Google Scholar]
  40. Dickinson, C.H.; Craig, J. Effects of water on the decomposition and release of nutrients from cow pats. New Phytol. 1990, 115, 139–147. [Google Scholar] [CrossRef]
  41. Schneider, J.M.; Garbrecht, J.D. A measure of usefulness of seasonal precipitation forecasts for agricultural applications. Trans. ASAE 2003, 46, 257–267. [Google Scholar] [CrossRef]
  42. Steele, K.W.; Judd, M.J.; Shannon, P.W. Leaching of nitrate and other nutrients from grazed pasture. N. Z. J. Agric. Res. 1984, 27, 5–12. [Google Scholar] [CrossRef]
  43. Underhay, V.H.S.; Dickinson, C.H. Water, mineral and energy fluctuations in decomposing cow pats. J. Br. Grassl. Soc. 1978, 33, 189–196. [Google Scholar] [CrossRef]
  44. Nguyen, M.L.; Goh, K.M. Sulphur cycling and its implications on sulphur fertilizer requirements of grazed grassland ecosystems. Agric. Ecosyst. Environ. 1994, 49, 173–206. [Google Scholar] [CrossRef]
  45. Haynes, R.J.; Williams, P.H. Nutrient cycling and soil fertility in the grazed pasture ecosystem. Adv. Agron. 1993, 49, 119–199. [Google Scholar]
  46. Stuth, J.W. Foraging behavior. In Grazing Management: An Ecological Perspective; Heitshcmidt, R.K., Stuth, J.W., Eds.; Timber Press: Portland, OR, USA, 1991; pp. 65–83. [Google Scholar]
  47. Wallis-DeVries, M.F.; Schippers, P. Foraging in a landscape mosaic, selection for energy and minerals in free-ranging cattle. Oecologia 1994, 100, 107–117. [Google Scholar] [CrossRef] [PubMed]
  48. Cook, C.W.; Stubbendieck, J. Range Research: Basic Problems and Techniques; Society for Range Management: Denver, CO, USA, 1986. [Google Scholar]
  49. Long, J.W.; Medina, A.M. Consequences of ignoring geologic variation in evaluating grazing impacts. Rangel. Ecol. Manag. 2006, 59, 373–382. [Google Scholar] [CrossRef]
Figure 1. Illustration of locations sampled within production-scale paddocks.
Agronomy 09 00329 g001
Figure 2. Location effects on flux in plant-available soil (A) NO3, (B) NH4+, and (C) total mineral N; columns within panels with the same letter were not different at p = 0.10.
Agronomy 09 00329 g002
Figure 3. Location effects on flux in plant-available (A) phosphorus and (B) magnesium in soils; columns within panels with the same letter were not different at p = 0.10.
Agronomy 09 00329 g003
Figure 4. Location effects on flux of plant-available (A) calcium and (B) sulfur in soils; columns within panels with the same letter were not different at p = 0.10.
Agronomy 09 00329 g004
Figure 5. Stocking method × paddock location interaction in flux of plant-available K in soils; columns with the same letter were not different at p = 0.10.
Agronomy 09 00329 g005
Table 1. Mean (±1 standard deviation (s.d.)) distances (meters) from 9 locations where macronutrient availability was measured to water sources within paddocks and sub-paddocks assigned to stocking methods.
Location
StockingNearNear FarFar
MethodCornerFence0.25 PMP0.37 PMP0.50 PMP0.75 PMPPMPFenceCorner
Continuous14 (11)77 (13)112 (5)167 (8)222 (8)338 (9)450 (10)976 (69)912 (43)
Rotational55 (14)35 (11)58 (17)82 (11)110 (13)166 (13)220 (10)423 (14)455 (43)
PMP = paddock mid-point.
Table 2. Descriptive statistics and distribution functions of populations (n = 256) of macronutrient fluxes in the upper 15 cm of soils in paddocks managed by different stocking methods.
Macronutrients
Mineral NNO3-NNH4+-NPSKMgCa
Distribution
Skewness3.73.67.93.63.21.70.4<0.1
Kurtosis17.816.782.618.510.13.80.2−0.6
K-S normality 0.250.260.310.260.320.150.040.05
K-S p <0.01<0.01<0.01<0.01<0.01<0.01>0.150.10
c.v. 144156204157190744443
-------------------------------------- (µg cm−2 probe) --------------------------------------
Statistics
Mean870.81.2153439189
s.d. 12121.61.72825178
Median 430.40.452838192
Minimum<1< 10.10.1<1<1421
Maximum878320.015.015415593399
Ln TransformYYYYYYNN
K-S = Kolmogrov-Smirnov normality test; p ≥ 0.10 approximate normality; c.v. = coefficient of variation (%); s.d. = standard deviation.
Table 3. Correlation coefficients (r) of relationships between soil properties and physical features of paddock locations with plant-available flux in 8 macronutrients.
Macronutrients
Soil PropertiesNO3NH4Total NPSKMgCa
Clay0.04−0.080.04−0.080.50 #−0.360.170.24
Silt−0.37−0.01−0.38−0.05−0.390.12−0.19−0.16
Sand0.40 #0.060.40 #0.300.180.050.130.05
Bulk Density−0.09−0.04−0.10−0.380.01−0.290.07−0.16
Organic matter−0.01−0.01−0.010.110.200.140.010.11
Elevation−0.15−0.25−0.13−0.02−0.140.17−0.26−0.12
DTW −0.17−0.01−0.16−0.02−0.25−0.09−0.09−0.11
Distance (m) to water source from sampled locations; # indicates significance of p ≤ 0.10.
Table 4. Mean and standard deviations of particle fractions, bulk density, and organic matter of 7.5 cm increments of surface soils in paddocks managed by two stocking methods.
Soil Attributes
Particle FractionsBulkOrganic
Stocking MethodClaySiltSandDensityMatter
----------------- (%) -----------------(g cm−3)(g kg−1)
Continuous23 (6)35 (12)42 (9)1.17 (0.15)38 (9)
Rotational22 (1)46 (4)33 (3)1.09 (0.16)43 (12)
Table 5. Stocking method × soil depth interactions in flux of total mineral N and NO3, and stocking method × time of year in NH4 flux within soils.
Macronutrients
Total N NO3-N NH4-N
Soil Depth Soil Depth Time of Year
Stocking Method0–7.5 cm7.5–15 cm 0–7.5 cm7.5–15 cm MarchAugust
---------------------------------- (µg cm2 probe 14 d−1) ----------------------------------
Continuous3.8 ab3.1 bc 3.0 ab2.3 bc 0.5 b0.3 c
Rotational4.6 a2.3 c 3.7 a1.6 c 0.7 a0.2 d
Diff1.3 1.2 0.1
Diff is statistical differences for means tests; numbers within groups of columns with the same letter were not different at p = 0.10.
Table 6. Stocking method × time of year interaction effects on flux in plant-available P and Mg in soil .
Macronutrients
P Mg
Time of YearContinuousRotational ContinuousRotational
------------------- (μg cm−2 probe 14 d−1) -------------------
March0.50 ab0.63 a 25.2 bc37.7 a
August0.58 a0.24 b 35.5 ab18.6 c
Diff0.26 6.6
Diff was statistical difference of means tests, and numbers within groups of columns with the same letter were not different at p = 0.10.

