Integrated Management of Cheatgrass (Bromus tectorum) with Sheep Grazing and Herbicide


Abstract
:1. Introduction
2. Materials and Methods
2.1. Study Site
2.2. Experimental Design
2.3. Sheep Grazing
2.4. Herbicide Application
2.5. Data Collection
2.6. Statistical Analysis
3. Results
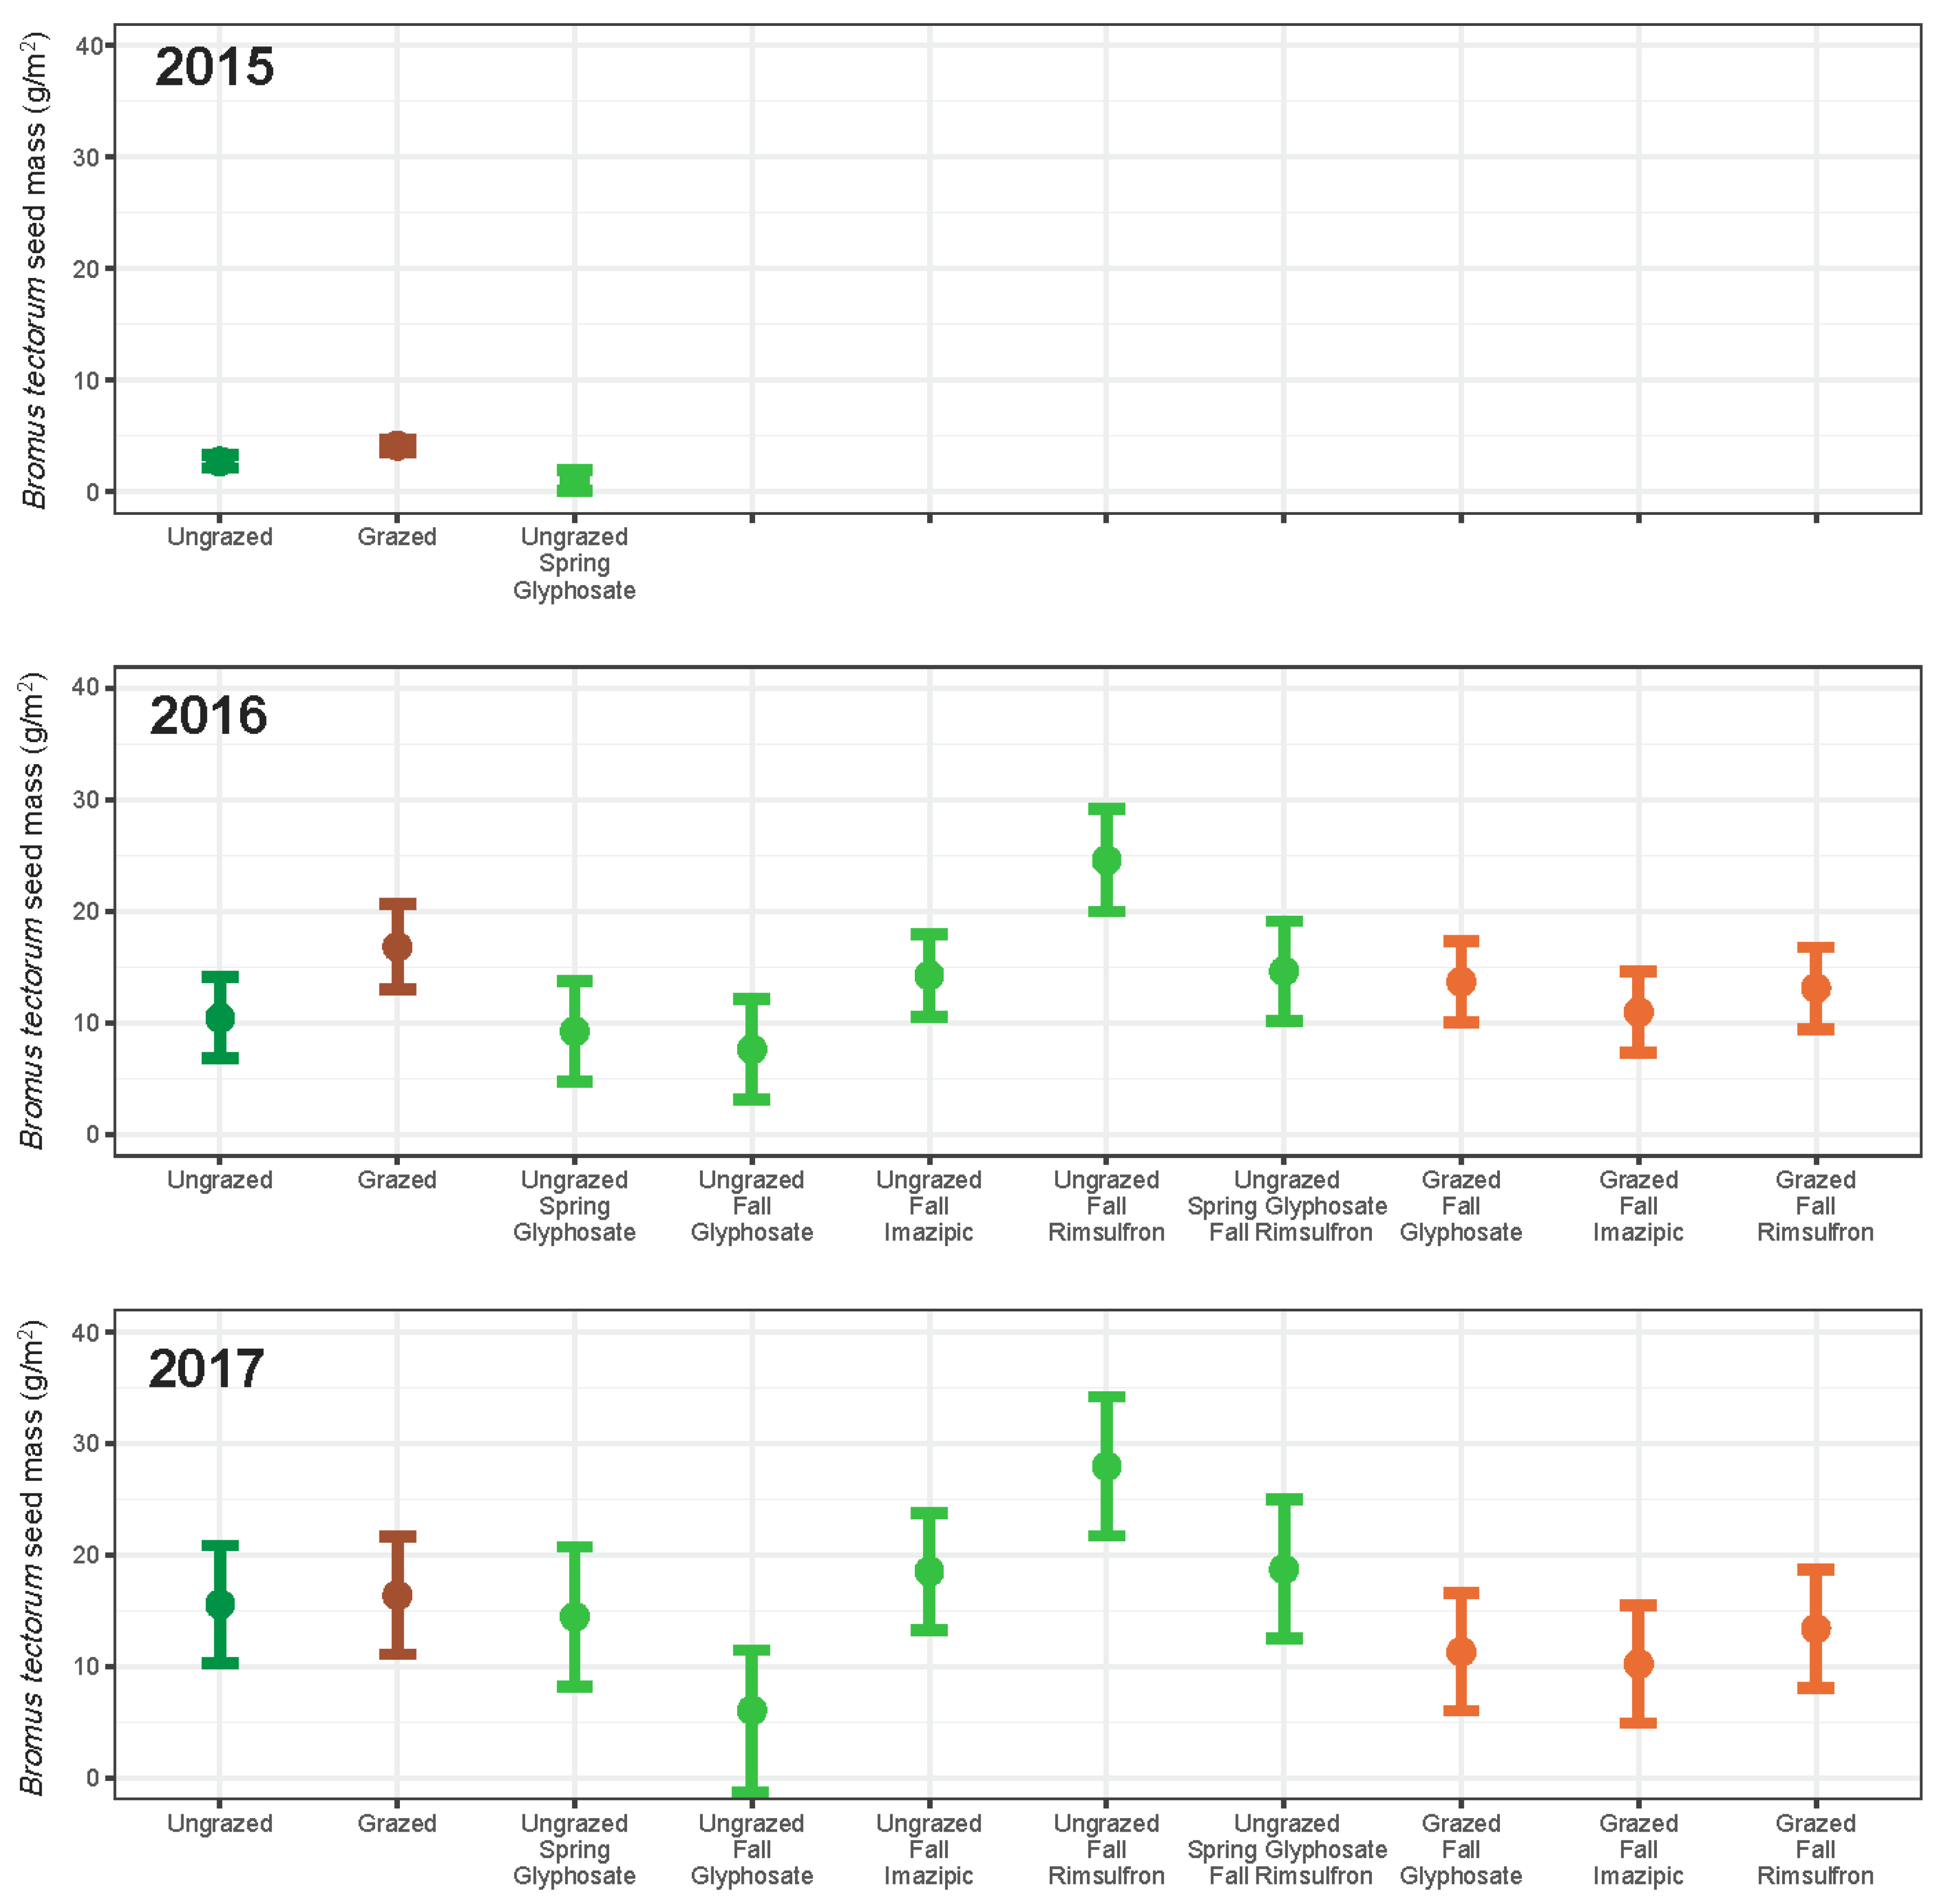
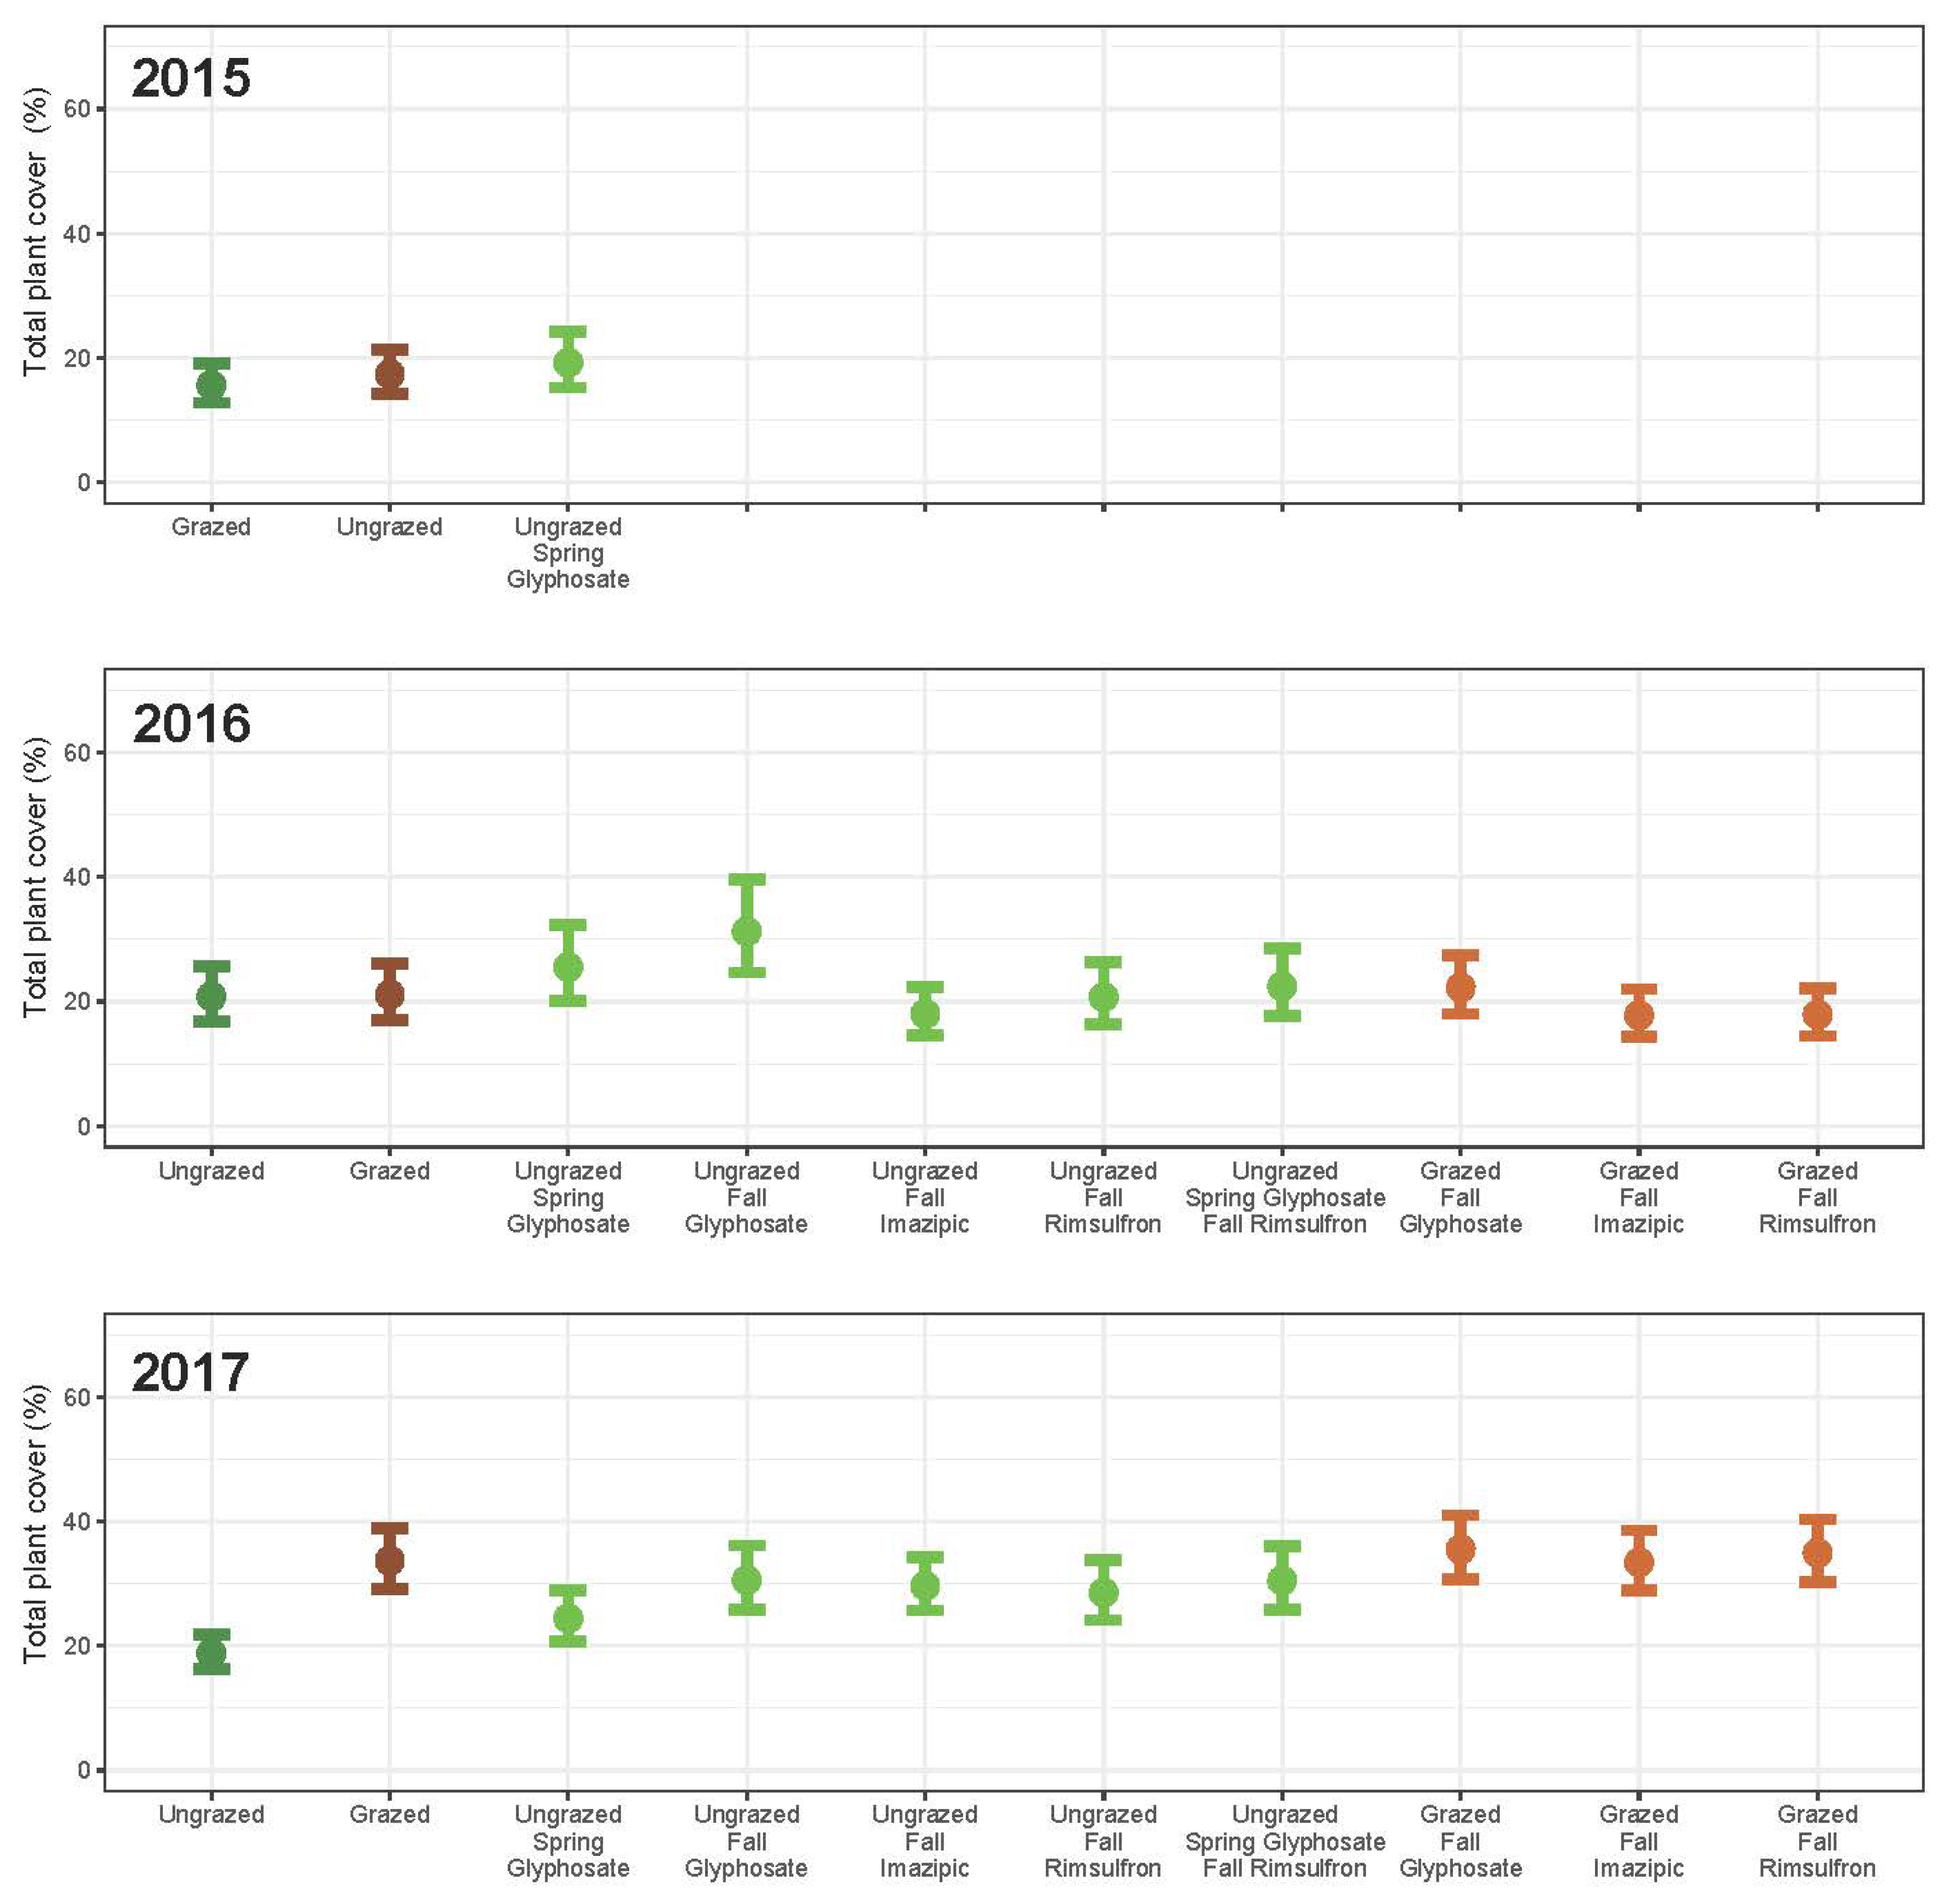
3.1. Grazing
3.2. Herbicide
3.3. Integrated Grazing and Herbicide
3.4. Community Change
4. Conclusions
Supplementary Materials
Author Contributions
Funding
Acknowledgments
Conflicts of Interest
References
- Hobbs, R.J.; Huenneke, L.F. Disturbance, diversity, and invasion: Implications for conservation. Conserv. Biol. 1992, 6, 324–337. [Google Scholar] [CrossRef]
- D’Antonio, C.M.; Dudley, T.L.; Mack, R.N. Disturbance and biological invasions: Direct effects and feedbacks. In Ecosystems of Disturbed Ground; Walker, L.H., Ed.; Elsevier: New York, NY, USA, 1999; pp. 413–451. [Google Scholar]
- Hobbs, R.J.; Arico, S.; Aronson, J.; Baron, J.S.; Bridgewater, P.; Cramer, V.A.; Epstein, P.R.; Ewel, J.J.; Klink, C.A.; Lugo, A.E.; et al. Novel ecosystems: Theoretical and management aspects of the new ecological world order. Glob. Ecol. Biogeogr. 2006, 15, 1–7. [Google Scholar] [CrossRef]
- Miller, J.R.; Bestelmeyer, B.T. What’s wrong with novel ecosystems, really? Restor. Ecol. 2016, 24, 577–582. [Google Scholar] [CrossRef]
- Radosevich, S.R.; Holt, J.S.; Ghersa, C. Ecology of Weeds and Invasive Plants, 3rd ed.; Wiley: Hoboken, NJ, USA, 2007. [Google Scholar]
- Davis, S.; Mangold, J.; Menalled, F.; Orloff, L.N.; Miller, Z.; Lehnhoff, E. A meta-analysis of canada thistle (Cirsium arvense) management. Weed Sci. 2018, 66, 548–557. [Google Scholar] [CrossRef]
- Monaco, T.A.; Mangold, J.M.; Mealor, B.A.; Mealor, R.D.; Brown, C.S. Downy brome control and impacts on perennial grass abundance: A systematic review spanning 64 years. Rangel. Ecol. Manag. 2017, 70, 396–404. [Google Scholar] [CrossRef]
- Rinella, M.J.; Maxwell, B.D.; Fay, P.K.; Weaver, T.; Sheley, R.L. Control effort exacerbates invasive—Species problem. Ecol. Appl. 2009, 19, 155–162. [Google Scholar] [CrossRef] [PubMed]
- Bahm, M.A.; Barnes, T.G. Native grass and forb response to pre-emergent application of imazapic and imazapyr. Nat. Areas J. 2011, 31, 75–79. [Google Scholar] [CrossRef]
- Beran, D.D.; Gaussoin, R.E.; Masters, R.A. Native wildflower establishment with imidazolinone herbicides. Hortscience 1999, 34, 283–286. [Google Scholar] [CrossRef]
- Morris, C.; Morris, L.R.; Surface, C. Spring glyphosate application for selective control of downy brome (Bromus tectorum L.) on great basin rangelands. Weed Technol. 2016, 30, 297–302. [Google Scholar] [CrossRef]
- Kettenring, K.M.; Adams, C.R. Lessons learned from invasive plant control experiments: A systematic review and meta-analysis. J. Appl. Ecol. 2011, 48, 970–979. [Google Scholar] [CrossRef]
- Kleppel, G.S.; LaBarge, E. Using sheep to control purple loosestrife (Lythrum salicaria). Invasive Plant Sci. Manag. 2011, 4, 50–57. [Google Scholar] [CrossRef]
- Goehring, B.J.; Launchbaugh, K.L.; Wilson, L.M. Late-season targeted grazing of yellow starthistle (Centaurea solstitialis) with goats in idaho. Invasive Plant Sci. Manag. 2010, 3, 148–154. [Google Scholar] [CrossRef]
- James, J.J.; Davy, J.; Doran, M.P.; Becchetti, T.; Brownsey, P.; Laca, E.A. Targeted grazing impacts on invasive and native plant abundance change with grazing duration and stocking density. Rangel. Ecol. Manag. 2017, 70, 465–468. [Google Scholar] [CrossRef]
- Rinella, M.J.; Hileman, B.J. Efficacy of prescribed grazing depends on timing intensity and frequency. J. Appl. Ecol. 2009, 46, 796–803. [Google Scholar] [CrossRef]
- Liebman, M.; Mohler, C.L.; Staver, C.P. Ecological Management of Agricultural Weeds; Cambridge University Press: Cambridge, UK, 2001. [Google Scholar]
- Lym, R.G. The biology and integrated management of leafy spurge (Euphorbia esula) on north dakota rangeland. Weed Technol. 1998, 12, 367–373. [Google Scholar] [CrossRef]
- Sheley, R.L.; Jacobs, J.S.; Martin, J.M. Integrating 2,4-d and sheep grazing to rehabilitate spotted knapweed infestations. J. Range Manag. 2004, 57, 371–375. [Google Scholar] [CrossRef]
- Seefeldt, S.S.; Taylor, J.B.; Van Vleet, S. Reducing euphorbia esula with a combination of sheep grazing and imazapic. J. Arid. Environ. 2007, 69, 432–440. [Google Scholar] [CrossRef]
- Taylor, K.; Brummer, T.; Rew, L.J.; Lavin, M.; Maxwell, B.D. Bromus tectorum response to fire varies with climate conditions. Ecosystems 2014, 17, 960–973. [Google Scholar] [CrossRef]
- Mack, R.N. Invasion of Bromus tectorum L. Into western North America—An ecological chronicle. Agro-Ecosyst. 1981, 7, 145–165. [Google Scholar] [CrossRef]
- Knapp, P.A. Cheatgrass (Bromus tectorum L.) dominance in the great basin desert—History, persistence, and influences to human activities. Glob. Environ. Chang. -Hum. Policy Dimens. 1996, 6, 37–52. [Google Scholar] [CrossRef]
- Young, J.; Clements, D. Cheatgrass: Fire and Forage on the Range; University of Nevada Press: Reno, NV, USA, 2009. [Google Scholar]
- Morrow, L.A.; Stahlman, P.W. The history and distribution of downy brome (Bromus tectorum) in North America. Weed Sci. 1984, 32, 2–6. [Google Scholar] [CrossRef]
- Menalled, F.; Mangold, J.; Orloff, L.N.; Davis, E. Cheatgrass: Identification, Biology and Integrated Management; University, M.S., Ed.; Montana State University Extension: Bozeman, MT, USA, 2017; Volume MT200811AG. [Google Scholar]
- Espeland, E.K.; Kilian, R. Low-dose glyphosate does not control annual bromes in the northern great plains. Invasive Plant Sci. Manag. 2015, 8, 334–340. [Google Scholar] [CrossRef]
- Ehlert, K.A.; Engel, R.E.; Mangold, J.M. Imazapic activity in a semiarid climate in downy brome (Bromus tectorum)-infested rangeland and crp sites. Weed Technol. 2015, 29, 472–479. [Google Scholar] [CrossRef]
- Mangold, J.; Parkinson, H.; Duncan, C.; Rice, P.; Davis, E.; Menalled, F. Downy brome (Bromus tectorum) control with imazapic on montana grasslands. Invasive Plant Sci. Manag. 2013, 6, 554–558. [Google Scholar] [CrossRef]
- Kyser, G.B.; Wilson, R.G.; Zhang, J.M.; DiTomaso, J.M. Herbicide-assisted restoration of great basin sagebrush steppe infested with medusahead and downy brome. Rangel. Ecol. Manag. 2013, 66, 588–596. [Google Scholar] [CrossRef]
- Burnett, S.A.; Mealor, B.A. Imazapic effects on competition dynamics between native perennial grasses and downy brome (Bromus tectorum). Invasive Plant Sci. Manag. 2015, 8, 72–80. [Google Scholar] [CrossRef]
- Diamond, J.M.; Call, C.A.; Devoe, N. Effects of targeted grazing and prescribed burning on community and seed dynamics of a downy brome (Bromus tectorum)-dominated landscape. Invasive Plant Sci. Manag. 2012, 5, 259–269. [Google Scholar] [CrossRef]
- USDA. Web Soil Survey. Available online: https://websoilsurvey.sc.egov.usda.gov/App/WebSoilSurvey.aspx (accessed on 1 March 2018).
- Mueggler, W.F.; Stewart, W.L. Grassland and Shrubland Habitat Types of Western Montana; USDA Forest Serv Gen Tech Rep INT-166; U.S. Department of Agriculture: Ogden, UT, USA, 1980.
- Seipel, T.; Rew, L.J.; Taylor, K.T.; Maxwell, B.D.; Lehnhoff, E.A. Disturbance type influences plant community resilience and resistance to Bromus tectorum invasion in the sagebrush steppe. Appl. Veg. Sci. 2018, 21, 385–394. [Google Scholar] [CrossRef]
- Bates, D.; Baechler, M.; Bolker, B.; Walker, S. Fitting linear mixed-effects models using lme4. J. Stat. Softw. 2015, 67, 1–48. [Google Scholar] [CrossRef]
- R Core Team. A Language and Environment for Statistical Computing; Foundation for Statistical Computing: Vienna, Austria, 2017. [Google Scholar]
- Oksanen, J.; Guillaume Blanchet, F.; Friendly, M.; Kindt, R.; Legendre, P.; McGlinn, D.; Minchin, P.R.; O’Hara, R.B.; Simpson, G.L.; Solymos, P.; et al. Vegan: Community Ecology Package. 2019. R package version 2.5-4. Available online: https://CRAN.R-project.org/package=vegan (accessed on 1 March 2019).
- Kindt, R.; Coe, R. Tree Diversity Analysis: A Manual and Software for Common Statistical Methods for Ecological and Biodiversity Studies; World Agroforestry Centre: Nairobi, Kenya, 2005. [Google Scholar]
- Bates, J.D.; Davies, K.W. Cattle grazing and vegetation succession on burned sagebrush steppe. Rangel. Ecol. Manag. 2014, 67, 412–422. [Google Scholar] [CrossRef]
- HilleRisLambers, J.; Yelenik, S.G.; Colman, B.P.; Levine, J.M. California annual grass invaders: The drivers or passengers of change? J. Ecol. 2010, 98, 1147–1156. [Google Scholar] [CrossRef] [PubMed]
- Young, J.; Tipton, F.; McArthur, E.; Romney, E.; SMith, S. Invasion of cheatgrass into arid environments of the lahontan basin. In Proceedings of the Symposium on Cheatgrass Invasion, Shrub Die-Off, and Other Aspects of Shrub Biology and Management, Las Vegas, NV, USA, 5–7 April 1989; Intermountain Research Station, Forest Service, USDA: Las Vegas, NV, USA, 1990; pp. 37–40. [Google Scholar]
- Elseroad, A.C.; Rudd, N.T. Can imazapic increase native species abundance in cheatgrass (Bromus tectorum) invaded native plant communities? Rangel. Ecol. Manag. 2011, 64, 641–648. [Google Scholar] [CrossRef]
- Baker, W.L.; Garner, J.; Lyon, P. Effect of imazapic on cheatgrass and native plants in wyoming big sagebrush restoration for gunnison sage-grouse. Nat. Areas J. 2009, 29, 204–209. [Google Scholar] [CrossRef]
- Hirsch, M.C.; Monaco, T.A.; Ca, C.A.; Ransom, C.V. Comparison of herbicides for reducing annual grass emergence in two great basin soils. Rangel. Ecol. Manag. 2012, 65, 66–75. [Google Scholar] [CrossRef]
- Mack, R.N.; Pyke, D.A. The demography of Bromus tectorum—Variation in time and space. J. Ecol. 1983, 71, 69–93. [Google Scholar] [CrossRef]
- Bradford, J.B.; Lauenroth, W.K. Controls over invasion of Bromus tectorum: The importance of climate, soil, disturbance and seed availability. J. Veg. Sci. 2006, 17, 693–704. [Google Scholar]
- U.S. Climate Data. Available online: https://www.usclimatedata.com/climate/norris/montana/united-states/usmt0240/2017/5 (accessed on 5 June 2018).
- Wallace, J.M.; Prather, T.S. Herbicide control strategies for Ventenata dubia in the intermountain pacific northwest. Invasive Plant Sci. Manag. 2016, 9, 128–137. [Google Scholar] [CrossRef]
- Whitson, T.D.; Koch, D.W. Control of downy brome (Bromus tectorum) with herbicides and perennial grass competition. Weed Technol. 1998, 12, 391–396. [Google Scholar] [CrossRef]
- Rinella, M.J.; Bellows, S.E. Evidence-targeted grazing benefits to invaded rangelands can increase over extended time frames. Rangel. Ecol. Manag. 2016, 69, 169–172. [Google Scholar] [CrossRef]
- Rice, P.M.; Toney, J.C.; Bedunah, D.J.; Carlson, C.E. Plant community diversity and growth form responses to herbicide applications for control of centaurea maculosa. J. Appl. Ecol. 1997, 34, 1397–1412. [Google Scholar] [CrossRef]
- Sebastian, D.J.; Sebastian, J.R.; Nissen, S.J.; Beck, K.G. A potential new herbicide for invasive annual grass control on rangeland. Rangel. Ecol. Manag. 2016, 69, 195–198. [Google Scholar] [CrossRef]


| Main Plot Treatment | Subplot Treatment | Treatment Code a | Date Applied | Number of Replicates |
|---|---|---|---|---|
| Ungrazed | None | U_C | NA | 8 |
| Ungrazed | Spring glyphosate | U_Sg | 5/1/15; 5/3/16 | 4 |
| Ungrazed | Spring glyphosate + fall imazapic | U_Sg_Fi | 5/1/15; 10/15/15; 5/3/16 | 4 |
| Ungrazed | Fall glyphosate | U_Fg | 10/15/15 | 4 |
| Ungrazed | Fall imazapic | U_Fi | 10/15/15 | 8 |
| Ungrazed | Fall rimsulfuron | U_Fr | 10/15/15 | 4 |
| Grazed | None | G_C | 5/4/15; 5/19/16 | 8 |
| Grazed | Fall glyphosate | G_Fg | 10/15/15 | 8 |
| Grazed | Fall imazapic | G_Fi | 10/15/15 | 8 |
| Grazed | Fall rimsulfuron | G_Fr | 10/15/15 | 8 |
| Fixed Effects | Random Effects | ||||||
|---|---|---|---|---|---|---|---|
| Year | Parameter a | Estimate | SE | t Value | Pr (>|t|) b | Group | Variance |
| 2015 | Intercept | 2.27 | 0.18 | 12.3 | <0.001 | pBROTE c | 0.82 |
| G_C | −0.15 | 0.11 | −1.35 | 0.181 | Frame/Rep | 0.07 | |
| U_Sg | −0.76 | 0.18 | −4.27 | <0.001 | Rep | 0.00 | |
| Location | 0.01 | ||||||
| Residual | 0.53 | ||||||
| 2016 | Intercept | 2.42 | 0.38 | 6.43 | <0.001 | pBROTE | 0.88 |
| G_C | 0.27 | 0.38 | 0.71 | 0.481 | Frame/Rep | 0.00 | |
| G_Fg | 0.20 | 0.34 | 0.58 | 0.564 | Rep | 0.11 | |
| G_Fi | 0.04 | 0.35 | 0.11 | 0.911 | Location | 0.49 | |
| G_Fr | 0.19 | 0.36 | 0.54 | 0.592 | Residual | 0.86 | |
| U_Fg | −0.02 | 0.41 | −0.05 | 0.962 | |||
| U_Fi | 0.33 | 0.35 | 0.95 | 0.345 | |||
| U_Fr | 0.91 | 0.44 | 2.06 | 0.042 | |||
| U_Sg | 0.11 | 0.44 | 0.25 | 0.800 | |||
| U_Sg_Fi | 0.41 | 0.43 | 0.96 | 0.341 | |||
| 2017 | Intercept | 3.04 | 0.39 | 7.34 | <0.001 | Frame/Rep | 0.00 |
| G_C | −0.36 | 0.32 | −1.13 | 0.260 | Rep | 0.18 | |
| G_Fg | −0.33 | 0.32 | −1.03 | 0.305 | Location | 0.64 | |
| G_Fi | −0.59 | 0.32 | −1.88 | 0.063 * | Residual | 0.89 | |
| G_Fr | −0.14 | 0.32 | −0.45 | 0.657 | |||
| U_Fg | −0.67 | 0.39 | −1.71 | 0.091 * | |||
| U_Fi | 0.36 | 0.31 | 1.16 | 0.250 | |||
| U_Fr | 0.66 | 0.39 | 1.70 | 0.092 * | |||
| U_Sg | −0.11 | 0.39 | −0.28 | 0.780 | |||
| U_Sg_Fi | −0.09 | 0.39 | −0.24 | 0.811 | |||
| Fixed Effects | Random Effects | ||||||
|---|---|---|---|---|---|---|---|
| Year | Parameter a | Estimate | SE | t Value | Pr (>|t|) b | Group | Variance |
| 2015 | Intercept | 3.67 | 0.14 | 25.4 | <0.001 | pBROTE c | 0.65 |
| G_C | −0.32 | 0.04 | −4.42 | <0.001 | Frame/Rep | 0.22 | |
| U_Sg | −0.25 | 0.11 | −2.20 | 0.029 | Rep | 0.09 | |
| Location | 0.00 | ||||||
| Residual | 0.50 | ||||||
| 2016 | Intercept | 2.97 | 0.17 | 17.5 | <0.001 | pBROTE | 0.82 |
| G_C | −0.00 | 0.16 | −0.02 | 0.987 | Frame/Rep | 0.00 | |
| G_Fg | 0.05 | 0.14 | 0.35 | 0.728 | Rep | 0.19 | |
| G_Fi | −0.26 | 0.15 | −1.70 | 0.090 * | Location | 0.03 | |
| G_Fr | −0.21 | 0.15 | −1.35 | 0.179 | Residual | 0.54 | |
| U_Fg | 0.03 | 0.18 | 0.16 | 0.875 | |||
| U_Fi | 0.10 | 0.15 | 0.60 | 0.551 | |||
| U_Fr | 0.35 | 0.19 | 1.87 | 0.063 * | |||
| U_Sg | −0.04 | 0.19 | −0.19 | 0.848 | |||
| U_Sg_Fi | −0.29 | 0.19 | −1.55 | 0.123 | |||
| 2017 | Intercept | 2.84 | 0.35 | 8.13 | <0.001 | Frame/Rep | 0.00 |
| G_C | −0.34 | 0.21 | −1.59 | 0.11 | Rep | 0.37 | |
| G_Fg | −0.39 | 0.21 | −1.84 | 0.07 * | Location | 0.58 | |
| G_Fi | −0.61 | 0.21 | −2.91 | 0.004 | Residual | 0.854 | |
| G_Fr | −0.47 | 0.21 | −2.21 | 0.028 | |||
| U_Fg | −0.32 | 0.27 | −1.15 | 0.252 | |||
| U_Fi | 0.32 | 0.21 | 1.54 | 0.126 | |||
| U_Fr | 0.37 | 0.27 | 1.35 | 0.179 | |||
| U_Sg | −0.16 | 0.27 | −0.60 | 0.552 | |||
| U_Sg_Fi | −0.38 | 0.27 | −1.38 | 0.168 | |||
| Fixed Effects | Random Effects | ||||||
|---|---|---|---|---|---|---|---|
| Year | Parameter a | Estimate | SE | t Value | Pr (>|t|) b | Group | Variance |
| 2015 | Intercept | 0.67 | 0.19 | 3.49 | 0.002 | pBROTE c | 0.72 |
| G_C | 0.31 | 0.16 | 1.92 | 0.057 * | Frame/Rep | 0.00 | |
| U_Sg | −0.87 | 0.26 | −3.40 | 0.001 | Rep | 0.00 | |
| Location | 0.05 | ||||||
| Residual | 0.78 | ||||||
| 2016 | Intercept | 1.59 | 0.44 | 3.61 | 0.003 | pBROTE | 1.0 |
| G_C | 0.37 | 0.46 | 0.80 | 0.43 | Frame/Rep | 0.00 | |
| G_Fg | 0.50 | 0.41 | 1.21 | 0.23 | Rep | 0.24 | |
| G_Fi | −0.08 | 0.43 | −0.19 | 0.85 | Location | 0.54 | |
| G_Fr | 0.16 | 0.44 | 0.37 | 0.72 | Residual | 1.05 | |
| U_Fg | −0.00 | 0.51 | −0.01 | 0.99 | |||
| U_Fi | 0.20 | 0.42 | 0.47 | 0.64 | |||
| U_Fr | 0.75 | 0.54 | 1.41 | 0.16 | |||
| U_Sg | 0.09 | 0.54 | 0.16 | 0.87 | |||
| U_Sg_Fi | 0.43 | 0.53 | 0.81 | 0.42 | |||
| 2017 | Intercept | 2.30 | 0.43 | 5.38 | <0.001 | Frame/Rep | 0.00 |
| G_C | −0.38 | 0.33 | −1.15 | 0.251 | Rep | 0.20 | |
| G_Fg | −0.28 | 0.33 | −0.86 | 0.394 | Location | 0.70 | |
| G_Fi | −0.62 | 0.33 | −1.87 | 0.065 * | Residual | 0.93 | |
| G_Fr | −0.12 | 0.33 | −0.37 | 0.715 | |||
| U_Fg | −0.68 | 0.41 | −1.65 | 0.102 | |||
| U_Fi | 0.42 | 0.33 | 1.28 | 0.204 | |||
| U_Fr | 0.62 | 0.41 | 1.51 | 0.133 | |||
| U_Sg | −0.09 | 0.41 | −0.21 | 0.831 | |||
| U_Sg_Fi | −0.09 | 0.41 | −0.22 | 0.829 | |||
| Fixed Effects | Random Effects | ||||||
|---|---|---|---|---|---|---|---|
| Year | Predictor a | Estimate | SE | t Value | Pr (>|t|) b | Group | Variance |
| 2015 | Intercept | 2.92 | 0.20 | 14.7 | <0.001 | Frame/Rep | 0.00 |
| G_C | 0.00 | 0.11 | 0.01 | 0.993 | Rep | 0.34 | |
| U_Sg | −0.07 | 0.17 | −0.43 | 0.665 | Location | 0.26 | |
| Residual | 0.79 | ||||||
| 2016 | Intercept | 3.00 | 0.23 | 13.2 | <0.001 | Frame/Rep | 0.00 |
| G_C | 0.10 | 0.14 | 0.70 | 0.485 | Rep | 0.17 | |
| G_Fg | 0.09 | 0.14 | 0.61 | 0.542 | Location | 0.39 | |
| G_Fi | −0.02 | 0.14 | −0.13 | 0.896 | Residual | 0.58 | |
| G_Fr | −0.07 | 0.14 | −0.47 | 0.637 | |||
| U_Fg | 0.43 | 0.18 | 2.35 | 0.020 | |||
| U_Fi | −0.07 | 0.14 | −0.50 | 0.616 | |||
| U_Fr | 0.14 | 0.18 | 0.79 | 0.432 | |||
| U_Sg | 0.25 | 0.18 | 1.34 | 0.180 | |||
| U_Sg_Fi | 0.23 | 0.18 | 1.24 | 0.216 | |||
| 2017 | Intercept | 2.94 | 0.14 | 20.4 | <0.001 | Frame/Rep | 0.00 |
| G_C | 0.58 | 0.12 | 5.03 | <0.001 | Rep | 0.10 | |
| G_Fg | 0.63 | 0.12 | 5.48 | <0.001 | Location | 0.23 | |
| G_Fi | 0.57 | 0.12 | 4.95 | <0.001 | Residual | 0.46 | |
| G_Fr | 0.62 | 0.12 | 5.34 | <0.001 | |||
| U_Fg | 0.48 | 0.14 | 3.35 | <0.001 | |||
| U_Fi | 0.45 | 0.12 | 3.95 | <0.001 | |||
| U_Fr | 0.41 | 0.14 | 2.88 | <0.001 | |||
| U_Sg | 0.26 | 0.14 | 1.80 | 0.073 * | |||
| U_Sg_Fi | 0.48 | 0.14 | 3.34 | <0.001 | |||
| Fixed Effects | Random Effects | ||||||
|---|---|---|---|---|---|---|---|
| Year | Parameter a | Estimate | SE | t Value | Pr (>|t|) b | Group | Variance |
| 2015 | Intercept | 2.18 | 0.30 | 7.17 | 0.002 | Frame/Rep | 0.00 |
| G_C | 0.35 | 0.12 | 2.86 | 0.005 | Rep | 0.33 | |
| U_Sg | −0.18 | 0.19 | −0.98 | 0.330 | Location | 0.53 | |
| Residual | 0.88 | ||||||
| 2016 | Intercept | 2.29 | 0.38 | 6.10 | 0.004 | Frame/Rep | 0.00 |
| G_C | 0.47 | 0.19 | 2.51 | 0.013 | Rep | 0.28 | |
| G_Fg | 0.47 | 0.19 | 2.52 | 0.012 | Location | 0.67 | |
| G_Fi | −0.11 | 0.19 | −0.59 | 0.555 | Residual | 0.74 | |
| G_Fr | 0.08 | 0.19 | 0.40 | 0.688 | |||
| U_Fg | 0.45 | 0.24 | 1.86 | 0.064 * | |||
| U_Fi | −0.23 | 0.19 | −1.23 | 0.222 | |||
| U_Fr | 0.51 | 0.24 | 2.13 | 0.035 | |||
| U_Sg | 0.40 | 0.24 | 1.67 | 0.096 * | |||
| U_Sg_Fi | 0.25 | 0.24 | 1.04 | 0.301 | |||
| 2017 | Intercept | 2.06 | 0.27 | 7.57 | 0.001 | Frame/Rep | 0.00 |
| G_C | 1.05 | 0.17 | 6.19 | <0.001 | Rep | 0.17 | |
| G_Fg | 1.18 | 0.17 | 6.95 | <0.001 | Location | 0.47 | |
| G_Fi | 0.65 | 0.17 | 3.83 | 0.002 | Residual | 0.68 | |
| G_Fr | 0.96 | 0.17 | 5.65 | <0.001 | |||
| U_Fg | 0.36 | 0.21 | 1.69 | 0.092 * | |||
| U_Fi | 0.35 | 0.17 | 2.05 | 0.042 | |||
| U_Fr | 0.95 | 0.21 | 4.46 | <0.001 | |||
| U_Sg | 0.27 | 0.21 | 1.27 | 0.207 | |||
| U_Sg_Fi | 0.44 | 0.21 | 2.06 | 0.041 | |||
| Fixed Effects | Random Effects | ||||||
|---|---|---|---|---|---|---|---|
| Year | Parameter a | Estimate | SE | t Value | Pr (>|t|) b | Group | Variance |
| 2015 | Intercept | 11.2 | 1.62 | 6.90 | <0.001 | Frame/Rep | 0.00 |
| G_C | −4.18 | 1.29 | −3.25 | 0.001 | Rep | 2.62 | |
| U_Sg | 0.05 | 1.95 | 0.02 | 0.981 | Location | 1.81 | |
| Residual | 9.35 | ||||||
| 2016 | Intercept | 10.7 | 1.69 | 6.32 | <0.001 | Frame/Rep | 0.00 |
| G_C | −4.16 | 1.93 | −2.15 | 0.032 | Rep | 0.88 | |
| G_Fg | −4.37 | 1.93 | −2.26 | 0.025 | Location | 1.91 | |
| G_Fi | −1.65 | 1.93 | −0.85 | 0.395 | Residual | 7.70 | |
| G_Fr | −3.12 | 1.93 | −1.61 | 0.108 | |||
| U_Fg | 1.39 | 2.38 | 0.59 | 0.559 | |||
| U_Fi | 1.31 | 1.93 | 0.68 | 0.496 | |||
| U_Fr | −2.92 | 2.38 | −1.23 | 0.220 | |||
| U_Sg | 0.58 | 2.38 | 0.24 | 0.808 | |||
| U_Sg_Fi | 1.14 | 2.38 | 0.48 | 0.632 | |||
| 2017 | Intercept | 10.4 | 2.26 | 4.61 | <0.001 | Frame/Rep | 0.00 |
| G_C | 1.31 | 2.45 | 0.54 | 0.593 | Rep | 2.47 | |
| G_Fg | 0.25 | 2.45 | 0.10 | 0.920 | Location | 2.32 | |
| G_Fi | 5.14 | 2.45 | 2.10 | 0.037 | Residual | 9.76 | |
| G_Fr | 2.03 | 2.45 | 0.83 | 0.408 | |||
| U_Fg | 7.47 | 3.06 | 2.44 | 0.015 | |||
| U_Fi | 7.59 | 2.44 | 3.11 | 0.002 | |||
| U_Fr | −1.0 | 3.06 | −0.33 | 0.745 | |||
| U_Sg | 4.16 | 3.06 | 1.36 | 0.176 | |||
| U_Sg_Fi | 8.81 | 3.06 | 2.88 | 0.004 | |||
| Year | DF | Sum of Squares | Mean Squares | F Model | R2 | Pr (>F) | NMDS Stress | |
|---|---|---|---|---|---|---|---|---|
| 2015 | Treatment | 2 | 1.35 | 0.67 | 5.6 | 0.04 | 1 | 0.24 |
| Residuals | 253 | 30.7 | 0.12 | 0.96 | ||||
| Total | 255 | 32.1 | 1.00 | |||||
| 2016 | Treatment | 9 | 3.13 | 0.35 | 2.27 | 0.08 | <0.001 | 0.27 |
| Residuals | 246 | 37.8 | 0.15 | 0.92 | ||||
| Total | 255 | 40.9 | 1.00 | |||||
| 2017 | Treatment | 9 | 3.64 | 0.37 | 2.56 | 0.09 | <0.001 | 0.27 |
| Residuals | 246 | 35.9 | 0.15 | 0.91 | ||||
| Total | 255 | 39.2 | 1.00 |
© 2019 by the authors. Licensee MDPI, Basel, Switzerland. This article is an open access article distributed under the terms and conditions of the Creative Commons Attribution (CC BY) license (http://creativecommons.org/licenses/by/4.0/).
Share and Cite
Lehnhoff, E.A.; Rew, L.J.; Mangold, J.M.; Seipel, T.; Ragen, D. Integrated Management of Cheatgrass (Bromus tectorum) with Sheep Grazing and Herbicide. Agronomy 2019, 9, 315. https://doi.org/10.3390/agronomy9060315
Lehnhoff EA, Rew LJ, Mangold JM, Seipel T, Ragen D. Integrated Management of Cheatgrass (Bromus tectorum) with Sheep Grazing and Herbicide. Agronomy. 2019; 9(6):315. https://doi.org/10.3390/agronomy9060315
Chicago/Turabian StyleLehnhoff, Erik A., Lisa J. Rew, Jane M. Mangold, Tim Seipel, and Devon Ragen. 2019. "Integrated Management of Cheatgrass (Bromus tectorum) with Sheep Grazing and Herbicide" Agronomy 9, no. 6: 315. https://doi.org/10.3390/agronomy9060315
APA StyleLehnhoff, E. A., Rew, L. J., Mangold, J. M., Seipel, T., & Ragen, D. (2019). Integrated Management of Cheatgrass (Bromus tectorum) with Sheep Grazing and Herbicide. Agronomy, 9(6), 315. https://doi.org/10.3390/agronomy9060315